Article

Is the Time-Domain Reflectometry (TDR) Technique Suitable for Moisture Content Measurement in Low-Porosity Building Materials?

by
Teresa Stingl Freitas
1,*,
Ana Sofia Guimarães
1,
Staf Roels
2,
Vasco Peixoto de Freitas
1 and
Andrea Cataldo
3
1
Construct-LFC, Faculty of Engineering, University of Porto, R. Dr. Roberto Frias, 4200-465 Porto, Portugal
2
KU Leuven, Department of Civil Engineering, Building Physics Section, Kasteelpark Arenberg 40 Bus 2447, 3001 Haverlee, Belgium
3
Department of Innovation Engineering, University of Salento, Via Monteroni, 73100 Lecce, Italy
*
Author to whom correspondence should be addressed.
Sustainability 2020, 12(19), 7855; https://doi.org/10.3390/su12197855
Submission received: 31 August 2020 / Revised: 17 September 2020 / Accepted: 19 September 2020 / Published: 23 September 2020
(This article belongs to the Special Issue IEIE Buildings (Integration of Energy and Indoor Environment))

Abstract

:
Measuring moisture content in building materials is essential both for professional practice and for research. However, this is a very complex task, especially when long-term minor destructive measurements are desired. The time-domain reflectometry (TDR) technique is commonly used for soil moisture measurements, but its application in construction materials is considered a relatively new method, particularly for low-porosity building materials. The major obstacles to its current use in construction materials are (1) the difficulty of ensuring good contact between the TDR probe and the material, and (2) the lack of appropriate conversion functions between the measured relative permittivity and the moisture content of building materials. This paper intends to contribute to overcoming these difficulties by explaining in detail all the required steps to monitor moisture content in real-scale limestone walls. For that, a device is presented to guarantee the correct installation of the TDR probes on the walls, and a calibration procedure through the gravimetric method is proposed to avoid the use of an unsuitable calibration function developed for soil moisture measurements. In addition, the importance of the individual probe calibration is discussed, as well as TDR advantages and disadvantages for construction materials. The results obtained so far reveal that the TDR technique is suitable to detect moisture content variations in limestone, which is a low-porosity building material.

1. Introduction

The presence of high moisture content in building structures can lead to serious damage and needs to be avoided. Therefore, measuring moisture content in building materials is extremely important for the correct diagnosis of buildings’ pathologies, for the adoption of appropriate intervention measures, and for the efficiency evaluation of the treatment solutions applied. Despite the wide variety of techniques available for moisture content determination, performing continuous measurements of moisture content over time, in a minor destructive way, is still a great challenge. Indeed, most of the current methods require material sampling, and as a consequence successive measurements cannot be repeated at the same point, not to mention that the operation of sampling can change the real moisture content of the element under study. Other very common alternatives are methods based on the measurement of surface moisture content. However, these non-destructive methods only give partial information of the moisture content in the study element, taking into account that the water content near the surfaces is strongly influenced by the evaporation conditions [1,2]. As a matter of fact, many researchers end up using more pragmatic approaches to indirectly monitor the moisture content. One popular example is the use of relative humidity sensors, although they are not very suitable when it is intended to monitor high moisture content values.
Overall, performing accurate measurements of moisture content in building materials is a complex subject, which is still the focus of ongoing research. In this work, the time-domain reflectometry (TDR) technique is presented as a solution to continuously monitor the moisture content in construction materials in-depth and in a minor destructive way. The application of the TDR technique in engineering and natural sciences has a relatively long history. It is a recognized technique in cable testing, widely used to measure dielectric properties of liquids mediums and it is also considered a well-established technique for moisture content measurement in soils. However, despite the advanced and well-founded knowledge of the TDR technique as a measurement technology, its application for moisture content measurement in construction materials is considered a relatively new method [3].

2. Time Domain Reflectometry (TDR)

2.1. Basic Principles

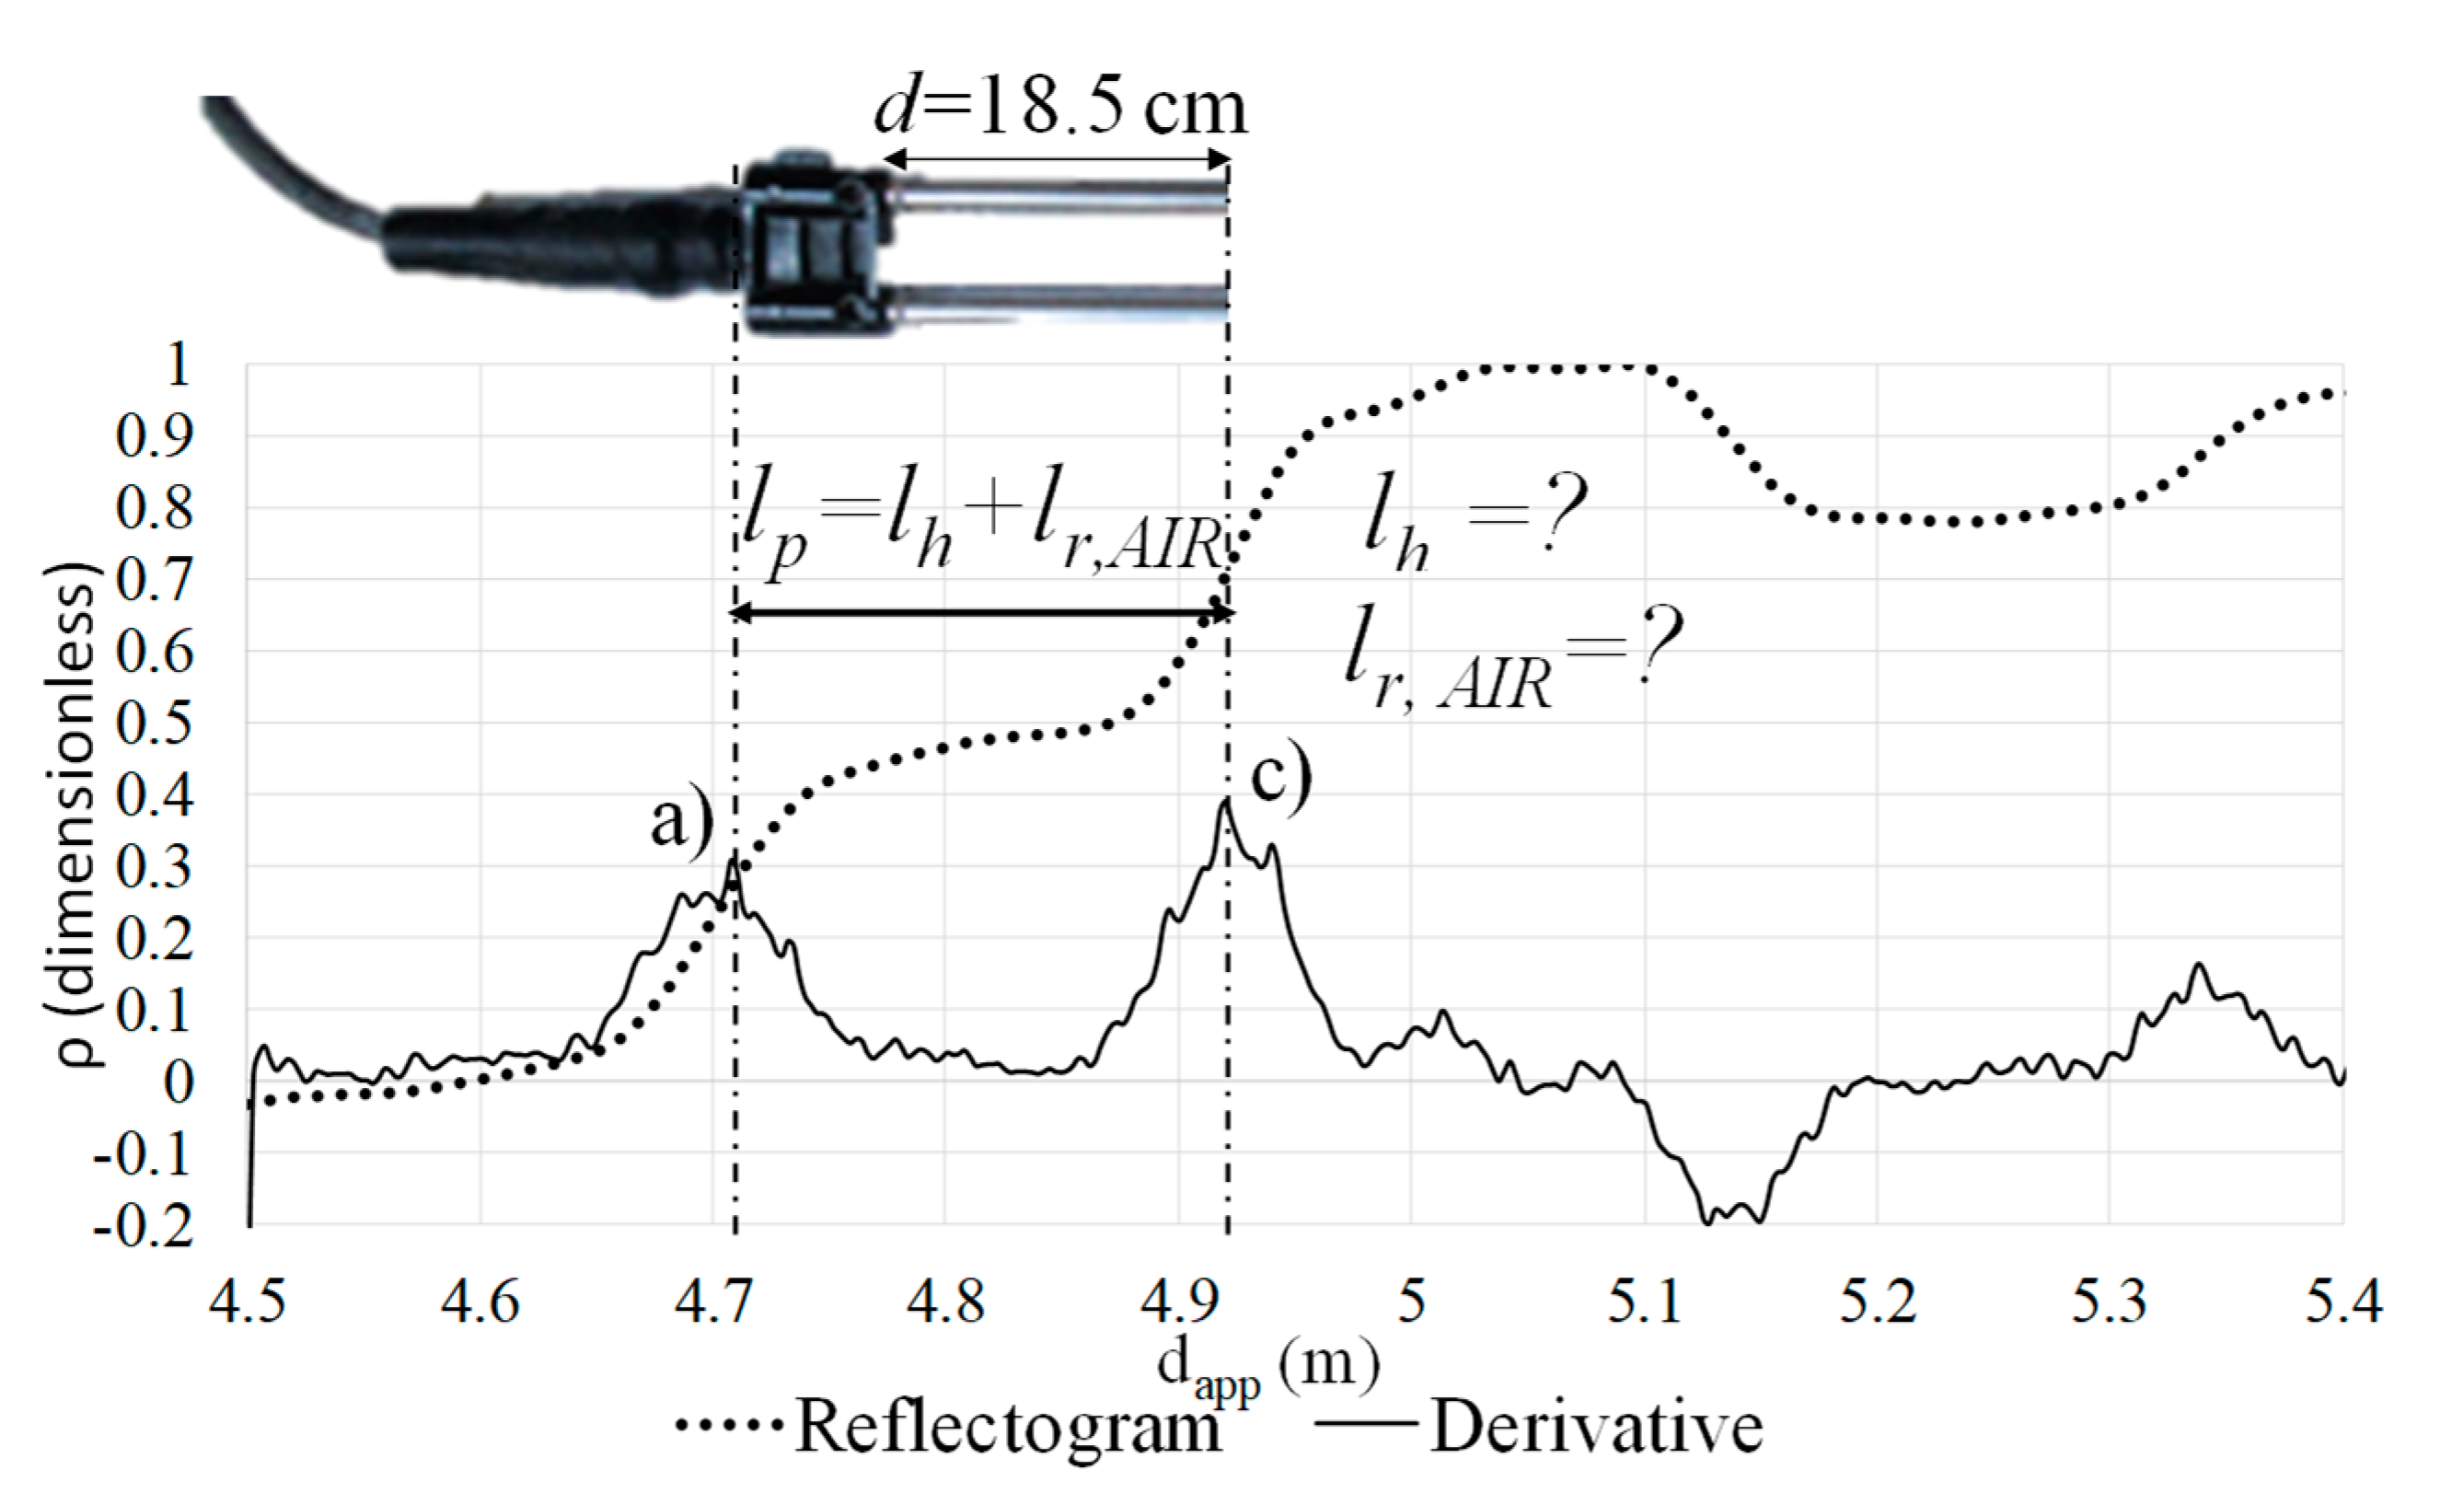
The principle of any TDR measurement consists of launching an electromagnetic signal along the probe inserted into the material under test. The reflected signal carries information on the dielectric characteristics of the material in which the probe is inserted. Indeed, any impedance variation, found by the TDR signal when it propagates along the probe, causes the partial reflection of the propagating signal. The reflected signal, acquired by the TDR unit, is then analysed through specific data-processing software, which provides a graphic called reflectogram. The reflectogram displays the reflection coefficient, ρ (ratio between the amplitude of the reflected signal and the amplitude of the generated signal), as a function of the apparent distance, dapp. The quantity dapp is not a real physical distance, and its value is influenced by the travel time of the electromagnetic signal in the study medium. Figure 1 shows a TDR reflectogram obtained for a dry limestone with an 18.5-cm long two-rod probe.
The first derivative of the TDR reflectogram is used to easily identify impedance variations and, in this way, represents a practical method for interface individuation. In the results obtained for the dry limestone, a first maximum peak corresponding to the connection between the coaxial cable and the probe head can be clearly seen (Figure 1, point a)). Immediately after, a second minimum peak is detected corresponding to the interface between the probe-head end and the surface of the limestone under test (Figure 1, point b)). Finally, a last maximum peak is visible corresponding to the end of the probe (Figure 1, point c)). As a result, two electric lengths can be identified: lh, the apparent length introduced by the probe-head section, and lr,MUT, the apparent length of the probe that is actually in contact with the material under test (MUT)—the rods.
With these results, the apparent relative dielectric permittivity, εapp, of the material under test at a certain instant of time can be obtained through the following equation [4]:
ε a p p = ( l r , M U T d ) 2
where d is the physical length of the probe used.

2.2. Individual Probe Calibration

For high-accuracy measurements, the TDR probes require individual calibration, sometimes called “probe-length calibration”. The main reason is the fact that in Equation (1) the physical length of the probe, d, measured with the tape may be slightly different from the “probe electrical length” when it is placed in air, lr,AIR (εair ≈ 1). This is mostly due to the presence of the probe head, taking into account that a small portion of the rods is contained inside the probe head. This detail needs to be properly compensated, otherwise, it will lead to the presence of an “offset error”. The apparent length of the rods in air, lr,AIR, cannot be directly read from the reflectogram because the interface between the probe-head end and the surface of the air (point b) in Figure 1) is very difficult to identify in the reflectogram obtained when the probe is placed in air (Figure 2).
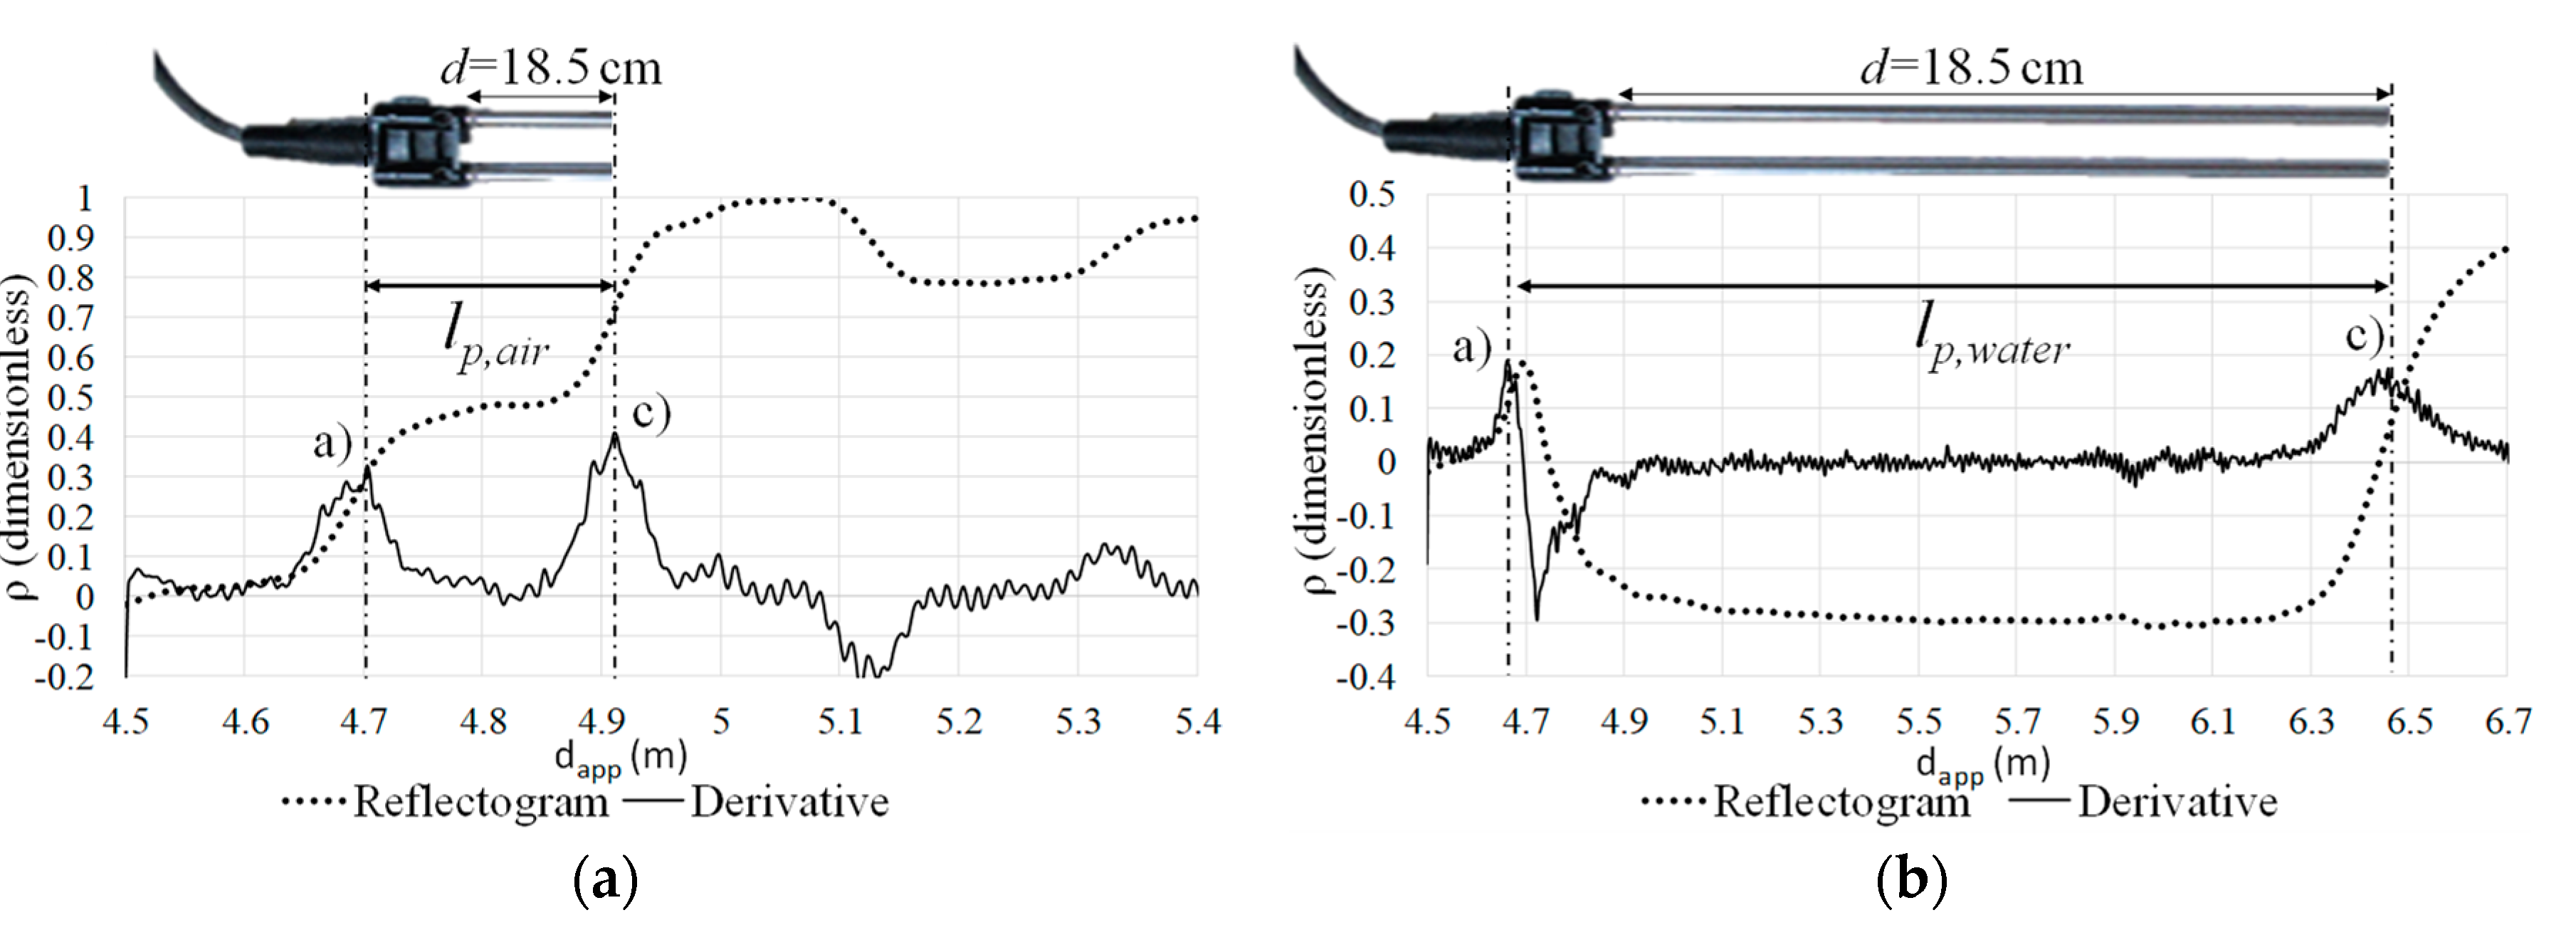
For this reason, the probe-length calibration consisted of carrying out ten repeated measurements with the probe inserted into materials with well-known dielectric permittivity. In this way, it is possible to determine the two unknown parameters for every probe: lh and lr,AIR. This procedure needs to be repeated only once for each probe. Usually, the mediums chosen for this process are either water and air or water and benzene. Either way, the permittivities of both materials should differ as much as possible to achieve the highest accuracy in the parameter determination. In our case, the measurements were done with the probes placed in air and distilled water. As an example, a picture of a TDR probe during the measurements made in air and distilled water is presented in Figure 3a,b, respectively. In both cases, the probe must be fixed to ensure the same conditions throughout the ten consecutive measurements. In addition, the TDR probe must not be in contact with any surface, such as the walls of the water container. For the measurements in water, the water level must also be taken into account. The probe must be placed in water in such a way that the entire rods, up to the probe head, stay submerged (Figure 3c).
In contrast to the dielectric permittivity of air (εair), which is approximately equal to one regardless of the air temperature, the dielectric permittivity of water (εwater) changes according to the water temperature. In the literature, there are several functions available that express the dielectric permittivity of water as a function of the water temperature [5,6,7,8]. Despite the variety of studies, it is of general consent that the dielectric permittivity of water at 18 °C is approximately equal to 81. In this work, the temperature influence in the dielectric permittivity of water was evaluated through the following equation [9]:
ε w a t e r ( T ) =   78.54 × [ 1 4.5791 × 10 3 × ( T 25 ) + 1.19 × 10 5 × ( T 25 ) 2 2.8 × 10 8 × ( T 25 ) 3 ]
where T is the water temperature in degrees Celsius.
For precise probe calibration, the εwater value considered is important. Indeed, if the ten repeated TDR measurements were done with the probe placed in distilled water at 15 °C the εwater is approximately equal to 82, but if the water temperature is close to 25 °C the εwater is already 78. Consequently, considering the variability of εwater with temperature (εwater(T)) is strongly recommended to avoid mistakes at an early stage that may compromise the future accurate measurements of moisture content with a specific probe. Figure 3d shows in detail the sensor used to monitor the water temperature during the ten repeated TDR measurements made on this medium. It is important to mention that the water temperature sensor cannot touch the TDR probe. Otherwise, it will influence the obtained reflectogram and, therefore, the provided εwater value will be conditioned.
Using Equation (1) and taking into account the equation lp = lh + lr,MUT (Figure 1), the two unknown parameters for each probe can be determined as follows:
{ l p , a i r = l h + ε a i r × l r , A I R l p , w a t e r = l h + ε w a t e r ( T ) × l r , A I R { l h = l r , A I R =
where lp,air and lp,water are the average of ten known quantities read from the respective reflectograms (see Figure 4 and Table 1 as an example).
Therefore, for high-accuracy measurements, the apparent relative dielectric permittivity, εapp, of the material under test should be determined according to the following equation:
ε a p p = ( l r , M U T l r , A I R ) 2
instead of using Equation (1).

2.3. Suitability to Detect Moisture Content Variations

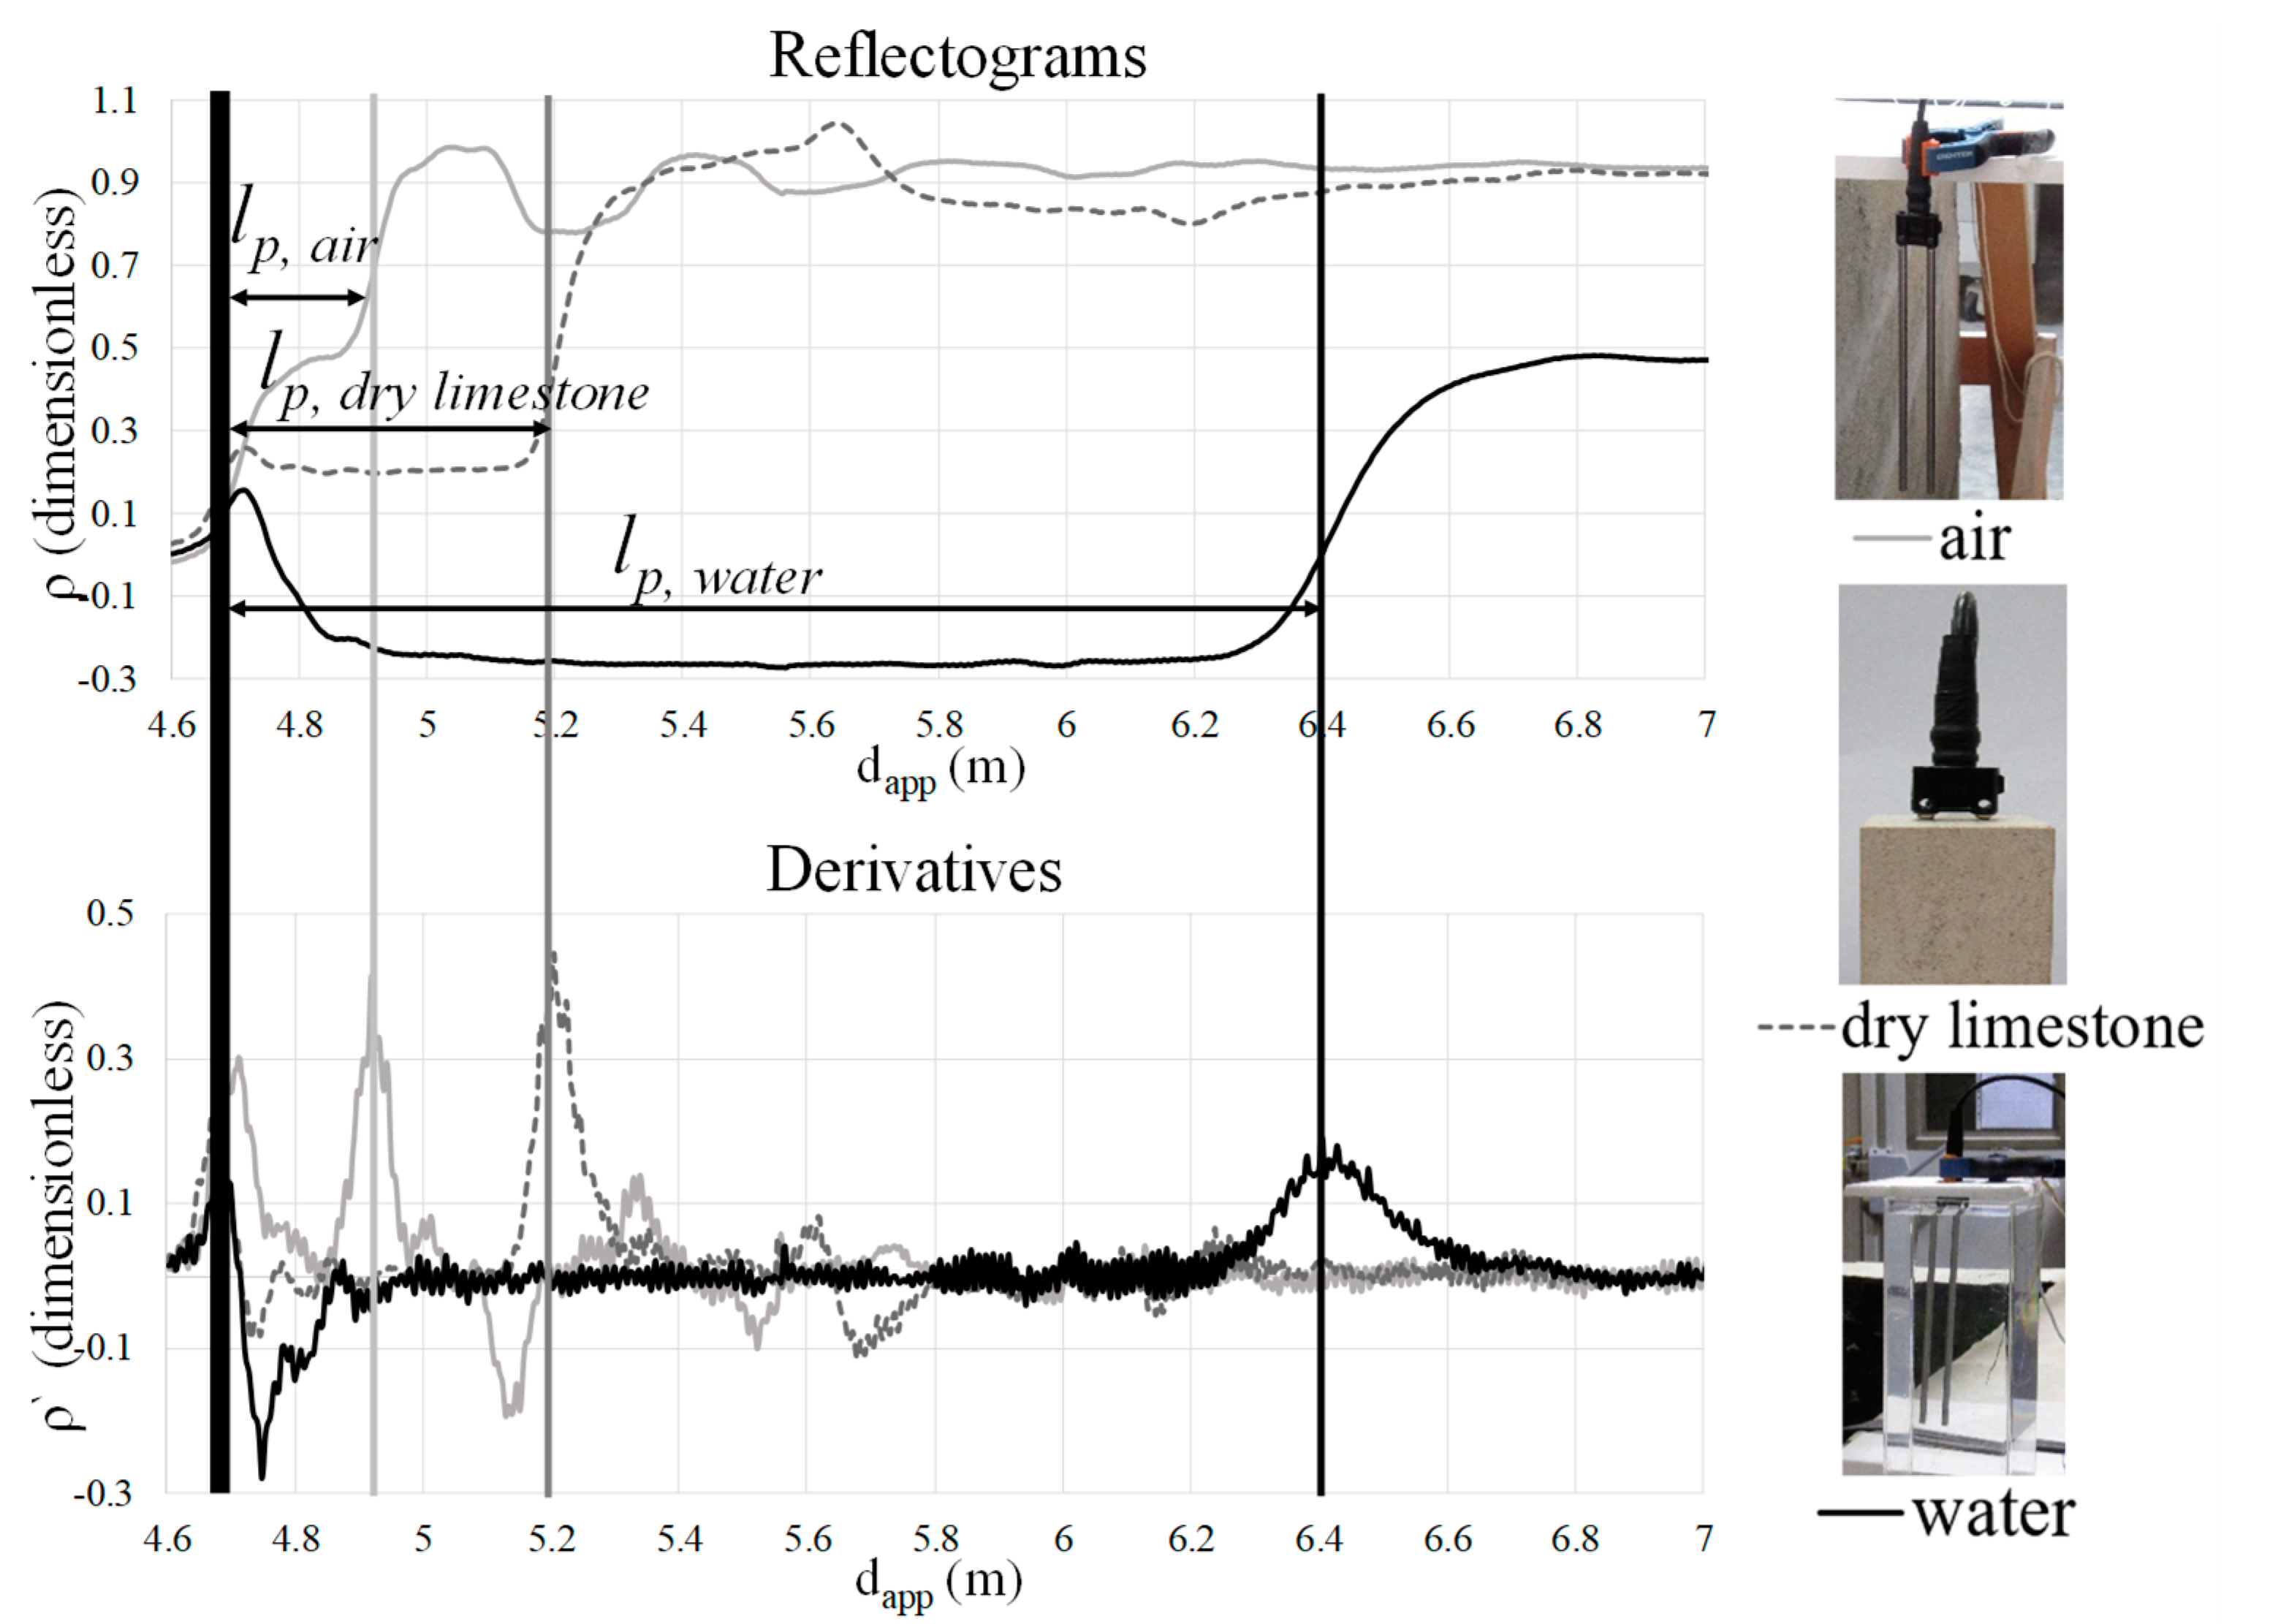
The apparent relative dielectric permittivity measurements, εapp, can be used to infer the moisture content in building materials because the travel time of the electromagnetic signal is influenced by the presence of water. Indeed, as the relative dielectric permittivity of water (εwater ≈ 78–82) is considerably higher than the relative permittivity of many dry building materials (εdry building materials ≈ 2–9), the presence of water leads to an increase of the overall dielectric permittivity of the material under test [10,11]. Figure 5 shows the reflectograms obtained in three extreme scenarios. As expected, the measurements support and are in agreement with the hypothesis mentioned above. The total apparent length of the probe obtained in air, lp,AIR, is smaller than the one obtained in the dry limestone, lp, DRY LIMESTONE, which in turn is smaller than the one obtained in water, lp,WATER. In addition, it is also possible to observe that the reflection coefficient, ρ , decreases with the water presence in the study medium ( ρ air >   ρ dry limestone >   ρ water).
Therefore, in TDR measurements performed in building materials with increasing moisture content, the apparent length of the probes is expected to be progressively longer, and consequently higher values of εapp should be obtained. The difference between the εapp value collected when the material is completely dry or saturated will depend on the material porosity. In highly porous building materials this range will be bigger. Table 2 contains the relative permittivity values measured for different geological materials.
These results are very interesting because they clearly reveal a big difference between the εapp value measured in the dry and saturated state for granular materials, as happens with sand, clays, and soils. However, for dense solid materials (like sandstone, granite, and limestone) this difference is lower. This situation can be a concern because the TDR technique may be poorly sensitive to detect moisture content variations in low-porosity building materials. Indeed, many of the studies found about the use of the TDR technique to measure moisture content refer to highly porous building materials, such as gypsum [14], autoclaved aerated concrete [15], brick [16], calcium silicate [11], and volcanic tuff [17] among others. For low-porosity construction materials, the difficulties and uncertainties are bigger.

2.4. Approaches to Determine the Moisture Content from the Measured Apparent Relative Permittivity

There are three basic approaches to calculate the moisture content from the measured apparent relative permittivity:
  • Empirical conversion functions developed for soil moisture measurements. The most common and popular conversion function is the third order polynomial relation proposed by Topp et al. in 1980, which is expressed by the following equation:
w = 5.3 × 10 2 + 2.92 × 10 2 ε a p p 5.5 × 10 4 ε a p p 2 + 4.3 × 10 6 ε a p p 3
where w is the moisture content in the porous body (m3/m3). A few years later, in 1996, Malicki et al. proposed a more generalized function, which takes into account the changes in the bulk density, ρ (kg/m3), of the dry material:
w = ε a p p 0.819 0.168 ρ 0.159 ρ 2 7.18 + 1.18 ρ
The utilization of empirical conversion functions is very easy and therefore many researchers have already tested their applicability to building materials. Unfortunately, the obtained results with both these relations failed completely in the moisture content determination of several materials: gypsum [14], calcium silicate [11], autoclaved aerated concrete, and sandstone [18]. As a result, the exiting calibration functions for soils are mostly considered as not suitable for construction materials.
  • Empirical conversion functions based on dielectric mixing models. The use of dielectric mixing models involves knowing the relative permittivities of the particular constituents that compose the materials, which are typically the solid phase, the liquid phase (water), and the gaseous phase (air), as well as some other parameters that cannot be measured directly but have to be determined by empirical calibration of the model. There is a variety of mixing formulas available to describe the relative permittivity of the whole material from its constituents. In Equation (7) the 4-phase α -model proposed by Dobson et al. is presented as an example.
w = ε e f f α w b w ( ε b w α ε f w α ) ( 1 ψ ) ε s α ψ ε a α ε f w α ε a α
where ε e f f is the measured value of the relative permittivity of the porous medium, w b w the amount of water bound on pore walls (m3/m3), ε b w the relative permittivity of the bound water ( ε b w ≈ 3,1), ε f w the relative permittivity of free water ( ε f w 78–82, depending on the water temperature), ε a the relative permittivity of air ( ε a ≈ 1), ψ the total open porosity, and α is an empirical parameter. In this model, the significant difference between the relative permittivity of free and bound water is taken into account, which is an important step for a more accurate determination of moisture content in building materials using TDR measurements. Indeed, unlike most soils, building materials usually contain a significant amount of hygroscopic moisture, and its inclusion into the conversion formulas represents a better approximation than the empirical conversion functions proposed for soils. Despite the promising advantages of the dielectric mixing models, further tests in a wide range of different building materials are still required to find generalized functions for distinct classes of materials [15].
  • Empirical calibration for the particular material under study using a reference method, such as the gravimetric method. In this case, the relation between the moisture content and the measured apparent relative permittivity is established for the precise material under test. This method is the most reliable until now but also the most time consuming one [3].
In this study, the calibration was done according to this last method. A more detailed description of the procedure followed, as well as some of the results obtained, are presented in Section 3.3 and Section 4. In the near future, and after collecting more results, the goal is to present a new empirical calibration curve for limestone (w(εapp)), which may then be used for further testing and validation of several calibration functions based on dielectric mixing models.

2.5. TDR Advantages and Disadvantages for Moisture Monitoring in Building Materials

Monitoring moisture content in building materials is a complex subject, which is still the focus of ongoing research. Unlike the most common moisture methods, which require material sampling and are only capable to provide spot measurements at a certain instant of time, the TDR technique enables continuous long-term minor destructive monitoring of moisture content in construction materials. Furthermore, many common moisture measurement techniques can only be employed in the laboratory and are not suitable to be used on-site due to the requirements of the equipment involved, as happens with the nuclear magnetic resonance method (NMR) or with the radiation attenuation techniques, such as X-ray, neutron absorption, and γ-ray attenuation method [19]. As a matter of fact, and according to the research work done, the TDR technique has also never been used for walls in situ. The main obstacle, in this case, would not be the equipment but the difficulty of establishing a calibration curve (εapp(w)) when the material is not homogeneous. However, as the TDR technique is capable of monitoring dynamic changes fast and with accuracy (i.e., recording changes rather than static measurements), the need for calibration can be considered less important for some practical applications. For many professionals, the ability to monitor relative changes in the moisture content over time is more than enough to evaluate the efficiency of several design solutions made by civil engineers.
As for the disadvantages of the TDR technique, three relevant features deserve to be highlighted. The first one is the need to carry out individual probe-length calibration before making any moisture measurements to ensure high-accuracy results. This procedure can be done in advance and all at once for every single probe and is independent of the material under study. The second one is the difficulty of getting a suitable relation between the moisture content and the measured relative permittivity for the construction material under test. The empirical conversion functions proposed for soils are mostly not appropriate for building materials and the dielectric mixing formulas are not yet available for general classes of materials. Therefore, the most reliable method, for now, is still the use of conversion functions established for the particular material under test using a reference method. However, this is a very time-consuming task, which constitutes an obstacle to the frequent use of the TDR technique in construction materials. The third and last difficulty is the need to ensure good contact between the TDR probe rods and the material under test. Indeed, any air gap present between the waveguides and the material will compromise the moisture measurements. Drilling regular parallel holes with accuracy, without producing a large air gap, is very difficult, particularly for hard materials. That is why most of the research work about the use of the TDR technique for moisture measurement was done for loose, granular, soft construction materials [11,20,21]. As a matter of fact, many researchers recommend the use of the powder gathered during the drilling to fix the probes into the holes and in this way prevent the appearance of the unwanted air layer [20].

3. TDR Application

The TDR technique was implemented in two limestone walls constructed in the laboratory. The final goal is to use the continuous moisture content measurements provided by the TDR technique to experimentally test the efficiency of a wall-base ventilation channel to speed up drying after a flood. The wall-base ventilation system has already been successfully studied in previous works, where it proved to be efficient to reduce rising damp problems in historic buildings [22,23]. The climate change witnessed during the last decades has generated new and unpredictable threats to this type of buildings, such as floods. Indeed, floods can lead to persistent consequences for the buildings’ performance and irreversible damages to historic heritage, which can be minimized through the development of protective measurements. For that reason, studying the effectiveness of the system to accelerate the drying process after a flood seems to be of great importance. Figure 6 shows several pictures of the experimental set-up developed.
Each wall is composed of five layers of limestone, each 20-cm high, linked by 1-cm thick lime mortar joints. The limestone is a material typically used in the construction of historic buildings in Portugal. Both walls have the same dimensions (2 m × 1.58 m × 0.20 m) and were built inside large tanks in order to simulate a flood. The fans connected to the ventilation channel (to test forced drying) were placed in a higher position through the use of metallic conducts (see picture (d) in Figure 6). The drying phenomenon in the limestone walls will be studied both with and without the ventilation channel to test its efficiency. For that purpose, the TDR technique is very appropriate, since it allows continuous moisture content readings along the drying process in a minor destructive way.

3.1. Equipment

The TDR measurements were performed through a portable reflectometer from Campbell Scientific: TDR200 (Figure 7a) [24]. The TDR200 unit generates a short-time electromagnetic pulse that is applied to the probes inserted into the material under test. One of the advantages of this TDR instrument is that it supports multiplexers, which enable the simultaneous connection of several probes to a single TDR unit. In this work, one eight-channel multiplexer also from Campbell Scientific was used (SDM8X50), which allows the continuous monitoring of moisture content in eight points in the walls (Figure 7b). The probes were specially designed for this research, taking into account the wall thickness, and were fabricated by a spin-off company of the University of Salento—MoniTech. Each probe is made of two 18.5-cm long parallel stainless rods separated by 19 mm with a diameter of 6 mm (Figure 7c).
To analyse the reflected signal, appropriate LabVIEW-based software was used. The direct output of the software is a reflectogram, as was explained in detail in Section 2.1.

3.2. Installation Steps

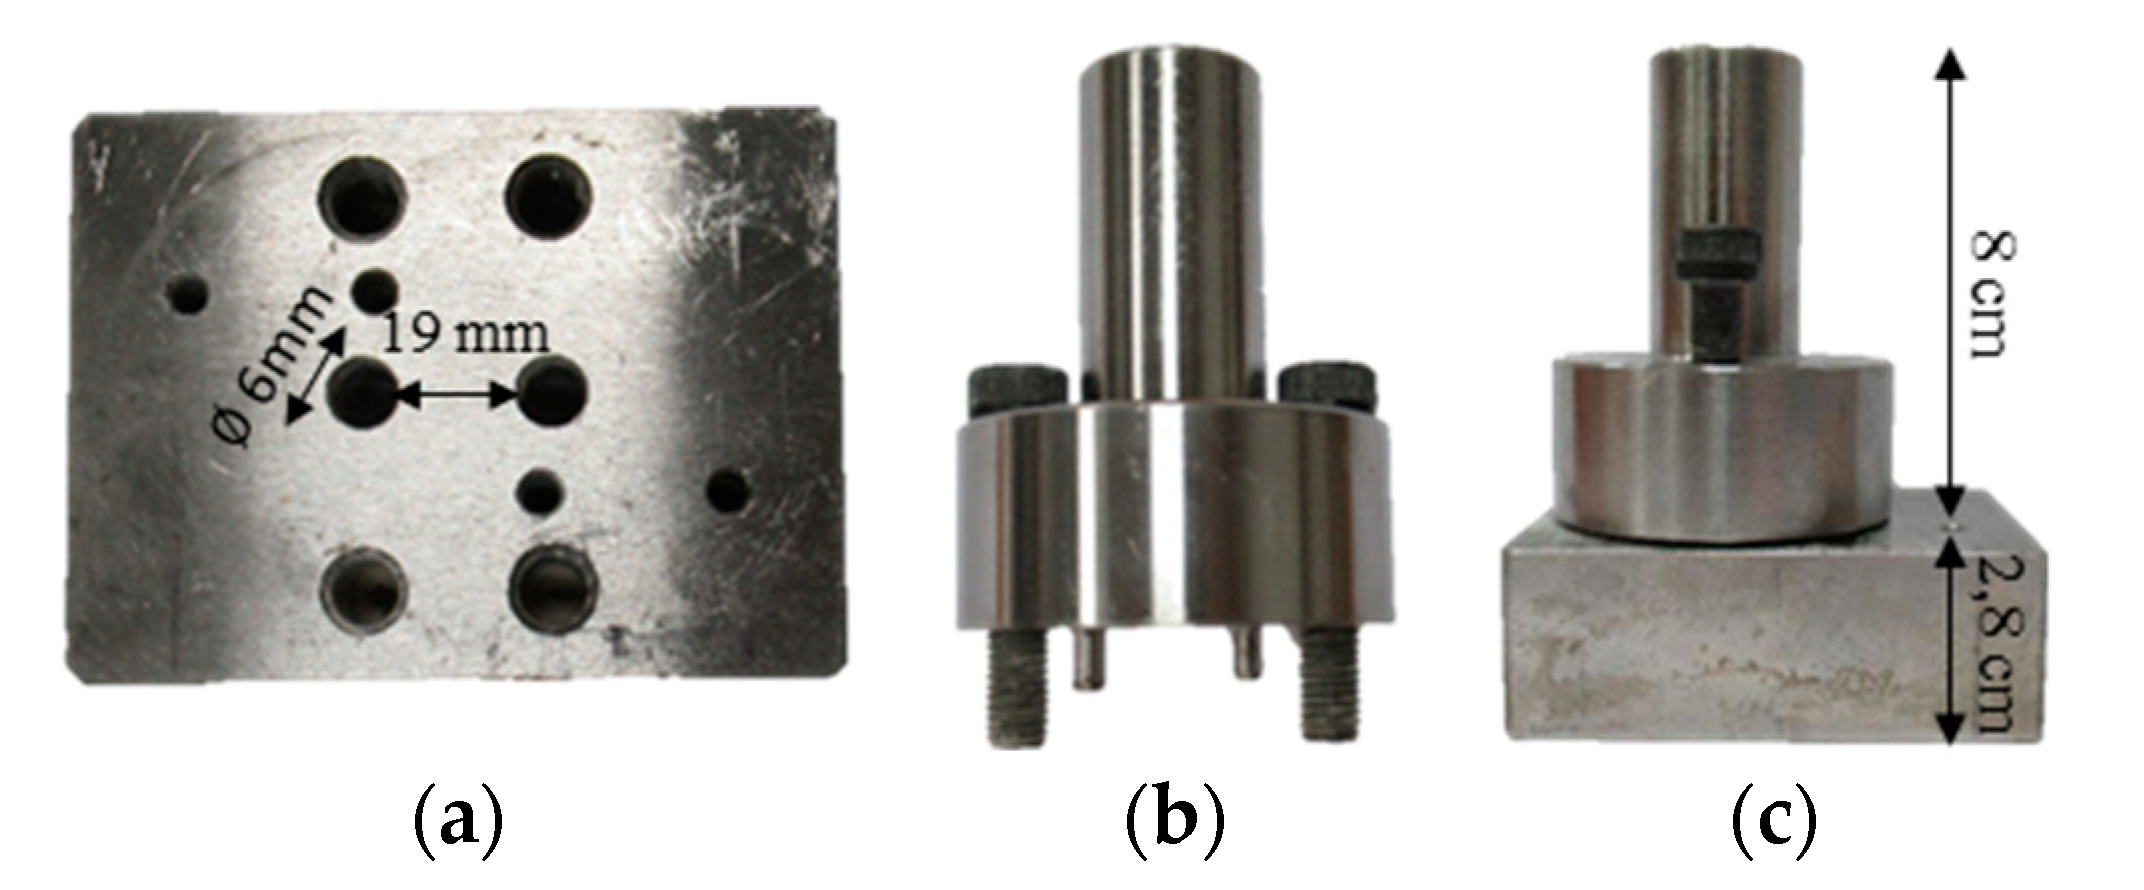
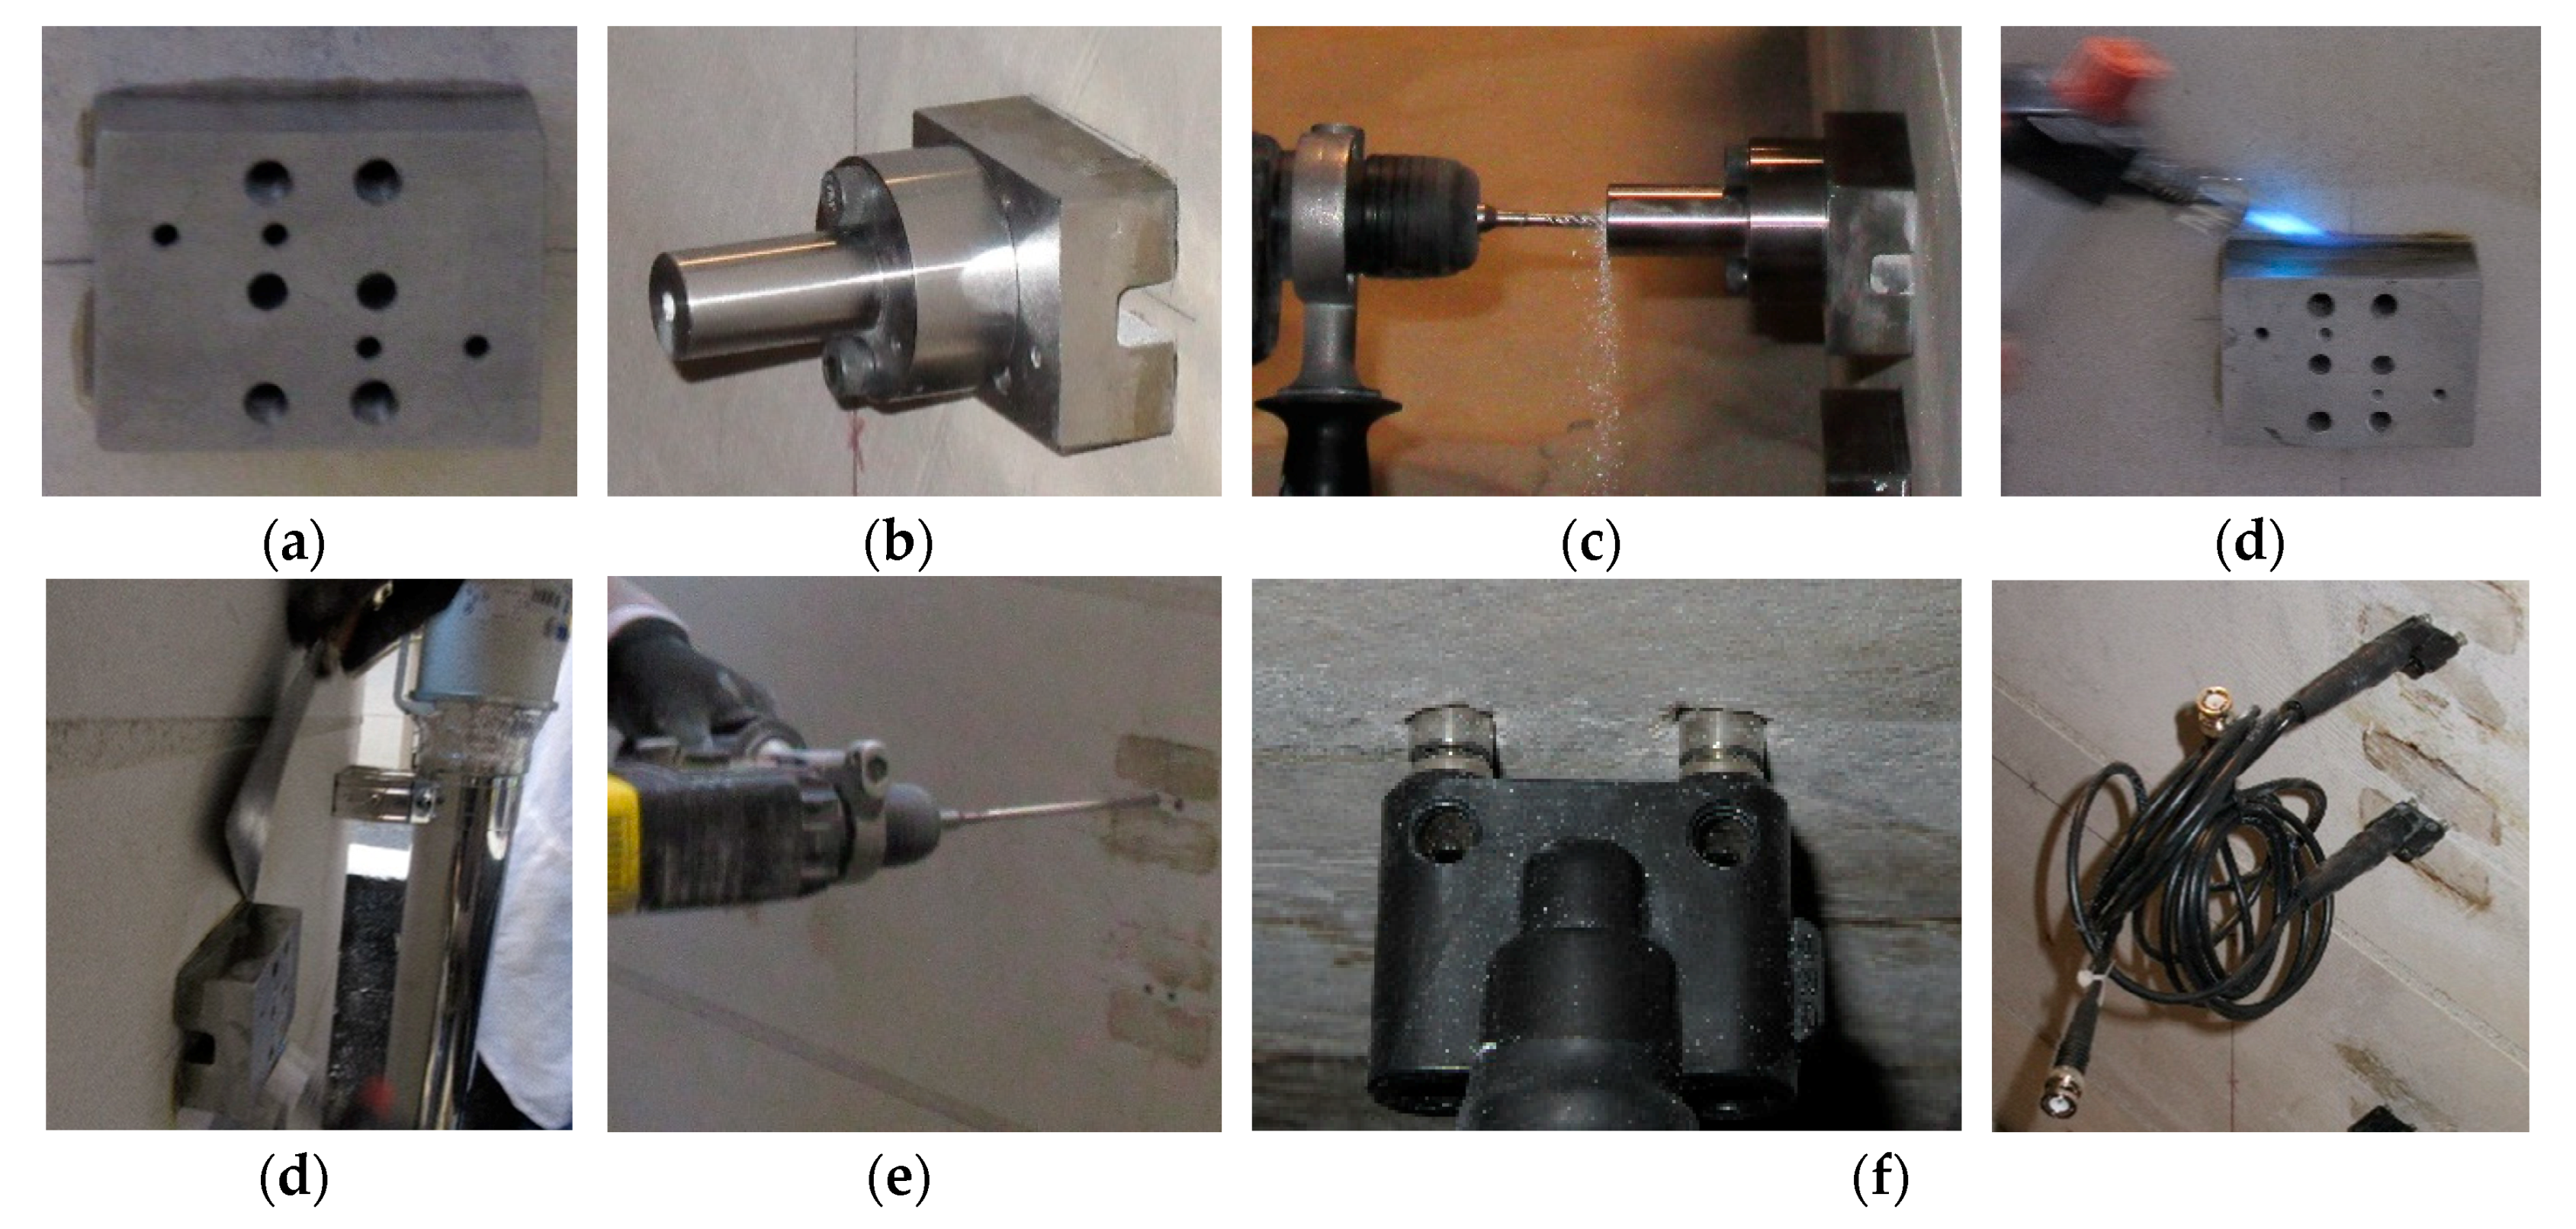
One of the major obstacles pointed out by several authors to the use of the TDR technique in hard materials is the difficulty of ensuring good contact between the TDR rods and the material under test (see Section 2.4). To overcome this difficulty, a steel auxiliary guide was developed (Figure 8). This device was designed for the particular probes used in this work and is composed of two independent pieces. A bottom piece (Figure 8a), where the rods’ diameters and the spacing between them were defined, and a top piece (Figure 8b), 8-cm high, that is fixed to the first one with screws.
To insert the TDR probes into the walls the steel guide was fixed to the surface of the wall during the drilling to ensure parallel and appropriate spaces between the holes. Figure 9 shows all steps followed during the drilling until the probes’ final installation.
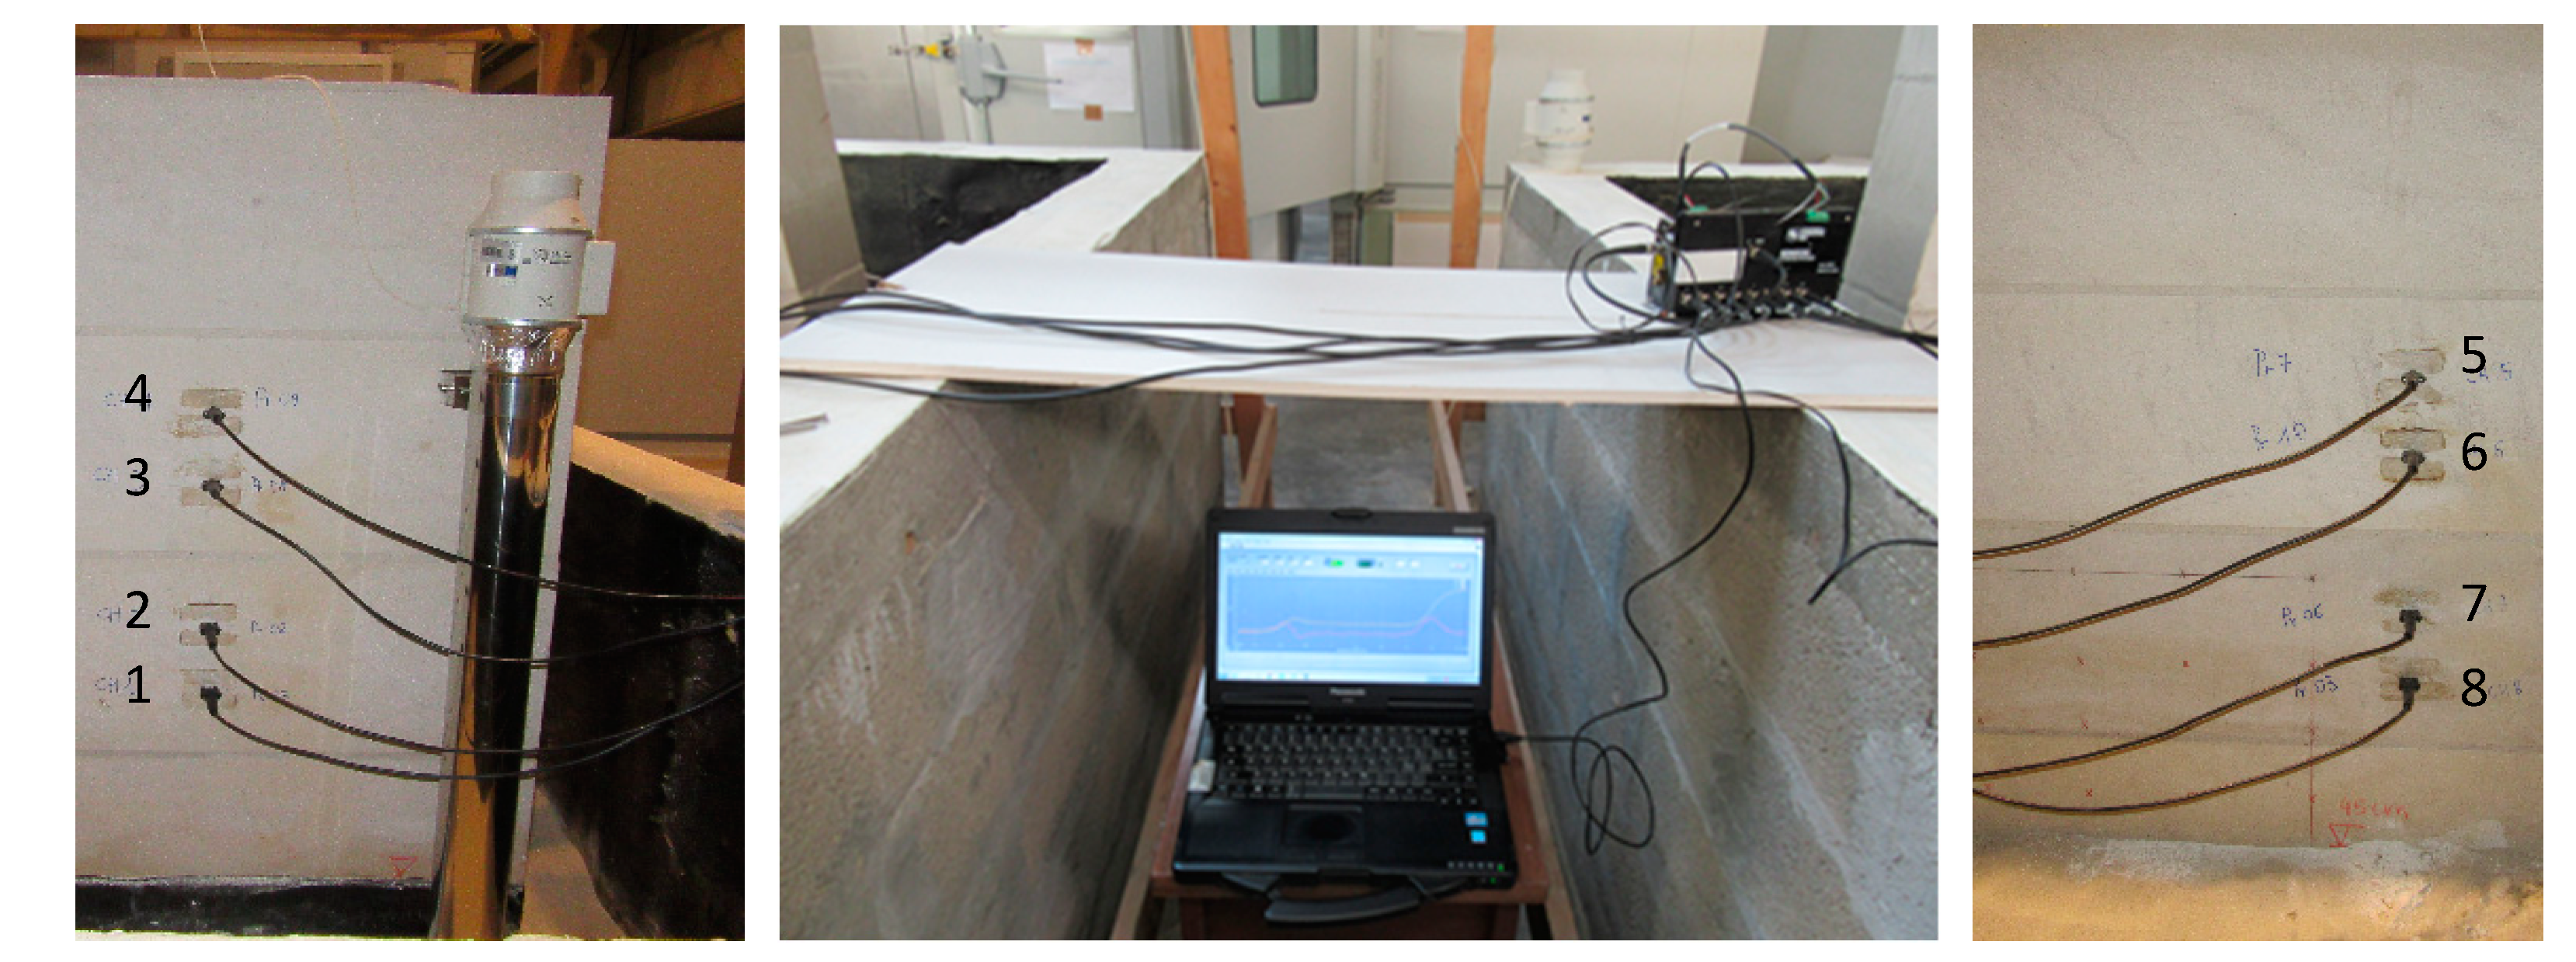
This procedure is time-consuming, particularly for hard materials like limestone, and needs to be done with care because the lack of consistency between the holes bored to accommodate the rods can lead to variations in the moisture content measurements. Figure 10 shows the final experimental set-up.
Each wall was equipped with four two-rod TDR probes placed at different heights for continuous monitoring of the moisture content both with and without the ventilation channel. The preliminary results obtained on the dry walls for each of the eight probes installed are presented in Table 3. As can be observed, the relative permittivity values measured are very close to each other, which reveals that no air layer is present between the rods and the limestone and, therefore, the installation can be considered a success. In addition, it is also important to highlight that the measured εapp values on the dry walls are in agreement with the relative permittivity range presented by other authors for dry limestone (see Table 2).

3.3. Calibration

The relation between the apparent relative dielectric permittivity, εapp, and the moisture content, w, for the limestone was established using the gravimetric method as a reference, taking into account the reasons explained in Section 2.3. For this purpose, a block was cut from the wall, and several small prism-shaped samples of limestone (20 cm × 6 cm × 6 cm) were prepared. The same drilling procedure, previously described for the walls, was also followed for these samples (Figure 11). The prepared limestone samples had intentionally the same height as the wall thickness (20 cm) to ensure that the measurements on the samples were made under the same conditions as the ones on the walls.
Figure 12 shows one picture for each of the six steps defined for the calibration procedure.
First, the sample was immersed in water for a certain predefined period of time (Figure 12a). After this period, the sample was taken out of the water, and their surfaces were dried with a damp sponge to remove the excess of water before weighing (Figure 12b). Immediately after, the sample was water- and water-vapour-insulated at all sides, to ensure that no water evaporated from the sample. In the measurements already made, the sample was first isolated with a plastic film (typically used in the kitchens) and then with aluminium tape (Figure 12c,d, respectively). The plastic film was used to ensure that the aluminium tape did not damage the sample and so the process could be repeated for other moisture content values. After waiting for several days, to ensure the redistribution of the moisture content in the sample, it was weighed again to guarantee that no water had evaporated (Figure 12e) and a TDR measurement could be finally made (Figure 12f). The TDR measurements were repeated until the measured apparent relative permittivity reached a constant value.
All these steps should be repeated for different immersion times in water or, in other words, for different moisture content values to obtain a calibration curve, w(εapp), for limestone.

4. Results and Discussion

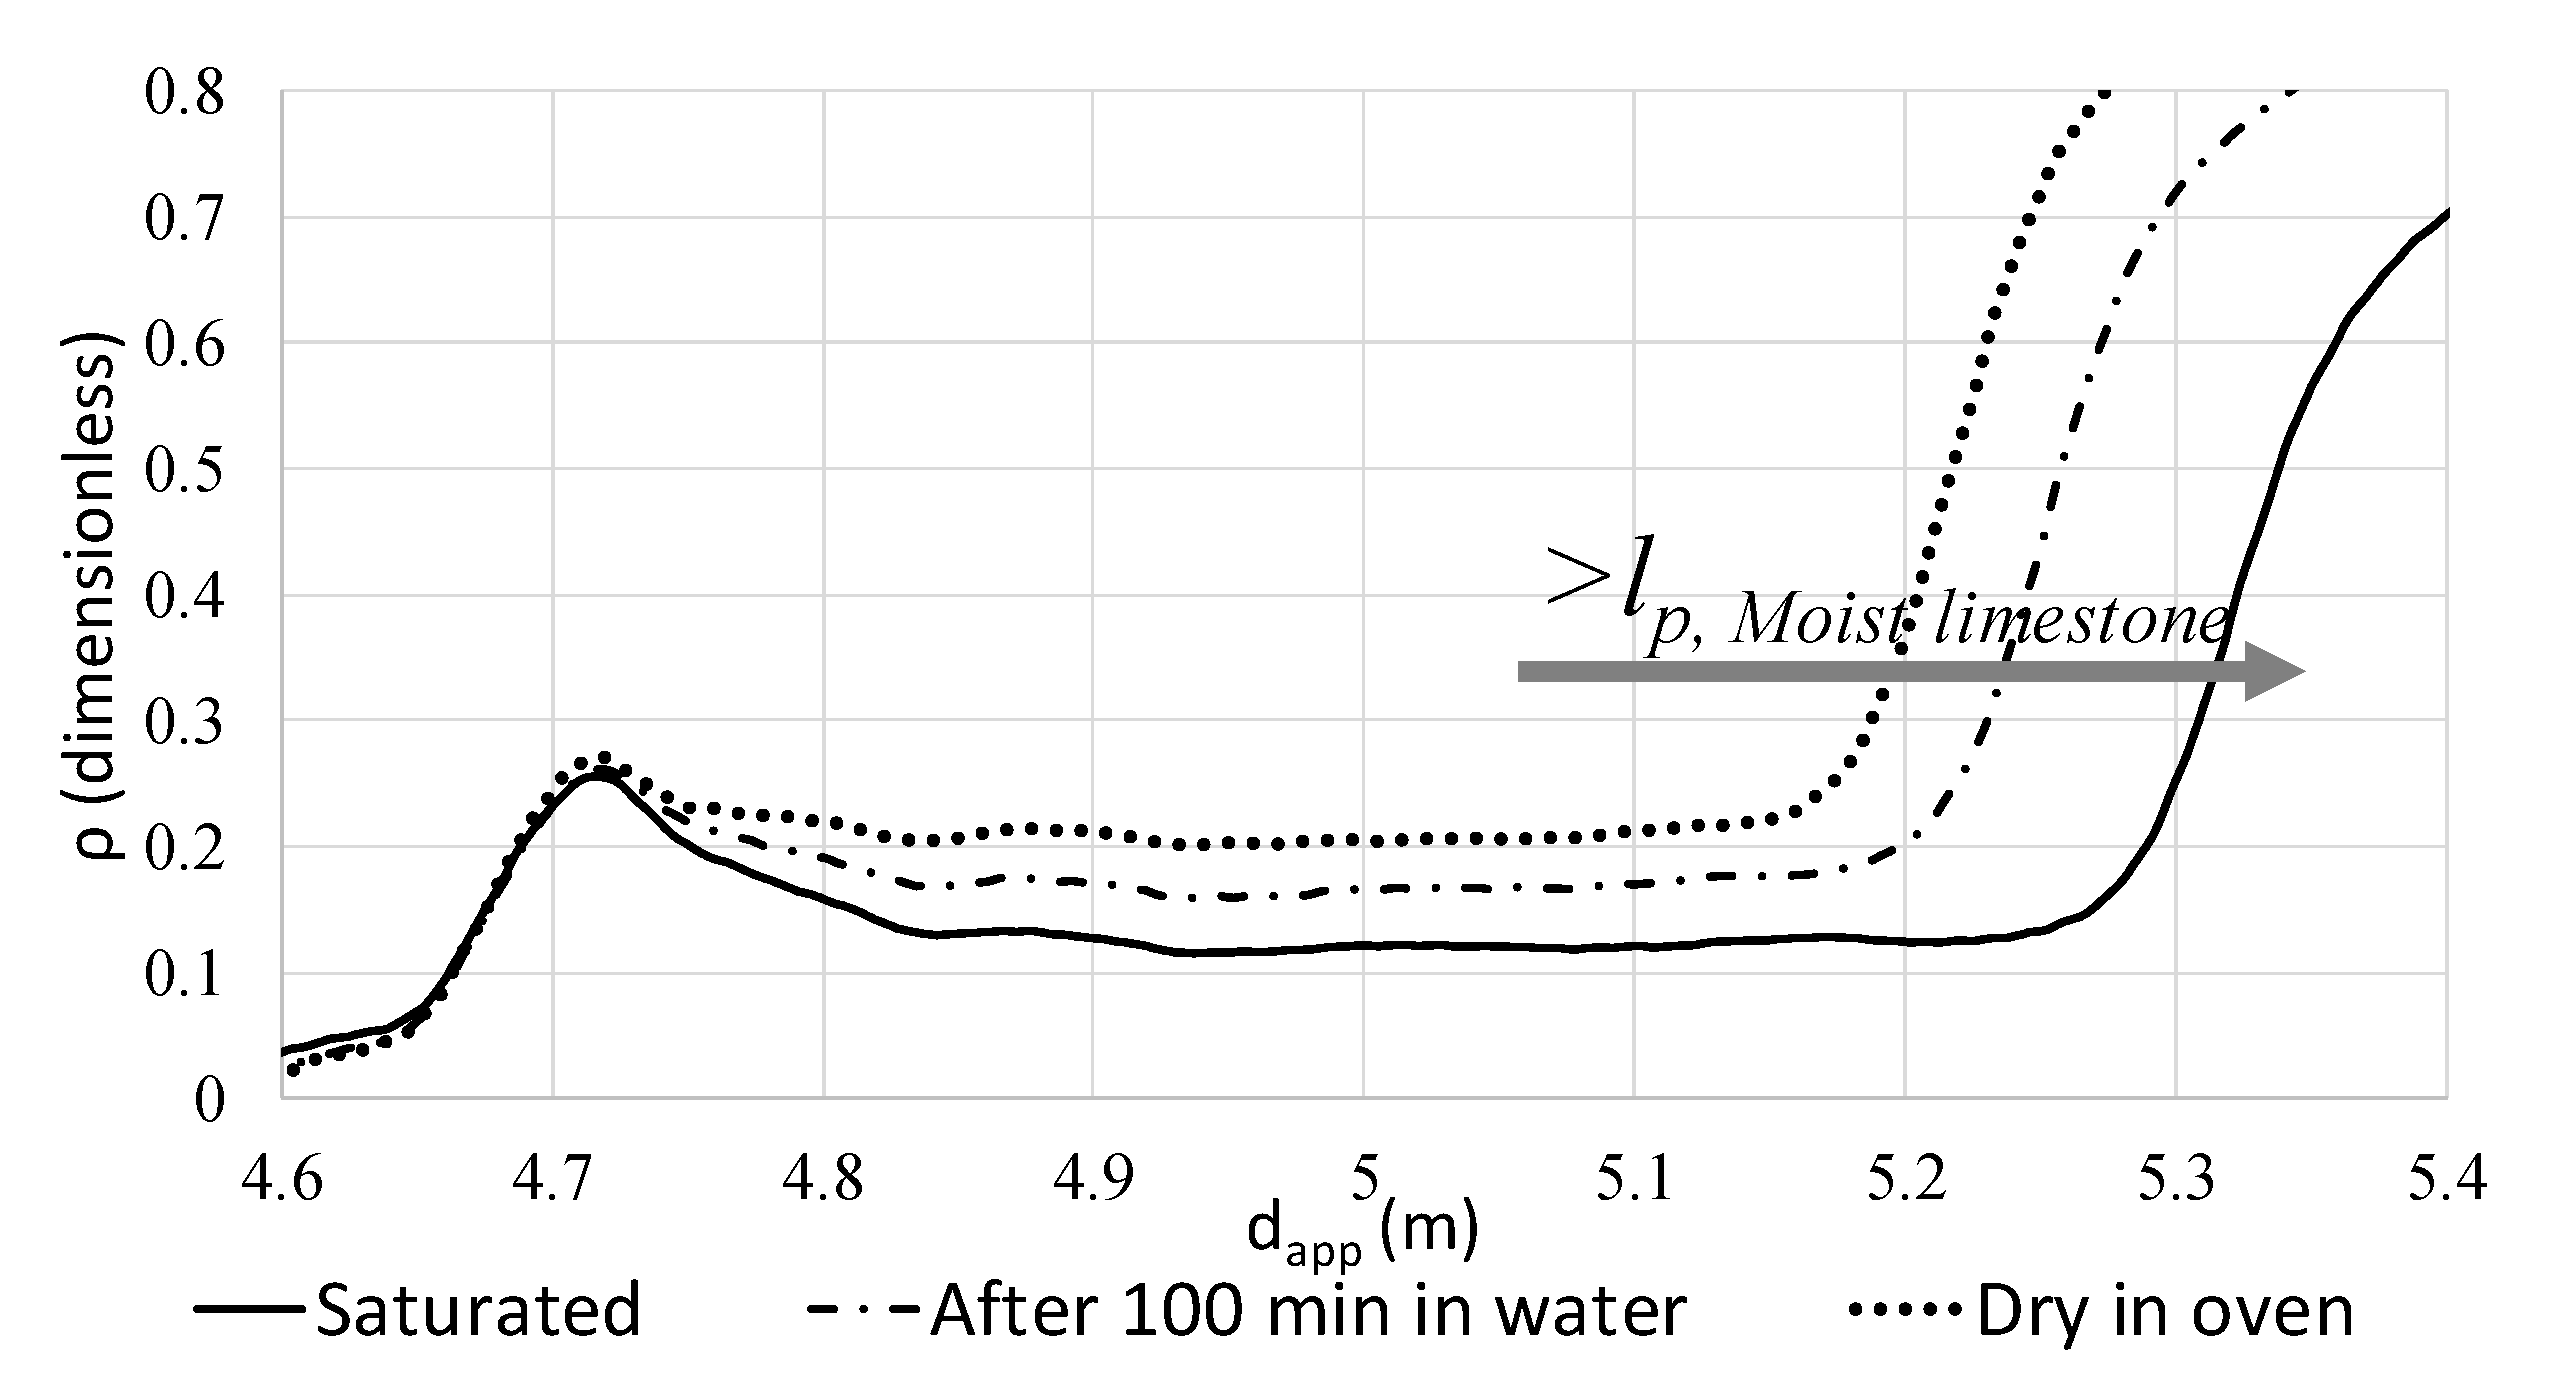
Figure 13 shows the reflectograms acquired for one limestone sample in three different scenarios: when the sample was completely saturated, after 100 min of immersion in water, and after removing the sample from the oven. The first and second reflectograms were obtained according to the steps described in Section 3.3. The results reveal that the TDR technique is suitable to detect moisture content variations in the limestone. In fact, despite their low porosity, whenever the moisture content increases in the study material, the greater is the apparent distance corresponding to the probe length.
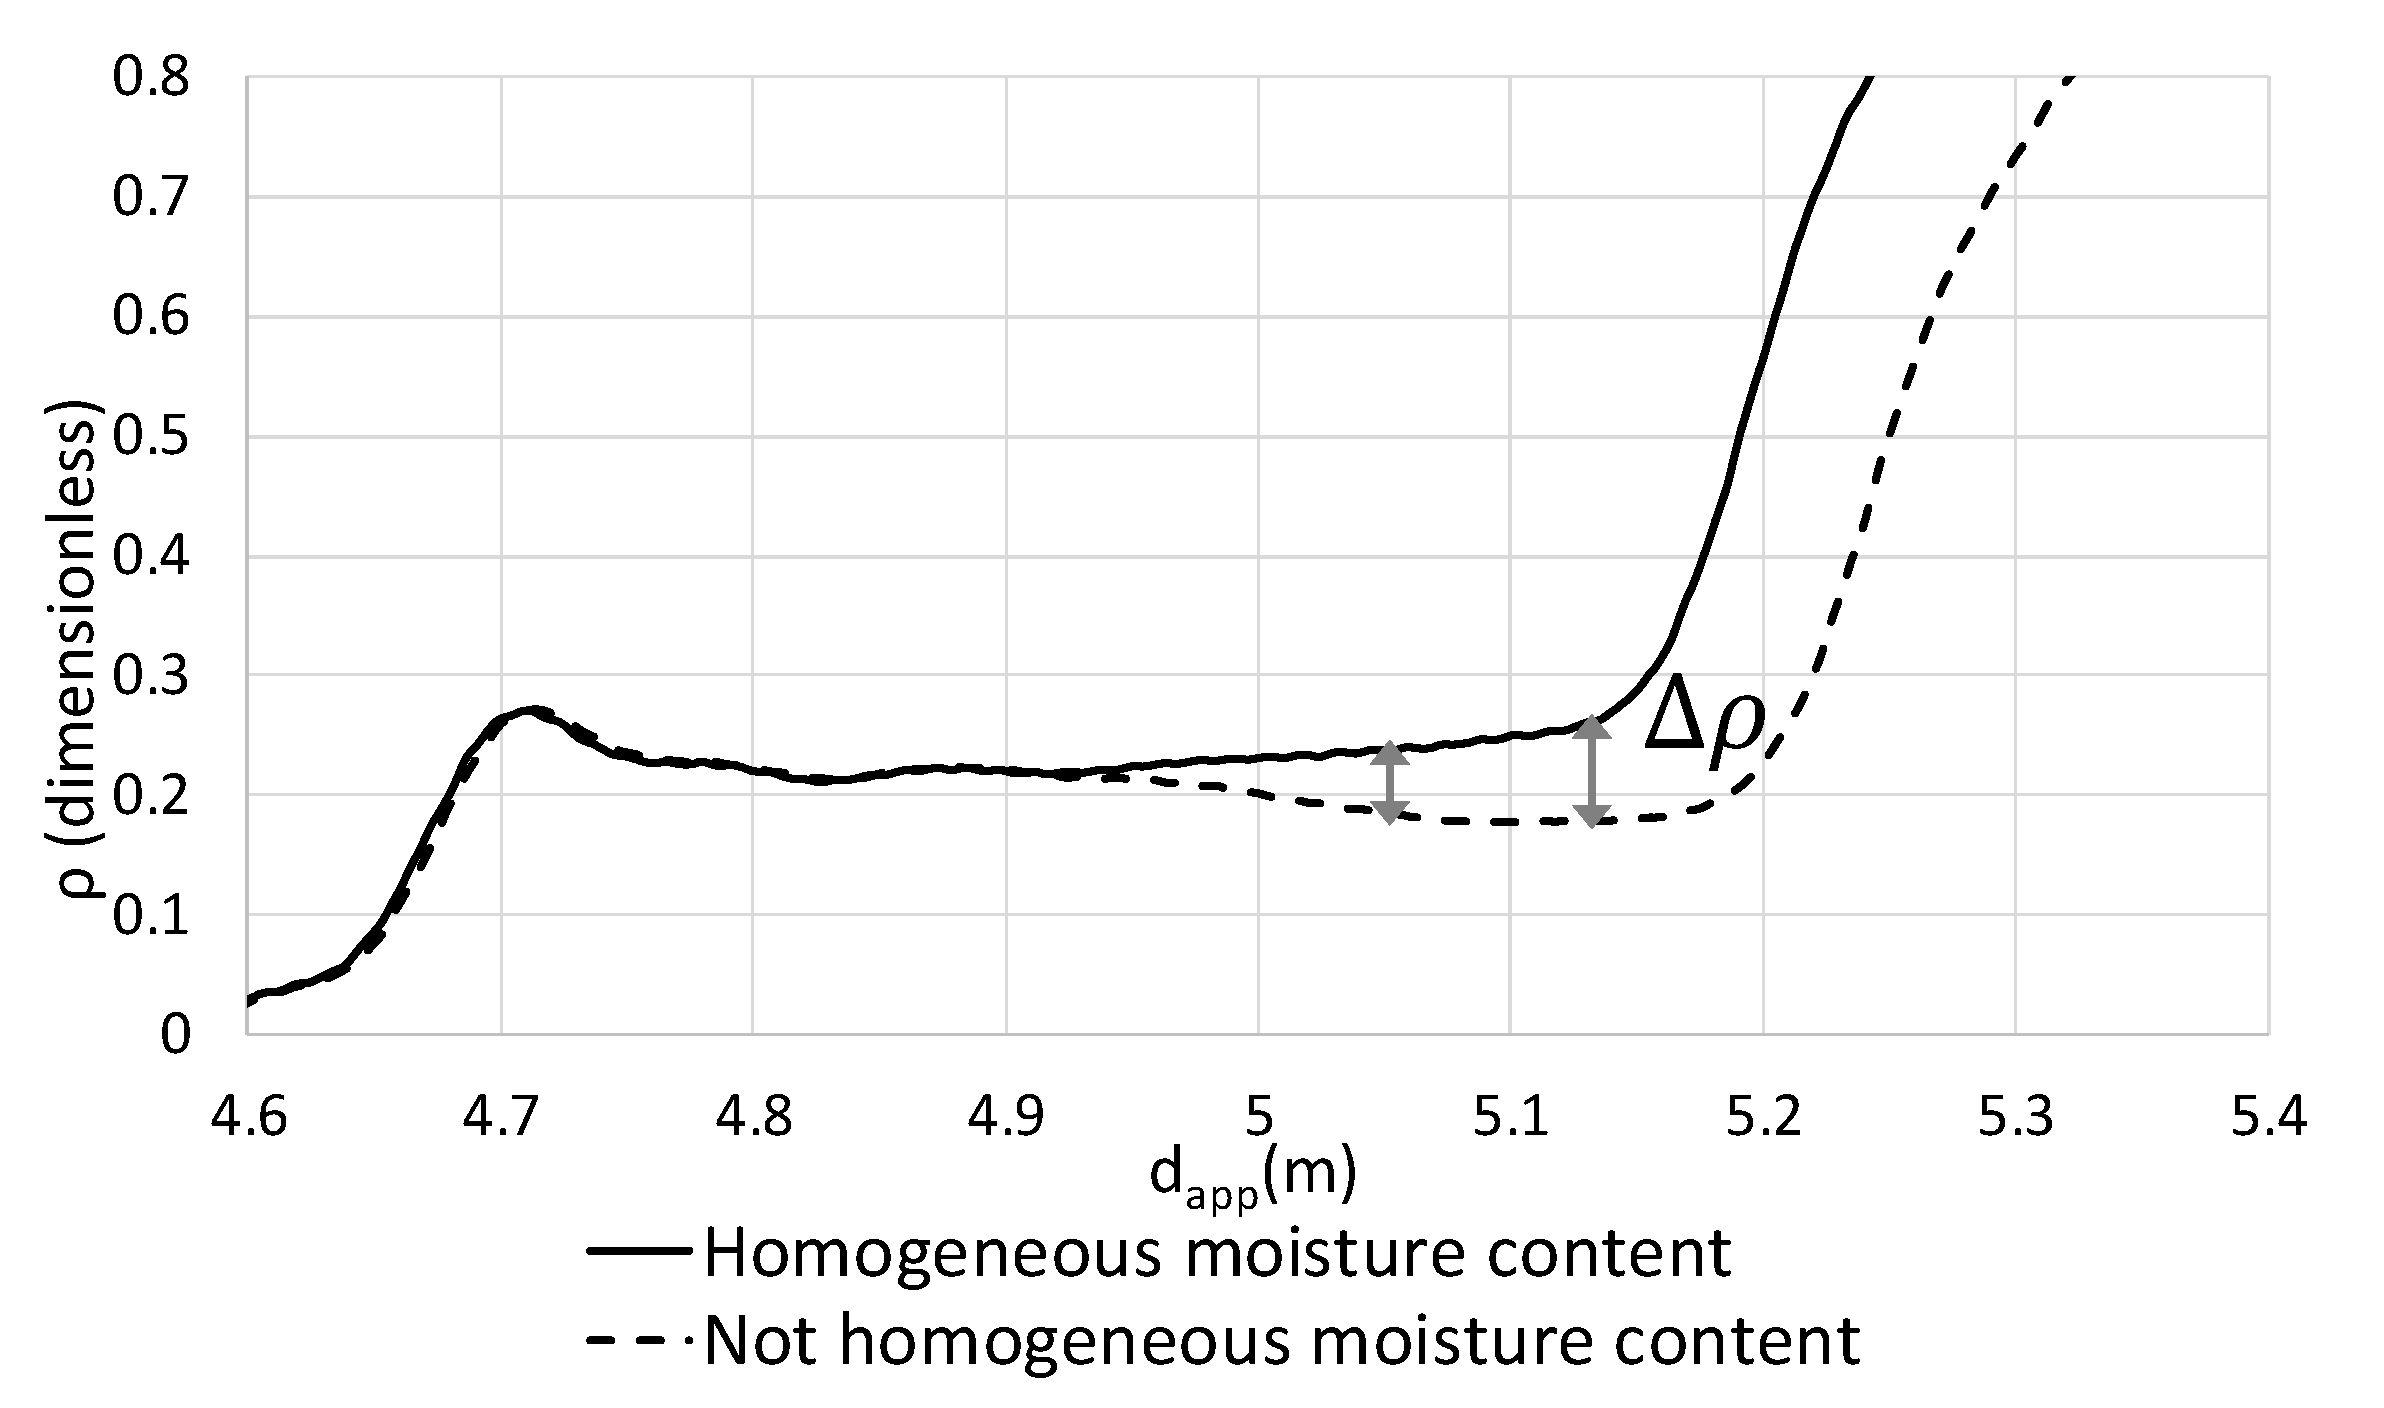
Another important observation is related to the reflection coefficient value, ρ . It shows an almost constant value in the portion of the reflectograms corresponding to the probe length. This result is particularly important, both for the measurement obtained with the dry sample and for the measurements recorded after 100 min in water and with the sample saturated. In the first case, it reveals that no air layer is present between the rods and the limestone, and in the second case, it reveals that the moisture content was already redistributed throughout the sample. Indeed, as the behaviour of ρ is strictly associated with the impedance variations encountered by the propagating electromagnetic signal along the probe, a constant value of ρ means that the dielectric characteristics of the limestone are practically uniform. If there were any air gaps between the probe and the dry sample or if the moisture content was not yet homogeneous in the sample, the ρ value would change along the probe length (see Figure 14 as an example).
For each value of moisture content under study (wsaturated = 31.22 kg/m3; wafter 100 min in water = 14.46 kg/m3, and woven = 0 kg/m3), ten repeated TDR measurements were performed. The values of lr,LIMESTONE were averaged and the corresponding apparent relative dielectric permittivity, εapp, was evaluated by applying the following equation:
ε a p p = ( 1 10 i 10 l r , L I M E S T O N E l r , A I R ) 2
Table 4 shows the relation between the moisture content and the apparent relative dielectric permittivity obtained for the same limestone sample.
The difference between the εapp value for the dry and saturated limestone is small. This is mainly due to the low porosity of the material. In spite of that, the technique proved to be suitable to detect even smaller moisture content variations (εapp = 7.4 for w = 14.46 kg/m3). These results are very encouraging as it regards the application of the TDR technique in other low-porosity building materials.
In the near future, the relation between w and εapp will be established for more points in order to adjust a polynomial function to the measured data and in this way propose a calibration function for limestone. In addition, these tests will be performed in more samples to evaluate the reproducibility of the results.

5. Conclusions

Monitoring moisture content in building materials is a complex subject, which is still the focus of ongoing research. Despite the wide use of the TDR technique, especially for moisture content measurement in soils, the application in construction materials is considered a relatively new method. One of the major problems pointed out by several authors to the use of the TDR technique in hard construction materials is the difficulty of ensuring good contact between the TDR probe and the medium. In addition, the empirical conversion functions used in soil moisture measurements are mostly not suitable for building materials, and in the current state of research general formulas for determination of moisture content from the measured apparent relative permittivity are not yet available, especially for low-porosity building materials. Therefore, the establishment of a calibration curve for the particular material under test, using a reference method, is so far the most reliable solution. However, this is a time-consuming procedure and represents another obstacle to the current use of the TDR technique in construction materials.
This work aims to contribute to solving these two problems by testing the suitability of the TDR technique for moisture content measurement in limestone. The results obtained so far reveal that:
  • The steel auxiliary guide developed allows drilling parallel and appropriate holes to accommodate the probes. As a result, no air gap was present next to the rods and the installation was considered a success (Table 3);
  • The procedure proposed, through the gravimetric method, to establish a relation between the relative permittivity and the moisture content seems appropriate to obtain valid calibration curves for construction materials (Figure 12);
  • The technique is sensitive to detect moisture content variations in limestone (despite their low porosity) and even small moisture content variations (Figure 13).
The intention, in the near future, is to present a new empirical calibration function valid for limestone that can also be used for further tests and validation of more general functions for similar types of low-porosity building materials (more measurements in Table 4).
The final main goal, after getting the calibration curve, will be testing the suitability of the TDR technique for continuous long-term monitoring of moisture content in real-scale limestone walls (Figure 10).

Author Contributions

Investigation, T.S.F.; Methodology, V.P.d.F. and A.C.; Software, A.C.; Supervision, A.S.G., S.R. and V.P.d.F.; Validation, A.S.G.; Writing—original draft, T.S.F. All authors have read and agreed to the published version of the manuscript.

Funding

This work was financially supported by Base Funding—UIDB/04708/2020 of the CONSTRUCT—Instituto de I&D em Estruturas e Construções—funded by national funds through the FCT/MCTES (PIDDAC). The author Teresa Stingl Freitas would also like to thank FCT for financial support through the grant SFRH/BD/121549/2016.

Conflicts of Interest

The authors declare no conflict of interest.

References

  1. Phillipson, M.; Baker, P.; McNaughtan, A.; Galbraith, G.; McLean, R.; Davies, M.; Ye, Z. Moisture measurement in building materials: An overview of current methods and new approaches. Build. Serv. Eng. Res. Technol. 2007, 28, 303–316. [Google Scholar] [CrossRef]
  2. Said, M.N.A. Measurement Methods of Moisture in Building Envelopes—A Literature Review. Int. J. Arch. Heritage 2007, 1, 293–310. [Google Scholar] [CrossRef] [Green Version]
  3. Černý, R. Time-domain reflectometry method and its application for measuring moisture content in porous materials: A review. Measurement 2009, 42, 329–336. [Google Scholar] [CrossRef]
  4. Cataldo, A.; De Benedetto, E.; Cannazza, G. Advances in Reflectometric Sensing for Industrial Applications. Synth. Lect. Emerg. Eng. Technol. 2016, 2, 1–96. [Google Scholar] [CrossRef]
  5. Malmberg, C.; Maryott, A. Dielectric constant of water from 0 to 100 C. J. Res. Natl. Inst. Stand. Technol. 1956, 56, 1. [Google Scholar] [CrossRef]
  6. Wraith, J.M.; Or, D. Temperature effects on soil bulk dielectric permittivity measured by time domain reflectometry: Experimental evidence and hypothesis development. Water Resour. Res. 1999, 35, 361–369. [Google Scholar] [CrossRef]
  7. De Sousa, F.F.; Da Silva, L.D.P.; Freitas, K.H.G. Electrical and dielectric properties of water. Sci. Plena 2017, 13, 13. [Google Scholar] [CrossRef]
  8. Rusiniak, L. Electric properties of water. New experimental data in the 5HZ-13MHZ frequency range. Acta Geophys. Pol. 2004, 52, 63–76. [Google Scholar]
  9. Instruction Manual–TDR Probes CS605, CD610, CS630, CS635, CS640, CS645 (Revision:9/13). Available online: https://s.campbellsci.com/documents/ca/manuals/tdr-probes-manual.pdf (accessed on 24 January 2019).
  10. Suchorab, Z.; Sobczuk, H.; Cerny, R.; Pavlik, Z.; Miguel, R.S. Sensitivity range determination of surface TDR probes. Environ. Prot. Eng. 2009, 35, 179–189. [Google Scholar]
  11. Pavlík, Z.; Mihulka, J.; Fiala, L.; Černý, R. Application of Time-Domain Reflectometry for Measurement of Moisture Profiles in a Drying Experiment. Int. J. Thermophys. 2011, 33, 1661–1673. [Google Scholar] [CrossRef]
  12. Hubbard, S.S.; Peterson, J.E.; Majer, E.L.; Zawislanski, P.T.; Williams, K.H.; Roberts, J.; Wobber, F. Estimation of permeable pathways and water content using tomographic radar data. Lead. Edge 1997, 16, 1623–1630. [Google Scholar] [CrossRef]
  13. Martinez, A.; Bymes, A.P. Modelling Dielectric-Constant Values of Geologic Materials: An Aid to Ground-Penetrating Radar Data Collection and Interpretation. Available online: http://www.kgs.ku.edu/Current/2001/martinez/martinez.pdf (accessed on 24 January 2019).
  14. Pavlik, Z.; Fiala, L.; Černý, R. Determination of Moisture Content of Hygroscopic Building Materials Using Time Domain Reflectometry. J. Appl. Sci. 2008, 8, 1732–1737. [Google Scholar] [CrossRef] [Green Version]
  15. Pavlík, Z.; Fiala, L.; Černý, R. Analysis of dielectric mixing models for the moisture assessment of porous building materials. Pollack Period. 2009, 4, 79–88. [Google Scholar] [CrossRef]
  16. Suchorab, Z. Laboratory measurements of moisture in a model red-brick wall using the surface TDR probe. Proc. Ecopole 2013, 7, 171–176. [Google Scholar]
  17. Agliata, R.; Mollo, L.; Greco, R. Use of TDR to Compare Rising Damp in Three Tuff Walls Made with Different Mortars. J. Mater. Civ. Eng. 2017, 29, 04016262. [Google Scholar] [CrossRef]
  18. Phillipson, M.; Baker, P.; Davies, M.; Ye, Z.; Galbraith, G.; McLean, R. Suitability of time domain reflectometry for monitoring moisture in building materials. Build. Serv. Eng. Res. Technol. 2008, 29, 261–272. [Google Scholar] [CrossRef]
  19. Pinchin, S.E. Techniques for monitoring moisture in walls. Stud. Conserv. 2008, 53, 33–45. [Google Scholar] [CrossRef]
  20. Pavlík, Z.; Jiřičková, M.; Černý, R.; Sobczuk, H.; Suchorab, Z. Determination of Moisture Diffusivity using the Time Domain Reflectometry (TDR) Method. J. Build. Phys. 2006, 30, 59–70. [Google Scholar] [CrossRef]
  21. Cataldo, A.; De Benedetto, E.; Cannazza, G.; Piuzzi, E.; Pittella, E. Moisture content monitoring of construction materials: From in-line production through on-site applications. In Proceedings of the 2017 IEEE International Instrumentation and Measurement Technology Conference (I2MTC), Turin, Italy, 22–25 May 2017; pp. 1–5. [Google Scholar] [CrossRef]
  22. Torres, M.I.M.; De Freitas, V. Treatment of rising damp in historical buildings: Wall base ventilation. Build. Environ. 2007, 42, 424–435. [Google Scholar] [CrossRef] [Green Version]
  23. Azevedo, A.; Delgado, J.; De Freitas, V. Rising damp in building walls: The wall base ventilation system. Heat Mass Transf. 2012, 48, 2079–2085. [Google Scholar] [CrossRef]
  24. Instruction Manual-TDR200 (Revision 4/17). Available online: https://s.campbellsci.com/documents/ca/manuals/tdr200_man.pdf (accessed on 5 March 2020).
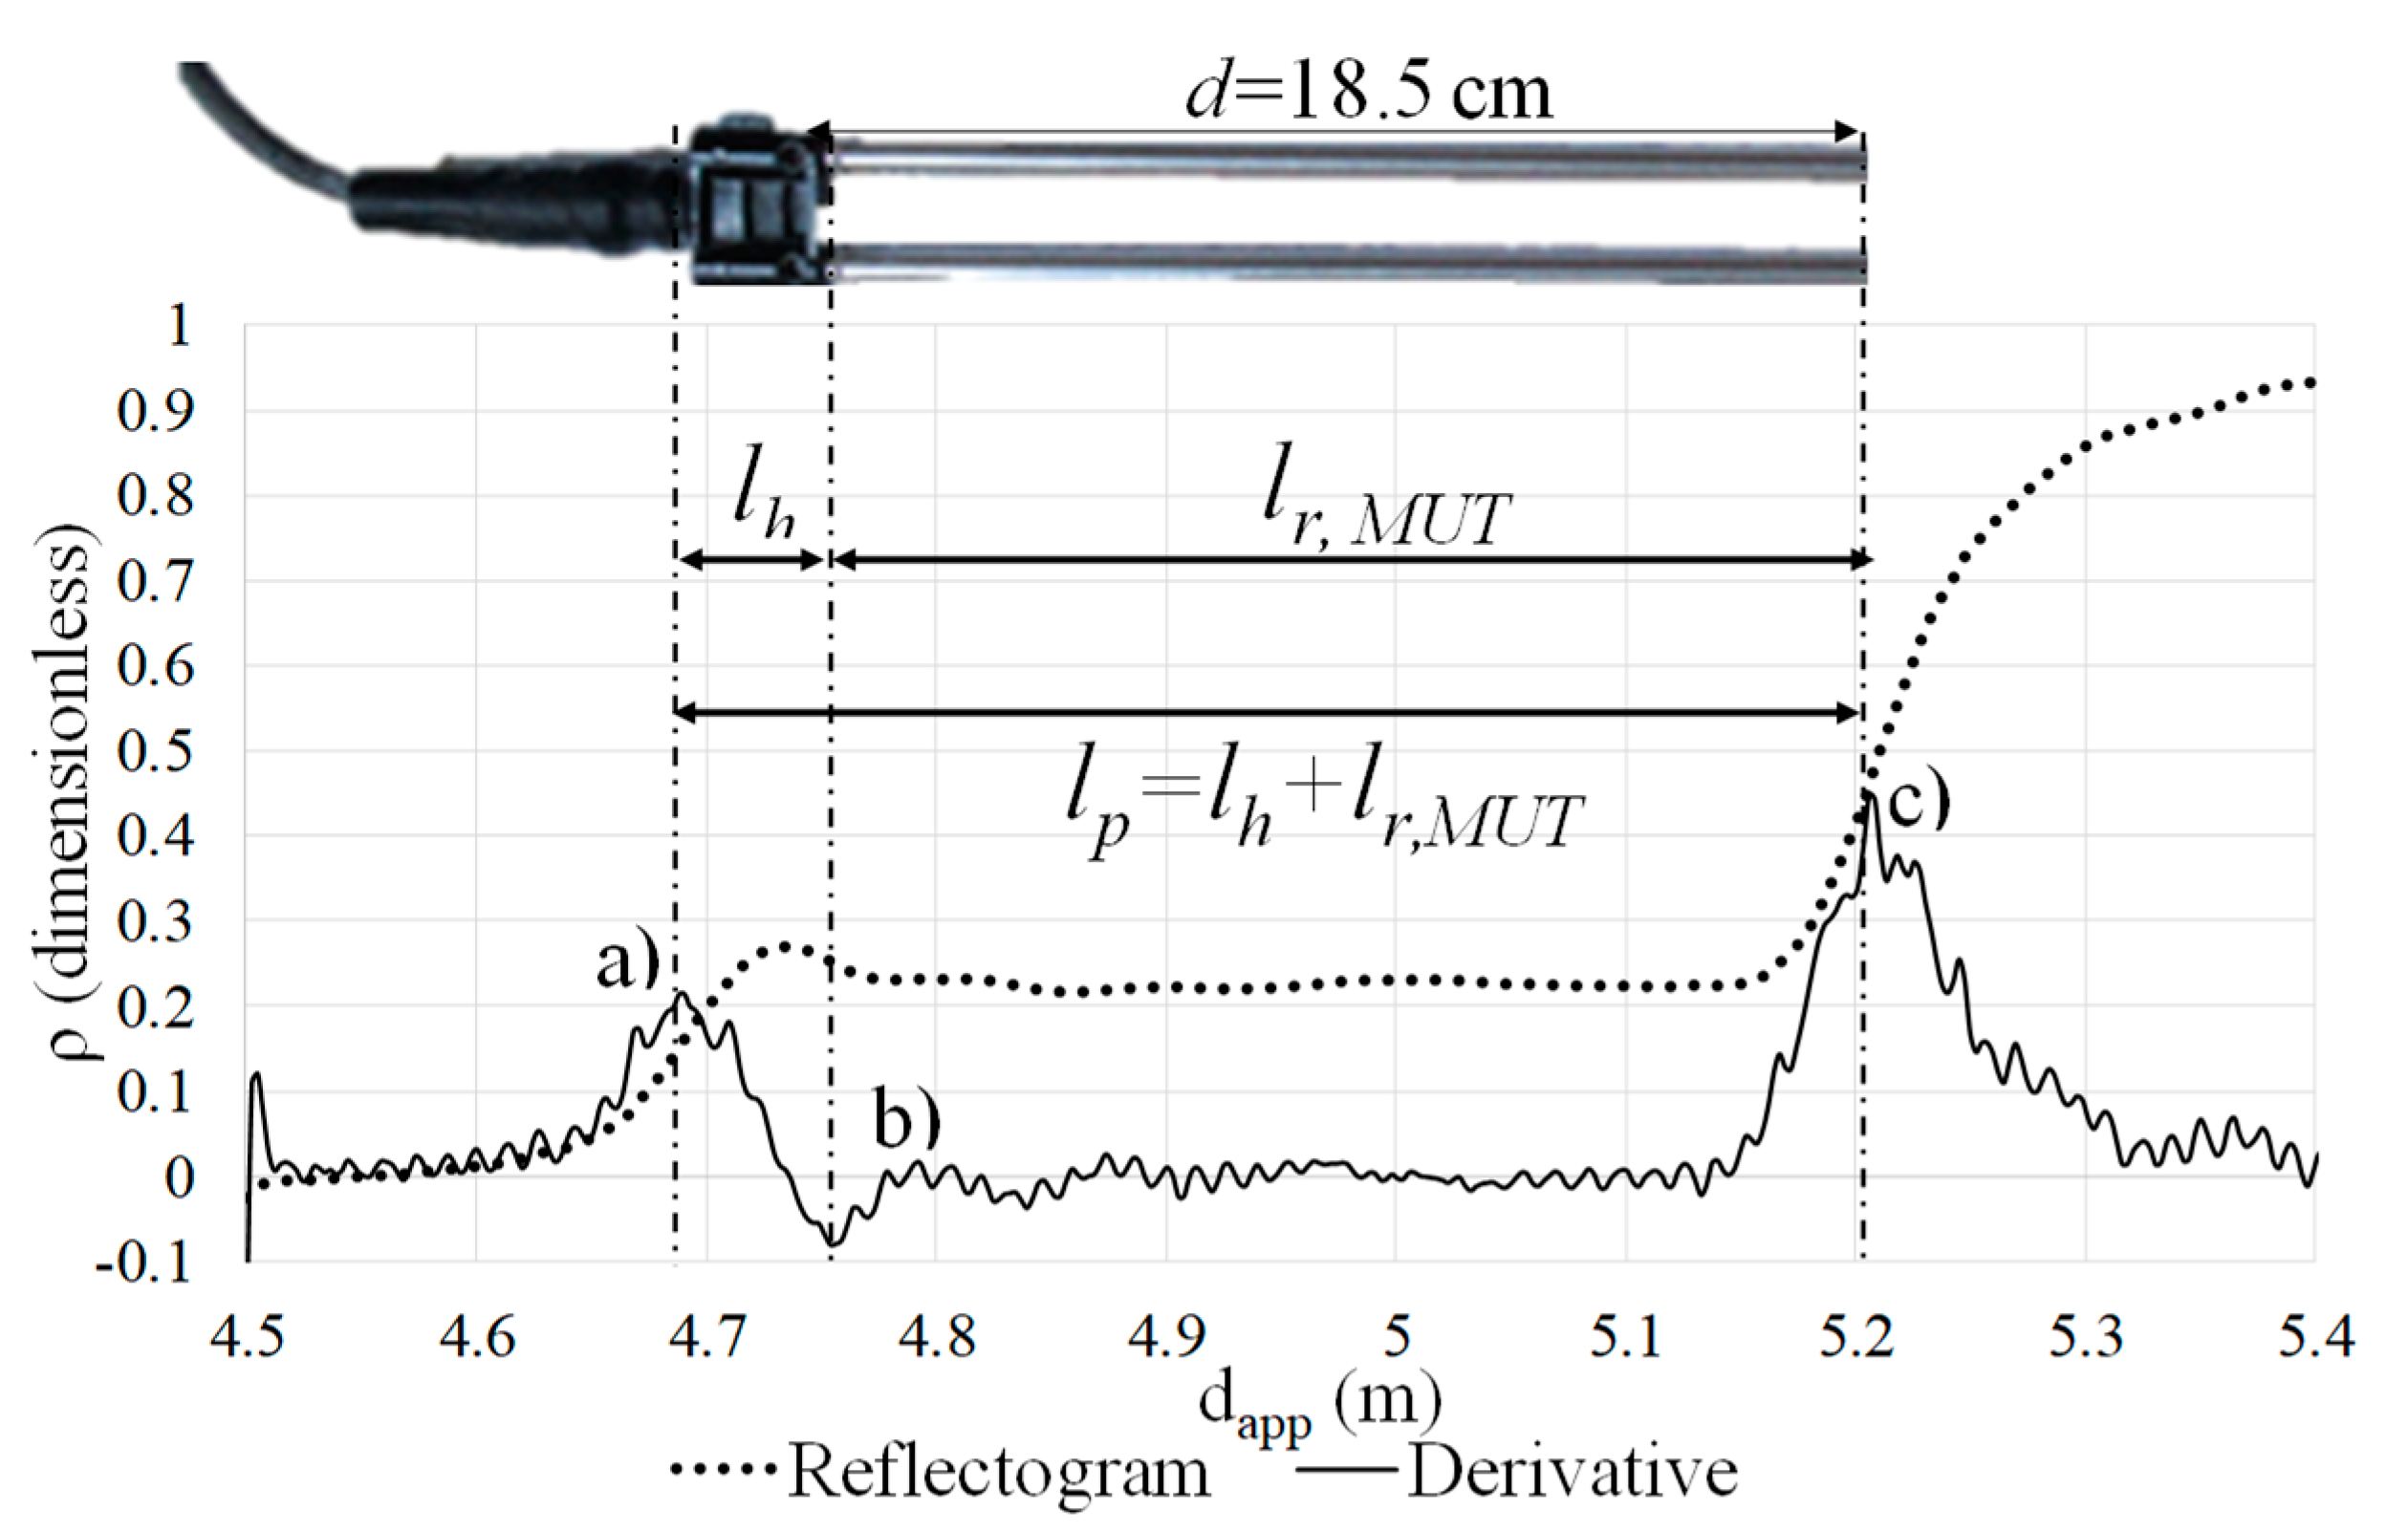
Figure 1. Time-domain reflectometry (TDR) reflectogram and the corresponding first derivative for an 18.5-cm long two-rod probe inserted in dry limestone. The peaks of the derivative, represented by the three vertical dashed lines, indicate the most significant impedance changes. Note: lp is the sum of the electric length of the probes’ head and the electric length of the rods.
Sustainability 12 07855 g001
Figure 2. TDR reflectogram and the corresponding first derivative for an 18.5-cm long two-rod probe placed in air.
Sustainability 12 07855 g002
Figure 3. Probe positioning and precautions for adequate probe-length calibration: (a) probe in air; (b) probe in distilled water; (c) appropriate water level for the TDR measurements; (d) water temperature sensor location.
Sustainability 12 07855 g003
Figure 4. TDR reflectograms and the corresponding first derivatives obtained with an 18.5-cm long two-rod probe during the individual probe calibration process: (a) probe placed in air; (b) probe placed in distilled water.
Sustainability 12 07855 g004
Figure 5. TDR reflectograms and the corresponding first derivatives obtained for air, dry limestone, and water.
Sustainability 12 07855 g005
Figure 6. Experimental laboratory set-up built to test the efficiency of a wall-base ventilation channel for drying flooded walls: (a) dimensions of the limestone walls; (b) ventilation channel with a waterproof membrane on the outside; (c) interior of the ventilation channel; (d) final experimental configuration.
Sustainability 12 07855 g006
Figure 7. TDR equipment: (a) reflectometer; (b) multiplexer; (c) two-rod TDR probe specially designed for the wall thickness.
Sustainability 12 07855 g007
Figure 8. Steel auxiliary guide composed of two separate pieces: (a) top view of the first piece; (b) side view of the second piece; (c) entire guide.
Sustainability 12 07855 g008
Figure 9. Steps followed during the drilling until the probes’ final installation: (a) the bottom piece of the guide was fixed to the surface of the wall with a resistant glue; (b) the upper part was fixed to the previous one with screws; (c) the drilling was done until the power drill hit the guide; (d) the guide was removed by heating the glue; (e) the drilling continued until an 18.5-cm depth was reached; (f) the probes were completely inserted into the walls.
Sustainability 12 07855 g009
Figure 10. Final experimental set-up for monitoring moisture content using the TDR method (left wall with the ventilation channel and right wall without).
Sustainability 12 07855 g010
Figure 11. Preparation of the limestone samples for the calibration process through the gravimetric method.
Sustainability 12 07855 g011
Figure 12. Six steps followed during the gravimetric calibration: (a) water immersion; (b) sample weighing; (c) plastic film insulation; (d) aluminium tape insulation; (e) new weighing to ensure that no water has evaporated from the sample; (f) TDR measurement.
Sustainability 12 07855 g012
Figure 13. TDR reflectograms acquired for the same limestone sample for three different scenarios: saturated, partially moist, and dry.
Sustainability 12 07855 g013
Figure 14. Comparison between a TDR reflectogram collected in a limestone sample where the moisture content was homogeneous (solid line) and a TDR reflectogram obtained when the moisture content was not yet redistributed in the sample (dashed line).
Sustainability 12 07855 g014
Table 1. Results of the ten consecutive TDR readings obtained with the same probe placed in air and distilled water.
Measurements in Air *Measurements in Distilled Water
Probe 1Probe 1
Measurement number l p , a i r Measurement number l p , w a t e r
10.22716211.792867
20.20517821.753786
30.21006331.773327
40.20762141.775770
50.21006351.775769
60.20762161.770884
70.22716171.775769
80.20517881.770884
90.20762191.792867
100.205178101.770884
Average: 0.211285Average:1.775281
* Note: For the probe-length calibration of each probe, it is recommended to start with the measurements in air and only after in water. Otherwise, improper drying of the wet TDR probes may compromise the readings in air.
Table 2. Typical relative permittivity values for common geological materials obtained at radar frequencies (10–1000 MHz) [12,13].
MaterialRelative Permittivity
Sand (dry)3–6
Sand (saturated)20–30
Clays (dry)2–6
Clays (wet)15–40
Humid soil 30
Rocky soil7
Sandy soil (dry)3
Sandy soil (saturated)19
Clayey soil (dry)2
Clayey soil (saturated)15
Sandstone (dry)2–3
Sandstone (saturated)5–10
Granite (dry)5
Granite (saturated)7
Limestone (dry)5–7
Limestone (saturated)8
Table 3. Relative permittivity measured with the walls dried.
WallProbe NumberApparent Relative Permittivity, εapp
left16.2
26.0
36.1
46.0
right56.5
66.1
76.3
86.4
Table 4. Relation between the moisture content and the apparent relative dielectric permittivity for limestone (sample volume: 0.0007332844 m3).
Sample Mass (kg)w (kg/m3)εapp (-)
Dry in oven1.891706.8
Moist1.902314.467.4
Saturated1.914631.228.4