Assessment of Community Vulnerability to Different Types of Urban Floods: A Case for Lishui City, China


Abstract
:1. Introduction
2. Materials and Methods
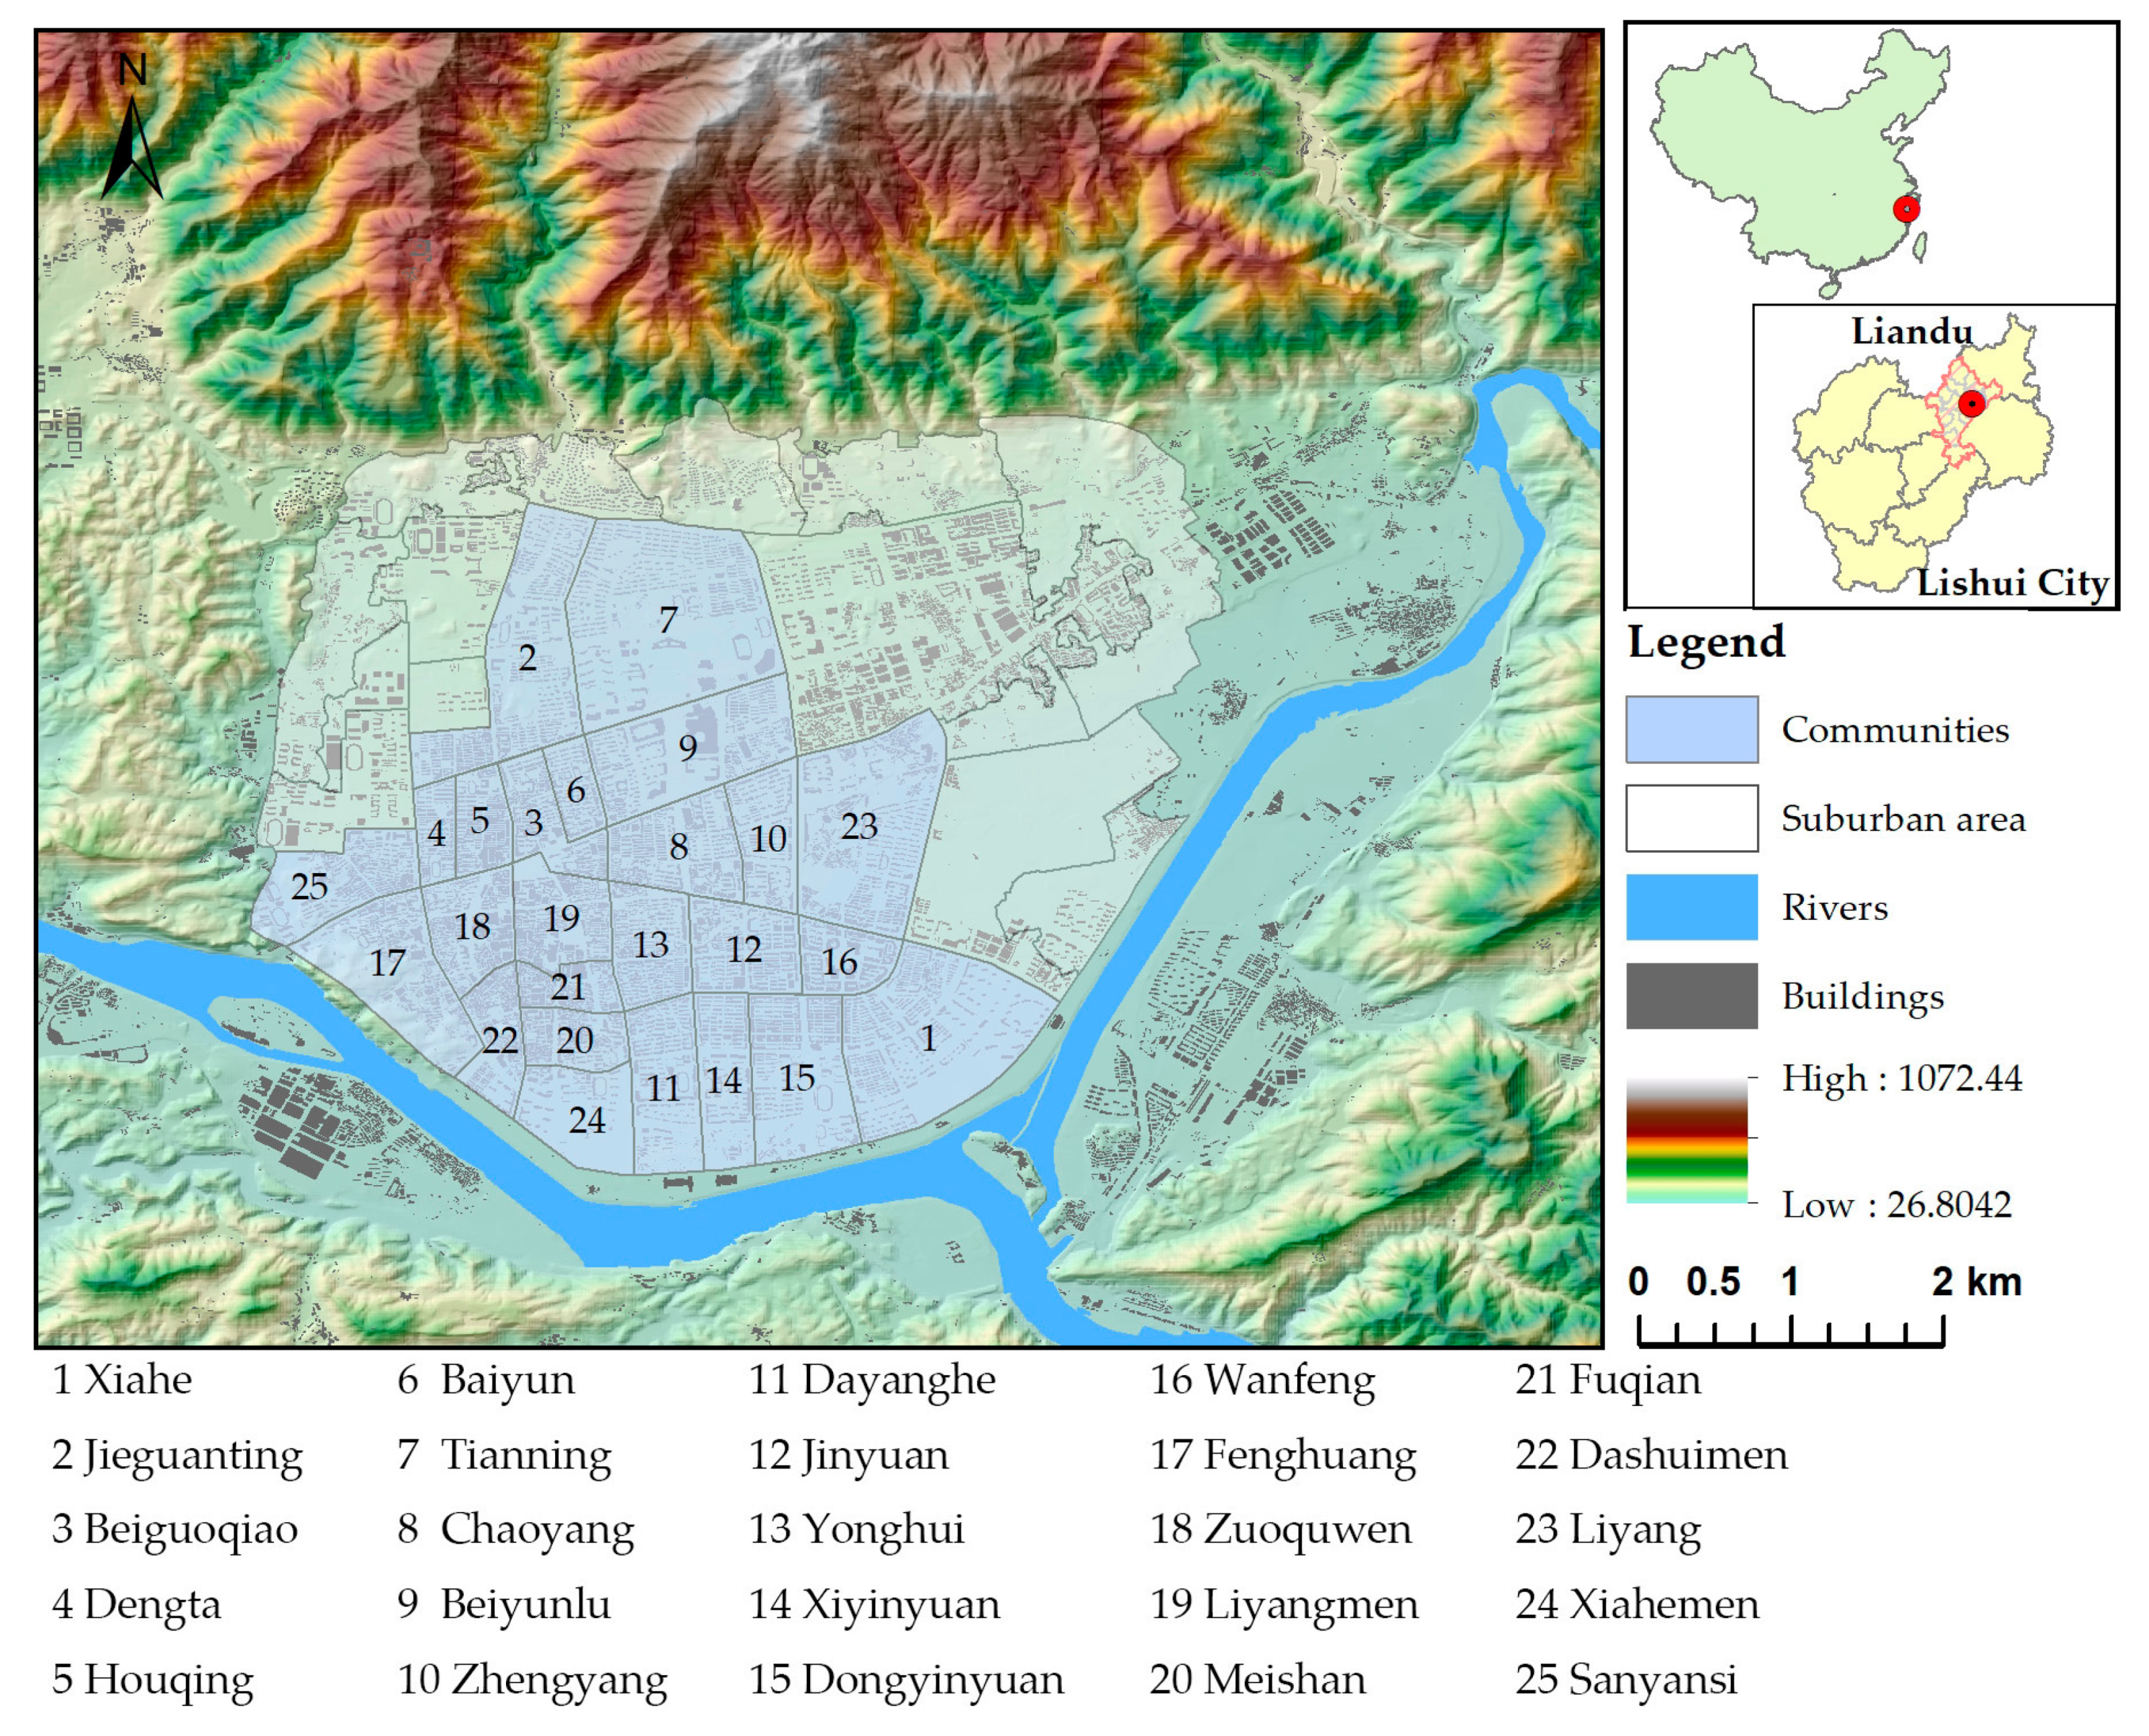
2.1. Study Area
2.2. Study Data
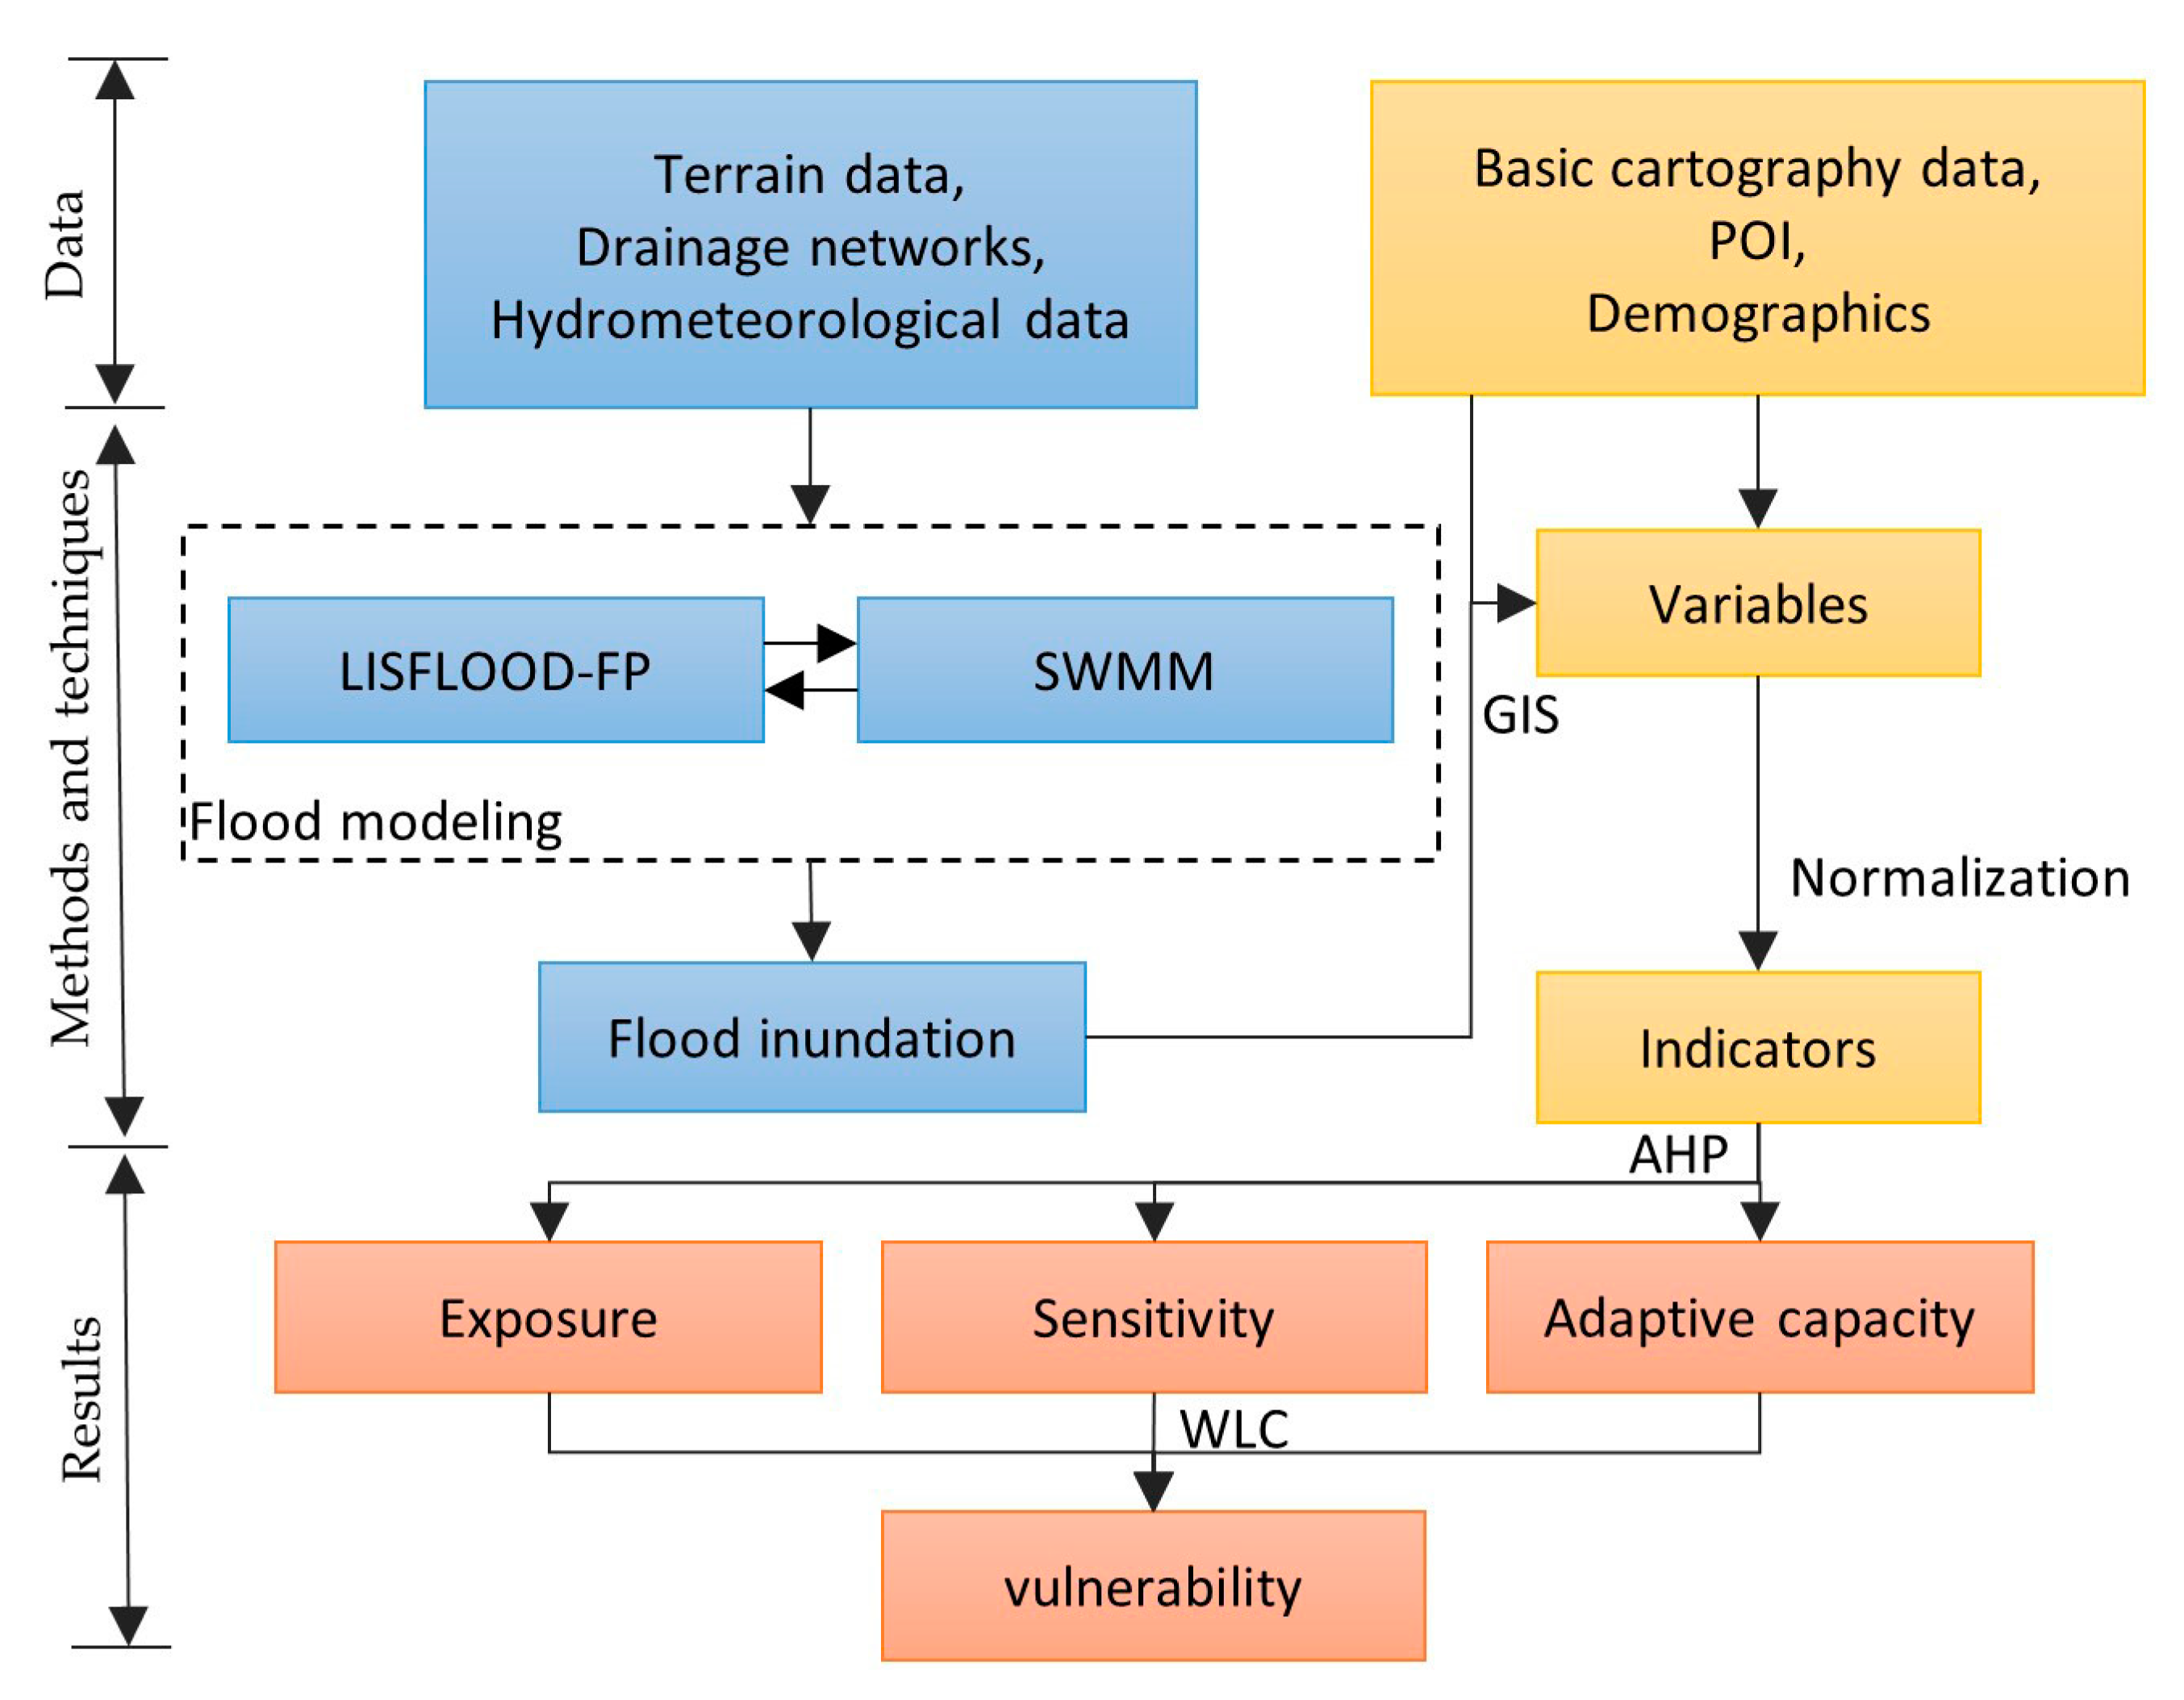
2.3. Methodological Outline
2.4. Flood Modeling
2.4.1. Coupled Urban Flood Model
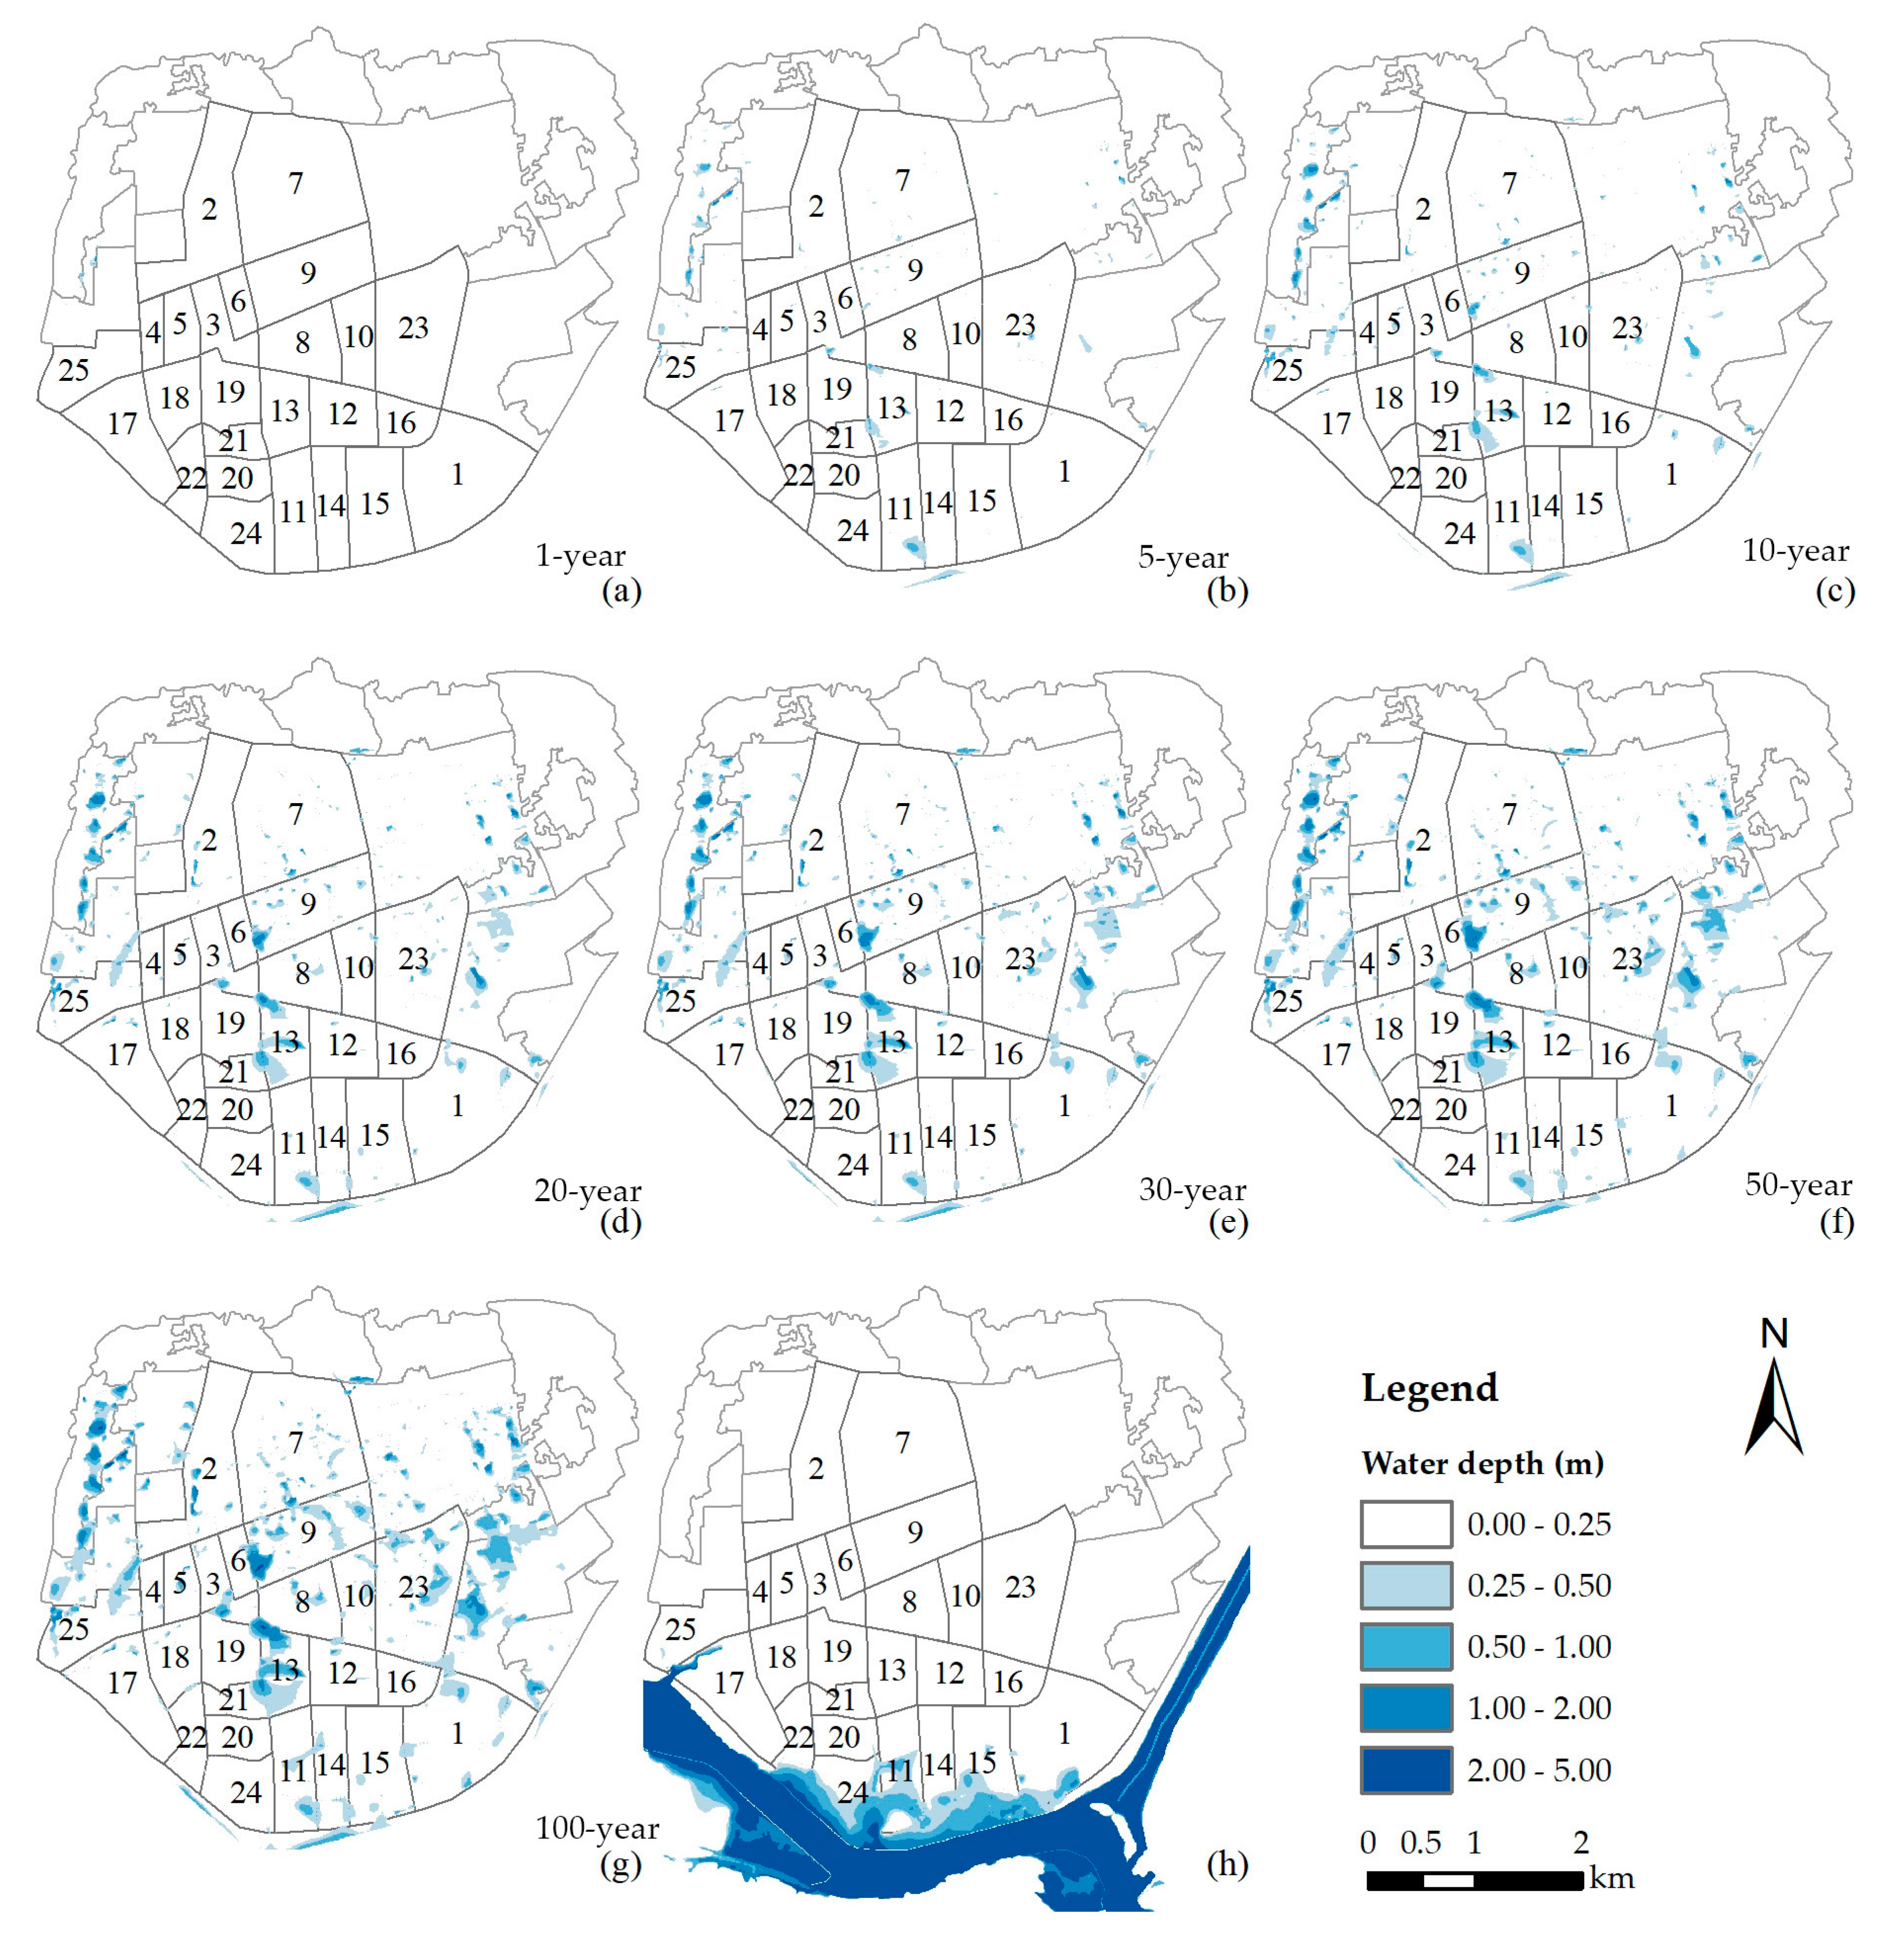
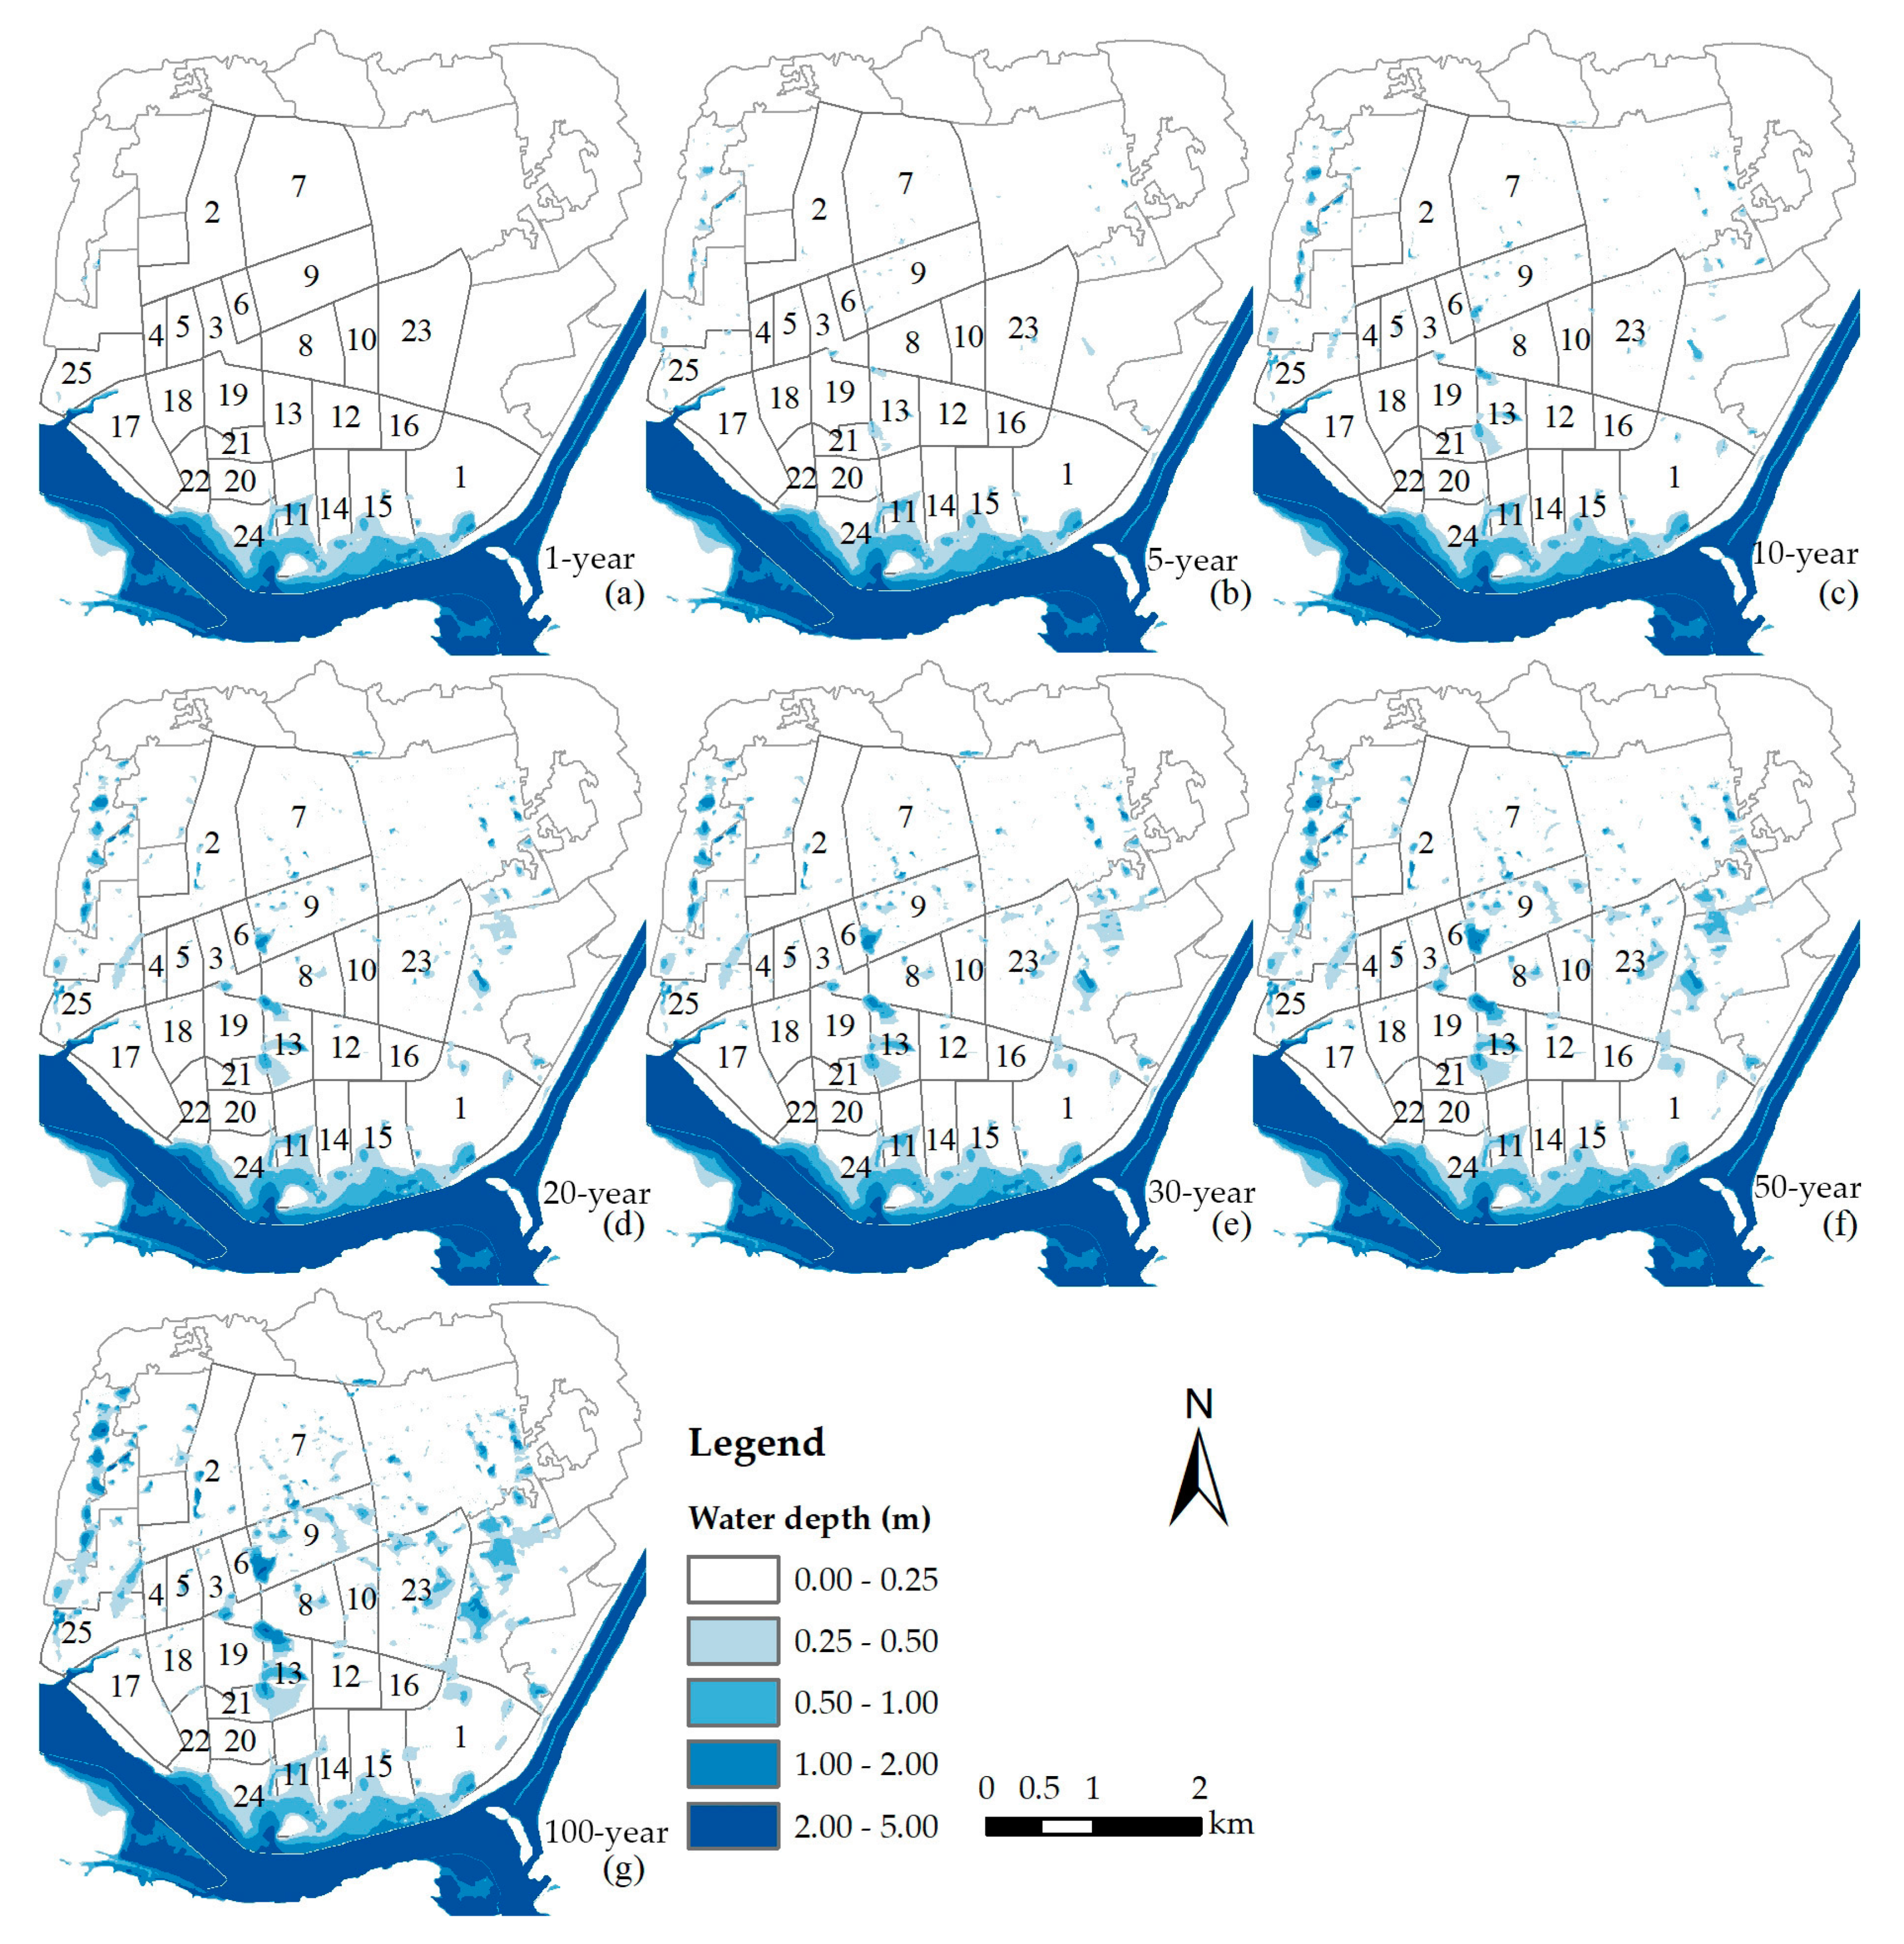
2.4.2. Urban Flood Scenarios
2.5. Vulnerability Assessment
3. Results
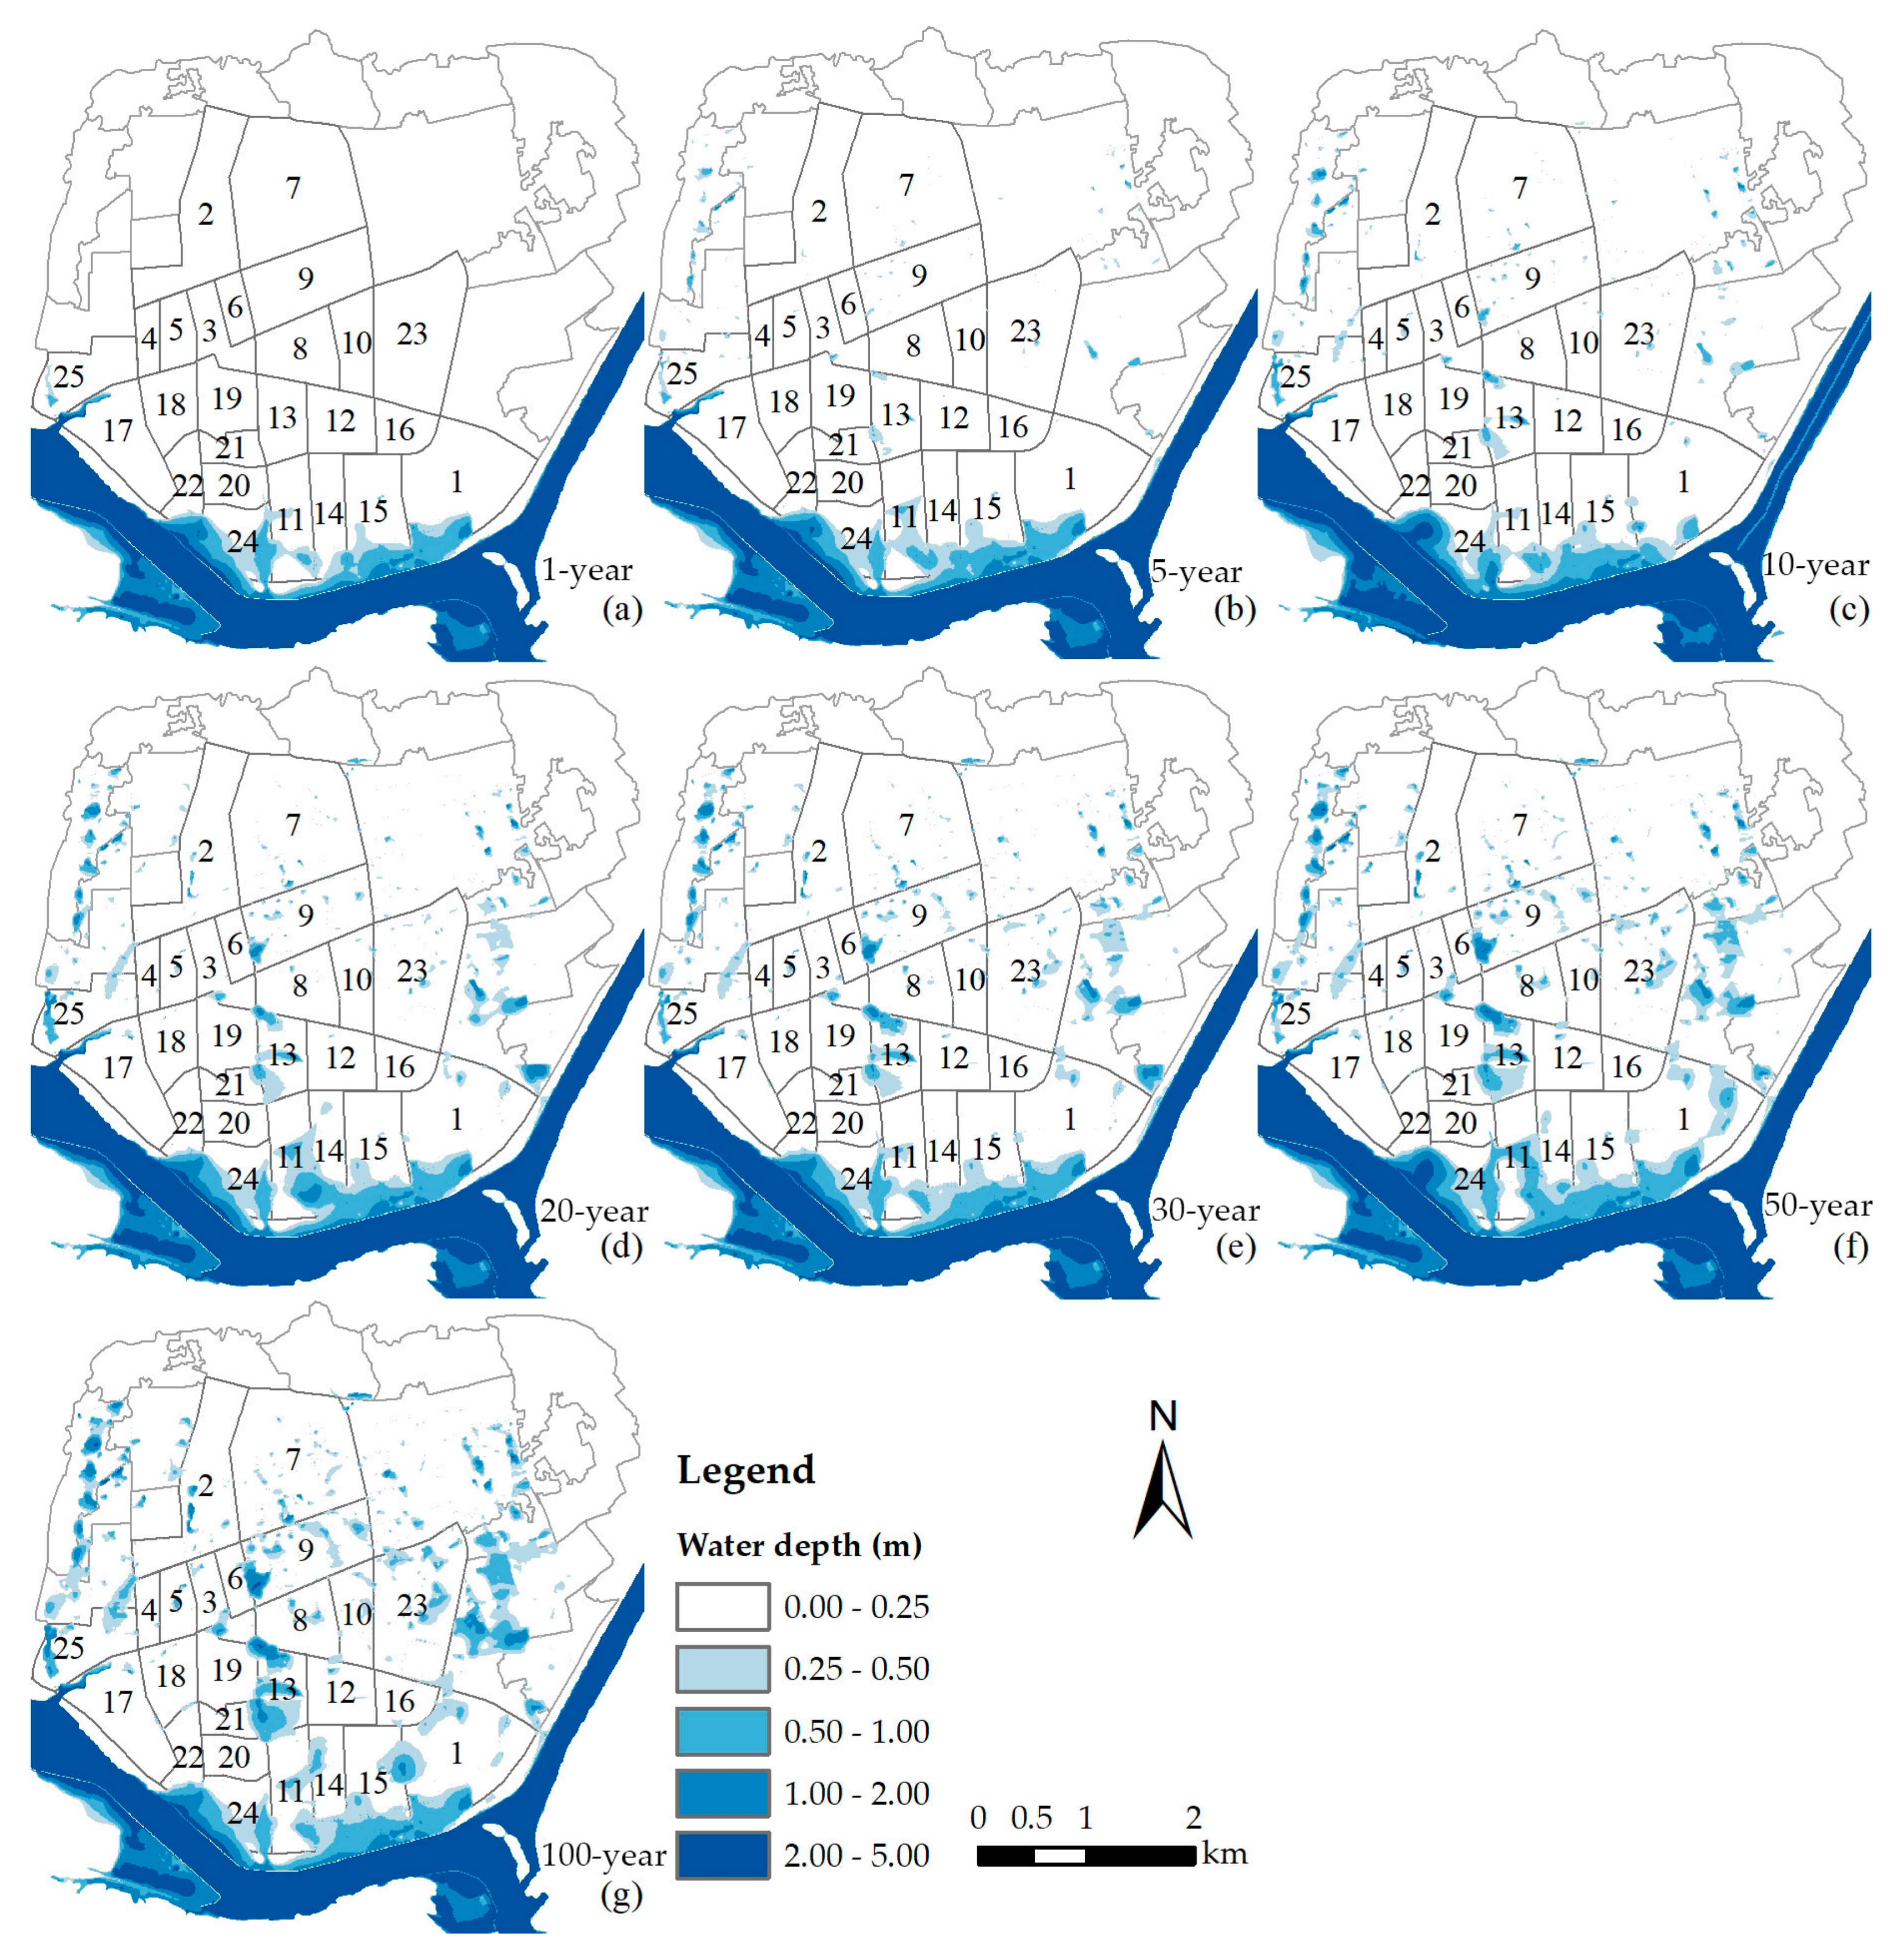
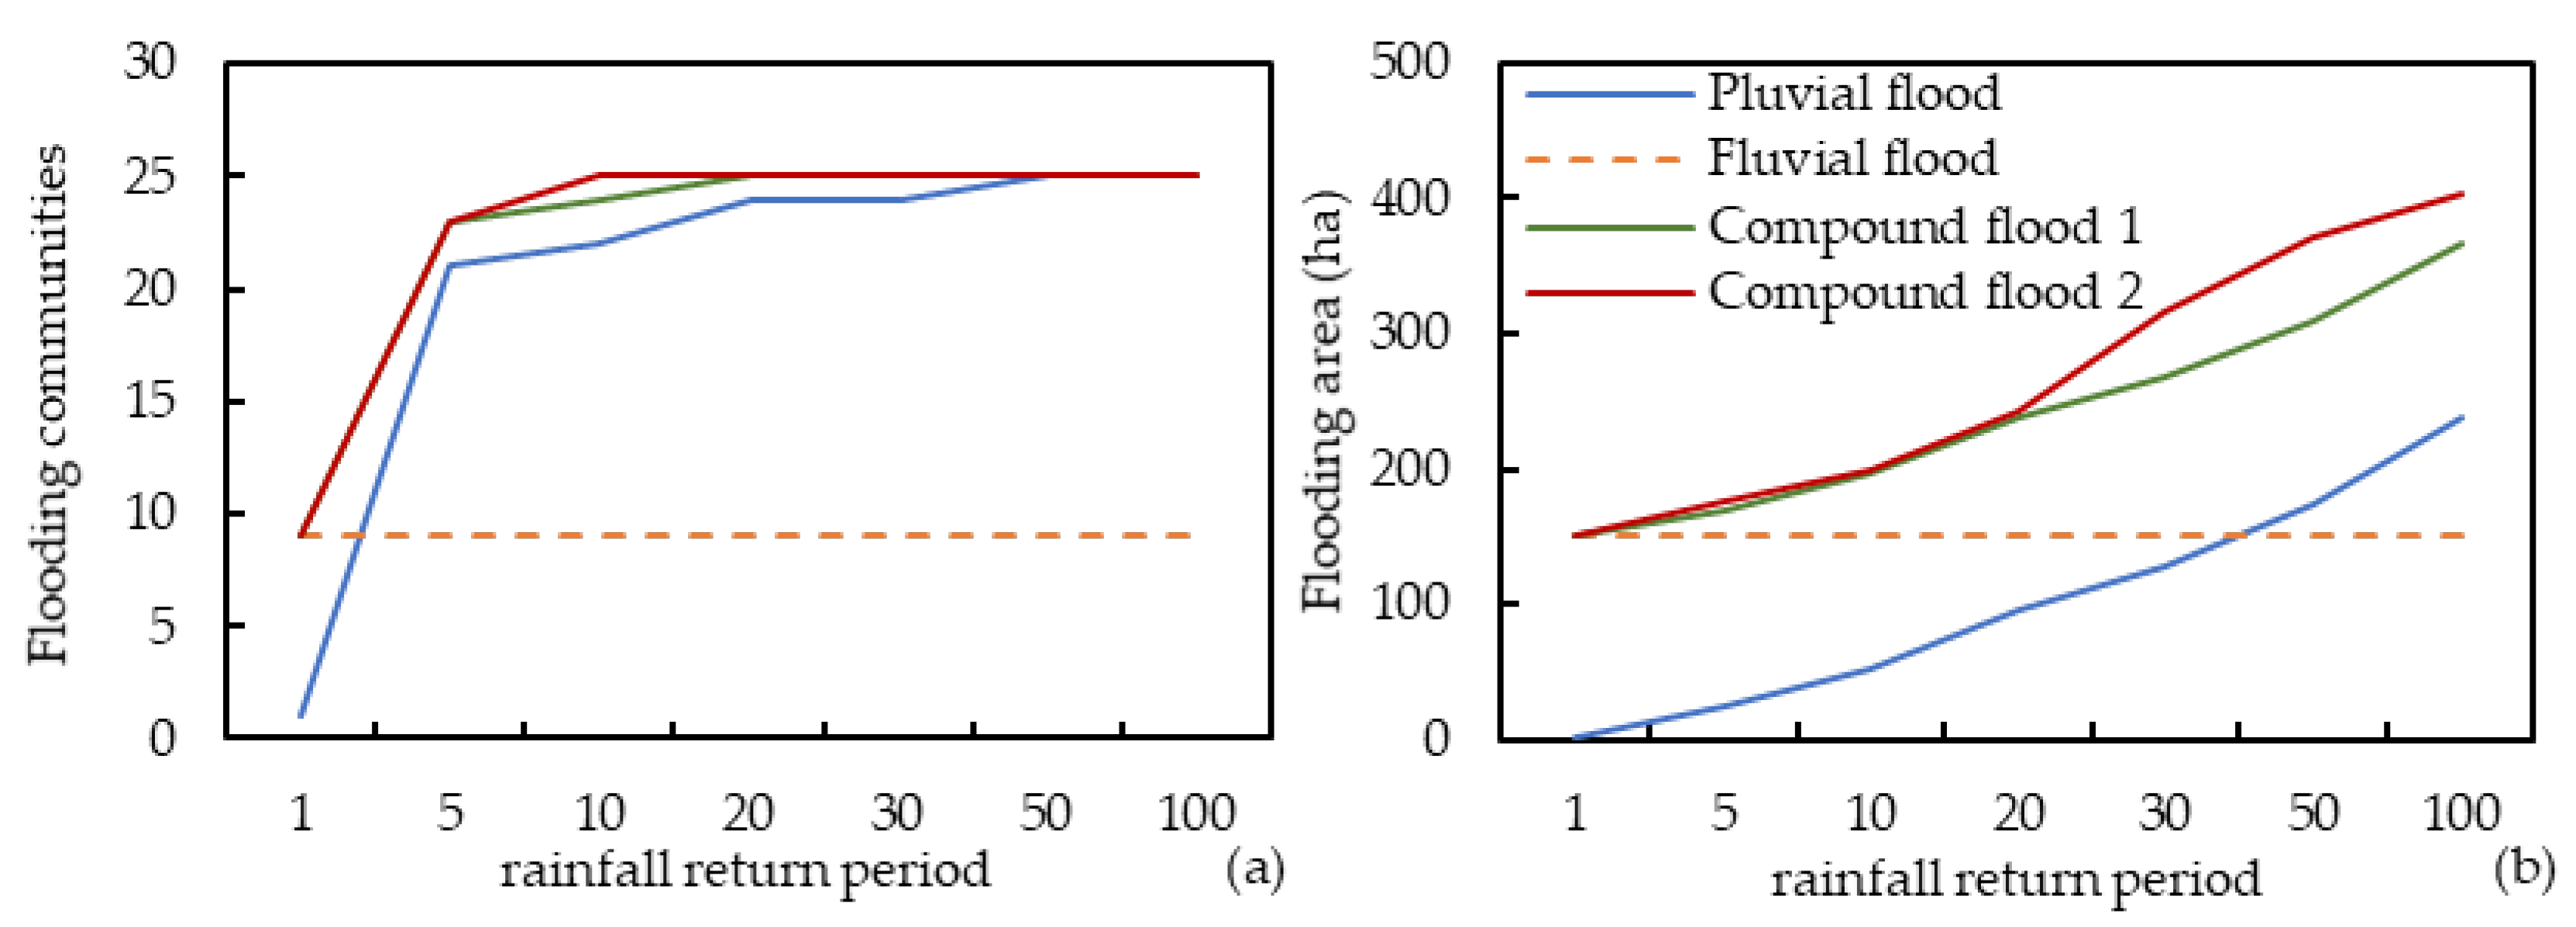
3.1. Flood Modeling
3.2. Exposure
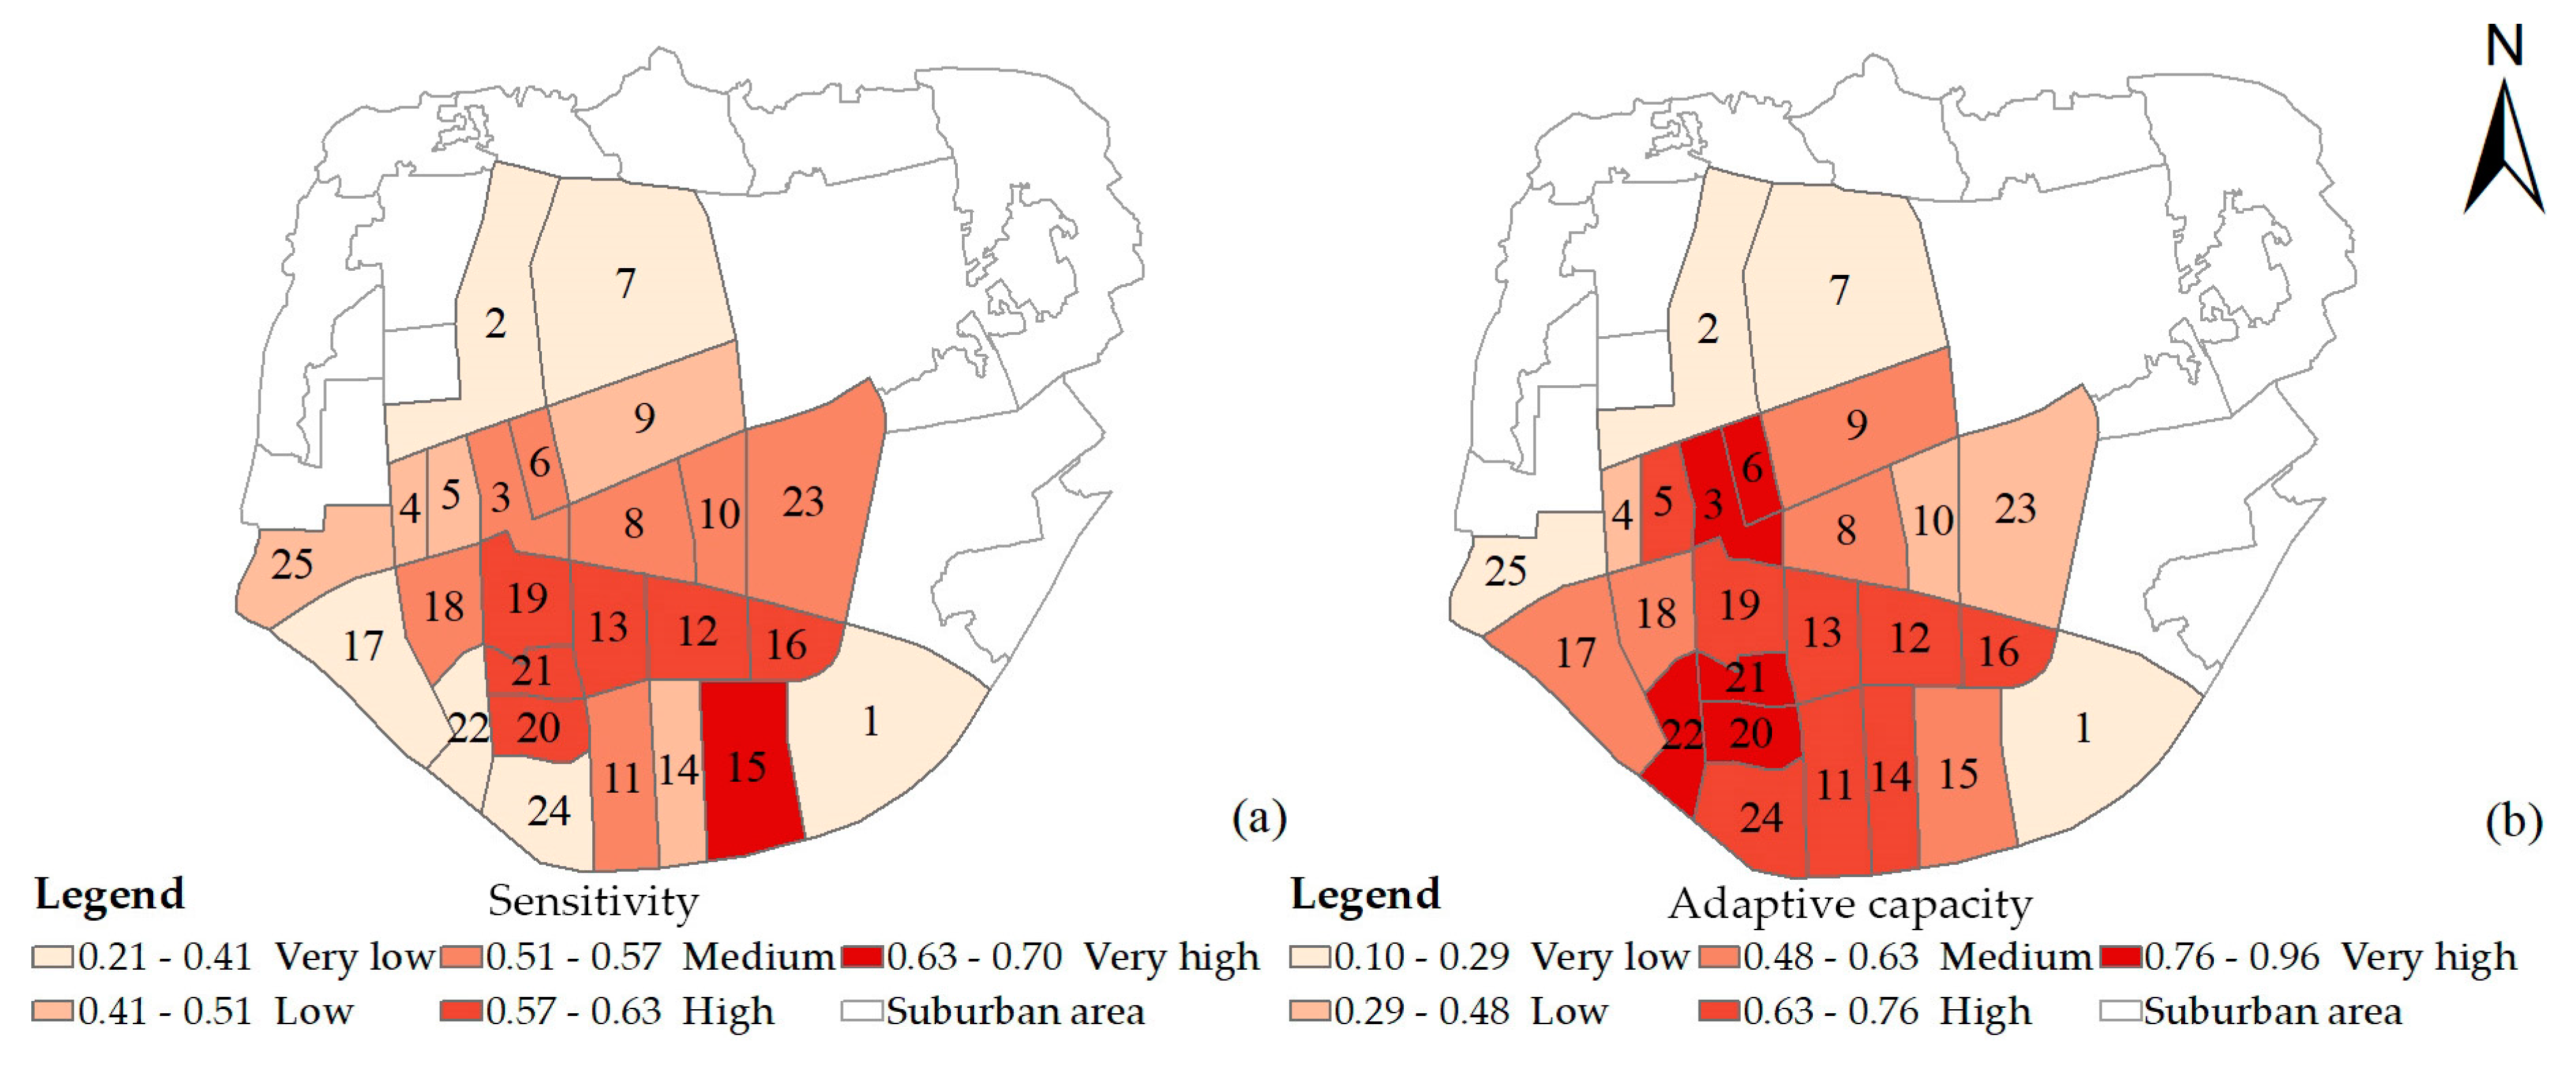
3.3. Sensitivity and Adaptive Capacity
3.4. Vulnerability Assessment
4. Discussion
5. Conclusions
Author Contributions
Funding
Acknowledgments
Conflicts of Interest
References
- Ziegler, A.D. Reduce urban flood vulnerability. Nature 2012, 481, 145. [Google Scholar] [CrossRef] [PubMed]
- Paprotny, D.; Sebastian, A.; Morales-Napoles, O.; Jonkman, S.N. Trends in flood losses in Europe over the past 150 years. Nat. Commun. 2018, 9, 1985. [Google Scholar] [CrossRef] [PubMed]
- Khajehei, S.; Ahmadalipour, A.; Shao, W.; Moradkhani, H. A Place-based Assessment of Flash Flood Hazard and Vulnerability in the Contiguous United States. Sci. Rep. 2020, 10, 448. [Google Scholar] [CrossRef] [PubMed] [Green Version]
- Ward, P.J.; Jongman, B.; Aerts, J.C.J.H.; Bates, P.D.; Botzen, W.J.W.; Diaz Loaiza, A.; Hallegatte, S.; Kind, J.M.; Kwadijk, J.; Scussolini, P.; et al. A global framework for future costs and benefits of river-flood protection in urban areas. Nat. Clim. Chang. 2017, 7, 642–646. [Google Scholar] [CrossRef]
- Tyler, J.; Sadiq, A.-A.; Noonan, D.S. A review of the community flood risk management literature in the USA: Lessons for improving community resilience to floods. Nat. Hazards 2019, 96, 1223–1248. [Google Scholar] [CrossRef]
- Sadiq, A.-A.; Tyler, J.; Noonan, D.S. A review of community flood risk management studies in the United States. Int. J. Disaster Risk Reduct. 2019, 41. [Google Scholar] [CrossRef]
- Alves, A.; Gersonius, B.; Kapelan, Z.; Vojinovic, Z.; Sanchez, A. Assessing the Co-Benefits of green-blue-grey infrastructure for sustainable urban flood risk management. J. Environ. Manag. 2019, 239, 244–254. [Google Scholar] [CrossRef]
- Chan, F.K.S.; Griffiths, J.A.; Higgitt, D.; Xu, S.; Zhu, F.; Tang, Y.-T.; Xu, Y.; Thorne, C.R. “Sponge City” in China—A breakthrough of planning and flood risk management in the urban context. Land Use Policy 2018, 76, 772–778. [Google Scholar] [CrossRef]
- Thorne, C.R.; Lawson, E.C.; Ozawa, C.; Hamlin, S.L.; Smith, L.A. Overcoming uncertainty and barriers to adoption of Blue-Green Infrastructure for urban flood risk management. J. Flood Risk Manag. 2018, 11, S960–S972. [Google Scholar] [CrossRef]
- Chang, S.E.; Yip, J.Z.K.; Conger, T.; Oulahen, G.; Marteleira, M. Community vulnerability to coastal hazards: Developing a typology for disaster risk reduction. Appl. Geogr. 2018, 91, 81–88. [Google Scholar] [CrossRef]
- Wu, W.; McInnes, K.; O’Grady, J.; Hoeke, R.; Leonard, M.; Westra, S. Mapping Dependence Between Extreme Rainfall and Storm Surge. J. Geophys. Res. Ocean. 2018, 123, 2461–2474. [Google Scholar] [CrossRef]
- Tanaka, T.; Kiyohara, K.; Tachikawa, Y. Comparison of fluvial and pluvial flood risk curves in urban cities derived from a large ensemble climate simulation dataset: A case study in Nagoya, Japan. J. Hydrol. 2020, 584. [Google Scholar] [CrossRef]
- Andrade, M.M.N.; Szlafsztein, C.F. Vulnerability assessment including tangible and intangible components in the index composition: An Amazon case study of flooding and flash flooding. Sci. Total Environ. 2018, 630, 903–912. [Google Scholar] [CrossRef] [PubMed]
- Tapia, C.; Abajo, B.; Feliu, E.; Mendizabal, M.; Martinez, J.A.; Fernández, J.G.; Laburu, T.; Lejarazu, A. Profiling urban vulnerabilities to climate change: An indicator-based vulnerability assessment for European cities. Ecol. Indic. 2017, 78, 142–155. [Google Scholar] [CrossRef]
- Muthusamy, M.; Rivas Casado, M.; Salmoral, G.; Irvine, T.; Leinster, P. A Remote Sensing Based Integrated Approach to Quantify the Impact of Fluvial and Pluvial Flooding in an Urban Catchment. Remote Sens. 2019, 11, 577. [Google Scholar] [CrossRef] [Green Version]
- Chen, A.S.; Djordjevic, S.; Leandro, J.; Savic, D.A. An analysis of the combined consequences of pluvial and fluvial flooding. Water Sci. Technol. 2010, 62, 1491–1498. [Google Scholar] [CrossRef] [PubMed]
- Patra, J.P.; Kumar, R.; Mani, P. Combined Fluvial and Pluvial Flood Inundation Modelling for a Project Site. Procedia Technol. 2016, 24, 93–100. [Google Scholar] [CrossRef] [Green Version]
- Hao, Z.; Singh, V.; Hao, F. Compound Extremes in Hydroclimatology: A Review. Water 2018, 10, 718. [Google Scholar] [CrossRef] [Green Version]
- Wahl, T.; Jain, S.; Bender, J.; Meyers, S.D.; Luther, M.E. Increasing risk of compound flooding from storm surge and rainfall for major US cities. Nat. Clim. Chang. 2015, 5, 1093–1097. [Google Scholar] [CrossRef]
- Paprotny, D.; Vousdoukas, M.I.; Morales-Nápoles, O.; Jonkman, S.N.; Feyen, L. Compound flood potential in Europe. Hydrol. Earth Syst. Sci. Discuss. 2018, 1–34. [Google Scholar] [CrossRef] [Green Version]
- Cutter, S.L.; Finch, C. Temporal and spatial changes in social vulnerability to natural hazards. Proc. Natl. Acad. Sci. USA 2008, 105, 2301–2306. [Google Scholar] [CrossRef] [Green Version]
- Turner, B.L.; Kasperson, R.E.; Matson, P.A.; McCarthy, J.J.; Corell, R.W.; Christensen, L.; Eckley, N.; Kasperson, J.X.; Luers, A.; Martello, M.L.; et al. A framework for vulnerability analysis in sustainability science. Proc. Natl. Acad. Sci. USA 2003, 100, 8074–8079. [Google Scholar] [CrossRef] [PubMed] [Green Version]
- Weis, S.W.M.; Agostini, V.N.; Roth, L.M.; Gilmer, B.; Schill, S.R.; Knowles, J.E.; Blyther, R. Assessing vulnerability: An integrated approach for mapping adaptive capacity, sensitivity, and exposure. Clim. Chang. 2016, 136, 615–629. [Google Scholar] [CrossRef] [Green Version]
- Aroca-Jimenez, E.; Bodoque, J.M.; Garcia, J.A.; Diez-Herrero, A. Construction of an integrated social vulnerability index in urban areas prone to flash flooding. Nat. Hazards Earth Syst. Sci. 2017, 17, 1541–1557. [Google Scholar] [CrossRef] [Green Version]
- Lins-de-Barros, F.M. Integrated coastal vulnerability assessment: A methodology for coastal cities management integrating socioeconomic, physical and environmental dimensions—Case study of Regido dos Lagos, Rio de Janeiro, Brazil. Ocean Coast. Manag. 2017, 149, 1–11. [Google Scholar] [CrossRef]
- Gigović, L.; Pamučar, D.; Bajić, Z.; Drobnjak, S. Application of GIS-Interval Rough AHP Methodology for Flood Hazard Mapping in Urban Areas. Water 2017, 9, 360. [Google Scholar] [CrossRef] [Green Version]
- Ghajari, Y.; Alesheikh, A.; Modiri, M.; Hosnavi, R.; Abbasi, M. Spatial Modelling of Urban Physical Vulnerability to Explosion Hazards Using GIS and Fuzzy MCDA. Sustainability 2017, 9, 1274. [Google Scholar] [CrossRef] [Green Version]
- Hu, S.; Cheng, X.; Zhou, D.; Zhang, H. GIS-based flood risk assessment in suburban areas: A case study of the Fangshan District, Beijing. Nat. Hazards 2017, 87, 1525–1543. [Google Scholar] [CrossRef]
- Martins, R.; Leandro, J.; Djordjević, S. Influence of sewer network models on urban flood damage assessment based on coupled 1D/2D models. J. Flood Risk Manag. 2018, 11, S717–S728. [Google Scholar] [CrossRef]
- Mignot, E.; Li, X.; Dewals, B. Experimental modelling of urban flooding: A review. J. Hydrol. 2019, 568, 334–342. [Google Scholar] [CrossRef] [Green Version]
- Wu, X.; Wang, Z.; Guo, S.; Liao, W.; Zeng, Z.; Chen, X. Scenario-based projections of future urban inundation within a coupled hydrodynamic model framework: A case study in Dongguan City, China. J. Hydrol. 2017, 547, 428–442. [Google Scholar] [CrossRef]
- Chen, A.S.; Leandro, J.; Djordjević, S. Modelling sewer discharge via displacement of manhole covers during flood events using 1D/2D SIPSON/P-DWave dual drainage simulations. Urban Water J. 2015, 13, 830–840. [Google Scholar] [CrossRef] [Green Version]
- Leandro, J.; Martins, R. A methodology for linking 2D overland flow models with the sewer network model SWMM 5.1 based on dynamic link libraries. Water Sci. Technol. 2016, 73, 3017–3026. [Google Scholar] [CrossRef]
- Parry, M.; Parry, M.L.; Canziani, O.; Palutikof, J.; Van der Linden, P.; Hanson, C. Climate Change 2007-Impacts, Adaptation and Vulnerability: Working Group II Contribution to the Fourth Assessment Report of the IPCC; Cambridge University Press: Cambridge, UK, 2007; Volume 4. [Google Scholar]
- Maleki, R.; Nooripoor, M.; Azadi, H.; Lebailly, P. Vulnerability Assessment of Rural Households to Urmia Lake Drying (the Case of Shabestar Region). Sustainability 2018, 10, 1862. [Google Scholar] [CrossRef] [Green Version]
- Hizbaron, D.R.; Hadmoko, D.S.; Mei, E.T.W.; Murti, S.H.; Laksani, M.R.T.; Tiyansyah, A.F.; Siswanti, E.; Tampubolon, I.E. Towards measurable resilience: Mapping the vulnerability of at-risk community at Kelud Volcano, Indonesia. Appl. Geogr. 2018, 97, 212–227. [Google Scholar] [CrossRef]
- Bates, P.; Trigg, M.; Neal, J.; Dabrowa, A. LISFLOOD-FP User Manual; University of Bristol: Bristol, UK, 2013. [Google Scholar]
- Gironás, J.; Roesner, L.A.; Rossman, L.A.; Davis, J. A new applications manual for the Storm Water Management Model(SWMM). Environ. Model. Softw. 2010, 25, 813–814. [Google Scholar]
- Zhu, X.; Dai, Q.; Han, D.; Zhuo, L.; Zhu, S.; Zhang, S. Modeling the high-resolution dynamic exposure to flooding in a city region. Hydrol. Earth Syst. Sci. 2019, 23, 3353–3372. [Google Scholar]
- Tsai, J. An Agent-Based Computing Method of Urban Vulnerability to Flood Hazard—A Case Study of Liandu, Lishui; Nanjing Normal University: Nanjing, China, 2019. [Google Scholar]
- Programme, U.N.D. Measuring Human Development: A Primer; United Nations Development Programme: New York, NY, USA, 2007. [Google Scholar]
- Saaty, T.L. A scaling method for priorities in hierarchical structures. J. Math. Psychol. 1977, 15, 234–281. [Google Scholar]
- Kittipongvises, S.; Phetrak, A.; Rattanapun, P.; Brundiers, K.; Buizer, J.L.; Melnick, R. AHP-GIS analysis for flood hazard assessment of the communities nearby the world heritage site on Ayutthaya Island, Thailand. Int. J. Disaster Risk Reduct. 2020, 48. [Google Scholar] [CrossRef]
- Oh, K.-Y.; Lee, M.-J.; Jeon, S.-W. Development of the Korean Climate Change Vulnerability Assessment Tool (VESTAP)—Centered on Health Vulnerability to Heat Waves. Sustainability 2017, 9, 1103. [Google Scholar] [CrossRef] [Green Version]
- De Smith, M.J.; Goodchild, M.F.; Longley, P. Geospatial Analysis: A Comprehensive Guide to Principles, Techniques and Software Tools; Troubador Publishing Ltd.: Leicester, UK, 2007. [Google Scholar]
- Hardy, R.D.; Hauer, M.E. Social vulnerability projections improve sea-level rise risk assessments. Appl. Geogr. 2018, 91, 10–20. [Google Scholar] [CrossRef] [Green Version]
- Frazier, T.G.; Thompson, C.M.; Dezzani, R.J. A framework for the development of the SERV model: A Spatially Explicit Resilience-Vulnerability model. Appl. Geogr. 2014, 51, 158–172. [Google Scholar] [CrossRef]
- Armaș, I.; Gavriș, A. Social vulnerability assessment using spatial multi-criteria analysis (SEVI model) and the Social Vulnerability Index (SoVI model)—A case study for Bucharest, Romania. Nat. Hazards Earth Syst. Sci. 2013, 13, 1481–1499. [Google Scholar] [CrossRef] [Green Version]

| Vulnerability Dimension | Dimension Weighting | Variable | Description | Variable Weighting |
|---|---|---|---|---|
| Exposure | 0.5 | Flooding area | Inundated area | 0.193 |
| Population | Flood-affected population | 0.544 | ||
| Commercial stores | Number of commercial stores in the flooding area | 0.193 | ||
| Building area | Area of structure, area of building footprint multiplied by number of floors | 0.07 | ||
| Sensitivity | 0.25 | Disabled population | Population of disabled people in the community | 0.203 |
| Elderly population | Population of people above the age of 65 in the community | 0.156 | ||
| Children | Population of people under the age of 12 | 0.150 | ||
| Low-income population | Population which receive basic living allowance from the local government | 0.083 | ||
| Elementary School | Number of elementary schools in the community | 0.136 | ||
| Nursing home | Number of nursing homes in the community | 0.126 | ||
| Distance to the chemical plant | Number of plants that can cause environmental pollution after flooding | 0.043 | ||
| Basement | Number of basements in community buildings | 0.043 | ||
| Channel | Average distance to river channel for the community | 0.020 | ||
| Elevation | Average elevation in the community | 0.020 | ||
| Reservoir | Average distance to nearest reservoir | 0.020 | ||
| Adaptive capacity | 0.25 | Flood risk awareness | Number of floods in the community | 0.153 |
| Hospital | Average distance to hospitals | 0.315 | ||
| Emergency shelter | Average distance to emergency shelters | 0.409 | ||
| Rescue station | Average distance to police and fire stations | 0.123 |
| Exposure Level | Rainfall | Fluvial Flood | ||||||
|---|---|---|---|---|---|---|---|---|
| 1-Year | 5-Year | 10-Year | 20-Year | 30-Year | 50-Year | 100-Year | ||
| Very Low [0.0–0.2] | All | All | Others | Others | Others | Others | Others | Others |
| Low (0.2–0.4] | - | - | 13 | 13 | 9 | 1, 9, 23 | 1, 7 | 1, 14 |
| Medium (0.4–0.6] | - | - | - | - | 13 | 13 | 9, 13, 23 | 11, 15, 24 |
| High (0.6–0.8] | - | - | - | - | - | - | - | - |
| Very high (0.8–1.0] | - | - | - | - | - | - | - | - |
| Exposure Level | Combined Fluvial and Pluvial Flooding According to Rainfall Level | ||||||
|---|---|---|---|---|---|---|---|
| 1-Year | 5-Year | 10-Year | 20-Year | 30-Year | 50-Year | 100-Year | |
| Very Low [0.0–0.2] | Others | Others | Others | Others | Others | Others | Others |
| Low (0.2–0.4] | 1, 14 | 1, 14 | 1, 13, 14 | 1, 13, 14 | 9, 14 | 9, 14, 23 | 7, 14 |
| Medium (0.4–0.6] | 11, 15, 24 | 11, 15, 24 | 11, 15, 24 | 11, 15, 24 | 1, 11, 13, 15, 24 | 1, 11, 13, 15, 24 | 1, 9, 11, 13, 15, 23, 24 |
| High (0.6–0.8] | - | - | - | - | - | - | - |
| Very high (0.8–1.0] | - | - | - | - | - | - | - |
| Exposure Level | Combined Fluvial and Pluvial Flooding According to Rainfall Level | ||||||
|---|---|---|---|---|---|---|---|
| 1-Year | 5-Year | 10-Year | 20-Year | 30-Year | 50-Year | 100-Year | |
| Very Low [0.0–0.2] | Others | Others | Others | Others | Others | Others | Others |
| Low (0.2–0.4] | 1, 14 | 1, 14 | 1, 13, 14 | 13, 14 | 9, 14 | 9, 14, 23 | 14 |
| Medium (0.4–0.6] | 11, 15, 24 | 11, 15, 24 | 11, 15, 24 | 1, 11, 15, 24 | 1, 11, 13, 15, 24 | 11, 13, 24 | 9, 11, 23, 24 |
| High (0.6–0.8] | - | - | - | - | - | 15 | 13, 15 |
| Very high (0.8–1.0] | - | - | - | - | - | 1 | 1 |
| Vulnerability Level | Rainfall | Fluvial Flood | ||||||
|---|---|---|---|---|---|---|---|---|
| 1-Year | 5-Year | 10-Year | 20-Year | 30-Year | 50-Year | 100-Year | ||
| Very Low [−0.25–−0.05] | 3, 6, 14, 20, 21, 22, 24 | 3, 6, 14, 20, 22, 24 | 3, 6, 14, 20, 22, 24 | 3, 6, 20, 22, 24 | 6, 20, 22, 24 | 6, 20, 22, 24 | 6, 20, 22, 24 | 3, 6, 20, 21 |
| Low (−0.05–0.15] | Others | Others | Others | Others | Others | Others | Others | Others |
| Medium (0.15–0.35] | - | - | - | - | 13, 25 | 1, 9, 13, 23, 25 | 1, 9, 13, 23, 25 | 1, 11, 15, 24 |
| High (0.35–0.55] | - | - | - | - | - | - | - | - |
| Very high (0.55–0.75] | - | - | - | - | - | - | - | - |
| Vulnerability Levels | Combined Fluvial and Pluvial Flooding According to Rainfall Level | ||||||
|---|---|---|---|---|---|---|---|
| 1-Year | 5-Year | 10-Year | 20-Year | 30-Year | 50-Year | 100-Year | |
| Very Low [−0.25–−0.05] | 3, 6, 20, 21 | 3, 6, 20 | 3, 6, 20 | 6, 20 | 6, 20 | 6, 20 | 6, 20 |
| Low (−0.05–0.15] | Others | Others | Others | Others | Others | Others | Others |
| Medium (0.15–0.35] | 1, 11, 15, 24 | 1, 11, 15, 24 | 1, 11, 15, 24 | 1, 11, 15, 24 | 1, 11, 13, 15, 24, 25 | 1, 9, 11, 13, 15, 23, 24, 25 | 1, 9, 11, 13, 15, 23, 24, 25 |
| High (0.35–0.55] | - | - | - | - | - | - | - |
| Very high (0.55–0.75] | - | - | - | - | - | - | - |
| Vulnerability Levels | Combined Fluvial and Pluvial Flooding According to Rainfall Level | ||||||
|---|---|---|---|---|---|---|---|
| 1-Year | 5-Year | 10-Year | 20-Year | 30-Year | 50-Year | 100-Year | |
| Very Low [−0.25–−0.05] | 3, 6, 20, 21, 22 | 3, 6, 20, 22 | 3, 6, 20 | 3, 6, 20 | 6, 20 | 6, 20 | 6, 20 |
| Low (−0.05–0.15] | Others | Others | Others | Others | Others | Others | Others |
| Medium (0.15–0.35] | 1, 11, 15, 24 | 1, 11, 15, 24 | 1, 11, 15, 24, 25 | 1, 11, 13, 15, 24, 25 | 1, 11, 13, 15, 24, 25 | 9, 11, 13, 23, 24, 25 | 9, 11, 13, 23, 24, 25 |
| High (0.35–0.55] | - | - | - | - | - | 1, 15 | 15 |
| Very high (0.55–0.75] | - | - | - | - | - | - | 1 |
© 2020 by the authors. Licensee MDPI, Basel, Switzerland. This article is an open access article distributed under the terms and conditions of the Creative Commons Attribution (CC BY) license (http://creativecommons.org/licenses/by/4.0/).
Share and Cite
Yang, Q.; Zhang, S.; Dai, Q.; Yao, R. Assessment of Community Vulnerability to Different Types of Urban Floods: A Case for Lishui City, China. Sustainability 2020, 12, 7865. https://doi.org/10.3390/su12197865
Yang Q, Zhang S, Dai Q, Yao R. Assessment of Community Vulnerability to Different Types of Urban Floods: A Case for Lishui City, China. Sustainability. 2020; 12(19):7865. https://doi.org/10.3390/su12197865
Chicago/Turabian StyleYang, Quntao, Shuliang Zhang, Qiang Dai, and Rui Yao. 2020. "Assessment of Community Vulnerability to Different Types of Urban Floods: A Case for Lishui City, China" Sustainability 12, no. 19: 7865. https://doi.org/10.3390/su12197865
APA StyleYang, Q., Zhang, S., Dai, Q., & Yao, R. (2020). Assessment of Community Vulnerability to Different Types of Urban Floods: A Case for Lishui City, China. Sustainability, 12(19), 7865. https://doi.org/10.3390/su12197865