Comparative Analysis on Environmental Adaptability of Two Types of Bank Stabilization Structures along the Middle and Lower Reaches of the Yangtze River


Abstract
:1. Introduction
2. Materials and Methods
2.1. Sites and Basic Information of Sampling Points
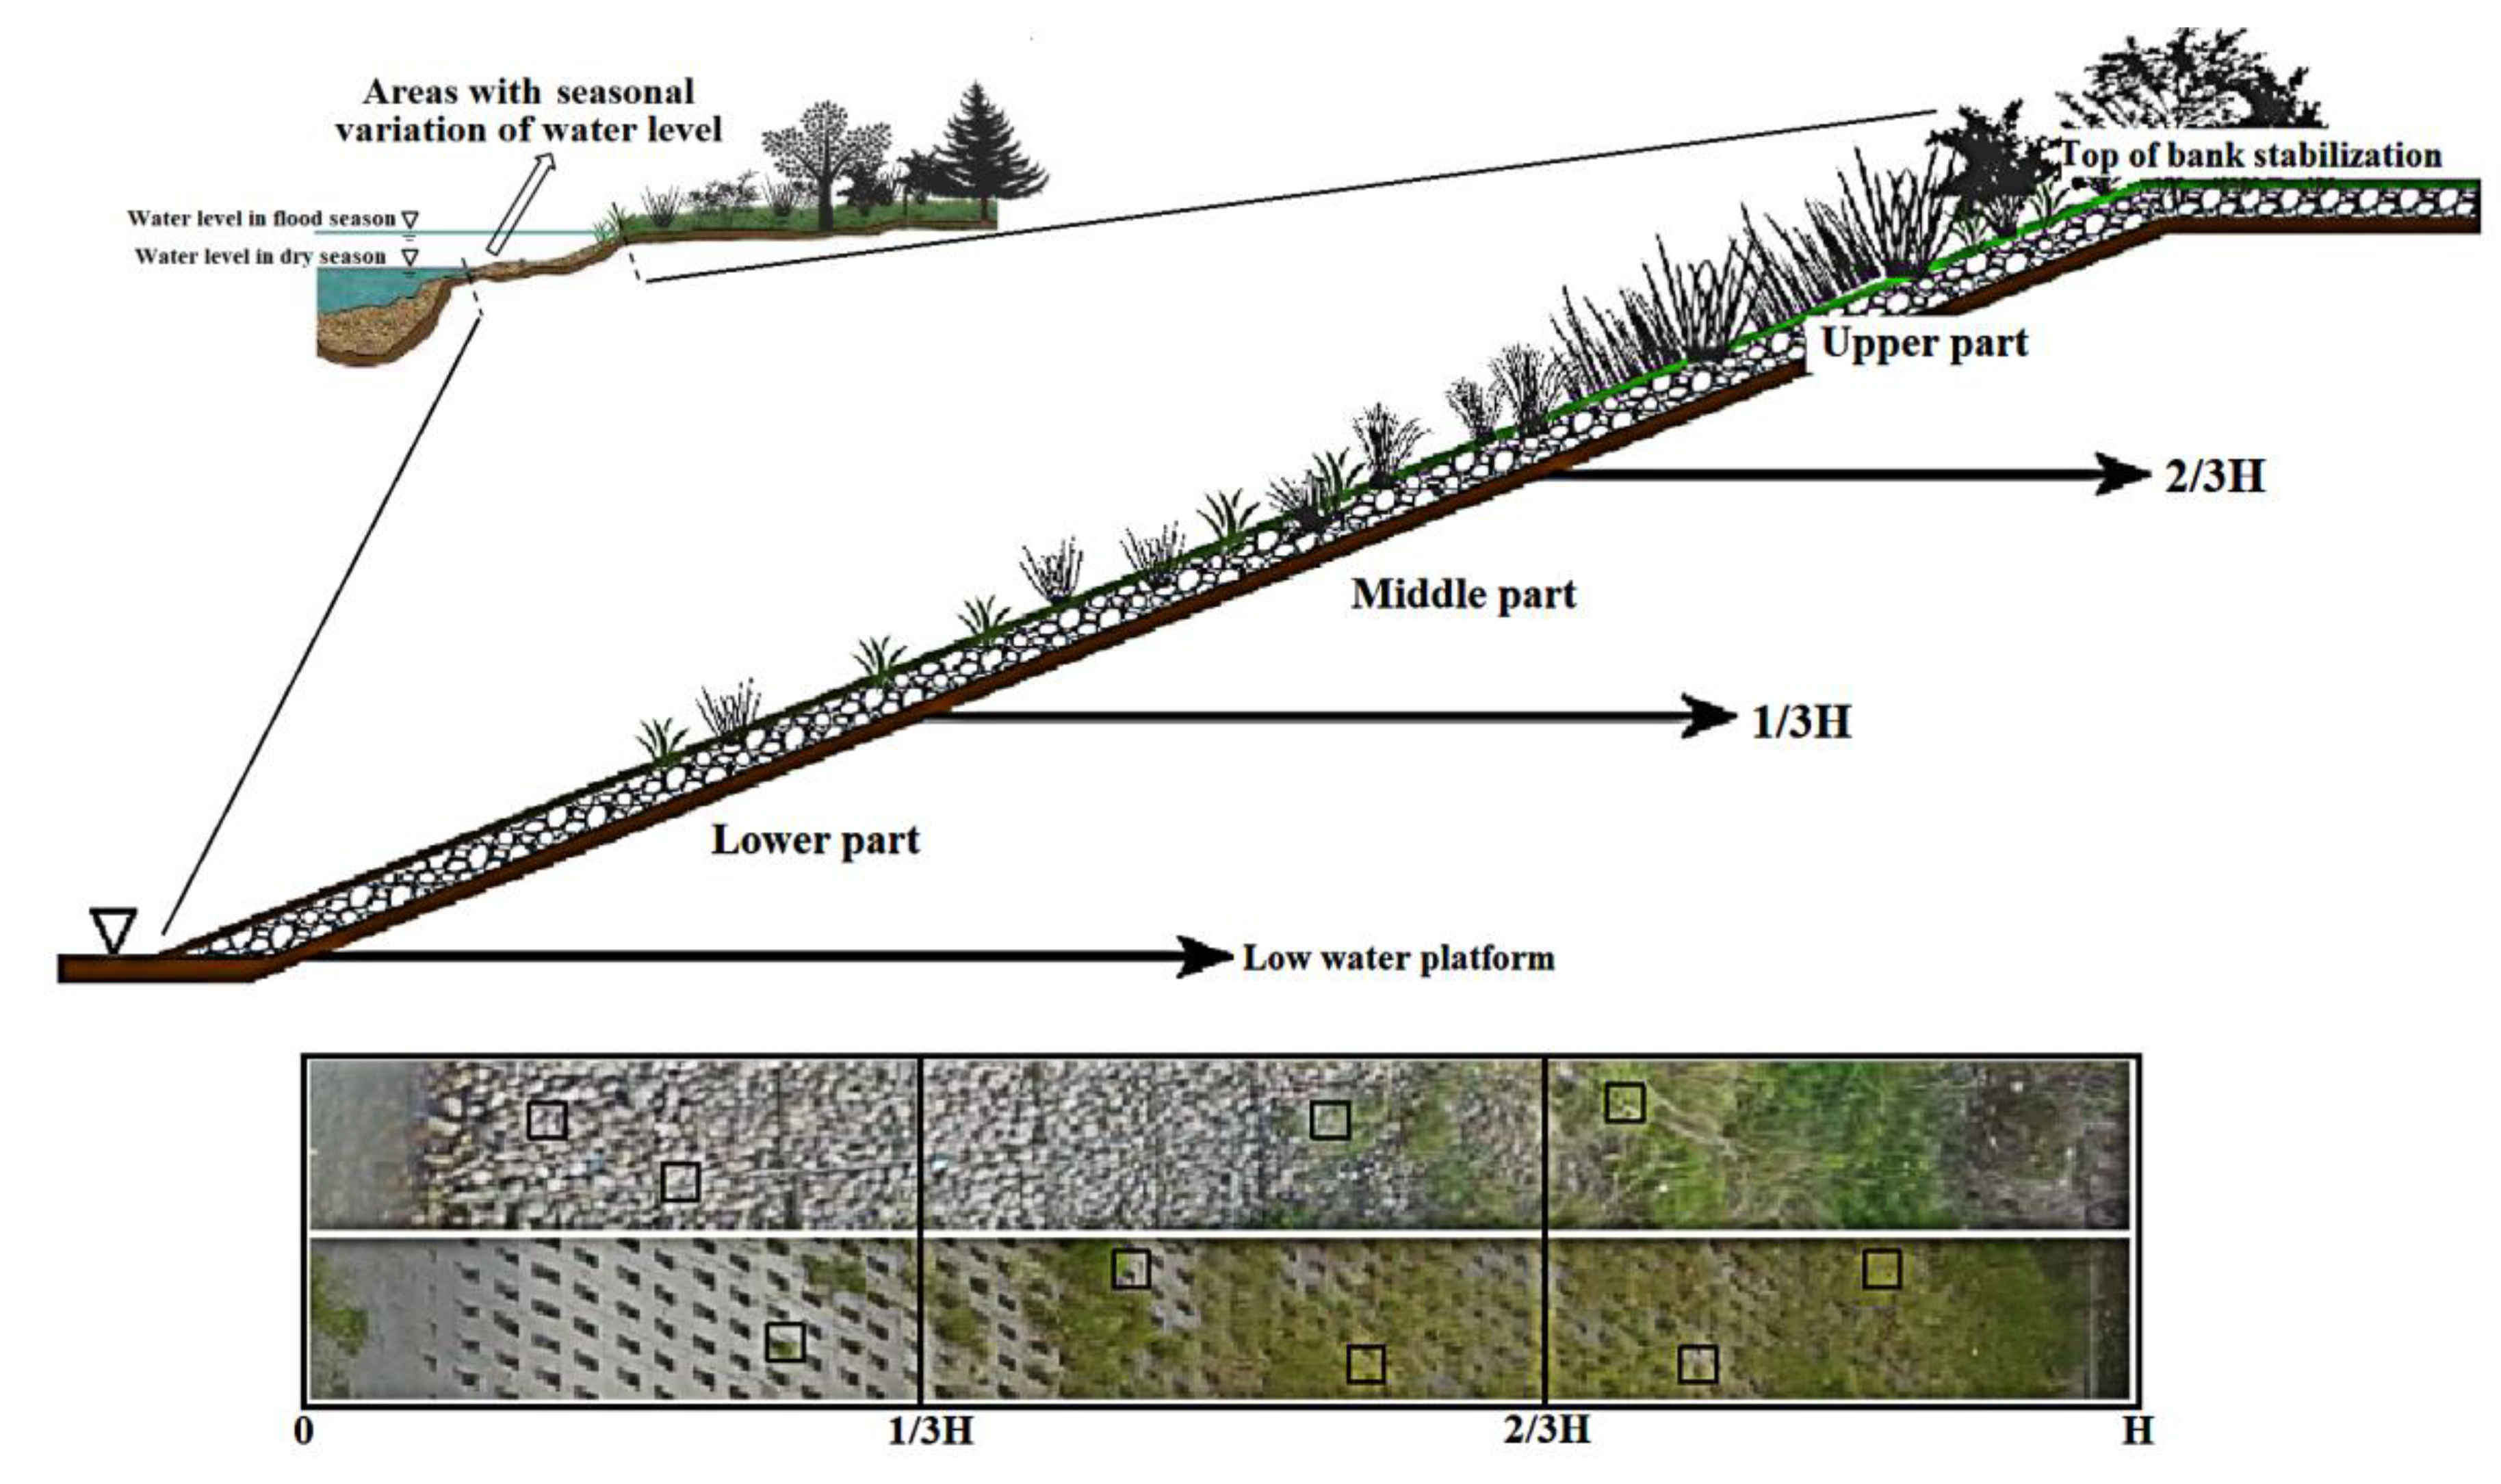
2.2. Introduction of Bank Stabilization Structures
2.3. Methods
2.3.1. Field Investigation
2.3.2. Calculation of Vegetation Succession Characteristic Index and Determination of Physical and Selected Chemical Properties of Substrate
2.3.3. Data Analysis
3. Results
3.1. Vegetation
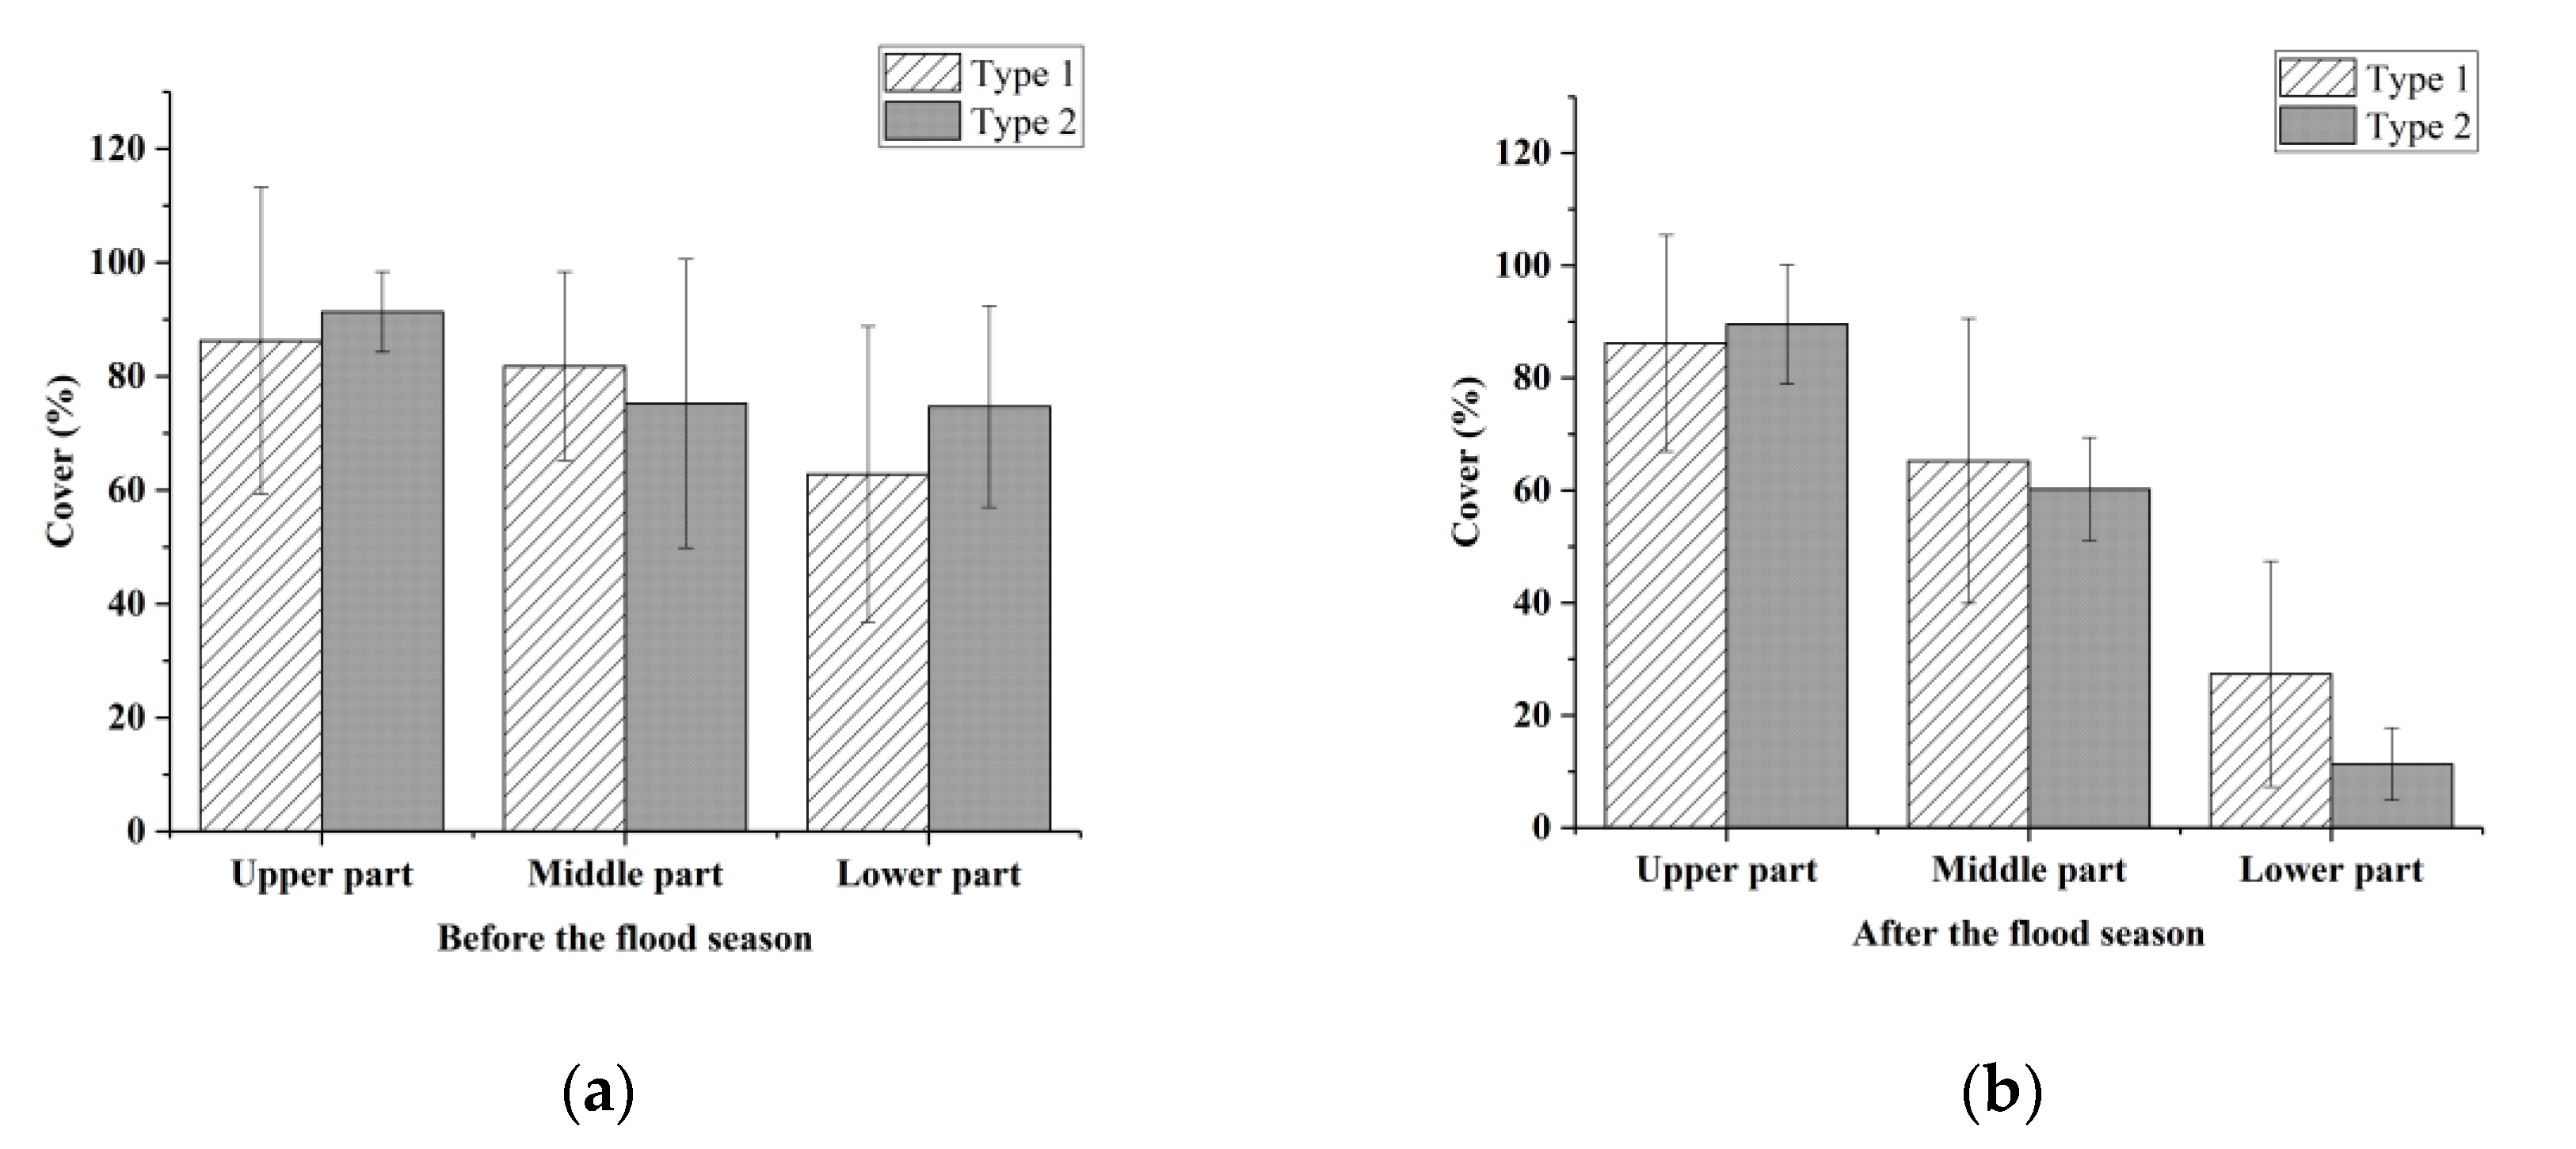
3.1.1. Cover
3.1.2. Average Height
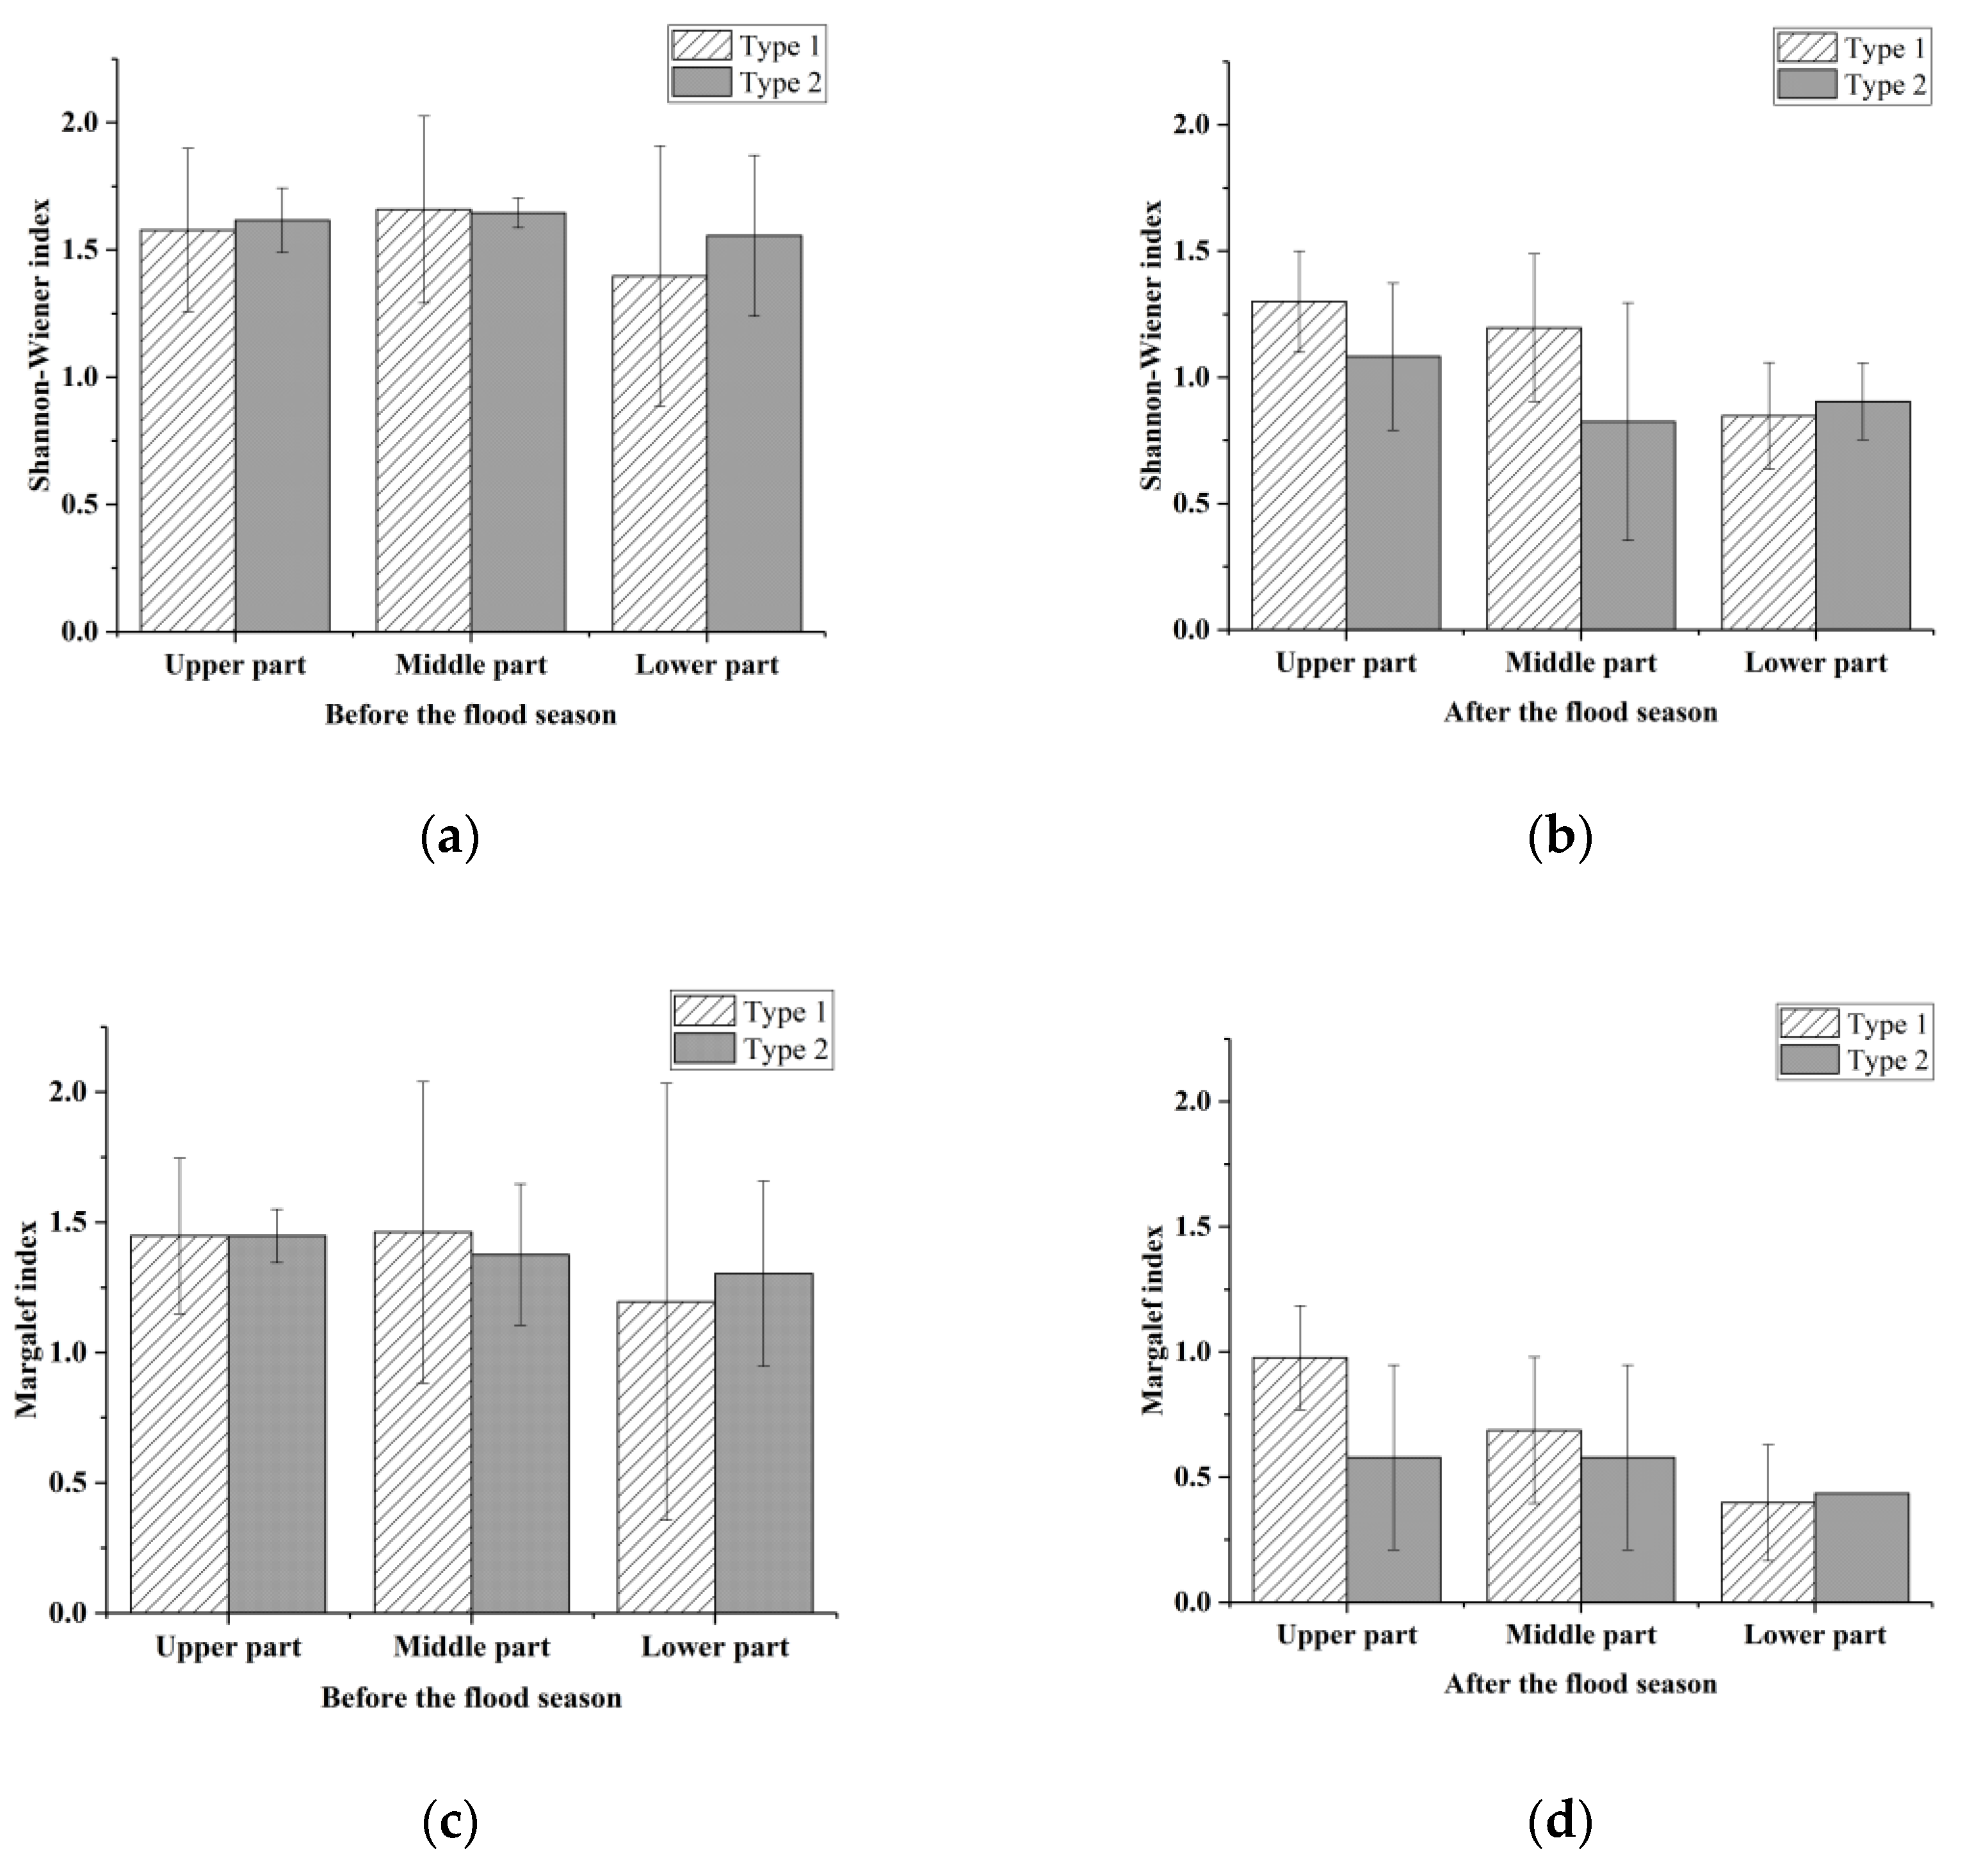
3.1.3. Species Diversity Index
3.2. Substrate
3.2.1. Substrate Composition
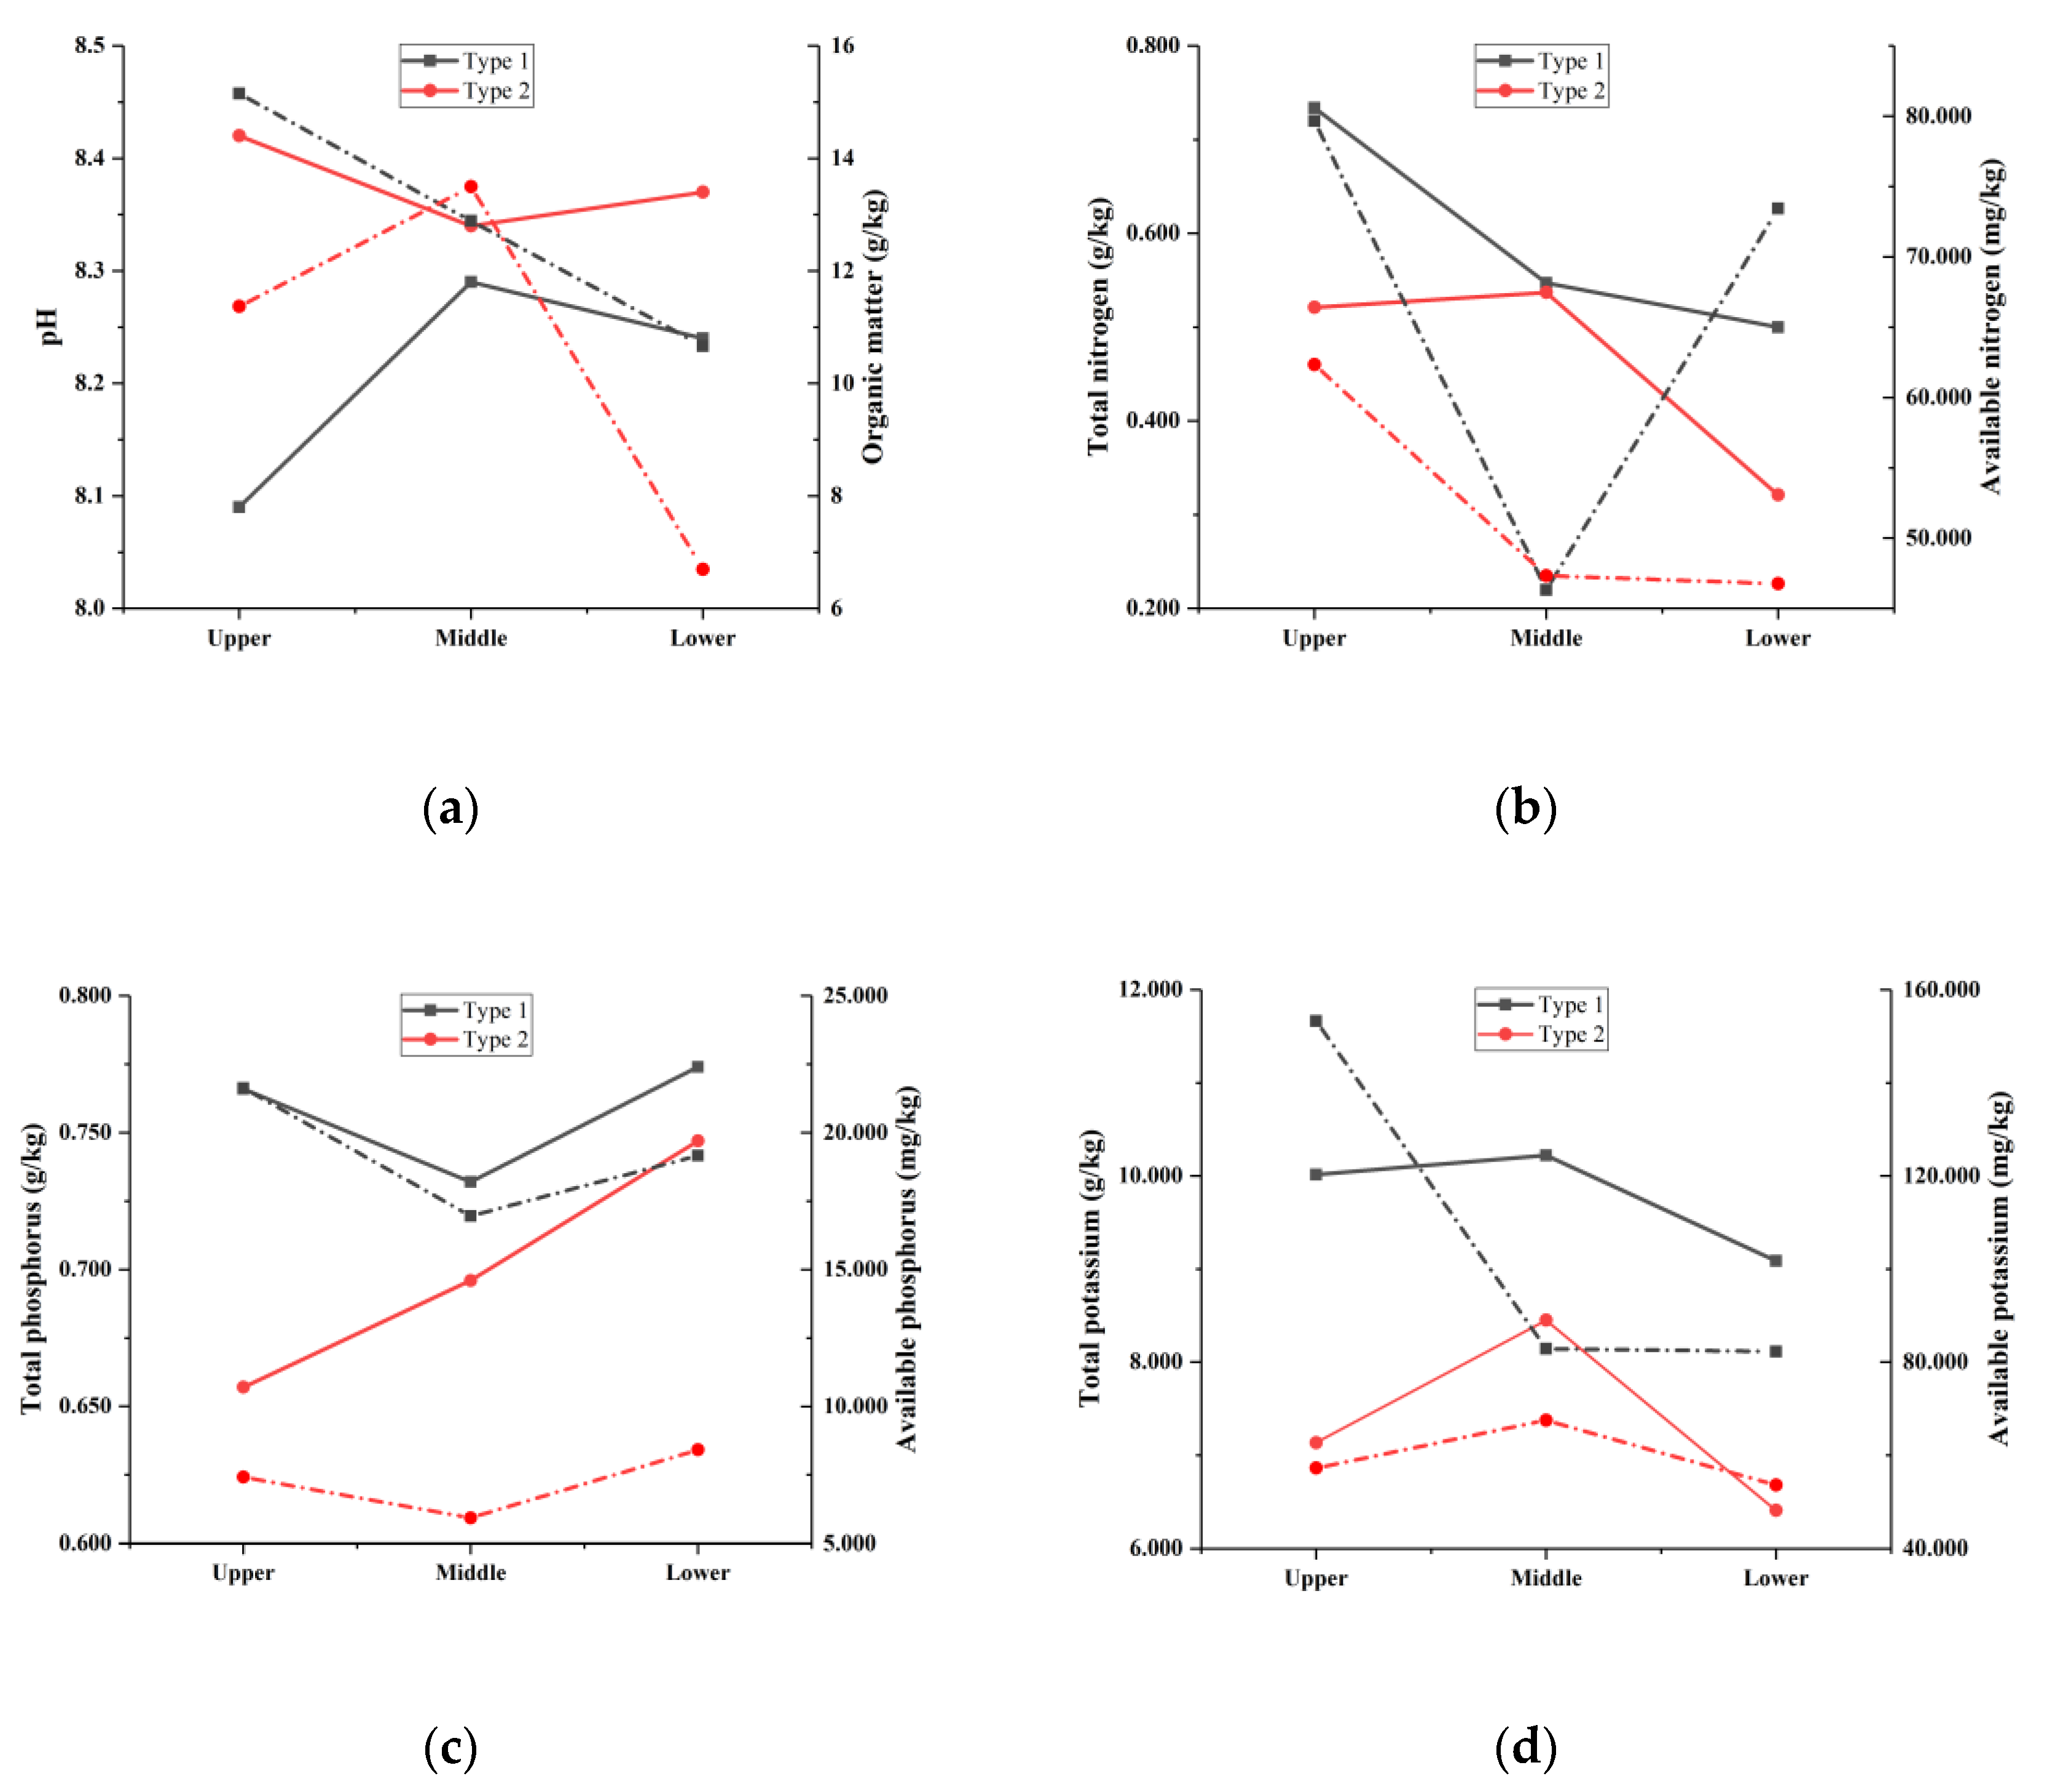
3.2.2. Substrate Nutrients
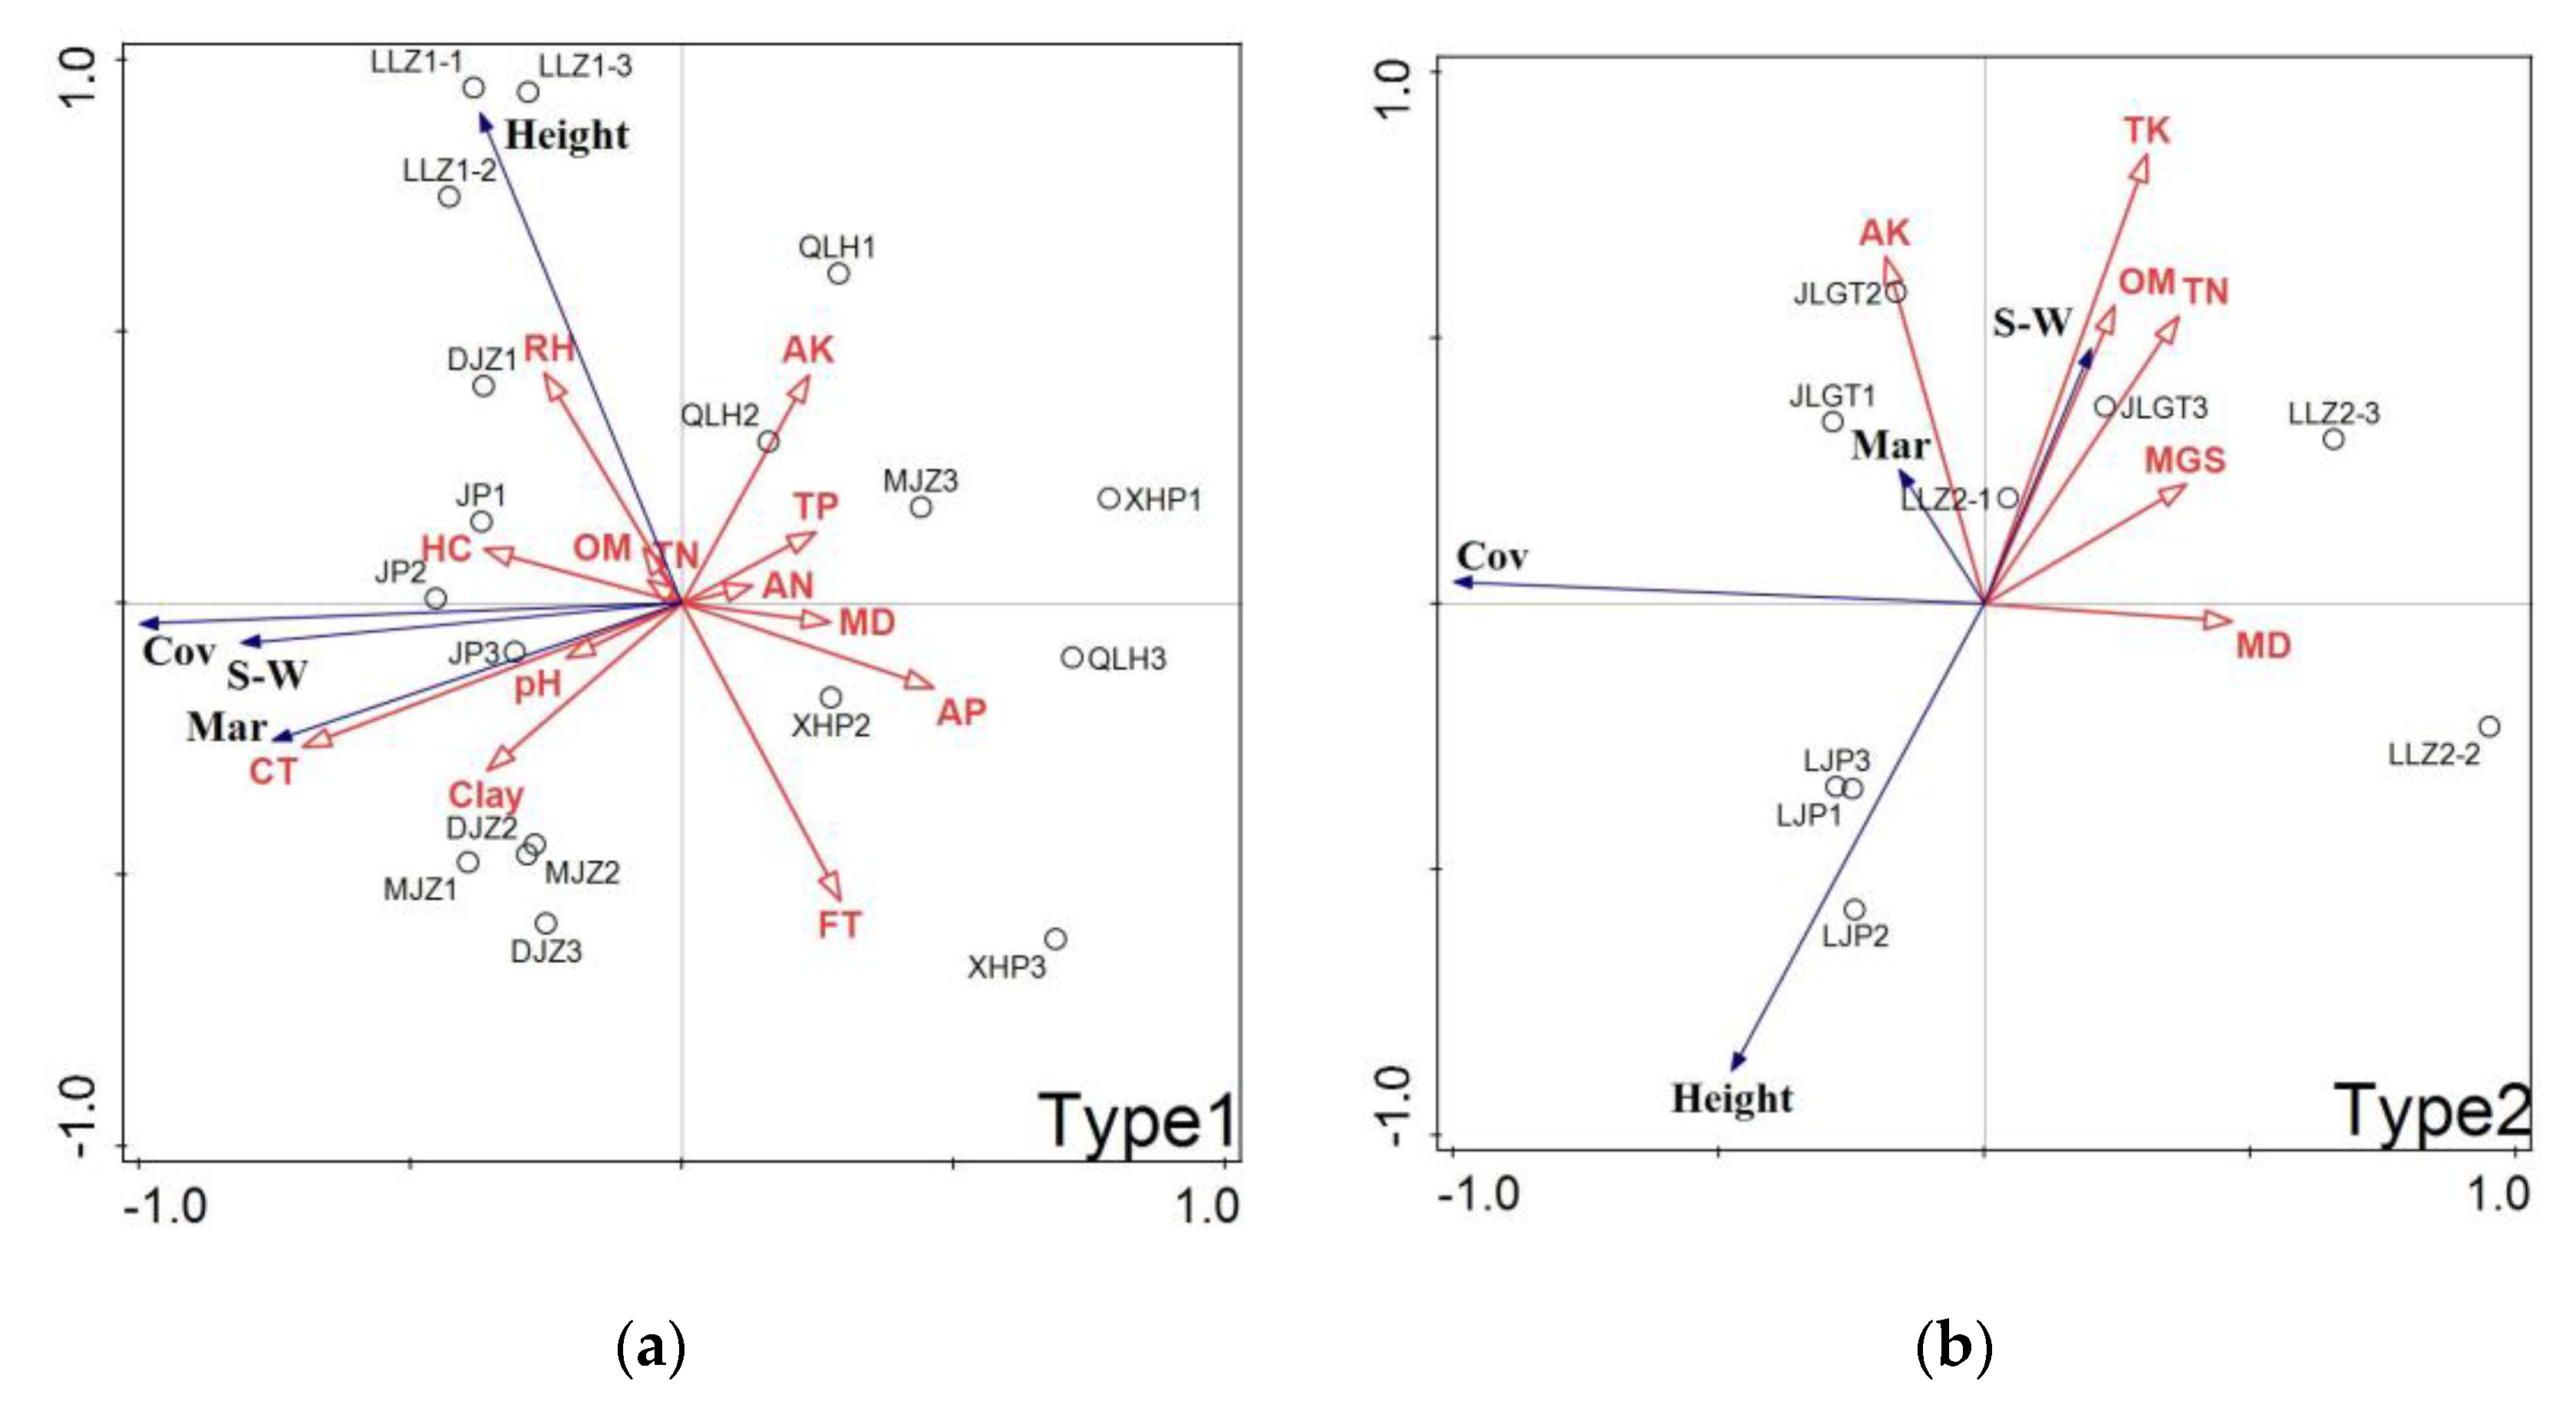
3.3. Effects of Environmental Impact Factors on Biotic Indices
4. Discussion
4.1. Comparison of Two Types on Vegetation and Substrate
4.2. Comparison of the Two Types under RDA Results
5. Conclusions
Author Contributions
Funding
Acknowledgments
Conflicts of Interest
References
- Zhang, J.; Peng, B. Study on riparian zone and the restoration and rebuilding of its degraded ecosystem. Acta Ecol. Sin. 2003, 23, 56–63. [Google Scholar]
- Feld, C.K.; Birk, S.; Bradley, D.C.; Hering, D.; Kail, J.; Marzin, A.; Melcher, A.; Nemitz, D.; Pedersen, M.L.; Pletterbauer, F.; et al. From natural to degraded rivers and back again: A test of restoration ecology theory and practice. Adv. Ecol. Res. 2011, 44, 119–209. [Google Scholar]
- Kenwick, R.A.; Shammin, R.; Sullivan, W.C. Preferences for riparian buffers. Landsc. Urban Plan. 2009, 91, 88–96. [Google Scholar] [CrossRef]
- Osman, N.; Barakbah, S.S. The effect of plant succession on slope stability. Ecol. Eng. 2011, 37, 139–147. [Google Scholar] [CrossRef]
- Stromberg, J.C. Restoration of riparian vegetation in the south-western United States: Importance of flow regimes and fluvial dynamism. J. Arid Environ. 2001, 49, 17–34. [Google Scholar] [CrossRef] [Green Version]
- Chen, P. Application analysis of ecological slope protection in river training. Eng. Technol. Res. 2020, 5, 277–278. [Google Scholar]
- Li, M.; Eddleman, K.E. Biotechnical engineering as an alternative to traditional engineering methods: A biotechnical streambank stabilization design approach. Landsc. Urban Plan. 2002, 60, 225–242. [Google Scholar] [CrossRef]
- Wyzga, B. A geomorphologist’s criticism of the engineering approach to channelization of Gravel-Bed rivers: Case study of the Raba river. Polish Carpathians. Environ. Manag. 2001, 28, 341–358. [Google Scholar] [CrossRef]
- Nakamura, F.; Jitsu, M.; Kameyama, S.; Mizugaki, S. Changes in riparian forests in the Kushiro Mire, Japan, associated with stream channelization. River Res. Appl. 2002, 18, 65–79. [Google Scholar] [CrossRef]
- Osugi, T.; Tate, S.; Takemura, K.; Watanabe, W.; Ogura, N.; Kikkawa, J. Ecological research for the restoration and management of rivers and reservoirs in Japan. Landsc. Ecol. Eng. 2007, 3, 159–170. [Google Scholar] [CrossRef]
- Breton, V.; Forestier, O.; Guindon, O.; Evette, A. Ecological restoration under pressure from invasive animal species: Use of Salicaceae cuttings in a river bank overrun by coypu. River Res. Appl. 2014, 30, 1002–1012. [Google Scholar] [CrossRef]
- Cavaillé, P.; Dommanget, F.; Daumergue, N.; Loucougaray, G.; Spiegelberger, T.; Tabacchi, E.; Evette, A. Biodiversity assessment following a naturality gradient of riverbank protection structures in French prealps rivers. Ecol. Eng. 2013, 53, 23–30. [Google Scholar] [CrossRef] [Green Version]
- Tisserant, M.; Janssen, P.; Evette, A.; González, E.; Cavaillé, P.; Poulin, M. Diversity and succession of riparian plant communities along riverbanks bioengineered for erosion control: A case study in the foothills of the Alps and the Jura Mountains. Ecol. Eng. 2020, 152, 105880. [Google Scholar] [CrossRef]
- Cavaillé, P.; Ducasse, L.; Breton, V.; Dommanget, F.; Tabacchi, E.; Evette, A. Functional and taxonomic plant diversity for riverbank protection works: Bioengineering techniques close to natural banks and beyond hard engineering. J. Environ. Manag. 2015, 151, 65–75. [Google Scholar] [CrossRef] [PubMed]
- Sudduth, E.B.; Meyer, J.L. Effects of bioengineered streambank stabilization on bank habitat and macroinvertebrates in urban streams. Environ. Manag. 2006, 38, 218–226. [Google Scholar] [CrossRef]
- Li, X.; Zhang, L.; Zhang, Z. Soil bioengineering and the ecological restoration of riverbanks at the Airport Town, Shanghai, China. Ecol. Eng. 2006, 26, 304–314. [Google Scholar] [CrossRef]
- Cheng, L.; Deng, H.; He, S.; Gu, L.; Qu, H. Distribution patterns and diversity of plant communities in fluctuating areas of Chongqing section of Yangtze river. Chin. J. Ecol. 2019, 38, 3626–3634. [Google Scholar]
- Giupponi, L.; Borgonovo, G.; Giorgi, A.; Bischetti, G.B. How to renew soil bioengineering for slope stabilization: Some proposals. Landsc. Ecol. Eng. 2019, 15, 37–50. [Google Scholar] [CrossRef]
- Jankauskas, B.; Jankauskienė, G.; Fullen, M.A.; Booth, C.A. The Effects of Biogeotextiles on the Stabilization of Roadside Slopes in Lithuania. Balt. J. Road Bridge Eng. 2008, 3, 175–180. [Google Scholar] [CrossRef]
- Furey, P.; Nordin, R.; Mazumder, A. Water Level Drawdown Affects Physical and Biogeochemical Properties of Littoral Sediments of a Reservoir and a Natural Lake. Lake Reserv. Manag. 2004, 20, 280–295. [Google Scholar] [CrossRef]
- Zhang, G.; Zhang, J.; Wang, Y.; Shao, Y. Preliminary study on eco-slope protection with stone cage under river scouring. Hydro-Sci. Eng. 2018, 112–119. [Google Scholar]
- Tong, D.; Li, S.; Song, X.; Qiu, X. Application of Articulated Ecological Revetment Block in Water Environment Revetment Project. Yellow River 2012, 34, 12–13. [Google Scholar]
- Yousaf, A.; Shabbir, R.; Jabeen, A.; Erum, S.; Ahmad, S.S. Linkage between herbaceous vegetation and soil characteristics along rawal dam islamabad. J. Soil Sci. Plant Nutr. 2016, 16, 88–100. [Google Scholar] [CrossRef] [Green Version]
- Zhang, L.; Su, Z.; Chen, B. Altitudinal Patterns of Species Diversity in the Montane Forest Communities: A Review. J. Mt. Sci. Engl. 2005, 23, 736–743. [Google Scholar]
- Zhang, J.; Zheng, B.; Liu, L.; Wang, L.; Huang, M.; Wu, G. Seasonal variation of phytoplankton in the DaNing River and its relationships with environmental factors after impounding of the Three Gorges Reservoir: A four-year study. Proc. Environ. Sci. 2010, 2, 1479–1490. [Google Scholar] [CrossRef] [Green Version]
- Li, S.; Deng, Y.; Shi, F.; Hu, M.; Pang, B.; Wang, C.; Li, K.; Chen, M.; Peng, W.; Qu, X.; et al. Research progress of water-level-flucutation zones. Wetland Sci. 2019, 17, 689–696. [Google Scholar]
- Abernethy, V.J.; Willby, N.J. Changes along a disturbance gradient in the density and composition of propagule banks in floodplain aquatic habitats. Plant Ecol. 1999, 140, 177–190. [Google Scholar] [CrossRef]
- Dyakov, N.R. Gradient analysis of vegetation on the south slope of Vitosha mountain, Southwest Bulgaria. Appl. Ecol. Environ. Res. 2014, 12, 1003–1025. [Google Scholar] [CrossRef]
- Ma, T.; Deng, X.; Chen, L.; Xiang, W. The soil properties and their effects on plant diversity in different degrees of rocky desertification. Sci. Total Environ. 2020, 736, 139667. [Google Scholar] [CrossRef]
- Bourgeois, B.; Boutin, C.; Vanasse, A.; Poulin, M. Divergence between riparian seed banks and standing vegetation increases along successional trajectories. J. Veg. Sci. 2017, 28, 787–797. [Google Scholar] [CrossRef]
- Nilsson, C.; Gardfjell, M.; Grelsson, G. Importance of hydrochory in structuring plant communities along rivers. Botany 1991, 69, 2631–2633. [Google Scholar] [CrossRef]
- Zhang, W.; Zhang, Y. The green-to-yellow zone phenomenon and its application on ecological revetment in the middle and lower reaches of Yangtze River. China Harb. Eng. 2018, 38, 22–27. [Google Scholar]


| Sites | Type | Construction Work Time | Sampling Time before the Flood | Sampling Time after the Flood | Pioneer Vegetation |
|---|---|---|---|---|---|
| LLZ1 | 1 | 2014.06 | 2019.4.18 | 2019.10.09 | Cynodon dactylon |
| LLZ2 | 2 | 2014.06 | 2019.4.18 | 2019.10.09 | Cynodon dactylon |
| MJZ | 1 | 2012.06 | 2019.4.19 | 2019.10.10 | Natural restoration |
| JLGT | 2 | 2012.10 | 2019.4.19 | 2019.10.10 | Cynodon dactylon |
| LJP | 2 | 2015.03 | 2019.4.18 | 2019.10.12 | Cynodon dactylon |
| JP | 1 | 2013.03 | 2019.4.17 | 2019.10.13 | Cynodon dactylon, |
| XHP | 1 | 2016.01 | 2019.3.28 | 2019.09.26 | Cynodon dactylon, Phragmites communis, Hemarthria altissima |
| DJZ | 1 | 2011.08 | 2019.3.29 | 2019.09.27 | Cynodon dactylon, Festuca elata |
| QLH | 1 | 2014.05 | 2019.4.27 | 2019.09.28 | Cynodon dactylon, Hemarthria altissima |
| Sites | Elevation of the Low Water Platform | Range of Sampling Zones Relative to the Low Water Platform (m) | Average Annual Duration of Submergence (Day) | ||||
|---|---|---|---|---|---|---|---|
| Upper Part | Middle Part | Lower Part | Upper Part | Middle Part | Lower Part | ||
| LLZ1 | 31.40 | >4.60 | 2.30–4.60 | 0–2.30 | 27 | 67 | 137 |
| LLZ2 | 31.40 | >4.60 | 2.30–4.60 | 0–2.30 | 27 | 67 | 137 |
| MJZ | 29.60 | >5.04 | 2.52–5.04 | 0–2.52 | 32 | 95 | 159 |
| JLGT | 30.60 | >4.80 | 2.40–4.80 | 0–2.40 | 24 | 61 | 122 |
| LJP | 26.51 | >6.00 | 3.00–6.00 | 0–3.00 | 33 | 101 | 173 |
| JP | 19.04 | >8.00 | 4.00–8.00 | 0–4.00 | 47 | 110 | 184 |
| XHP | 12.60 | >8.00 | 4.00–8.00 | 0–4.00 | 47 | 110 | 184 |
| DJZ | 11.06 | >8.46 | 4.23–8.46 | 0–4.23 | 46 | 116 | 184 |
| QLH | 5.69 | >6.64 | 3.32–6.64 | 0–3.32 | 94 | 150 | 184 |
| RH | pH | OM | TN | TP | TK | AN | AP | |
|---|---|---|---|---|---|---|---|---|
| RH | 1 | |||||||
| pH | −0.234 | 1 | ||||||
| OM | 0.419 * | −0.651 ** | 1 | |||||
| TN | 0.425 * | −0.673 ** | 0.947 ** | 1 | ||||
| TP | −0.069 | −0.467 * | 0.434 * | 0.489 * | 1 | |||
| TK | 0.214 | −0.652 ** | 0.863 ** | 0.865 ** | 0.418 * | 1 | ||
| AN | 0.014 | −0.373 | 0.563 ** | 0.629 ** | 0.299 | 0.567 ** | 1 | |
| AP | 0.238 | −0.620 ** | 0.491 * | 0.613 ** | 0.497* | 0.581 ** | 0.422 * | 1 |
| AK | 0.595 ** | −0.474 * | 0.458 * | 0.512 ** | 0.294 | 0.315 | 0.334 | 0.537 ** |
© 2020 by the authors. Licensee MDPI, Basel, Switzerland. This article is an open access article distributed under the terms and conditions of the Creative Commons Attribution (CC BY) license (http://creativecommons.org/licenses/by/4.0/).
Share and Cite
Fan, Y.; Yang, Z.; Li, M.; Zhang, Z.; Li, D. Comparative Analysis on Environmental Adaptability of Two Types of Bank Stabilization Structures along the Middle and Lower Reaches of the Yangtze River. Sustainability 2020, 12, 7991. https://doi.org/10.3390/su12197991
Fan Y, Yang Z, Li M, Zhang Z, Li D. Comparative Analysis on Environmental Adaptability of Two Types of Bank Stabilization Structures along the Middle and Lower Reaches of the Yangtze River. Sustainability. 2020; 12(19):7991. https://doi.org/10.3390/su12197991
Chicago/Turabian StyleFan, Yujie, Zhonghua Yang, Ming Li, Zhiyong Zhang, and Da Li. 2020. "Comparative Analysis on Environmental Adaptability of Two Types of Bank Stabilization Structures along the Middle and Lower Reaches of the Yangtze River" Sustainability 12, no. 19: 7991. https://doi.org/10.3390/su12197991