Article

Spatial Equity with Census Population Data vs. Floating Population Data: The Distribution of Earthquake Evacuation Shelters in Daegu, South Korea

1
Innovative Durable Building and Infrastructure Research Center, Hanyang University, 55 Hanyangdaehak-ro, Sangnok-gu, Ansan-si, Gyeonggi-do 15588, Korea
2
Department of Fire Safety, Kyungil University, 50, Gamasil-gil, Hayang-eup, Gyeongsan-si, Gyeongsangbuk-do 38428, Korea
3
Faculty of Liberal Arts, Kyungil University, 50, Gamasil-gil, Hayang-eup, Gyeongsan-si, Gyeongsangbuk-do 38428, Korea
4
School of Architecture, Civil, Environmental and Energy Engineering, Kyungpook National University, 80 Daehak-ro, Buk-gu, Daegu 41566, Korea
*
Author to whom correspondence should be addressed.
Sustainability 2020, 12(19), 8046; https://doi.org/10.3390/su12198046
Submission received: 23 August 2020 / Revised: 26 September 2020 / Accepted: 28 September 2020 / Published: 29 September 2020

Abstract

:
The spatial equity of outdoor evacuation sites designated for emergency evacuation must be secured. In particular, public administrators must ensure spatial equity in preparing for unpredictable evacuation demands, such as earthquakes. This study analyzed the spatial equity of earthquake evacuation shelters in Daegu, South Korea, by using population data at the local level by time- and date-based mobile phone location data (i.e., floating population data). We compared our analysis of the spatial equity and error rate in this case with census data. Ultimately, our results demonstrate that the use of census population data can cause significant error in evaluations of the equity of evacuation shelter accessibility when the floating population data acquired through mobile phone location data are assumed exact.

1. Introduction

Evacuation is the default emergency management option to ensure public safety in disaster situations. In particular, effective evacuation plans used during earthquake responses play an essential role in emergency management. Of late, these plans have drawn attention from numerous researchers because they have been shown to significantly reduce the number of fatalities and injuries in emergencies [1].
The spatial distribution and setup of earthquake shelters are regarded as important factors in creating evacuation process plans. A logical site selection strategy for earthquake evacuation shelters makes actual evacuations more effective [1]. As such, numerous existing studies on earthquake shelter location selection have focused on physical criteria (e.g., [2,3,4,5,6,7]) and efficiency during the evacuation process (e.g., [8,9,10]). In contrast, little research has been done on the equity of evacuation shelters. In general, equity (i.e., fairness) involves the just distribution of benefits [11]. Because earthquake evacuation shelters are public goods, they should be characterized by equitable spatial distribution, thus giving all residents equal protection in the event of an earthquake.
Once an earthquake occurs, survivors must evacuate to an open, outdoor area, such as playgrounds and parks, which are safe from structural damage and falling objects. Such areas are designated to serve as outdoor evacuation sites (also called immediate shelters, but referred to as outdoor evacuation sites in this study) and used as primary evacuation sites. When an earthquake occurs, survivors should quickly evacuate to an outdoor evacuation site regardless of where they are to avoid being hurt by earthquake-related damage.
Evacuation distance and shelter site capacity are important factors in ensuring urban resilience in the event of an earthquake [12]. As such, existing studies tend to consider evacuation distance and shelter site capacity as the most influential factors in selecting and allocating shelter site locations. To analyze these factors, it is necessary to predict the location of evacuation demand and the evacuee population. Accordingly, a number of existing studies (e.g., [1,4,7,13]) employed census data to predict the degree and distribution of demand and population. However, this approach fails to reflect the floating population, or the random number of people who may happen to be in a certain area when the need to evacuate arises [7].
In recent years, monitoring population status by time and date at small, local-level units has become possible in Korea by utilizing mobile phone location data. Such an approach situates the population as a ‘service population’. The concept of the service population can be utilized in predicting administrative demand as it includes both the resident population of the region and the population temporarily located within the region. This study used the concept of the service population to predict the evacuation demand location, evacuee population, and evacuation equity of a large city in Korea, Daegu. The reliability of floating population data acquired from mobile phone location data has been proven in a number of previous studies (e.g., [14,15,16,17]), which have also demonstrated that such data can provide comprehensive results. In other words, floating population data acquired through mobile phone location data can be used as an alternative to static census data in spatial accessibility analysis.
More specifically, this study used a mobile phone location data-based floating population—a concept that includes both the resident and floating populations of a small local level unit—to predict the evacuation demand and evaluate the equity of a designated outdoor evacuation site distribution. Further, the study analyzed the different impacts of using census data and floating population data in an equity evaluation on the evaluation’s results.

2. Equity Evaluation Method for Public Facility Services

2.1. Literature Review of Equity on Facility Location Selection

Marsh and Schilling [18] suggested that ‘efficiency’ and ‘effectiveness’ are the mainstays in management and decision science. They pointed out that although many people attempt to allocate resources, costs, amenities, and burdens in the most efficient and effective way, these criteria are not sufficient for generating acceptable and implementable decisions in most public sectors. Additionally, the authors mentioned that if the effects of facilities are different by distance and facility, inequality may occur within the corresponding group. In other words, spatial equality denotes spatially equal distances from public facilities for all residents [19].
To address this inequality, equity has been considered in the location selection and allocation modeling of related facilities in the fields of economy, geography, public administration, and management science. Most studies on equity in the public sector, however, have focused on operational research, such as relief supplies, rather than equity in evacuation facility location and evacuee allocation problems [8]. Although spatial equity has been measured in various ways in studies regarding facility location problems, these studies generally analyzed the distance between demand points and assigned facilities [11].
Several recent studies regarding evacuation facilities have considered spatial equity (see Table 1). For example, Li et al. [20], Sabouhi et al. [21], Mostajabdaveh et al. [11], and Kılcı et al. [22] analyzed the distance between demand points and assigned facilities to measure equity. Meanwhile, Ahn and Chae [23] analyzed the service area of designated shelters to extract the number of people they could each accommodate. In addition to evacuation facilities, the spatial equity concept has been considered in relation to selecting locations for facilities related to public services. Although most studies used only distance, other factors such as the household income [24], elderly population [25], deprivation cost [26], and domestic water use population [27] have also been used as equity targets, depending on the facility type.
Equity measurement methodology has been discussed in relation to a wide range of topics, including facility allocation and location selection issues. To date, various types of equity measurement methods have been proposed. Through a literature review, Marsh and Schilling [18] discovered 20 different measurement methods—namely, center, variance, mean absolute deviation, sum of absolute deviations, Gini coefficient, range, Hoover’s concentration index, Schutz index, Theil’s entropy coefficient, coefficient of variation, and variance of logs. According to Karsu and Morton [31], there are three main approaches to addressing equity in modeling: Rawlsian, inequality index-based, and aggregation function-based approaches.

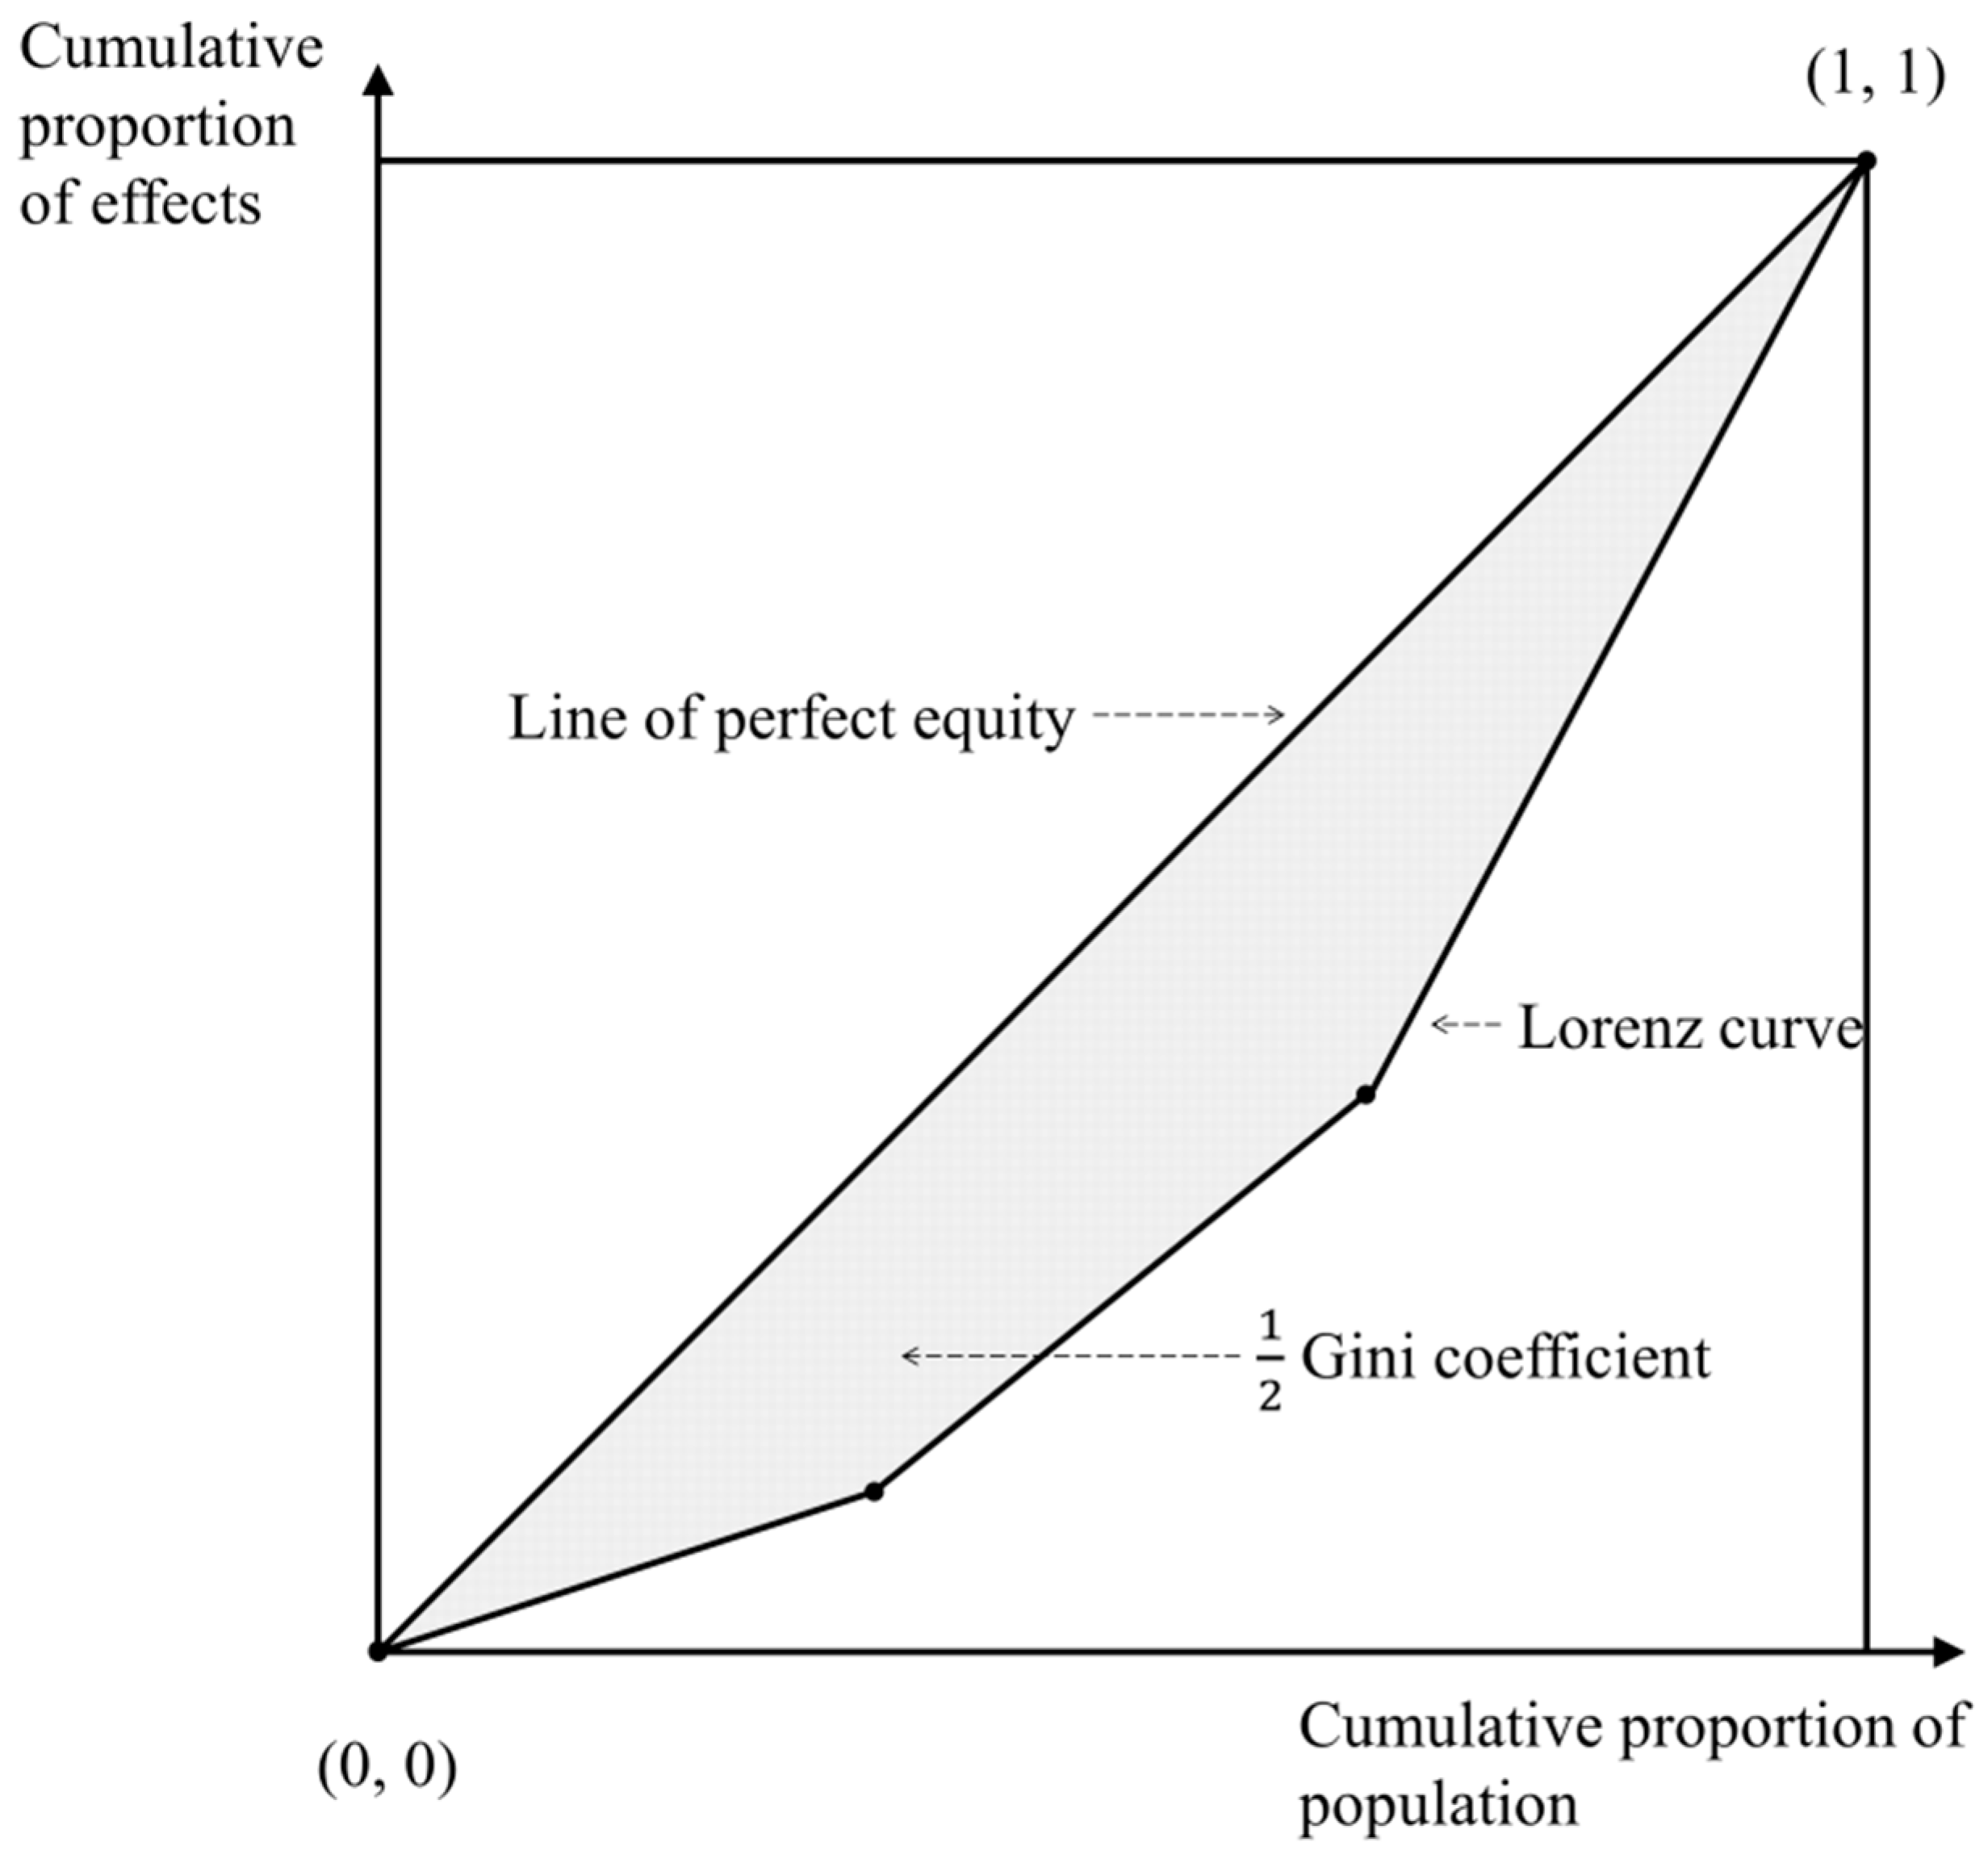
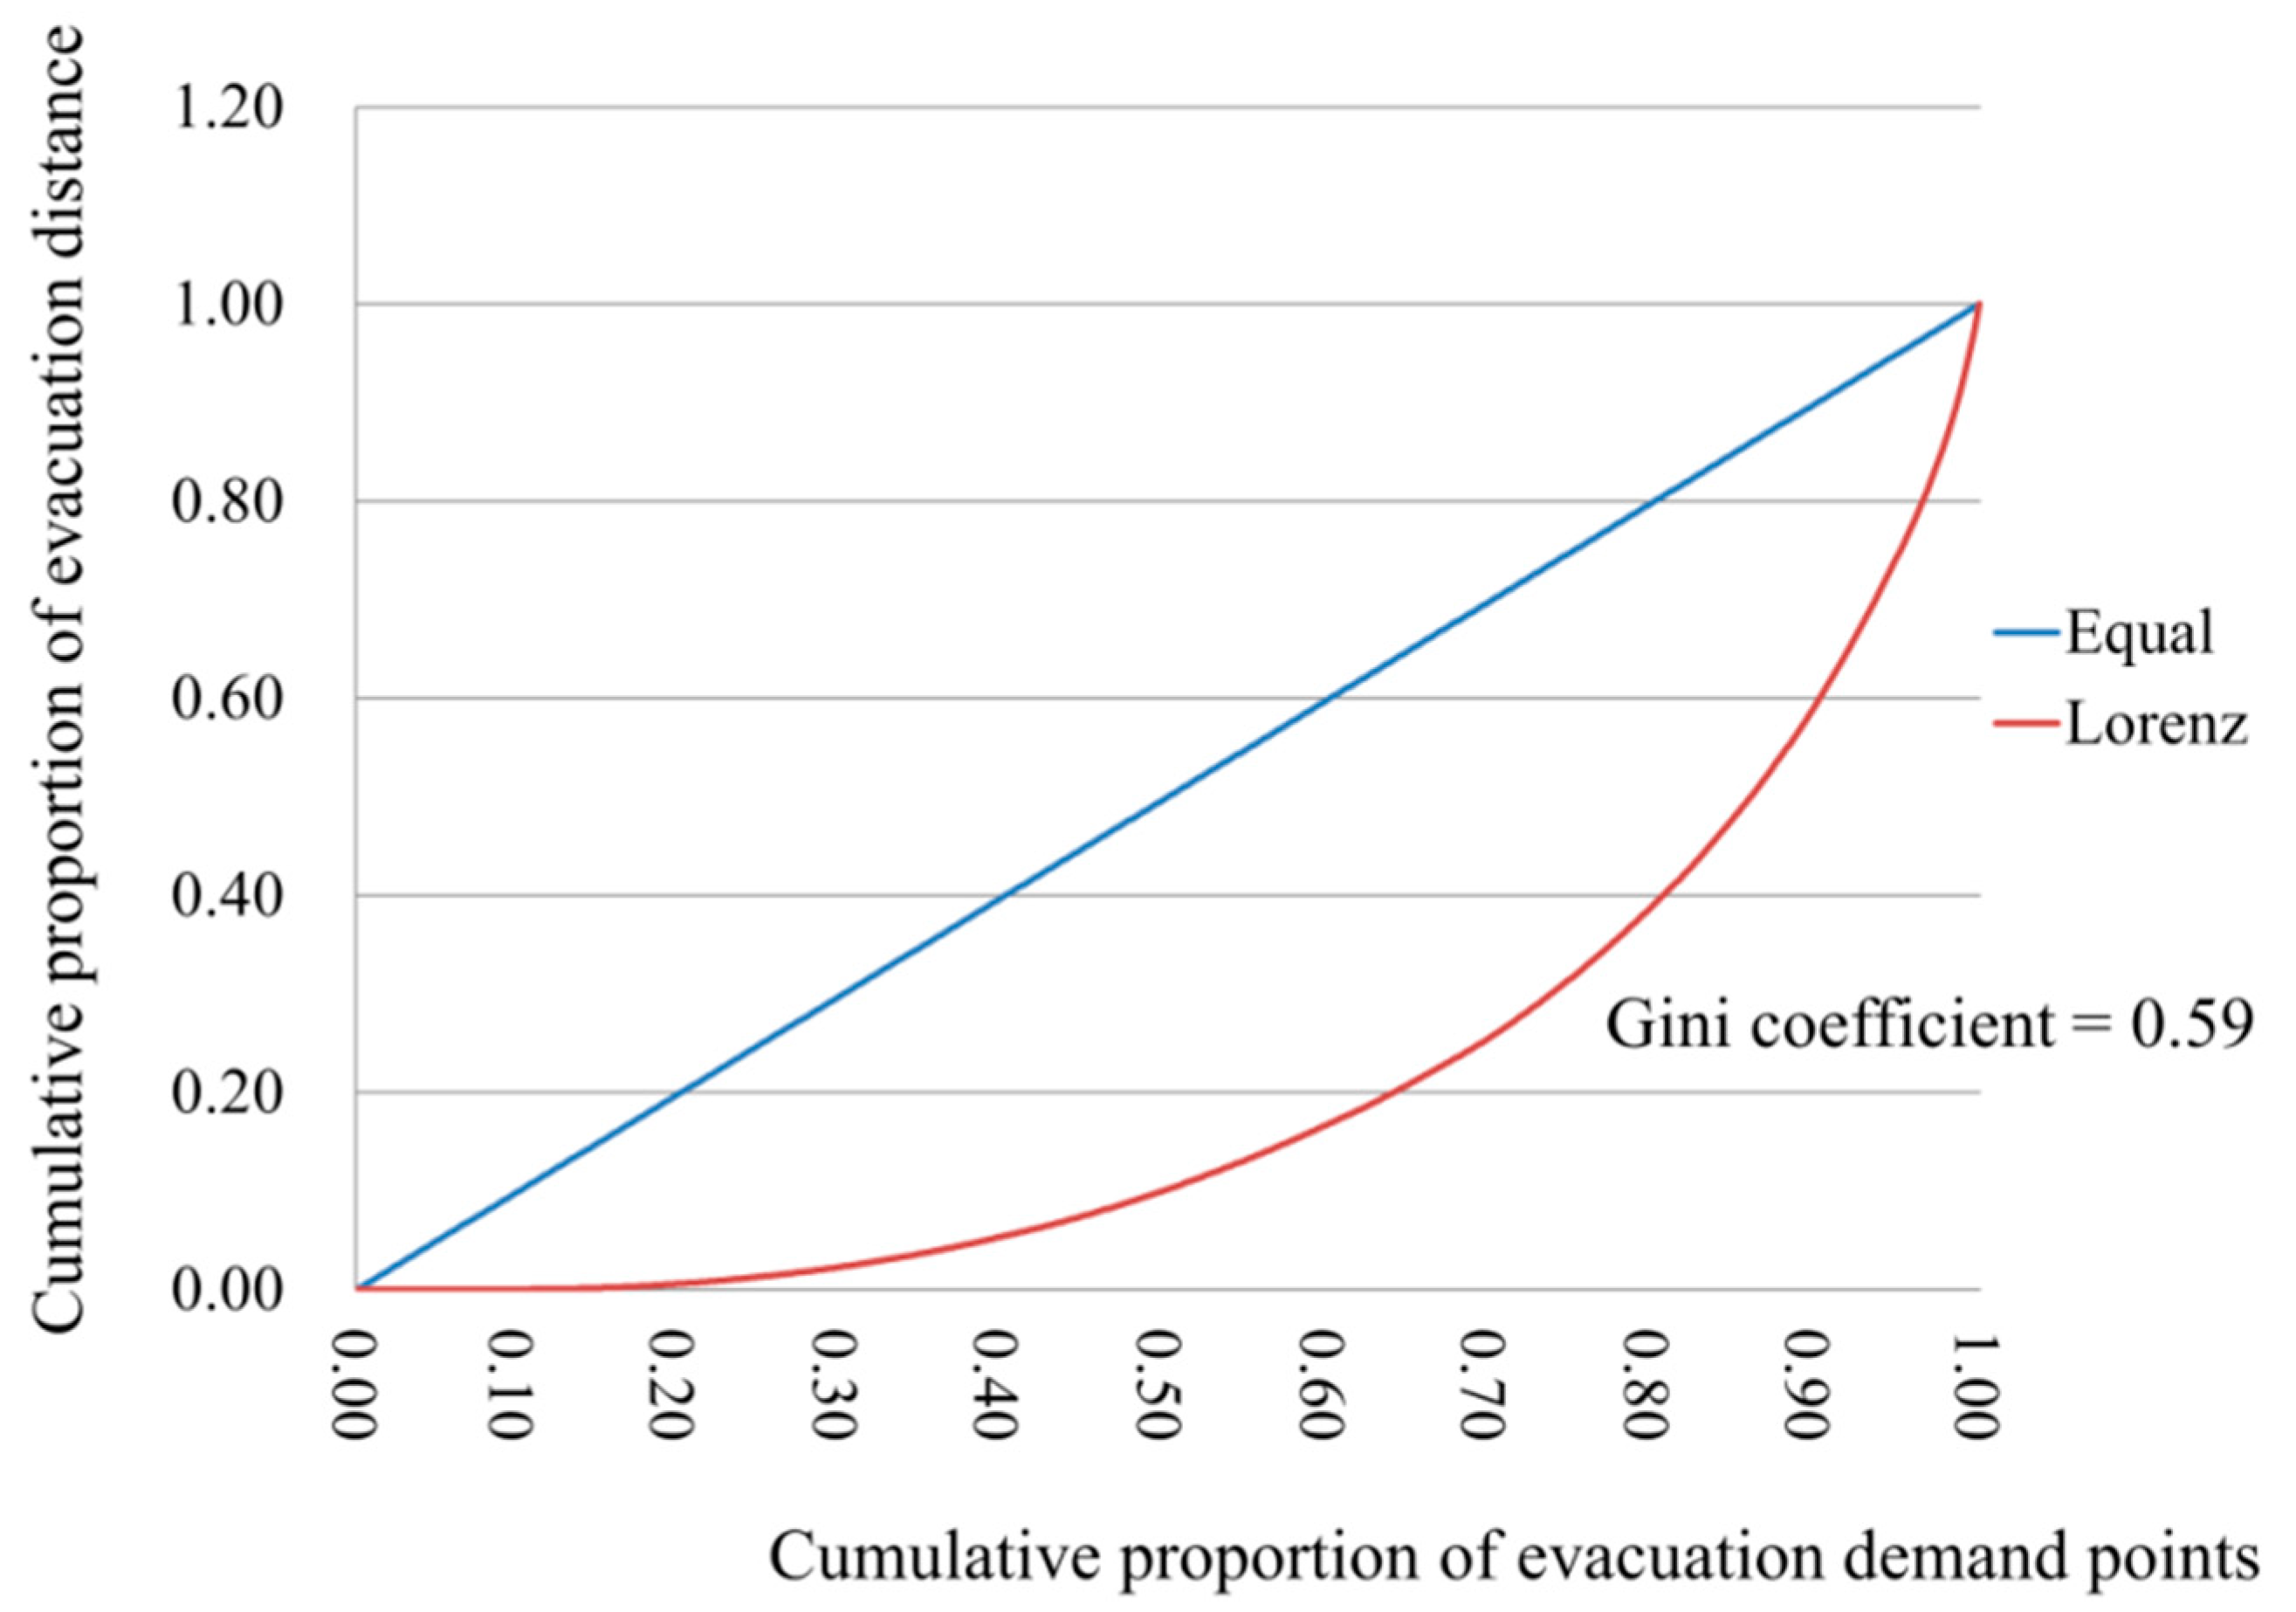
2.2. Lorenz Curve and Gini Coefficient

Although various analysis methods can be employed for equity evaluation, this study measured equity by using the Lorenz curve and the Gini coefficient for the following reasons.
First, a Lorenz curve can be applied not only to income but also to any quantity that can be accumulated within the population [32]. Second, the Gini coefficient can be easily interpreted as it measures inequality through ratio analysis and is among the most popular measures of equality ([33,34]). Lastly, the application of time series can be performed to display the change in inequality over a certain period of time [30].
In the facility location problem, the ranking order of the location is determined based on the total distance traveled by the population to the nearest facility. The proportion of the population that falls under each rank and the proportion of the total distance traveled by the population of the corresponding node or the below node are calculated. Plotting this relationship on a graph for all ranks yields a Lorenz curve (see Figure 1, as well as [18]).
The Gini coefficient is defined as the ratio of the area between the line of perfect equity and the Lorenz curve and the total area below the line of perfect equity. Thus, the further below the diagonal the Lorenz curve is, the farther from perfect equity the system is, and the greater the ratio is. Hence, a Gini measure of unity represents absolute inequity and a value of zero, when the Lorenz curve coincides with the diagonal, is perfect equity” [18]. In other words, the minimum value of G is zero (perfect equity) and the maximum value is one (extreme inequity) [11].
The Gini coefficient for costs (in this paper: Shelter capacity, evacuation distance, and evacuation cost) can be approximated using the following equation [32]:
G =   1   k = 1 n ( X k X k 1 ) ( Y k + Y k 1 )
where G: Gini coefficient, X: Cumulative proportion of the population variable for k = 0 … n, with X 0 = 0, X n = 1, and Y: Cumulative proportion of costs variable for k = 0 … n, with Y 0 = 0, Y n = 1.

3. Methods and Materials
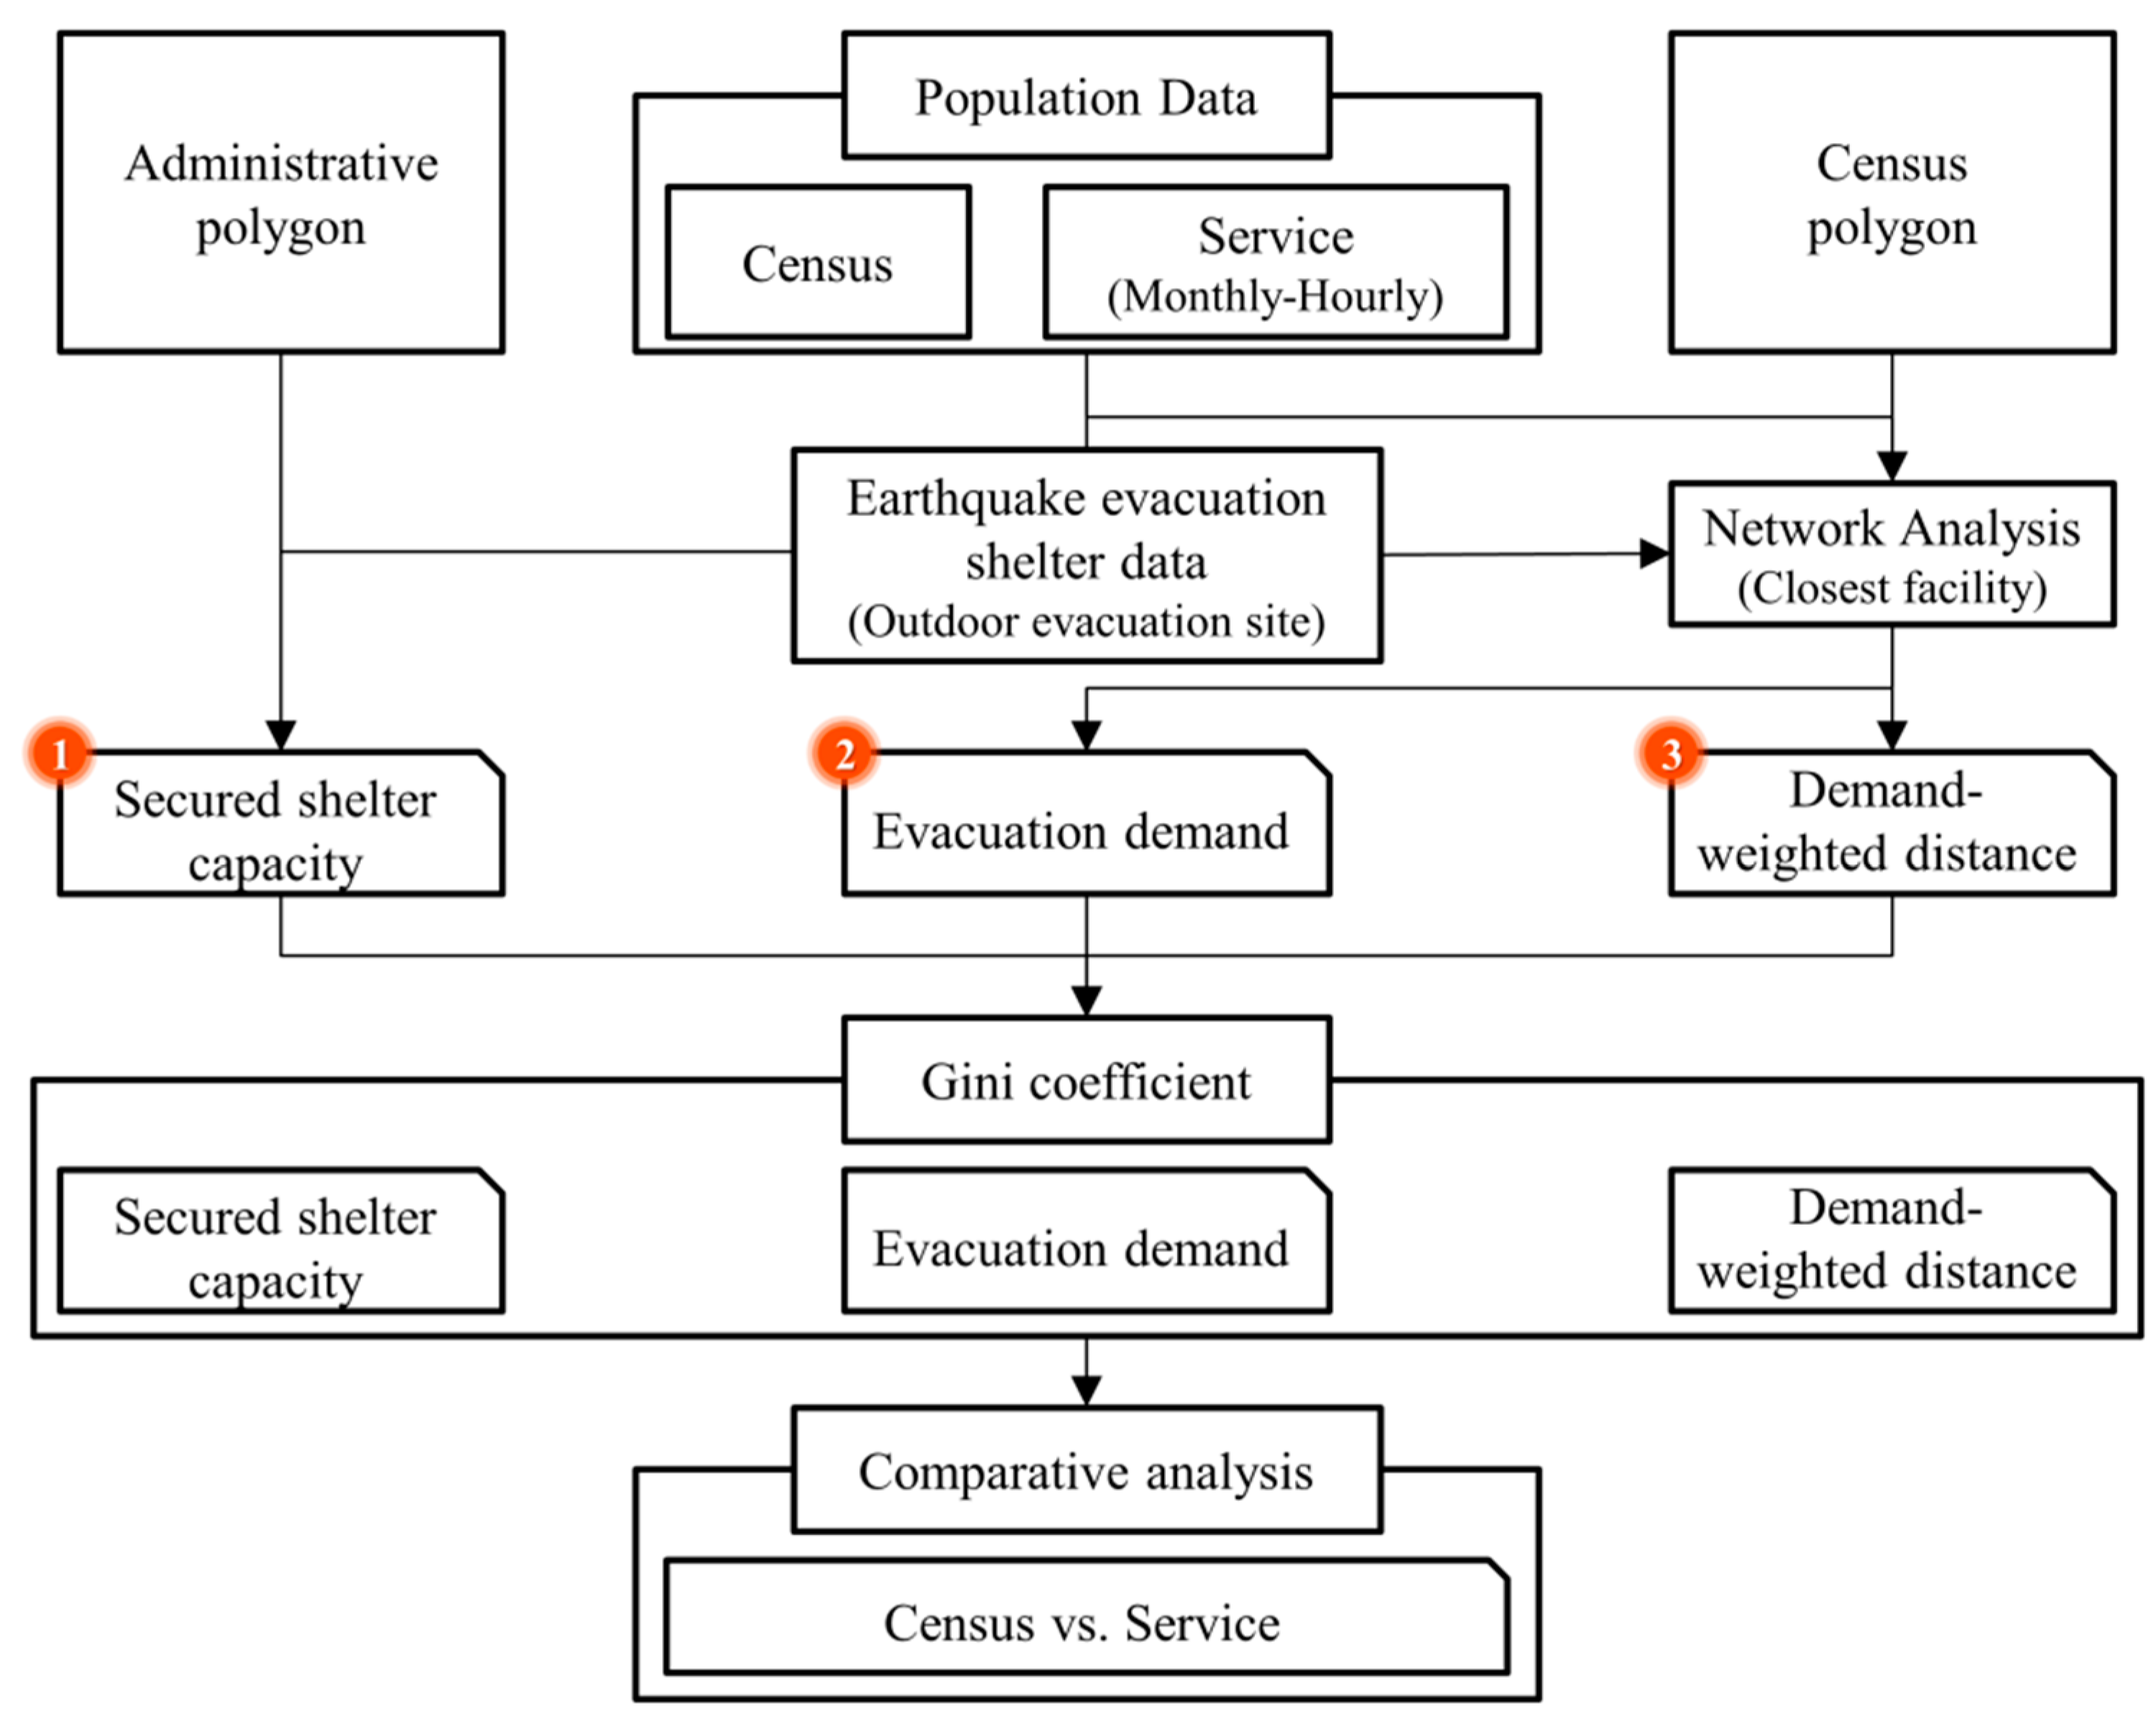
3.1. Methods

Marsh and Schilling [18] suggest that while ‘equity’ is an important factor in decision making, it is not a straightforward concept, thus, there is an endless debate on how and when equity can be secured. In dealing with shelter location selection, evacuation demand and distance have been the focus of past analysis, as shown in Table 1.
This study considers three variables to measure the geographic equity of outdoor evacuation sites (see Figure 2 and Table 2). The first is the capacity of the outdoor evacuation site. In general, the capacity of a shelter is secured according to the population of the administrative area. Accordingly, we used the secured shelter capacity according to the population of each administrative boundary as the variable for analysis. The second variable is the evacuation demand for each outdoor evacuation site. In order to approximate real-life evacuation demand in our analysis, we employed Arc GIS Network Analyst to reflect the road conditions of the study site. Although evacuees should evacuate to an outdoor evacuation site allocated by the local evacuation plan in the event of an earthquake, this study assumed that evacuees evacuated to the nearest outdoor evacuation site, thus, the closest facility tool was used. Lastly, we used the demand-weighted distance for each outdoor evacuation site as the variable for analyzing the Gini coefficient. During the process, the demand-weighted distance was derived based on the product of the evacuation demand and distance, which is the analysis result of the closest facility. Further, the Gini coefficient was calculated by analyzing the total evacuation demand-weighted distance for outdoor evacuation sites. The three variables were derived separately using both census population data and floating population data. In addition, the derived Gini coefficients were analyzed through a time series to identify the differences that census population data and floating population data induce on the equity evaluation results. The degree of difference was analyzed by calculating the error percentage using Equation (2) as follows:
Percentage   Error =   |   A p p r o x i m a t e   v a l u e E x a c t   v a l u e | | E x a c t   v a l u e |   × 100 .

3.2. Study Area

The subject of this study, Daegu Metropolitan City, consisted of 139 administrative boundaries (4928 census boundaries) with a total of 2,397,933 residents at the time of the study. Figure 3 shows the study area’s building and population distributions. Notably, approximately 48.9% of total buildings in the study area were over 30 years old, which indicates that Daegu requires a comprehensive earthquake response strategy [35].
Daegu City is home to a total of 706 outdoor evacuation sites (Figure 3b). We found that the capacity of outdoor evacuation sites relative to the resident population was adequate (see Table 3).

3.3. Data

Table 4 lists the data used in this study, which can be classified into three major types.
First: Population data, which are categorized into census population data and floating population data. Daegu City offers floating population data by region (i.e., administrative boundary), gender, age, and hour (see Figure 4). This study used the floating population data of the administrative boundary to unify the spatial range. As Daegu does not publish the floating population data of census boundaries, this study assumed that the floating population had a similar distribution to buildings to estimate the census boundary’s floating population on a monthly and hourly basis.
Second: Shape format data (Shp) for boundaries, roads, and buildings, which specify the spatial ranges of analysis. As described in Table 2, this study configured two spatial boundary ranges—administrative and census—to analyze the equity of the three variables. Additionally, road centerline data were used to construct a network dataset for deriving evacuation demand.
Third: Outdoor evacuation site data. Since addresses and capacity data are openly available in South Korea, geocoding was conducted to generate spatial data.

4. Results

4.1. Equity of Secured Shelter Capacity

The areas/populations of outdoor evacuation sites were derived to evaluate the equity of the capacity of outdoor evacuation sites secured by administrative districts relative to the actual population. An example of the derived results is summarized in Table 5.
As shown in Table 5, if floating population data is assumed to be an exact value, then each person can receive 12.30 m2 in the administrative boundary with the largest outdoor evacuation site area. However, according to census population data, only 10.10 m2 can be provided. In order to quantify the inequality of this secured shelter capacity, the Gini coefficient of secured shelter capacity by time slot was calculated using Equation (1).
Figure 5 illustrates the results of the Gini coefficient analysis on the area and population distribution of outdoor evacuation sites in 139 administrative boundaries. In the figure, the horizontal axis represents 00:00 to 23:00. Further, the 13 lines found on the right side represent the Gini coefficient values acquired using the floating population data for each month from January to December, and the blue plots represent average monthly values. Additionally, the red solid line represents the Gini coefficient analysis result value (0.6077) of secured shelter capacity acquired using the census population data.
The minimum and maximum Gini coefficients of secured shelter capacity using floating population data were shown to be 0.5663 (as of 18:00 November) and 0.6219 (as of 02:00 April), respectively.
Although the Gini coefficients derived using floating population data displayed monthly variations, the coefficient values were generally lower than those obtained using census population data. In other words, the use of floating population data in evaluating the equity of secured capacity yields more appropriate equity evaluations than the use of census population data.
The Gini coefficient error percentages of the secured shelter capacity were analyzed using Equation (2) by assuming that the floating population data represent exact values. Figure 6 shows the results of the Gini coefficient error rates analysis on secured shelter capacity. The error rates were between 0.01% and 7.31%, with an average error of 2.82%.

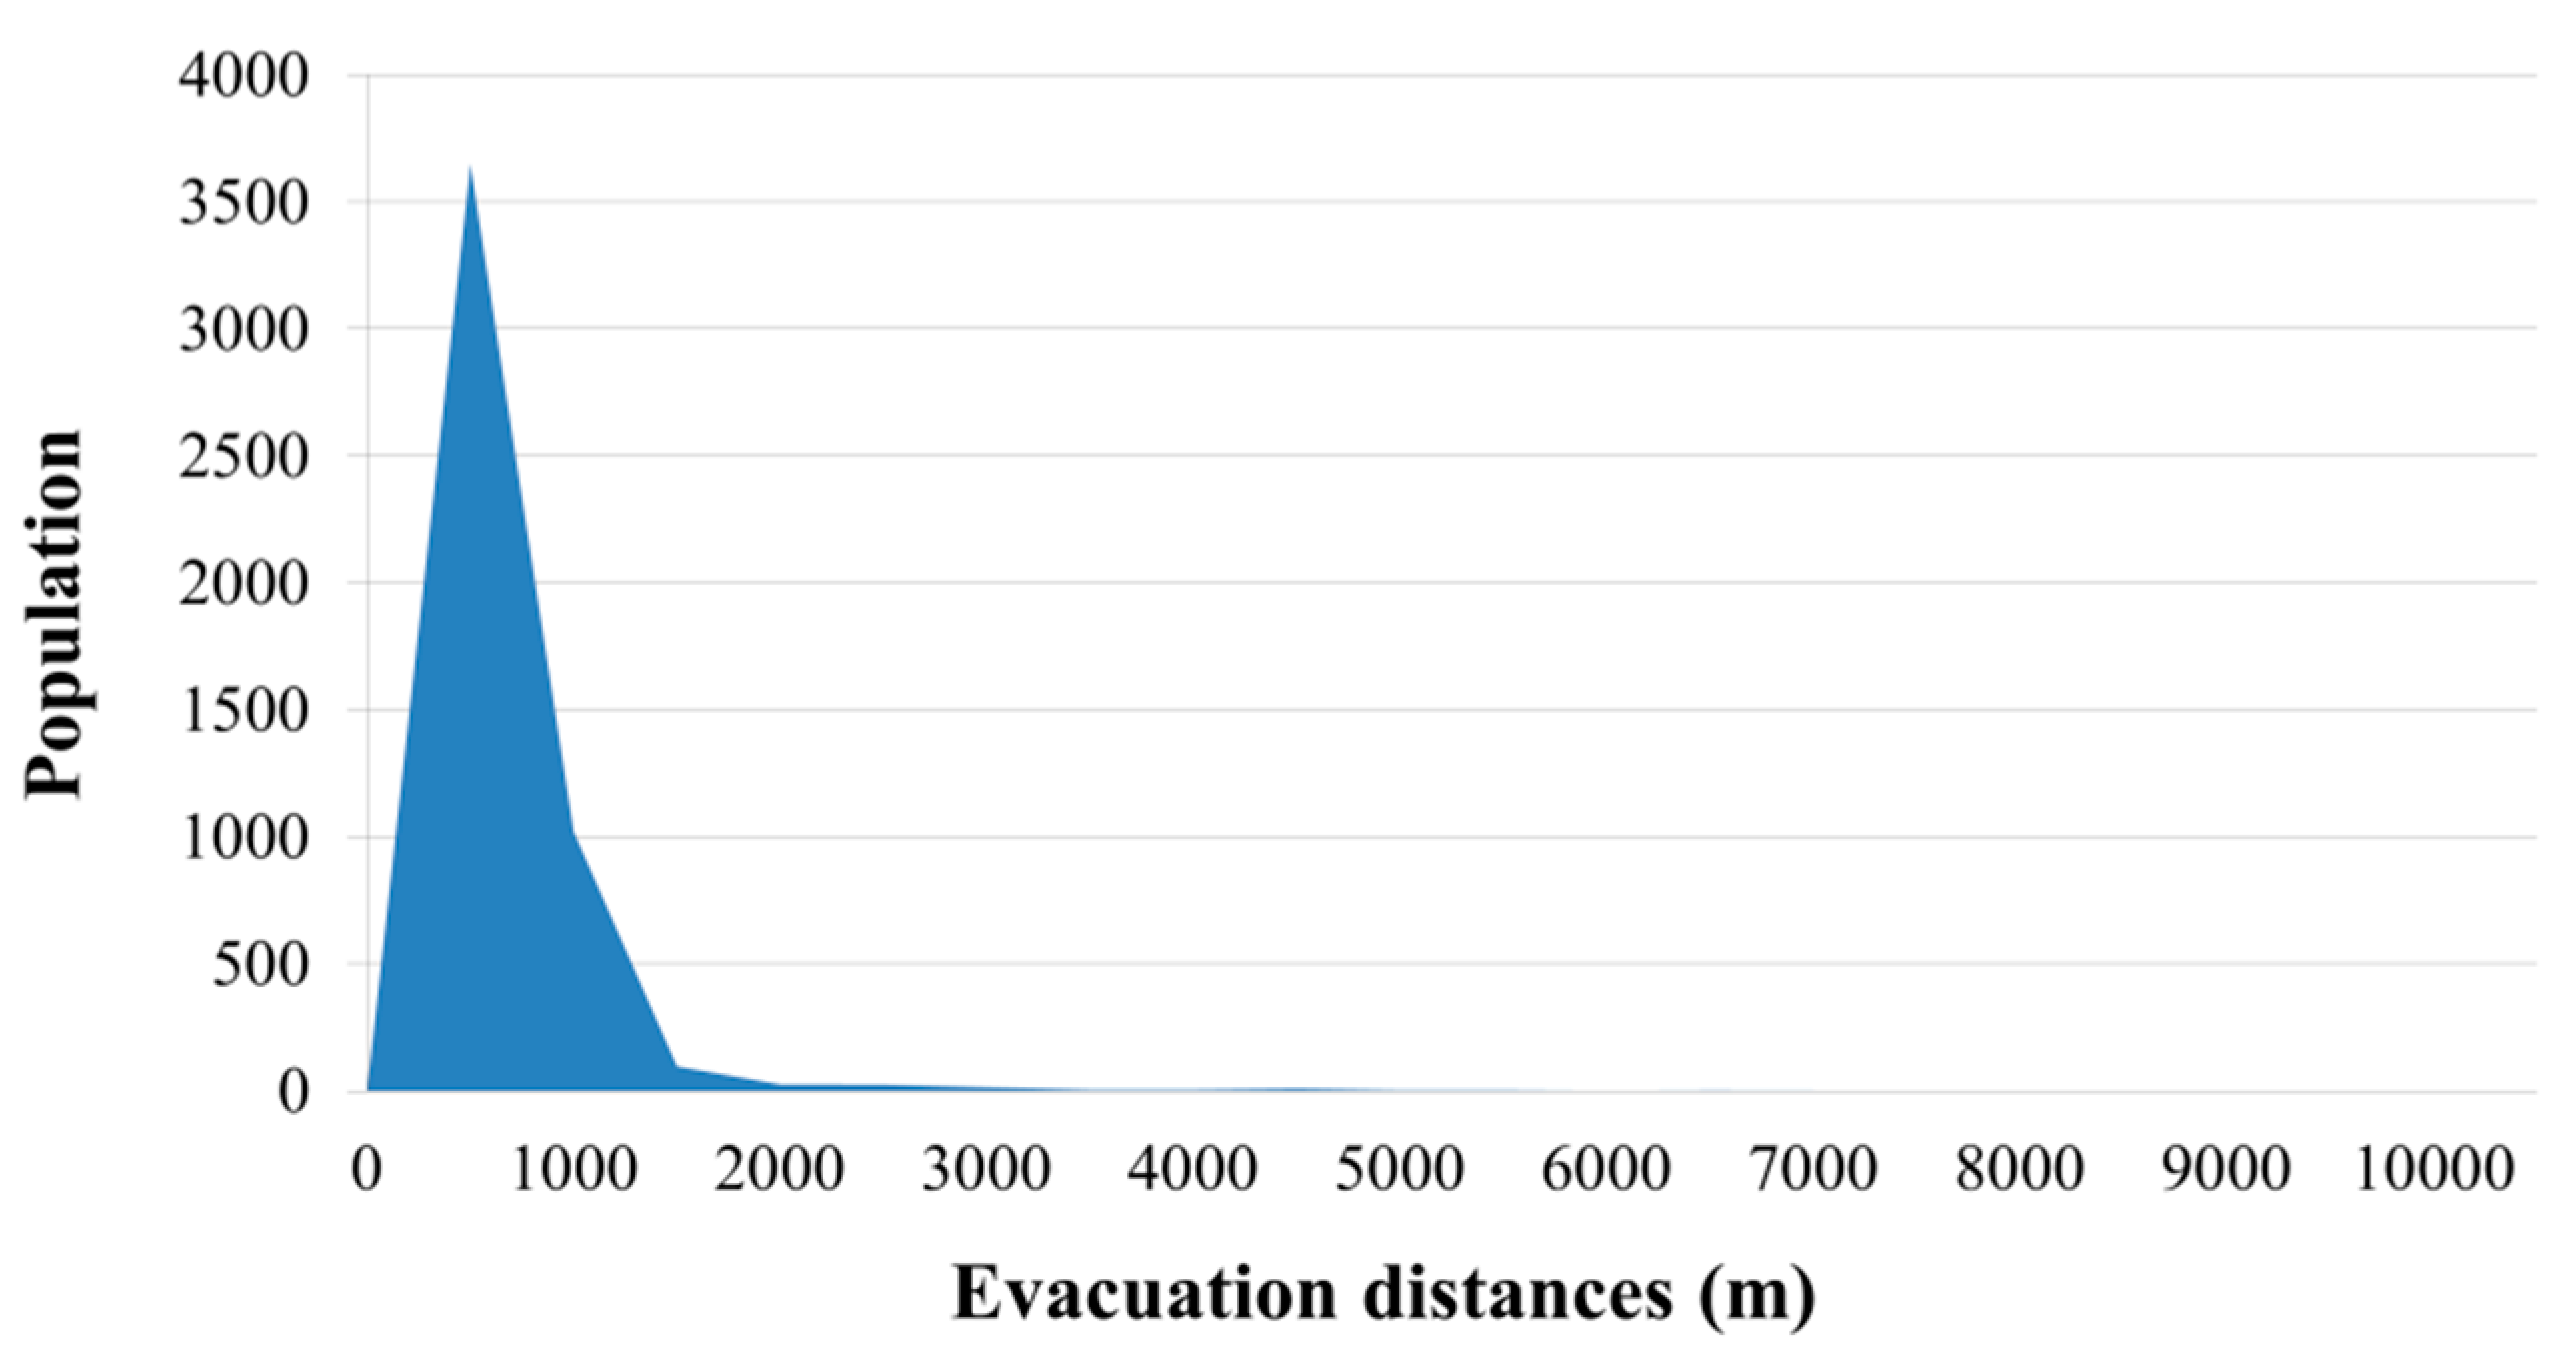
4.2. Equity of Evacuation Distance

Among the various indices used for measuring spatial equity, accessibility indices have been the most widely used. In this study, we measured spatial equity by analyzing the shortest distance-based evacuation distances. In the event of an earthquake, each individual has limited options in choosing their evacuation destination [36,37]). Thus, we used the shortest distance to the designated shelter to analyze the evacuation distance. The GIS closest facility tool was used for the analysis, in which the location of the evacuation demand was set as the center point of the census polygon and the destination was set as the outdoor evacuation site designated as the target site. Figure 7 illustrates the closest facility analysis results, and Table 6 provides a summary of the results.
The average evacuation distance was 413.34 m and the maximum distance was 10,195.07 m. Figure 8 illustrates the frequency distribution of the shortest distance-based evacuation distance. The Lorenz curve of evacuation distance using the shortest distance was derived as shown in Figure 9, and a Gini coefficient of 0.59 was obtained.

4.3. Equity of Evacuation Demand

The floating population data used in this study were acquired from within the spatial range of the administrative boundaries, therefore, in measuring the floating population within each census boundary, it was assumed that the population was distributed according to the total building area. In other words, as shown in Figure 10, the population present in the administrative boundary was distributed across each census boundary according to the total building area. The shortest distance-based evacuation demand was measured according to the allocated floating population data, and monthly and hourly Gini coefficients were derived based on the demand results. Figure 11 displays the analysis results.
The Gini coefficient of evacuation demand using census population data was 0.4697, while the minimum and maximum Gini coefficients of evacuation demand using the floating population data were 0.5094 (as of 04:00 March) and 0.5740 (as of 07:00 September), respectively.
The Gini coefficient error percentages of the shortest distance-based evacuation demand were analyzed using Equation (2), and the results are shown in Figure 12. The minimum and maximum error rates were 7.77% and 18.18%, respectively, and the average error rate was 11.48%.

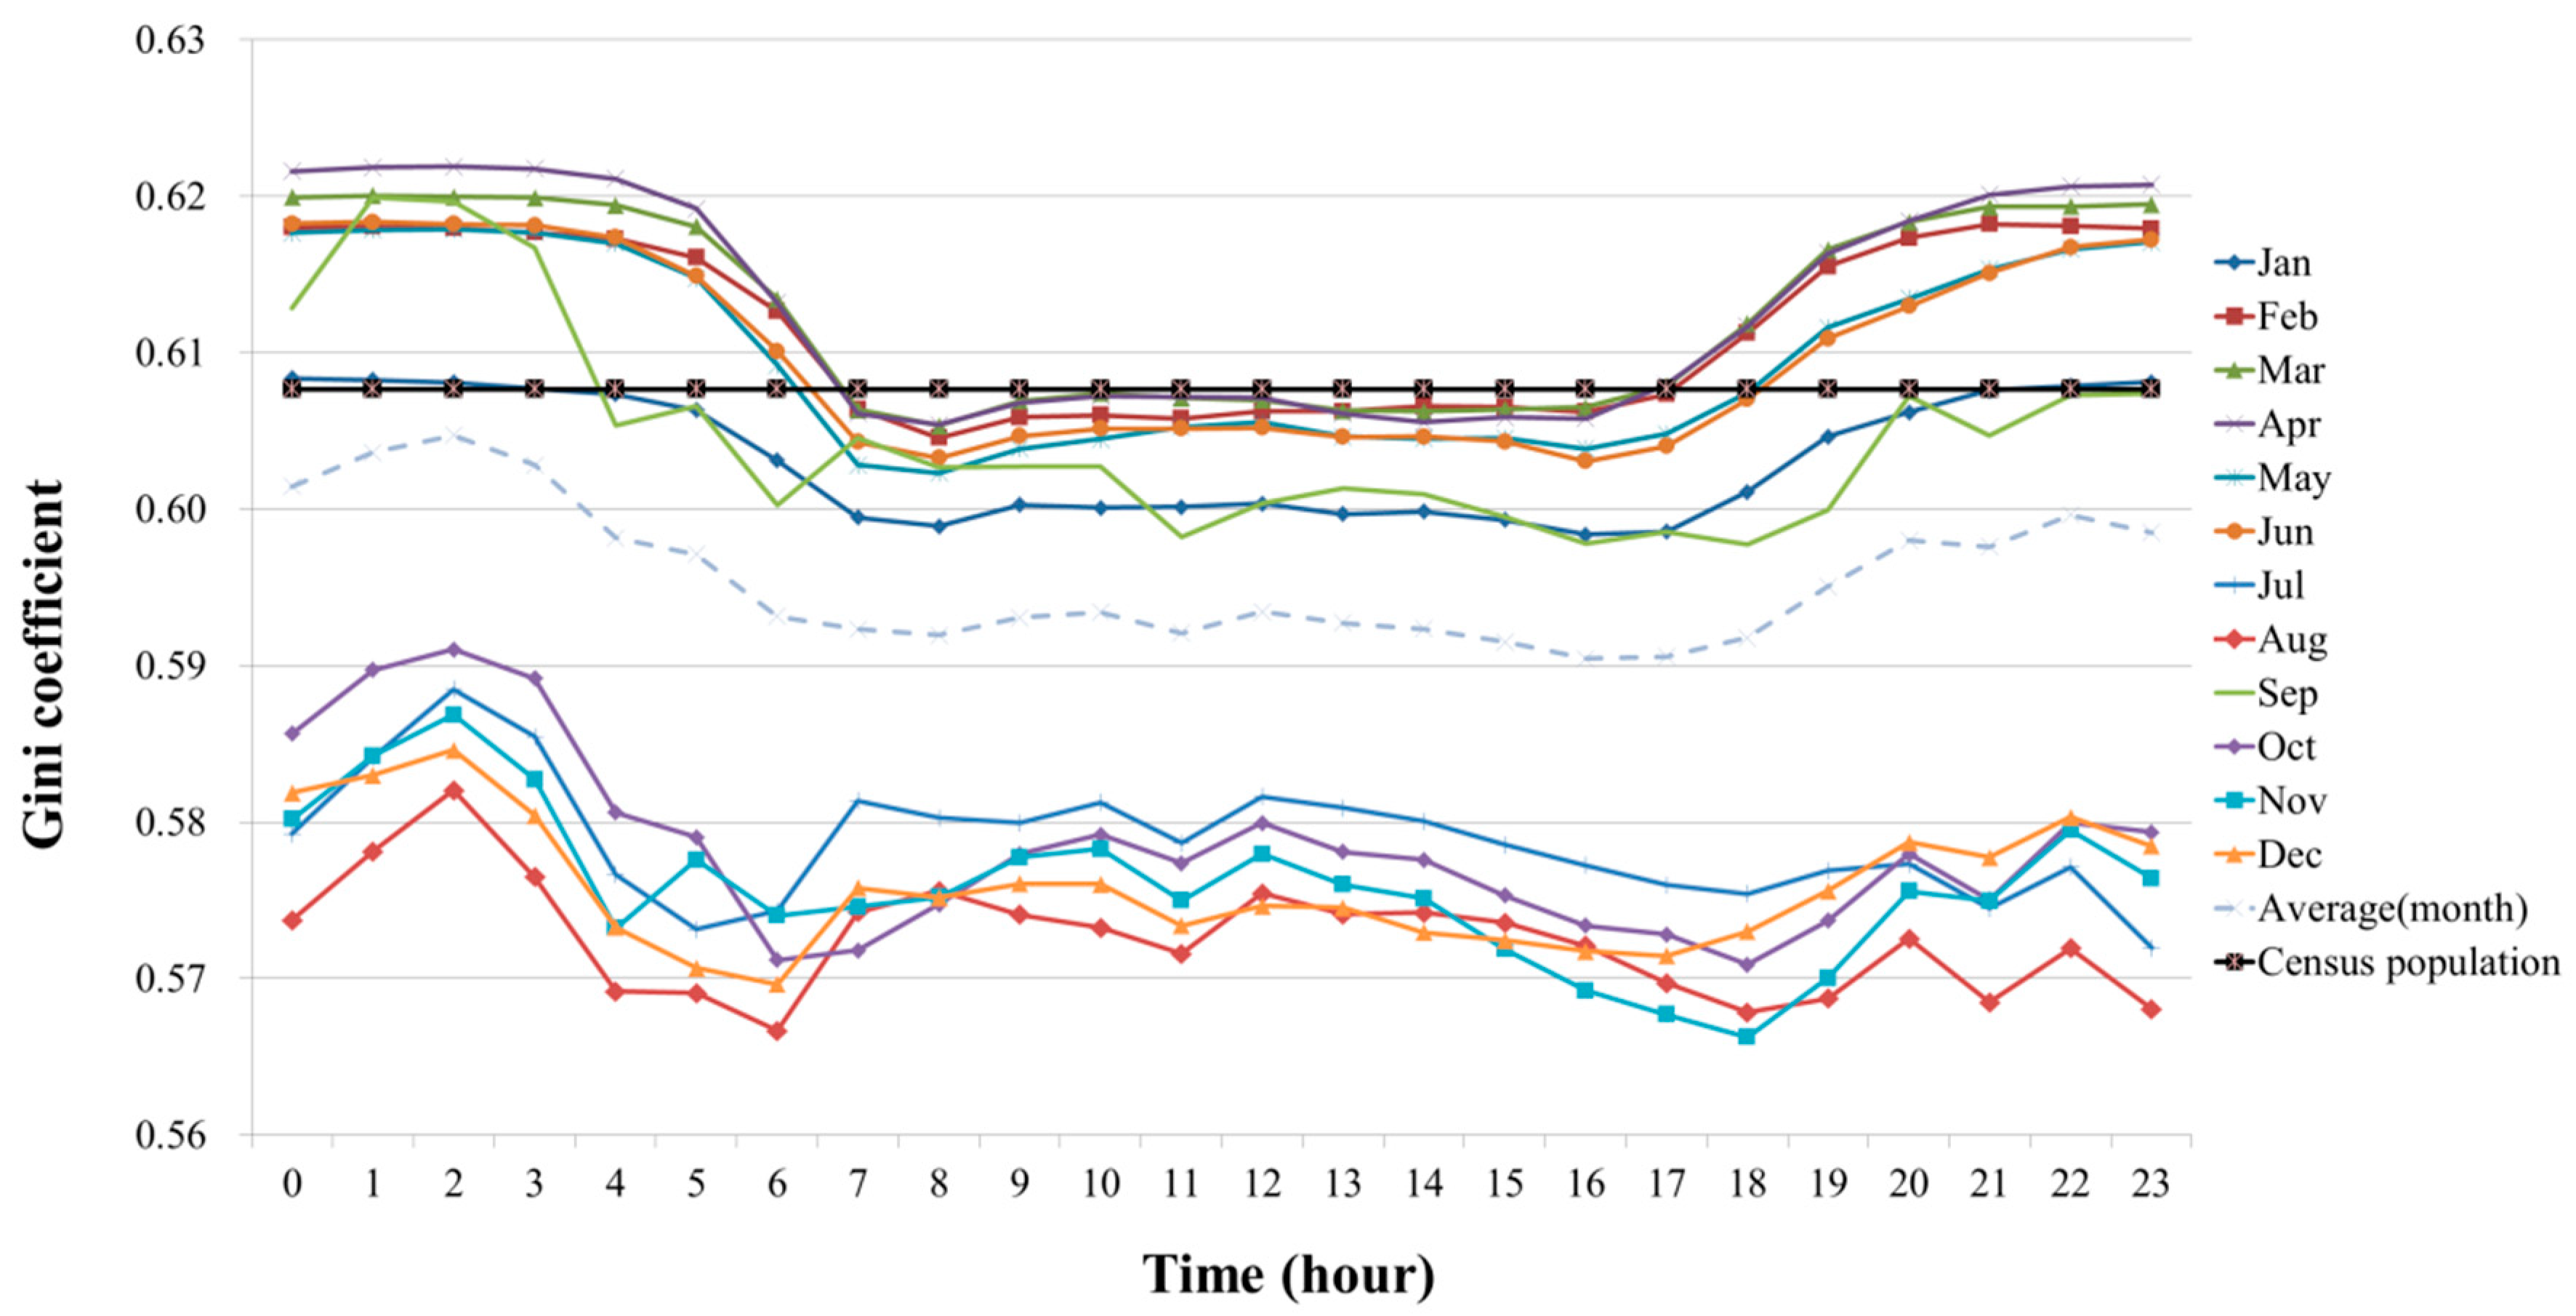
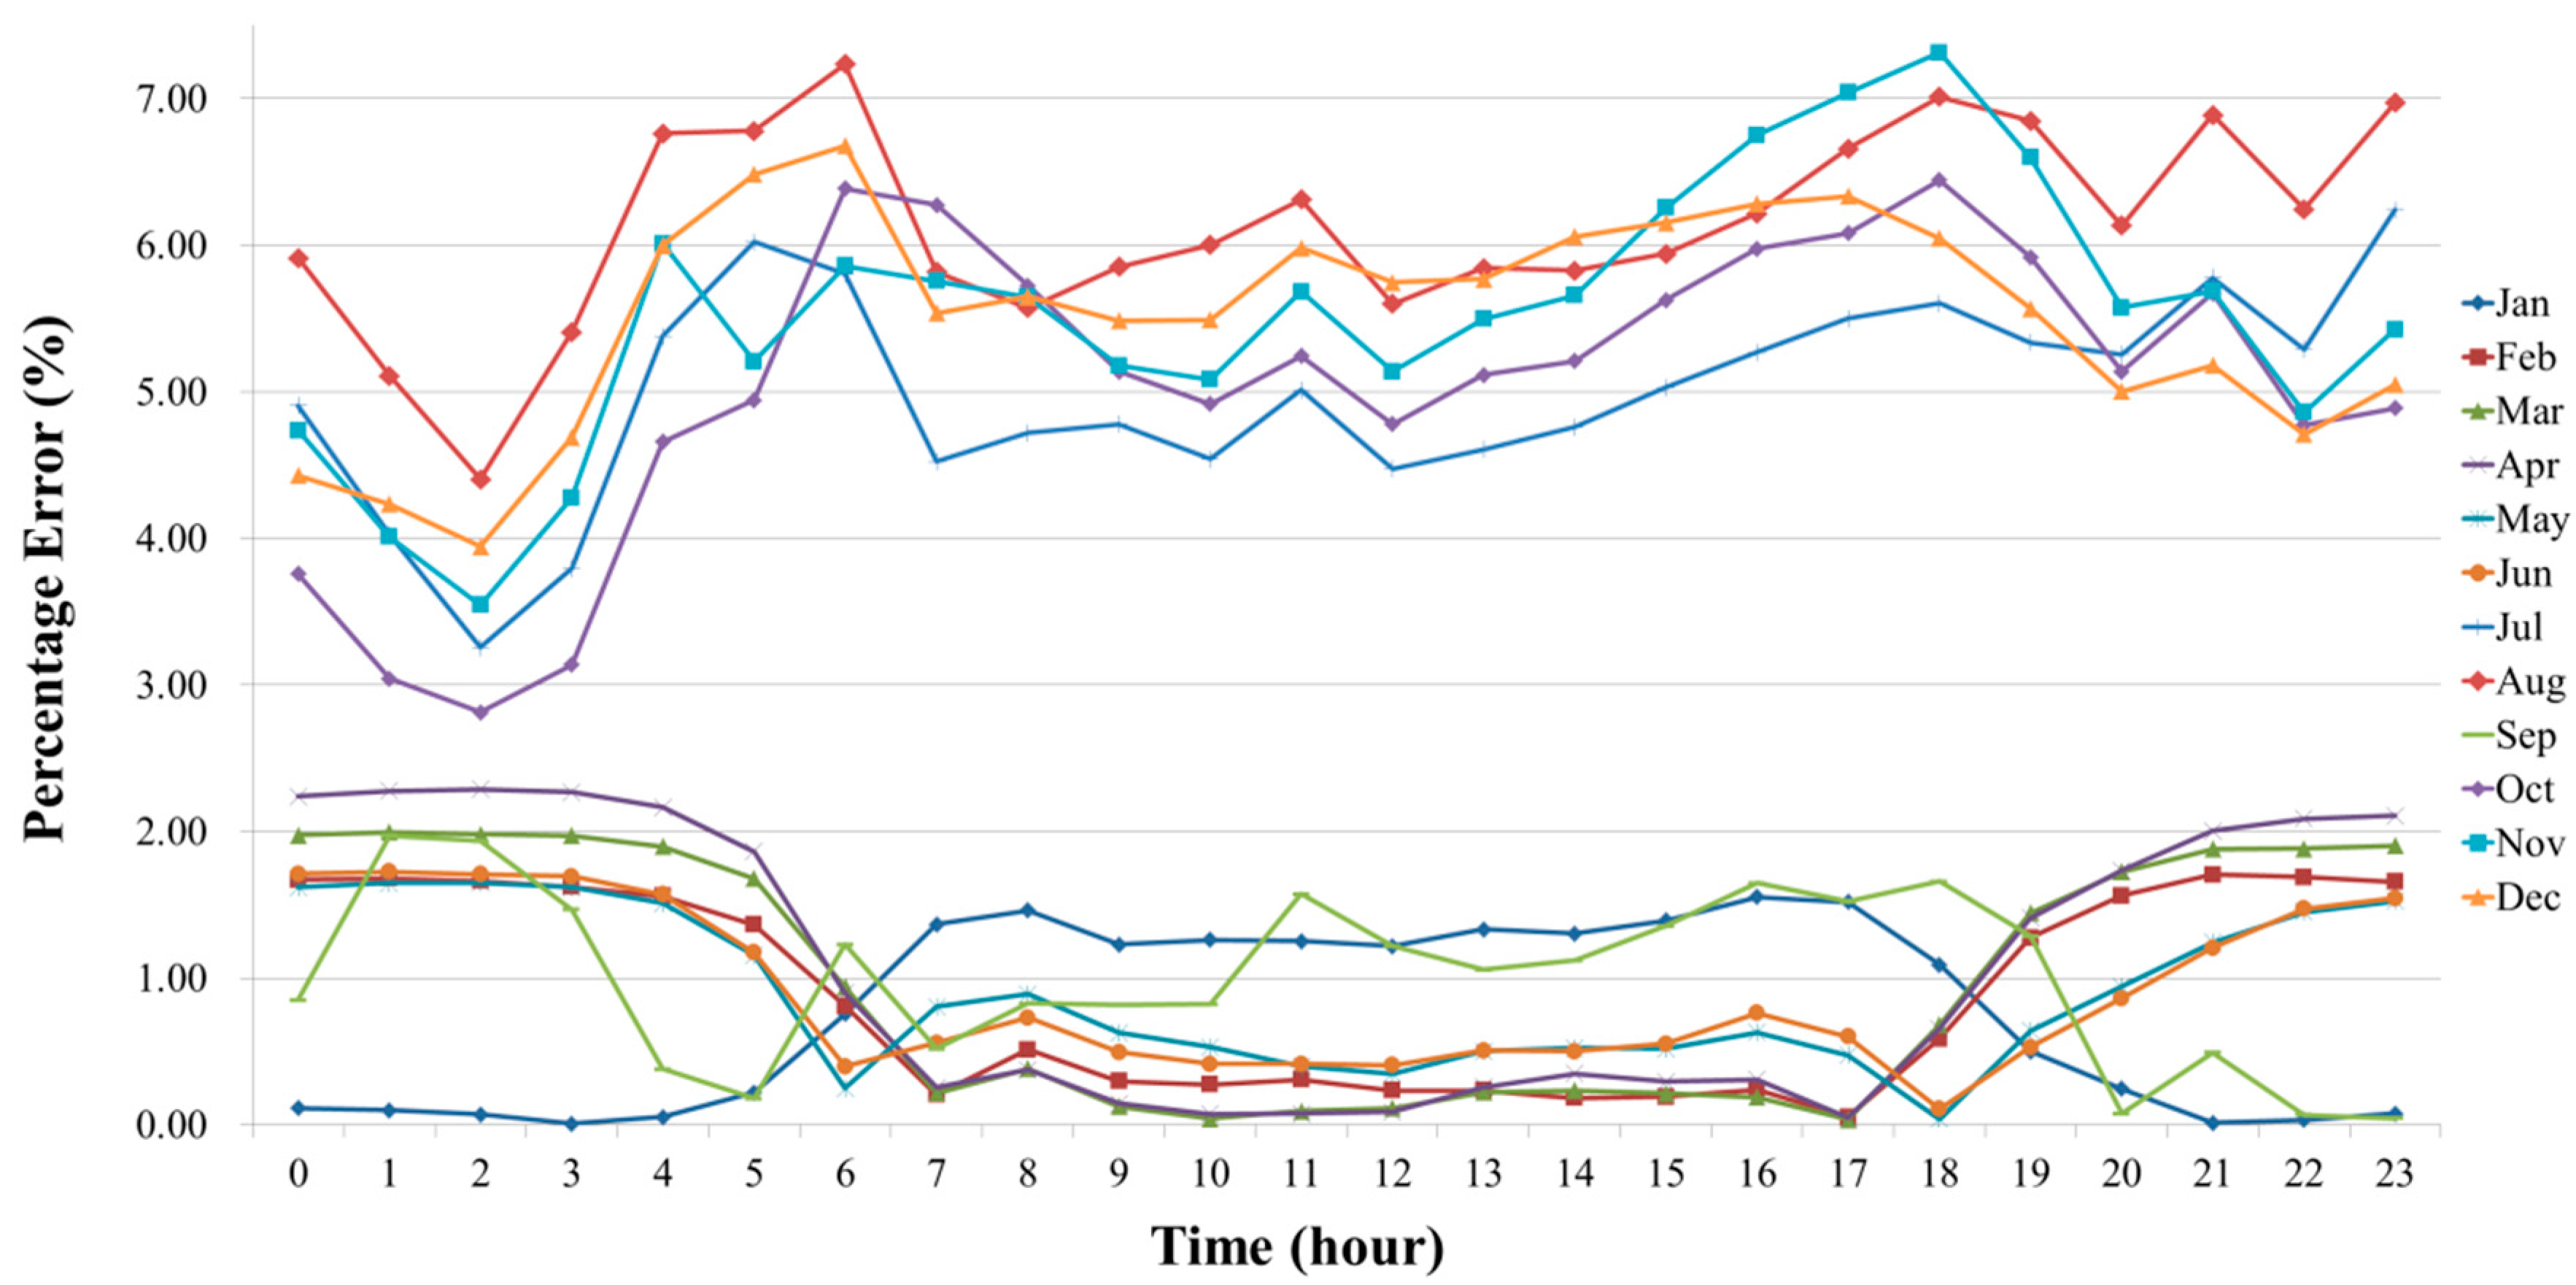
4.4. Equity of Total Evacuation Demand-Weighted Distance

The demand-weighted distance was calculated using the product of the evacuation distance and the evacuation demand, acquired through the closest facility analysis. In addition, the Gini coefficients were calculated by analyzing the total evacuation demand-weighted distances for each outdoor evacuation site. The analysis results are shown in Figure 13. Notably, the Gini coefficient of the evacuation demand using census population data was 0.7419. The minimum and maximum Gini coefficients of the evacuation demand using the floating population data were 0.7611 (as of 22:00 December) and 0.7957 (as of 07:00 September), respectively. Further, the Gini coefficient error percentages of the total evacuation demand-weighted distance were analyzed using Equation (2), and the results are shown in Figure 14. The minimum and maximum error rates were 2.52% and 6.75%, respectively, with an average rate of 3.95%.

5. Discussion

The selection criteria for emergency evacuation site locations are centered around the physical attributes of a location [38], therefore, buildings should be designated as structurally safe evacuation sites only if they can easily accommodate the capacity required by the local population [39]. In order to provide equal service to all residents in the event of an earthquake, shelters—as public goods—should be distributed in a spatially uniform way.
This study analyzed error differences between the use of census data and floating population data to evaluate the equity of evacuation accessibility. The results show that the use of census population data may yield significant errors when evaluating the equity of evacuation accessibility when the floating population data based on mobile phone location data are assumed to be exact values. Furthermore, the results of deriving and comparing the Gini coefficients of the local evacuation facilities secured capacity, evacuation demand, and demand-weighted distance showed maximum error rate differences of 7.31%, 18.18%, and 6.75%, respectively. In previous studies (e.g., [11,20,22]), evacuation accessibility is considered an important objective for evaluating the equity of evacuation accessibility or selecting shelter locations. However, the use of the census population may not be feasible for accurately analyzing unexpected disaster situations, such as sudden earthquakes. Similar to the findings of Yun et al. [17], our results imply that errors may occur when only census population data are used for analyzing evacuation site accessibility. Further, the use of mobile phone location data effectively reflects the actual population in an area during disaster situations.
Since this study used data from only one city to analyze the limitations of census population data in equity evaluation, the demographic and socio-cultural factors of the city were not considered. Accordingly, the results of this study can only be regarded as one case study—the distribution of the floating population according to city attributes was not a variable. Further empirical studies analyzing monthly, seasonal, and hourly city attribute data should be conducted.
Although this study highlights the issues involved in using census population data in arranging disaster evacuation strategies, which are difficult to establish due to short detection and prediction times, there are still several limitations in the analysis and interpretation of results. First, this study had limitations in analyzing the actual evacuation distance because the center point of the census polygon was set as the starting point in the evacuation accessibility analysis. Second, the accuracy of the population distribution prediction may vary from the actual distribution. The population was allocated based on the total building area to provide uniformity in the scope of spatial analysis. According to previous studies [40,41], the distribution of the floating population is affected not only by building density, but also by traffic environment, land use, and building use. This study did not focus on estimating the floating population—such a project requires a detailed analysis of the physical environment and demographics of the target site. Third, the availability of road networks was not considered because this study did not include an analysis of earthquake scenarios. Evacuation strategies using earthquake scenarios should analyze evacuation routes by considering the possibility of road disruptions due to collapsed buildings and road destruction (e.g., [42,43]). Lastly, this study assumed an exact value for the floating population based on mobile phone location data. However, because the ratio between mobile subscribers and the actual total population varies by region, it is insufficient for estimating the actual population distribution [41,44]. More research is needed to improve the accuracy and reliability of floating population estimations based on mobile phone location data. For example, very young or very old people may not use a cell phone. In addition, the distribution of base stations may differ between urban and rural areas, which can affect the results of floating population estimations [17].
Accounting for these limitations can reduce the margin of error in using floating population data to predict actual evacuation demand, especially compared to using census population data. Notably, using floating population data acquired through mobile data enables the easy simulation of an actual evacuation because the data can be categorized by age and gender. These characteristics will enable future scholars to better consider vulnerable populations in conducting further research on evacuation facility location selection.
Crucially, our study used the Gini coefficient. Drezner et al. [34] reflect that although the minimum Gini coefficient represents fairness, the coefficient can yield very inefficient solutions. Thus, the Gini coefficient itself should not be employed as the objective function [11]. To be sure, planners must consider not only physical conditions and efficiency but also the equity of evacuation accessibility when selecting emergency evacuation site locations, such as outdoor evacuation sites prepared for earthquakes. Studies by Drezner et al. [34] and Karsu and Morton [31] advise on how to minimize such inequality.

6. Conclusions

Although the concept of equity has not received much attention compared to physical conditions and efficiency when addressing public facility location selection problems, it is important to minimize inequality in public services and secure equity, particularly for outdoor evacuation sites designated for emergency evacuation in situations in which evacuation demand is difficult to predict, such as earthquakes. The results of this study demonstrate the limitations of using census population data in preparing for unpredictable disaster situations. Furthermore, floating population data acquired through mobile phone location data can serve as an alternative to static census data, and is likely to supplement the limitations of census population data with the help of technologies related to IoT (the Internet of Things) and ICT (information and communications technology). It is expected that this research will contribute to future comprehensive and cohesive research on earthquake evacuation strategies according to the equity of evacuation accessibility. In turn, research will lead to better preparedness and responses to earthquake evacuation problems.

Author Contributions

All authors contributed extensively to the work. Y.H.L. and S.C.B. conceptualized and designed the study. Y.H.L., J.S.L., and S.C.B. produced the data required to apply the methodology to the study area and conducted the analysis, validation, and writing-original draft preparation. W.H.H. and J.S.L. analyzed the results, and drafted and edited the manuscript. Y.H.L. and W.H.H. supervised the project and acquired the funding. All authors have read and agreed to the published version of the manuscript.

Funding

This research received no external funding.

Acknowledgments

This research was supported by Basic Science Research Program through the National Research Foundation of Korea (NRF) funded by the Ministry of Science, ICT & Future Planning (No. 2015R1A5A1037548). This research was supported by Basic Science Research Program through the National Research Foundation of Korea (NRF) funded by the Ministry of Education (No. 2020R1I1A1A0107503711).

Conflicts of Interest

The authors declare no conflict of interest.

References

  1. Chen, Z.; Chen, X.; Li, Q.; Chen, J. The temporal hierarchy of shelters: A hierarchical location model for earthquake-shelter planning. Int. J. Geogr. Inf. Sci. 2013, 27, 1612–1630. [Google Scholar] [CrossRef]
  2. Soltani, A.; Ardalan, A.; Darvishi Boloorani, A.; Haghdoost, A.; Hosseinzadeh-Attar, M.J. Criteria for Site Selection of Temporary Shelters after Earthquakes: A Delphi Panel. PLoS Curr. Dis. 2015, 7. [Google Scholar] [CrossRef] [PubMed]
  3. Liu, Q.; Ruan, X.; Shi, P. Selection of emergency shelter sites for seismic disasters in mountainous regions: Lessons from the 2008 Wenchuan Ms 8.0 Earthquake, China. J. Asian Earth Sci. 2011, 40, 926–934. [Google Scholar] [CrossRef]
  4. Xu, J.; Yin, X.; Chen, D.; An, J.; Nie, G. Multi-criteria location model of earthquake evacuation shelters to aid in urban planning. Int. J. Dis. Risk Reduct. 2016, 20, 51–62. [Google Scholar] [CrossRef]
  5. Anhorn, J.; Khazai, B. Open space suitability analysis for emergency shelter after an earthquake. Nat. Hazards Earth Syst. Sci. 2015, 15, 789–803. [Google Scholar] [CrossRef] [Green Version]
  6. Nappi, M.M.L.; Souza, J.C. Disaster management: Hierarchical structuring criteria for selection and location of temporary shelters. Nat. Hazards 2015, 75, 2421–2436. [Google Scholar] [CrossRef]
  7. Yu, J.; Wen, J. Multi-criteria satisfaction assessment of the spatial distribution of urban emergency shelters based on high-precision population estimation. Int. J. Dis. Risk Sci. 2016, 7, 413–429. [Google Scholar] [CrossRef] [Green Version]
  8. Wang, D.; Xi, M.; Chen, Y. A Dynamic Shelter Location and Victim Resettlement Model Considering Equitable Waiting Costs. Int. J. Environ. Res. Public Health 2020, 17, 471. [Google Scholar] [CrossRef] [Green Version]
  9. Bayram, V.; Yaman, H. A stochastic programming approach for shelter location and evacuation planning. RAIRO-Oper. Res. 2018, 52, 779–805. [Google Scholar] [CrossRef] [Green Version]
  10. Alçada-Almeida, L.; Tralhao, L.; Santos, L.; Coutinho-Rodrigues, J. A multiobjective approach to locate emergency shelters and identify evacuation routes in urban areas. Geogr. Anal. 2009, 41, 9–29. [Google Scholar] [CrossRef]
  11. Mostajabdaveh, M.; Gutjahr, W.J.; Sibel Salman, F. Inequity-averse shelter location for disaster preparedness. IISE Trans. 2019, 51, 809–829. [Google Scholar] [CrossRef]
  12. Zhao, L.; Li, H.; Sun, Y.; Huang, R.; Hu, Q.; Wang, J.; Gao, F. Planning emergency shelters for urban disaster resilience: An integrated location-allocation modeling approach. Sustainability 2017, 9, 2098. [Google Scholar] [CrossRef] [Green Version]
  13. Kim, M.; Kang, S.; Kim, S.; Sohn, H. A Spatial Analysis of Shelter Capacity Using Floating Population. J. Korean Soc. Surv. Geod. Photogramm. Cartogr. 2016, 34, 1–10. [Google Scholar] [CrossRef]
  14. Deville, P.; Linard, C.; Martin, S.; Gilbert, M.; Stevens, F.R.; Gaughan, A.E.; Tatem, A.J. Dynamic population mapping using mobile phone data. Proc. Natl. Acad. Sci. USA 2014, 111, 15888–15893. [Google Scholar] [CrossRef] [PubMed] [Green Version]
  15. Lee, W.K.; Sohn, S.Y.; Heo, J. Utilizing mobile phone-based floating population data to measure the spatial accessibility to public transit. Appl. Geogr. 2018, 92, 123–130. [Google Scholar] [CrossRef]
  16. Wu, H.; Liu, L.; Yu, Y.; Peng, Z. Evaluation and planning of urban green space distribution based on mobile phone data and two-step floating catchment area method. Sustainability 2018, 10, 214. [Google Scholar] [CrossRef] [Green Version]
  17. Yun, S.B.; Kim, S.; Ju, S.; Noh, J.; Kim, C.; Wong, M.S.; Heo, J. Analysis of accessibility to emergency rooms by dynamic population from mobile phone data: Geography of social inequity in South Korea. PLoS ONE 2020, 15, e0231079. [Google Scholar] [CrossRef] [Green Version]
  18. Marsh, M.T.; Schilling, D.A. Equity measurement in facility location analysis: A review and framework. Eur. J. Oper. Res. 1994, 74, 1–17. [Google Scholar] [CrossRef]
  19. Tsou, K.W.; Hung, Y.T.; Chang, Y.L. An accessibility-based integrated measure of relative spatial equity in urban public facilities. Cities 2005, 22, 424–435. [Google Scholar] [CrossRef]
  20. Li, Q.; Guo, J.; Tan, X.; Chen, J. Equity measurement of spatial layout for emergency shelters with consideration of the needs of vulnerable populations. In Risk Analysis Based on Data and Crisis Response Beyond Knowledge, Proceedings of the 7th International Conference on Risk Analysis and Crisis Response (RACR 2019), Athens, Greece, 15–19 October 2019; CRC Press: Boca Raton, FL, USA, 2019; pp. 86–92. [Google Scholar]
  21. Sabouhi, F.; Tavakoli, Z.S.; Bozorgi-Amiri, A.; Sheu, J.B. A robust possibilistic programming multi-objective model for locating transfer points and shelters in disaster relief. Transp. A Transp. Sci. 2019, 15, 326–353. [Google Scholar] [CrossRef]
  22. Kılcı, F.; Kara, B.Y.; Bozkaya, B. Locating temporary shelter areas after an earthquake: A case for Turkey. Eur. J. Oper. Res. 2015, 243, 323–332. [Google Scholar] [CrossRef]
  23. Ahn, Y.; Chae, Y. Analyzing spatial equality of cooling service shelters, Central district of Seoul metropolitan city, South Korea. Spat. Inf. Res. 2018, 26, 619–627. [Google Scholar] [CrossRef] [Green Version]
  24. Romero, N.; Nozick, L.K.; Xu, N. Hazmat facility location and routing analysis with explicit consideration of equity using the Gini coefficient. Transp. Res. Part E Logist. Transp. Rev. 2016, 89, 165–181. [Google Scholar] [CrossRef]
  25. Tao, Z.; Cheng, Y.; Dai, T.; Rosenberg, M.W. Spatial optimization of residential care facility locations in Beijing, China: Maximum equity in accessibility. Int. J. Health Geogr. 2014, 13, 33. [Google Scholar] [CrossRef] [PubMed] [Green Version]
  26. Gutjahr, W.J.; Fischer, S. Equity and deprivation costs in humanitarian logistics. Eur. J. Oper. Res. 2018, 270, 185–197. [Google Scholar] [CrossRef]
  27. Wang, X.J.; Zhang, J.Y.; Shahid, S.; ElMahdi, A.; He, R.M.; Wang, X.G.; Ali, M. Gini coefficient to assess equity in domestic water supply in the Yellow River. Mitig. Adapt. Strateg. Glob. Chang. 2012, 17, 65–75. [Google Scholar] [CrossRef]
  28. Batta, R.; Lejeune, M.; Prasad, S. Public facility location using dispersion, population, and equity criteria. Eur. J. Oper. Res. 2014, 234, 819–829. [Google Scholar] [CrossRef]
  29. Zhan, S.L.; Liu, N.; Ye, Y. Coordinating efficiency and equity in disaster relief logistics via information updates. Int. J. Syst. Sci. 2014, 45, 1607–1621. [Google Scholar] [CrossRef]
  30. Ransikarbum, K.; Mason, S.J. Goal programming-based post-disaster decision making for integrated relief distribution and early-stage network restoration. Int. J. Prod. Econ. 2016, 182, 324–341. [Google Scholar] [CrossRef]
  31. Karsu, Ö.; Morton, A. Inequity averse optimization in operational research. Eur. J. Oper. Res. 2015, 245, 343–359. [Google Scholar] [CrossRef] [Green Version]
  32. Jang, S.; An, Y.; Yi, C.; Lee, S. Assessing the spatial equity of Seoul’s public transportation using the Gini coefficient based on its accessibility. Int. J. Urban Sci. 2017, 21, 91–107. [Google Scholar] [CrossRef]
  33. Eiselt, H.A.; Laporte, G. Objectives in location problems. In Facility Location: A Survey of Applications and Methods; Drezner, Z., Ed.; Springer: New York, NY, USA, 1995; pp. 173–176. [Google Scholar]
  34. Drezner, T.; Drezner, Z.; Guyse, J. Equitable service by a facility: Minimizing the Gini coefficient. Comput. Oper. Res. 2009, 36, 3240–3246. [Google Scholar] [CrossRef]
  35. Kim, Y.S. Current Status of Old Buildings and Future Tasks; National Assembly Research Service: Seoul, Korea, 2020; Available online: www.nars.go.kr (accessed on 14 August 2020).
  36. Lu, X.; Bengtsson, L.; Holme, P. Predictability of population displacement after the 2010 Haiti earthquake. Proc. Natl. Acad. Sci. USA 2012, 109, 11576–11581. [Google Scholar] [CrossRef] [PubMed] [Green Version]
  37. Yabe, T.; Sekimoto, Y.; Tsubouchi, K.; Ikemoto, S. Cross-comparative analysis of evacuation behavior after earthquakes using mobile phone data. PLoS ONE 2019, 14, e0211375. [Google Scholar] [CrossRef] [PubMed]
  38. Bae, K.Y.; Park, H.J.; Jun, S.M.; Jung, J.C. Evaluating the Location of Tsunami Emergency Shelters for the Children and the Old. J. Korean Soc. Hazard Mitig. 2018, 18, 113–123. [Google Scholar] [CrossRef]
  39. Lee, S.H.; Goo, S.H.; Chun, Y.W.; Park, Y.J. The Spatial Location Analysis of Disaster Evacuation Shelter for Considering Resistance of Road Slope and Difference of Walking Speed by Age—Case Study of Seoul, Korea. J. Korean Soc. Geospat. Inf. Sci. 2015, 23, 69–77. [Google Scholar] [CrossRef]
  40. Yim, S.Y.; Kim, H.C.; Kim, D.J.; An, Y.S. A Study on the Estimating of the Floating Population of Walking Street by the Multiple Regression Model—Focusing on Gangnam and Seocho-gu in Seoul. Seoul Stud. 2019, 20, 121–139. [Google Scholar]
  41. Yao, Y.; Liu, X.; Li, X.; Zhang, J.; Liang, Z.; Mai, K.; Zhang, Y. Mapping fine-scale population distributions at the building level by integrating multisource geospatial big data. I. J. Geogr. Inf. Sci. 2017, 31, 1220–1244. [Google Scholar] [CrossRef]
  42. Hirokawa, N.; Osaragi, T. Earthquake disaster simulation system: Integration of models for building collapse, road blockage, and fire spread. J. Dis. Res. 2016, 11, 175–187. [Google Scholar] [CrossRef]
  43. No, W.; Choi, J.; Park, S.; Lee, D. Balancing Hazard Exposure and Walking Distance in Evacuation Route Planning during Earthquake Disasters. ISPRS Int. J. Geo-Inf. 2020, 9, 432. [Google Scholar] [CrossRef]
  44. Kang, C.; Liu, Y.; Ma, X.; Wu, L. Towards estimating urban population distributions from mobile call data. J. Urban Technol. 2012, 19, 3–21. [Google Scholar] [CrossRef]
Figure 1. Illustration of a Lorenz curve and Gini coefficient.
Sustainability 12 08046 g001
Figure 2. Research flow chart.
Sustainability 12 08046 g002
Figure 3. (a) Study area, Daegu City, South Korea, (b) distribution of buildings and outdoor evacuation sites, (c) census boundary-based static population distribution, and (d) administrative boundary-based population distribution.
Sustainability 12 08046 g003aSustainability 12 08046 g003b
Figure 4. Illustration of floating population details. (Source: http://s4u.daegu.go.kr/analysis#/servicePopulation).
Sustainability 12 08046 g004
Figure 5. Gini coefficient analysis results on secured shelter capacity based on administrative boundary.
Sustainability 12 08046 g005
Figure 6. Analysis results of Gini coefficient error rates on secured shelter capacity.
Sustainability 12 08046 g006
Figure 7. Closest facility analysis result.
Sustainability 12 08046 g007
Figure 8. Frequency distribution of evacuation distances.
Sustainability 12 08046 g008
Figure 9. Gini coefficients using the shortest distance-based evacuation route.
Sustainability 12 08046 g009
Figure 10. Schematic diagram of floating population allocation for the census boundary.
Sustainability 12 08046 g010
Figure 11. Gini coefficient results of evacuation demand based on the shortest distance.
Sustainability 12 08046 g011
Figure 12. Gini coefficient error rate results for evacuation demand.
Sustainability 12 08046 g012
Figure 13. Gini coefficient results of total evacuation demand-weighted distances based on the closest distance.
Sustainability 12 08046 g013
Figure 14. Gini coefficient error rate results for total evacuation demand-weighted distances.
Sustainability 12 08046 g014
Table 1. Previous research on the selection of public facility locations using equity.
TypeAuthor (year)FacilityTarget of Equity Concept
ShelterWang et al. (2020) [8]Earthquake shelterWaiting Costs
Mostajabdaveh et al. (2019) [11]Open shelterEvacuation distance
(Gini coefficient)
Li et al. (2019) [20]Earthquake and emergency evacuation shelterEvacuation distance
(standard deviation)
Sabouhi et al. (2019) [21]Transfer point and shelterTransportation distance
(standard deviation)
Kılcı et al. (2015) [22]Earthquake temporary shelterEvacuation distance,
utilization of individual shelter
Ahn and Chae (2018) [23]Cooling service shelterPercentage of satisfied demand
Non-shelterBatta et al. (2014) [28]Public facilityDistance
(standard deviation)
Romero et al. (2016) [24]Facility for hazardous materialsHousehold income
(Gini coefficient)
Tao et al. (2014) [25]Residential care facilityElderly population, distance (variance)
Zhan et al. (2014) [29]Disaster relief suppliersPercentage of satisfied demand
Ransikarbum and Mason (2016) [30]Supply port and warehousePercentage of satisfied demand
Gutjahr and Fischer (2018) [31]Mobile health care teamDeprivation cost
(Gini coefficient)
Wang et al. (2012) [27]Domestic water supplyPopulation for domestic water use
(Gini coefficient)
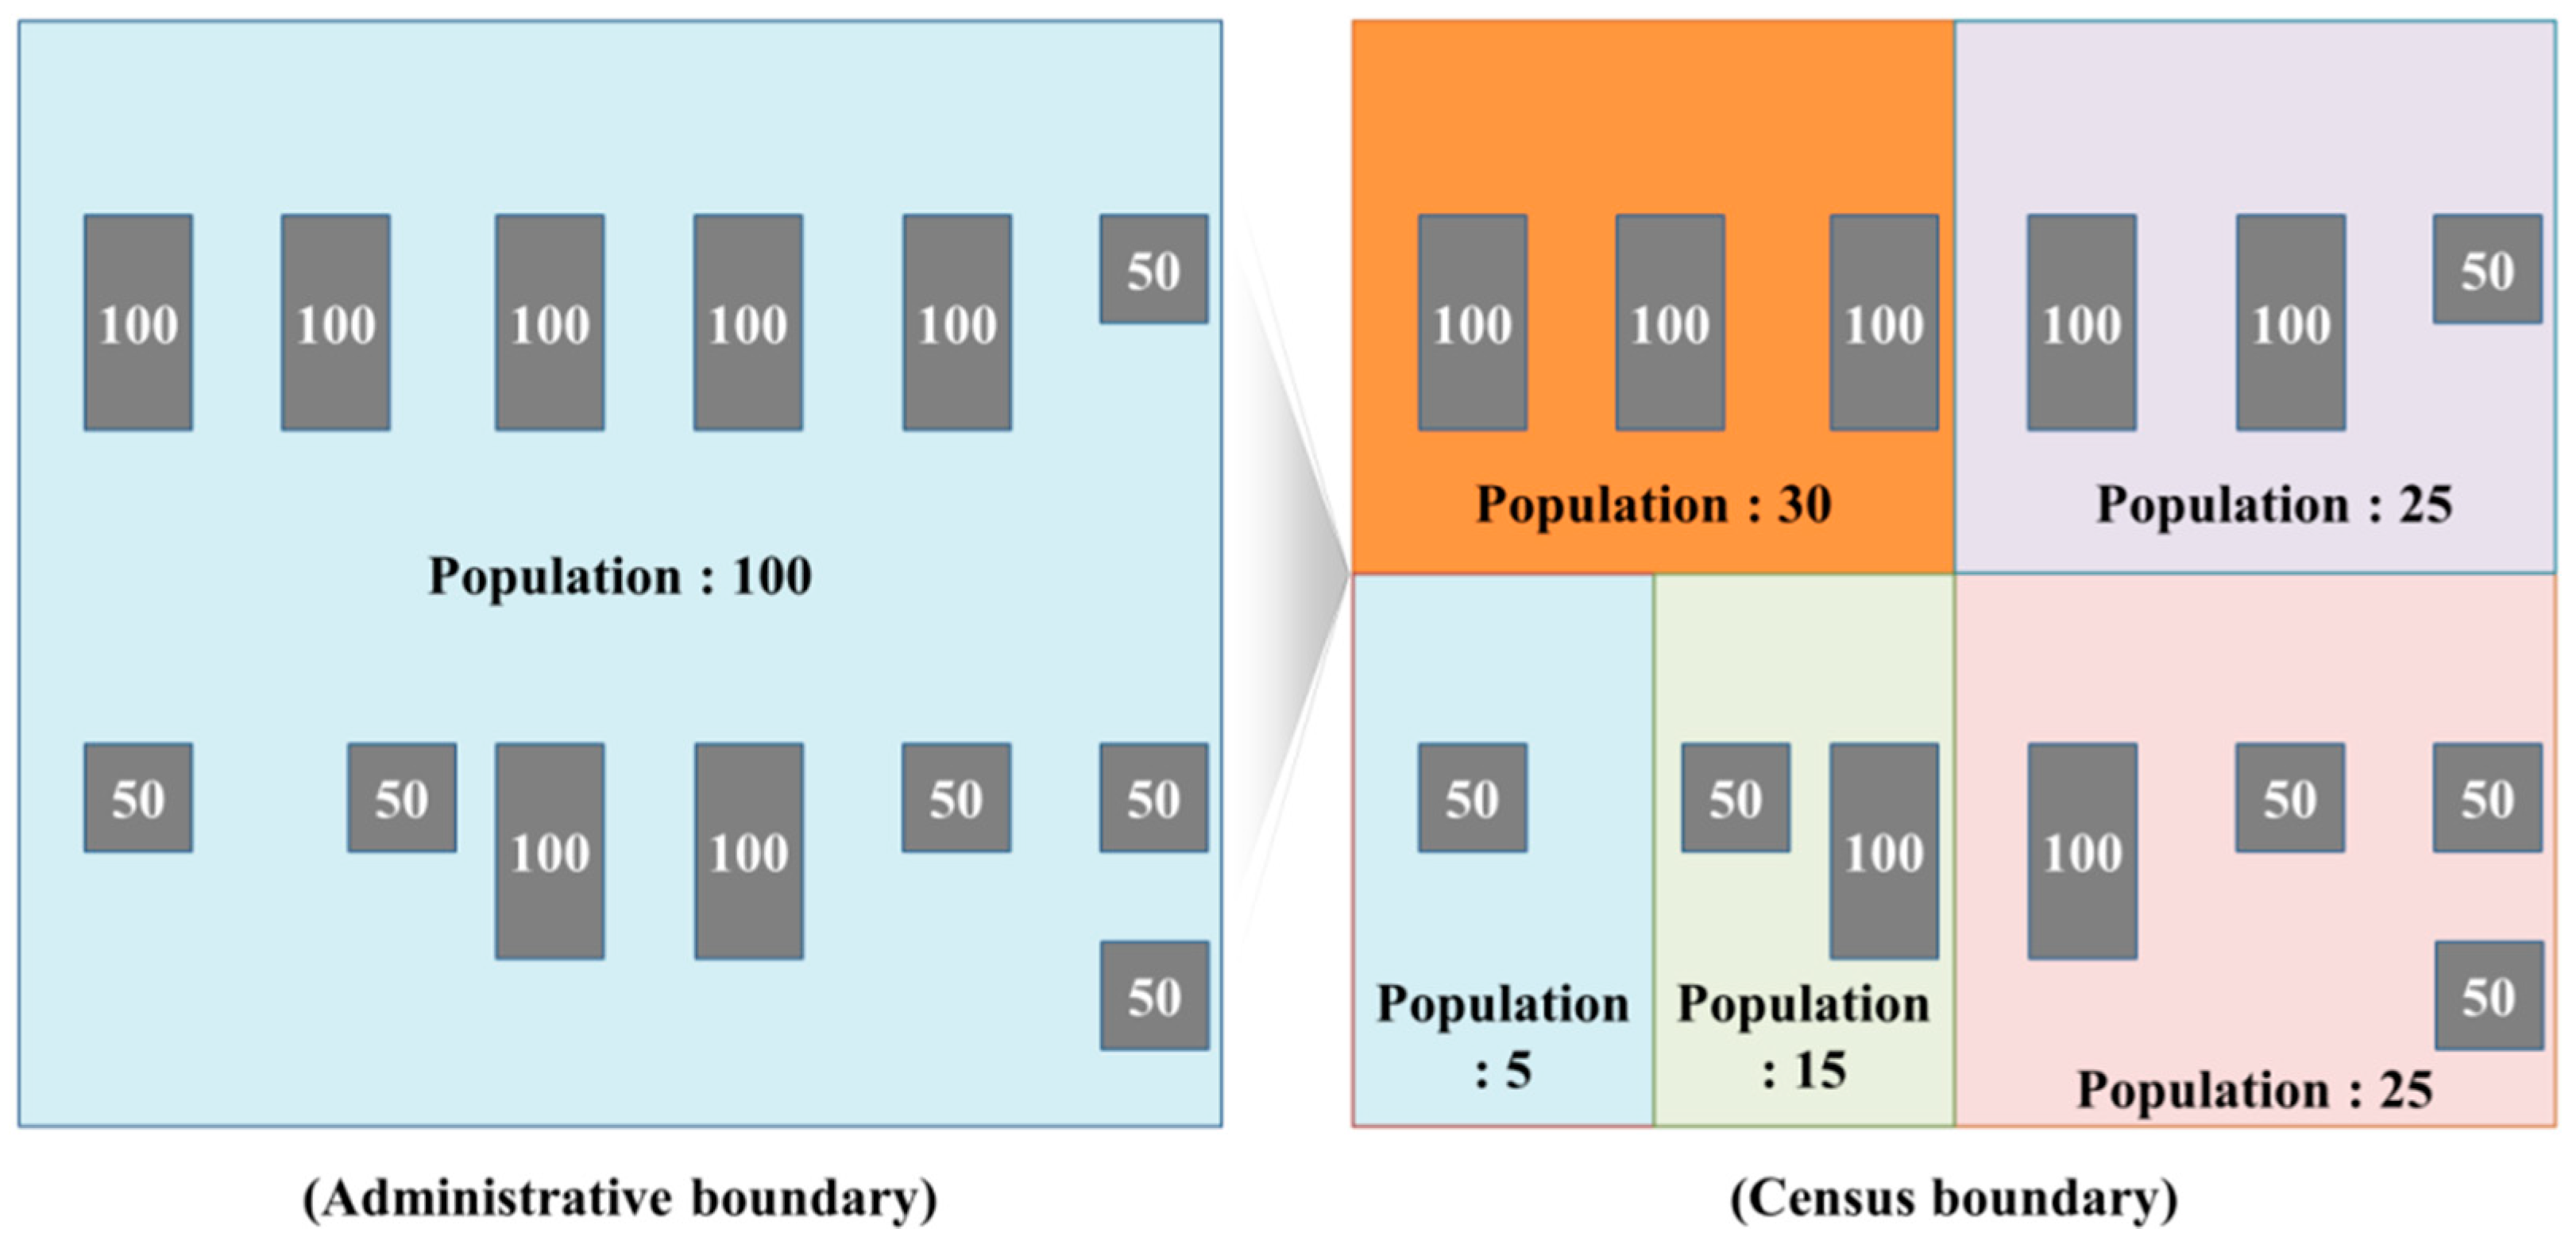
Table 2. Summary of equity analysis.
Target of Equity AnalysisSpatial BoundaryVariable
Secured shelter capacityAdministrative boundaryPopulation, capacity
Evacuation demandCensus boundaryPopulation
Demand-weighted distanceCensus boundaryPopulation, evacuation distance
Table 3. Capacity of outdoor evacuation site relative to the resident population in the study area.
DivisionNumberArea (m2)Capacity *
Outdoor Evacuation Site7067,407,154.942,244,592 (93.60%) *
/7,407,154.94 (308.90%) **
* Calculated based on 3.3 m2/person; ** Calculated based on 1 m2/person.
Table 4. Data used for analysis.
TypeDescriptionFormatSource
Administrative boundary
(‘Haengjeong-dong’ boundary)
‘Haengjeong-dong’ denotes an administrative district of the Republic of Korea, and is a district established by local governments for administrative convenience of the district in accordance with increase and decrease in the number of residentsShphttp://data.nsdi.go.kr
Census boundarySize of one census boundary is about 1/30 of one administrative boundary. It is the smallest statistical boundary unit provided by Statistics Korea.Shphttp://data.nsdi.go.kr
Population data
(as of 2017)
CensusResident population within the census boundary Xlsxhttp://data.nsdi.go.kr
FloatingActive population residing in the small local unit by time and date acquired through mobile location dataXlsxhttps://s4u.daegu.go.kr/introduction/servicePopulation
Outdoor evacuation site dataLocationLocation information of outdoor evacuation sites (address)Texthttps://www.safekorea.go.kr
CapacityCapacity information of outdoor evacuation sites (area)
BuildingLocation and area of buildings for population distribution estimationShphttps://www.juso.go.kr/
Road centerlineUsed for constructing network data set for GIS network analysisShphttp://data.nsdi.go.kr
Table 5. Example of census population vs. floating population based on administrative boundary.
DivisionArea of Outdoor Evacuation Site (m2)Census Population DataFloating Population Data
(ex. as of 1 January 2017 12:00)
PopulationArea/Population (m2)PopulationArea/Population (m2)
min0.002233.000.00 66,649.00 (2149.97 *)0.00
(0.00 *)
max911,128.0090,175.0010.10 2,278,747.00 (73,507.97 *)0.40
(12.39 *)
mean53,289.0017,540.003.04 637,946.00 (20,578.91 *)0.08
(2.59 *)
* The floating population data used in this study are the population data acquired and aggregated through a survey based on the area where each individual was staying at the time of the survey. The used data were collected as monthly and hourly data rather than daily data, hence, they were displayed as the estimated daily data based on the last day of the month to enhance readability.
Table 6. Analysis results of shortest distance-based evacuation distance and demand (based on census population).
DivisionEvacuation Distance (m)
Minimum0.00
Maximum10,195.07
Mean413.34
DivisionEvacuation Demand(People)
Sum2,370,110
Minimum0
Maximum19,602
Mean3357

