Article

Study on the Selection of Sections Applicable to Truck Platooning in the Expressway Network

1
Department of Transportation Engineering, Ajou University, Suwon 16499, Korea
2
Smart-Highway R&D Center, Korea Expressway Corporation, Gimcheon 18489, Korea
*
Author to whom correspondence should be addressed.
Sustainability 2020, 12(19), 8058; https://doi.org/10.3390/su12198058
Submission received: 1 September 2020 / Revised: 22 September 2020 / Accepted: 27 September 2020 / Published: 29 September 2020
(This article belongs to the Section Sustainable Transportation)

Abstract

:
Several research studies are being actively conducted on truck platooning, in which several trucks are organized in one fleet. The main advantages of truck platooning are increased traffic efficiency, improved fuel consumption and driver performance, and enhanced safety. However, these effects may depend on the actual conditions of road geometry and traffic situation. Therefore, this study analyzed the sustainability of truck platooning on an expressway network in terms of road geometry and traffic situation. To select elements affecting truck platooning on an expressway network, an expert survey was conducted. In addition, the weight of each element selected in the survey was determined through an analytic hierarchy process. In this study, the geometric conformity and traffic environment indices for truck platooning were calculated based on the data collected by the congestion zone (Conzone) and the weights. Moreover, the calculated indices were clustered into three different categories through cluster analysis. Based on the cluster analysis result, each Conzone was classified into three types: Type 1, which is suitable for both traffic environment and geometric conformity to operate platooning; Type 2, which has geometrical conditions but requires improvement of traffic environment; and Type 3, which requires geometrical improvement. Finally, the Type 1 Conzones were expanded to expressway sections to consider the network connectivity and truck platoon operability. The obtained results revealed that 14 sections of 9 expressway lines are most applicable for truck platooning.

1. Introduction

1.1. Research Background and Purpose

Recently, advances in technology development have led to increased research attention on autonomous vehicles. Although studies focusing on autonomous driving of passenger cars began in the 1950s, research on autonomous driving of large trucks began late in the mid-1990s as a format for truck platooning. However, in recent years studies on truck platooning, in which several trucks form a platoon, have significantly increased globally [1,2,3].
In Korea, several efforts have been made to support technologies related to autonomous vehicles through the “roadmap for proactive regulatory revolution in the field of autonomous vehicles”. For example, from 2018 to 2021, the Ministry of Land, Infrastructure and Transport (MOLIT) is planning to develop a technology for safe driving control and operation of truck platooning through a research and development (R&D) project, called the “development of vehicle-to-everything (V2X)-based operation technology for truck platooning”. Moreover, follow-up studies are expected to start in 2021.
The EU aims to commercialize the truck platooning technology by 2025 with the “Truck Platooning Vision 2025”, where the following vehicle runs at 0.3 s time gap depending on the acceleration/deceleration and steering of the leading vehicle. The EU intends to reduce traffic accidents, fuel consumption, emissions, and CO2 through truck platooning. To this end, auto manufacturers, parts producers, intelligent transportation systems (ITS) and cooperative-ITS (C-ITS) companies, road management agencies, service providers, as well as information and communication technology (ICT) companies, are participating in various truck platooning projects. The Ensemble project is one of them. In the US, efforts are being made to solve factors other than vehicle technology, such as securing the reliability of autonomous vehicles, supporting vehicle-to-everything (V2X) communication infrastructure, improving legal systems, and promoting public acceptance through related demonstrations. The California Partners for Advanced Transit and Highways (PATH) in the US demonstrated truck platooning in 2010 using advanced driving assistant system (ADAS) and vehicle-to-vehicle (V2V) communication technology. During the demonstration, three trucks were driven at least 3–4 m apart, and successfully illustrated the join and leaving operations from the platoon. In addition, through this demonstration, the effects of truck platooning, including road capacity increase and fuel saving, were verified. The Texas A&M Transport Institute (TTI) carried out a truck platooning project through FHWA support and partnerships with private companies. Here, the platooning was performed with a level 2 autonomous vehicle with an actual driver. The Japan Automobile Research Institute (JARI) realized truck platooning in which 4 trucks were spaced at a distance of 4 m from 2008 to 2012. It is planning to commercialize truck platooning with driverless following vehicle after 2020.
In the EU SARTRE project, with the help of truck platooning, the leading truck obtained a fuel efficiency improvement of 2–8%, while the following trucks 8–13% [4]. Zhang et al. [4] present the amounts of fuel economy benefits of truck platooning suggested in various studies and the measurement methods used. Lammert et al. [5] suggested that the maximum reductions in fuel consumption were 5.3% for the leading vehicle and 9.7% for the following vehicle. However, Agriesti et al. [6] insisted that it is difficult to define a single value that allows the assessment of reductions in fuel economy. This is because that the amount of fuel consumption does not depend just on the features of truck platoon, including headway, speed, and number of trucks, but also on the environmental features (i.e., temperature, wind speed), driving behavior, surrounding traffic and geometric environment, and so on. In addition, Zhang et al. [4] pointed out that the reduction in fuel consumption shows a lot of difference in the actual experimental results, and in some studies the savings are less than expected.
Bibeka et al. [7] developed a mechanism to evaluate truck platooning’s impact on emissions under different scenarios using Vissim which is a microscopic traffic simulation model. They found that the gap setting of platoons is an important parameter in reducing the emissions where smaller gaps resulted in longer platoons and higher emission reductions. Jo et al. [8] estimated the benefits of travel time savings by truck platooning. In addition, truck platooning provides certain level of rest time without actual rest stop because the leading and following trucks share the rest time by alternating roles. Most studies related to truck platooning have focused on the aforementioned advantages, such as improving traffic congestion [9] and fuel savings [1], as well as enhancing safety [10].
However, the application of truck platooning does not lead to positive effects as expected, such as above-mentioned improvement in congestion and fuel savings, in all road geometric conditions and traffic situations. It is anticipated that the operability of truck platooning may depend on actual road geometry and traffic situations. Therefore, this study aims to select the sections applicable to truck platooning on uninterrupted roads (i.e., freeways, motorways, expressways), where the truck platooning technology is likely to be firstly applied. For that, in this study, the two indices indicating the applicability of truck platooning were calculated in the Conzone unit. Using cluster analysis, the applicability of each Conzone was clustered into three categories, among which, the most suitable category was identified. The analysis results in the Conzone unit were expanded to expressway sections to evaluate the network connectivity and truck platoon operability.

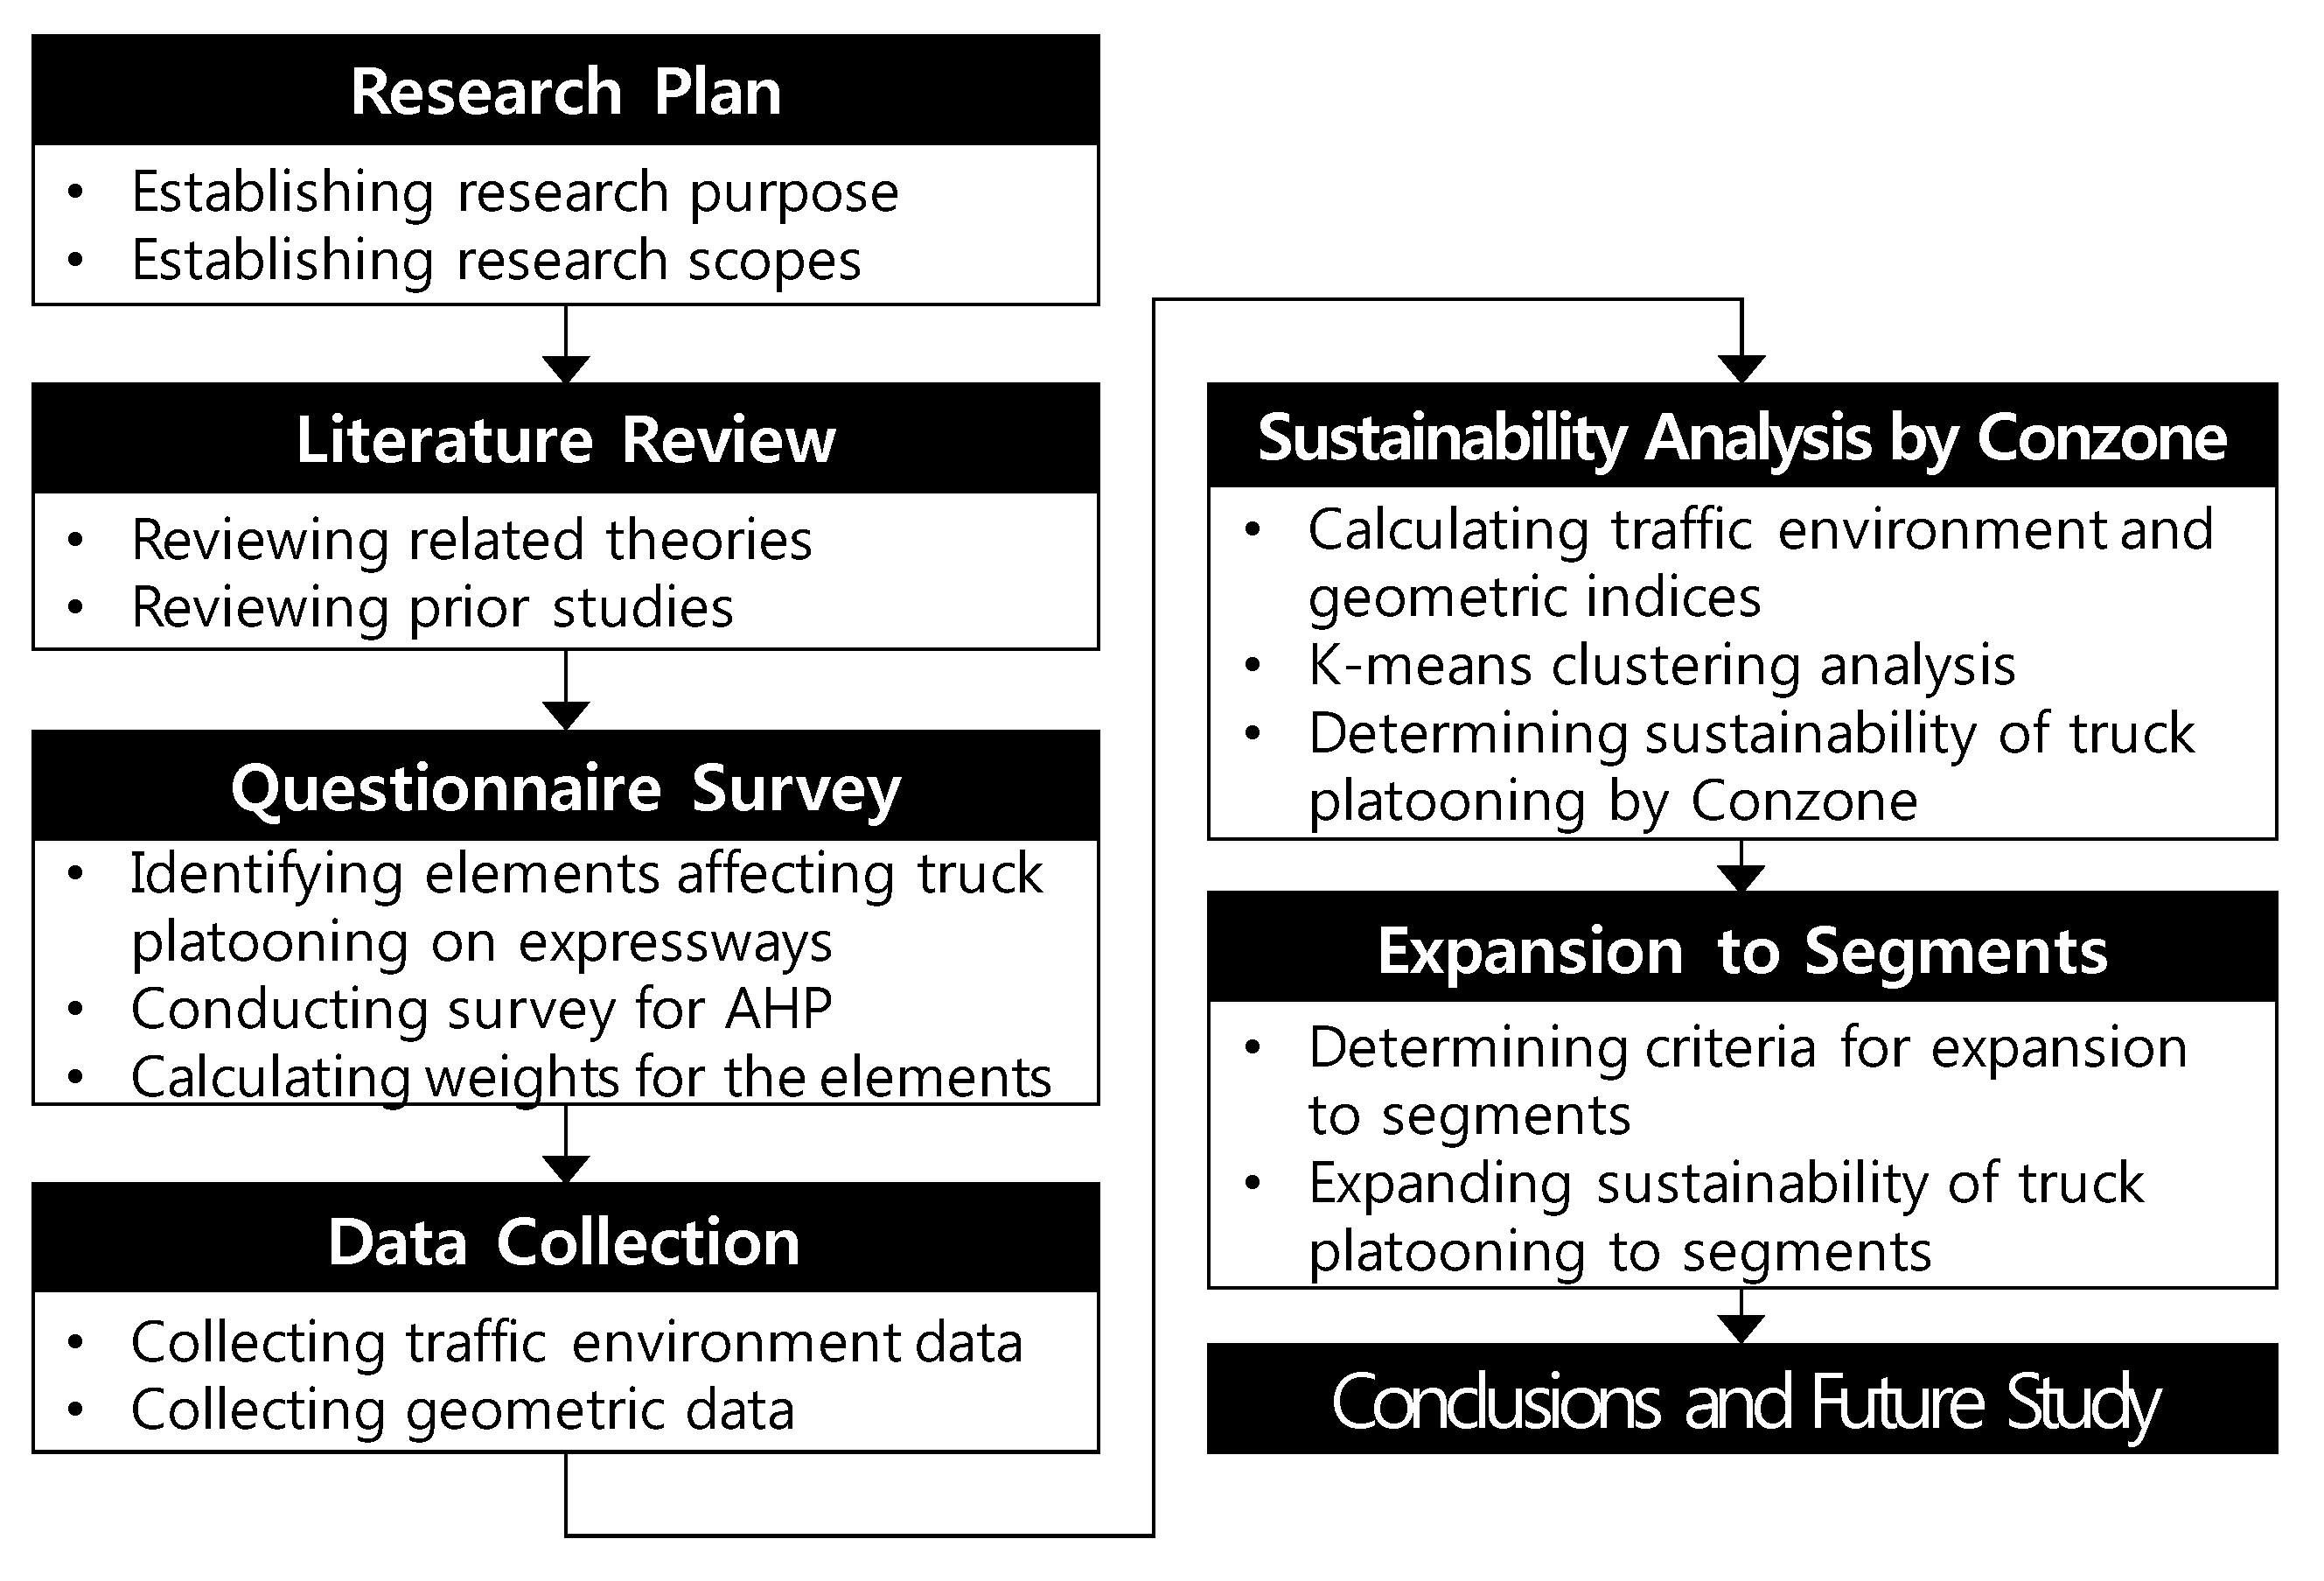
1.2. Research Scope and Process

As mentioned above, our spatial scope is the expressway network in Korea. In the case of autonomous vehicles, it is possible to use the capacity of lanes more efficiently when operating separately from ordinary vehicles [8]. However, for truck platooning, efficiently and safely following the leading vehicle in mixed traffic is the most essential feature. Therefore, the mixed operation of trucks in platoons and general vehicles is considered in this study.
To investigate the suitability of the operation of truck platooning on an expressway network, a study was conducted according to the procedure shown in Figure 1. First, the study plan, such as the background, purpose, scope, and its procedure, was established. Next, a review of related theories and studies was presented. Subsequently, a total of 2 surveys were conducted for autonomous vehicles and transportation experts. The first survey aimed to identify elements that are expected to affect the truck platooning operation on expressways. The second questionnaire was targeted to calculate weights to determine the relative importance of the derived elements. To this end, a pairwise comparison questionnaire was conducted for the analytic hierarchy process (AHP). Additionally, geometric and traffic data regarding the elements were collected in the Conzone unit. Here, Conzone is the segment between an interchange and another interchange on an expressway. Within a Conzone, the traffic and geometry are mostly constant. Then, using the weight and data, two truck platooning suitability indices, including the traffic environment and geometric conformity indices, were calculated for each Conzone. Next, each Conzone was divided into clusters based on these two indices. In addition, Conzones which are suitable for both the traffic environment and the geometrical structure conditions were expanded to sections, which means a group of consecutive Conzones to increase the applicability in an actual expressway network. Finally, the obtained results are summarized, and the limitations of the study and future research tasks are discussed.

2. Literature Review

2.1. Truck Platooning

Truck platooning means that several trucks compose and operate one single platoon by controlling the inter-vehicle spacing between continuously running trucks. The core of truck platooning technology can be divided into longitudinal and lateral control technologies. Longitudinal control technology enables trucks to make up a platoon to drive while maintaining a specific gap. Through this, the following vehicle (FV) follows the leading vehicle (LV), which serves as the leader of the platoon. The LV is manually controlled by the onboard driver, while the FV tracks and moves along its driving path [8]. Thus, the driver of the FV does not need special vehicle control during truck platooning.
Moreover, truck platooning technology, such as autonomous vehicles, can be defined at several levels depending on the technology used in the platoon. The European Road Transport Research Advisory Council classifies truck platoons into three levels, as shown in Table 1 below.
The expected effects of truck platooning include improved road safety, reduced fuel economy, increased road capacity, and reduced driver fatigue. Jassen et al. [12] discussed the economic and social value of truck platooning. In the case of LV, the fuel consumption reduction effect was 8%, while in the case of FV, it was 13%. Additionally, Jassen et al. [12] suggested quantitative effects, such as reduction in labor costs due to truck platooning, increased traffic capacity, and improved traffic safety under a few scenarios.
Tsugawa et al. [1] presented through an actual experiment an analysis result of an average increase in fuel efficiency of 13.8% when three 25-ton trucks formed a platoon and maintained a vehicle spacing of 10 m. Moreover, through a simulation experiment, the distance in the platoon was reduced from 10 m to 4 m, and the amount of reduction increased when driving, so that the effect increased as the inter-vehicle distance decreased. Ploeg et al. [9] performed truck platooning of six vehicles with cooperative adaptive cruise control (CACC). They measured the string stability at 70 km/h through actual vehicle experiments and revealed that truck platooning is possible with a headway time of 0.7 s. In addition, through actual vehicle experiments, the effects of passing traffic, fuel consumption, and exhaust gas reduction were presented. Amoozadeh et al. [13] presented the effect of reducing the speed dispersion due to truck platooning, improving the safety, and increasing the traffic volume through simulation. Jo et al. [8] tried to select the optimal expressway segment for truck platooning. They determined the priority of the segment by selecting the accident rate and proportion of the truck, the segment length, and the number of entry/exit points.

2.2. Implications

Related literature review confirmed a number of studies that analyzed the effects of truck platooning technologies, such as improving fuel economy, increasing traffic capacity, reducing driver fatigue, and improving traffic safety. However, there exists a lack of analysis on the sustainability of truck platooning operations, such as the conditions in which the positive effects of truck platooning are most likely to appear. Therefore, it is necessary to investigate the expressway environmental conditions in which truck platooning will be introduced, as in this study. We believe such investigation will contribute to maximize the positive effect of truck platooning.

3. Selection of Sections Applicable to Truck Platooning in the Expressway Network

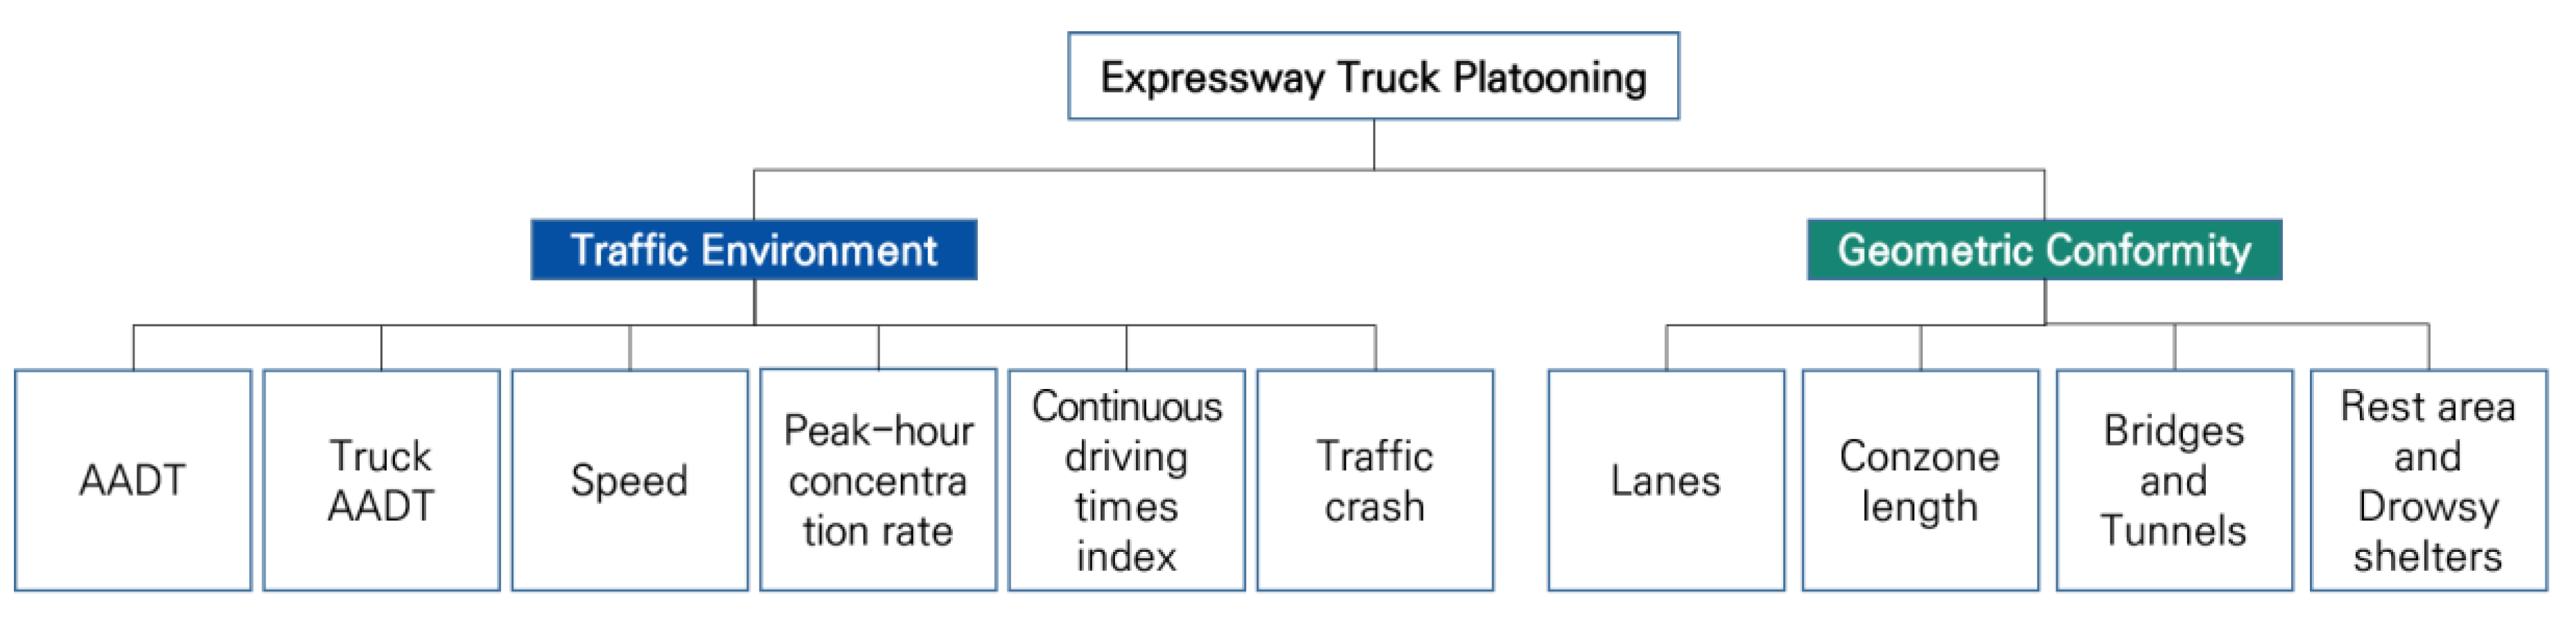
3.1. Elements Affecting Truck Platooning on Expressway

In this study, a total of 12 autonomous vehicles or traffic experts were designated as a pool of experts for the survey to derive elements affecting the operation of truck platooning on expressways. Through the survey, a total of 10 elements were drawn, as shown in Figure 2. The derived elements were largely divided into two groups, including traffic environment and geometry. The traffic environment elements include annual average daily traffic (AADT) for all vehicle types, AADT for trucks, daily average speed for all vehicle types, peak hour concentration rate, continuous driving time index, and number of traffic accidents. Four geometric elements were identified as effective elements for the truck platooning on expressways, including the number of lanes, the number of bridges and tunnels, the number of rest areas and drowsy shelters, as well as the Conzone length.
Here, the continuous driving time index is an index developed by the Korea Expressway Corporation (KEC) to determine whether a truck driver has a break [14]. This index is calculated for each Conzone by using the driving information (i.e., GPS coordinates, speed, etc.) of a freight vehicle equipped with a digital tachograph. For reference, in Korea, truck drivers are required by law to take a 15-min break after driving for 2 consecutive hours. By using the continuous running time index, we can estimate the average continuous running time of the truck driver while passing by each Conzone, and determine whether it exceeds the 2-h limit prescribed by law. In other words, the continuous running time index can indirectly indicate the driver fatigue for each Conzone [14,15].

3.2. Calculation of Element Weights

AHP is a technique developed by Professor Saaty of the University of Pennsylvania in the 1970s and is mainly used in preliminary feasibility studies in Korea [16]; it evaluates the importance by alternately pairing the indicators to be compared two by one, and determines the weight using the total score ratio; it provides multiple decision-making objectives or evaluation criteria, and in complex cases, supports systematic evaluation of mutually exclusive alternatives; it is widely used for multi-standard decision making, which includes qualitative factors. When performing AHP, multi-layer operation is possible as shown in Figure 2. For example, if the first layer has passenger cars and public transportation, the second layer of public transportation may include taxis, buses, and subways. AHP assumes that the evaluation items belonging to the same layer, as well as each layer, are mutually independent. However, if there exist dependencies between evaluation items belonging to the same layer, the internal dependency method determining the dependency between evaluation items can be used; if there exist dependencies in each layer, the priority can be calculated using the external dependency method.
Before the weight calculation, we investigated the correlation between each element through the Pearson correlation coefficient. An appropriate weighting method was selected after determining whether AHP basic assumptions were violated through correlation analysis. As a result, it can be stated that the correlation coefficient between the AADTs for all vehicle types and trucks is 0.78. Therefore, the weight was calculated using the AHP internal dependency method that considers the correlation between elements in the hierarchy.
To calculate the weight for the importance of each element for the derived 10 elements, a pairwise comparison questionnaire for each element was conducted for the above-mentioned experts. The weight of each element is given in Table 2, which are calculated based on the results of 10 surveys with a consistency index value of 0.1 or less, which means there exists no logical contradiction in the responses of the survey subjects.
In traffic environment elements, AADT for trucks was found to have the highest weight on truck platooning. Next, the number of traffic crashes, continuous driving times index, peak-hour concentration rate, AADT and average daily speed for all vehicle types. Among the geometry elements, the number of lanes and the length of Conzone were found to have the highest weight on the truck platooning. In contrast, the number of rest areas and drowsy shelters and the number of bridges and tunnels exhibited relatively low weight differences.

3.3. Conzone Date Collection

In this study, the data regarding the 10 elements were collected in expressway Conzone units. Out of a total of 1420 Conzones in the entire expressway network as of 2018, 10 element values were collected from only 942 Conzones. The 478 Conzones were excepted due to missing values for the elements. The basic descriptive statistics of the data are presented in Table 3.

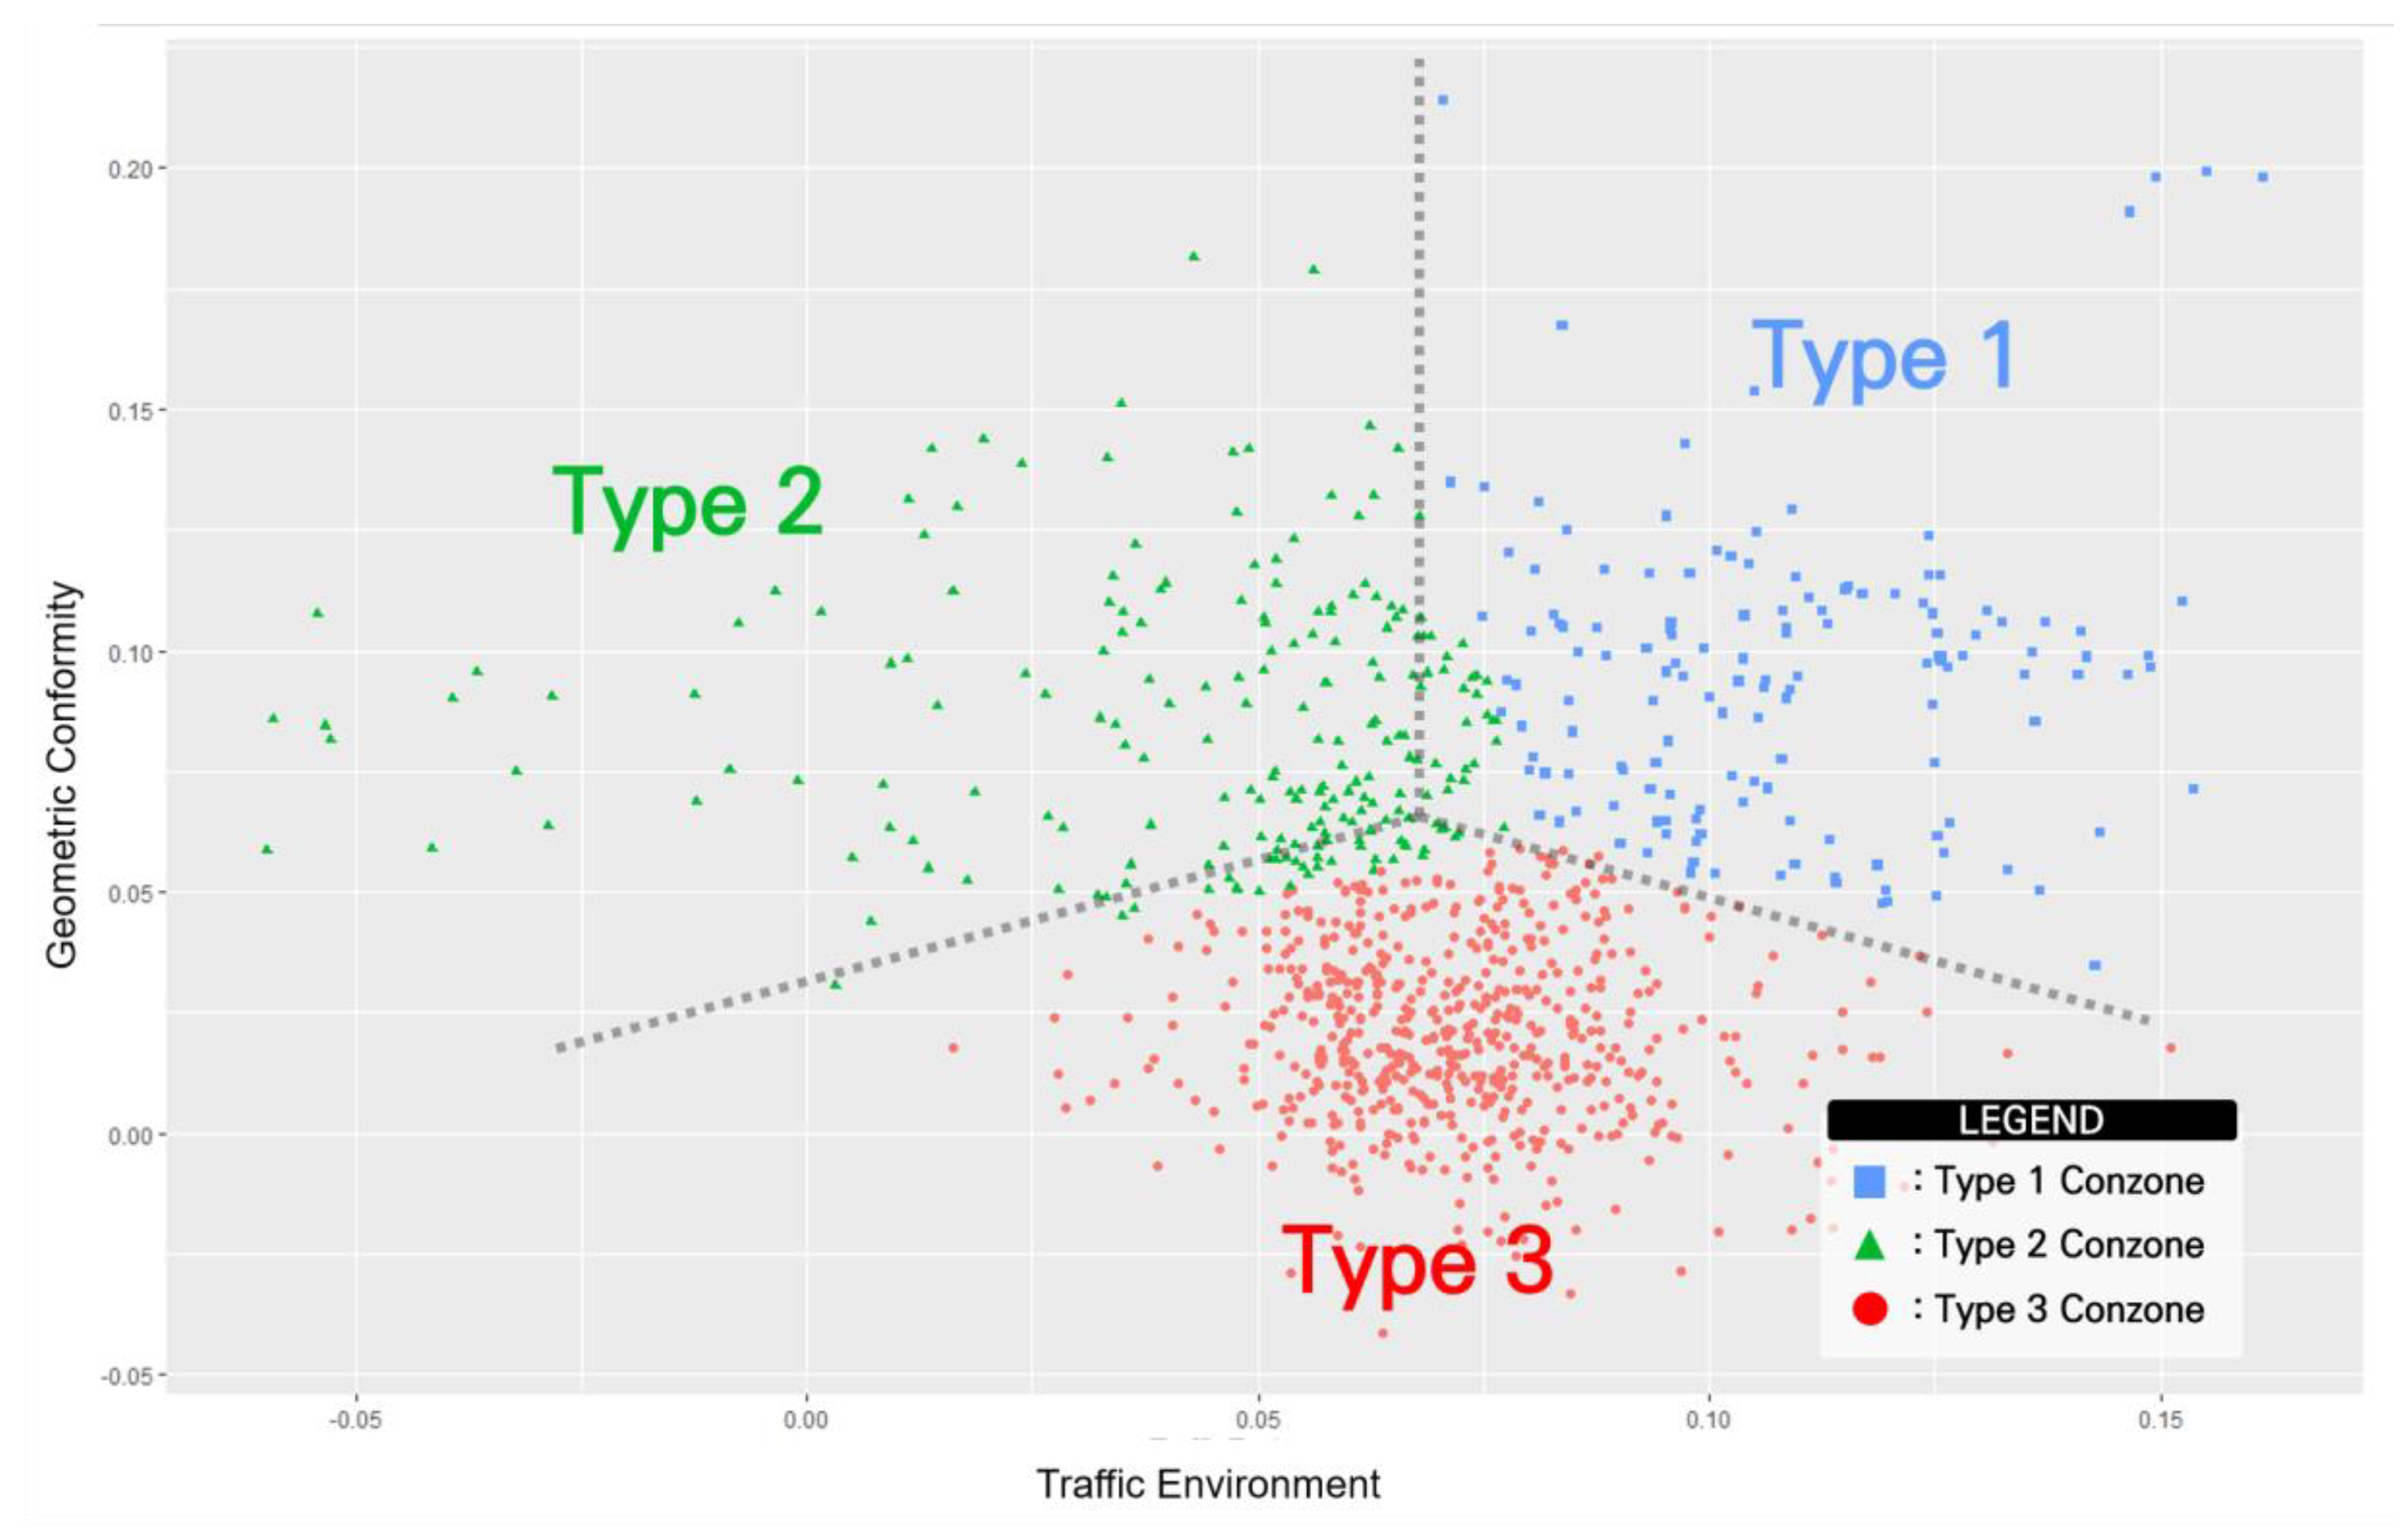
3.4. Conzone Unit Suitability Analysis

In this study, the suitability of truck platooning was examined in terms of the traffic environment and geometry conditions in the Conzone unit. For that, we calculated the traffic environment and geometric conformity index. Subsequently, based on the calculated two indices, the suitability of truck platooning in each Conzone was clustered through the K-means algorithm, a commonly used machine learning clustering technique. The traffic environment and geometric conformity indices were calculated according to Equations (1) and (2). Here, positive weight value of each element indicates that large element is suitable for truck platooning, while negative value suggests the opposite. This can be expressed using the following equations that are based on the opinions of the experts:
Traffic   Environment   score = 0.057 × AADT + 0.160 × A A D T T r u c k + 0.039 × Speed + 0.072 × Peak Hour   Concentrate   Rate 0.078 × Continuous   Driving   Time 0.104 × Crashes
Geometric   Conformity   score = 0.186 × Lanes + 0.172 × Length 0.051 × Bridges   and Tunnels 0.081 × Restarea   and   DrowsyShelter
To prevent prediction errors due to scale differences among elements, it was normalized to a value between 0 and 1 according to Equation (3) through min-max normalization. In the equation, zi is the normalized value, xi is the value of the element, while min(xi) and max(xi) represent the minimum and maximum values of the element xi.
z i = x i min ( x i ) max ( x i ) min ( x i )
The K-means algorithm combines the given data into K clusters; each cluster is determined in such a way that the variance of the distance difference between the center point of the cluster and the data belonging to it is minimized. Therefore, it is important to find an appropriate number of clusters to distinguish data from an initial point that is randomly assigned at the beginning. For cluster analysis, the R programming language was used. The elbow method was employed to determine the appropriate number of clusters. As a result, 3 was found to be the most appropriate number of clusters, in which the sum of squares within a cluster rapidly decreases [17].
The clustering results of each zone are illustrated in Figure 3 and Table 4. Among these three clusters, the blue square cluster located in the first quadrant is designated as Type 1, the green triangle cluster located in the second quadrant is Type 2, and finally, the red circle cluster located in the third and fourth quadrants is designated as a Type 3 cluster. Here, the x-axis and y-axis in Figure 3 mean traffic environment index and geometric conformity index, respectively, and there is no unit of values presented on this axis.
In the case of the Type 1 cluster, a total of 147 Conzones belonged to it were found to be as Conzones suitable for running truck platooning in both the traffic environment and geometry. In the case of Type 2 clusters, there exist a total of 112 Conzones that have suitable geometry but inappropriate environment for truck platooning. In the case of Type 3, it covers a total of 583 Conzones, each of which requires additional facilities and design for truck platooning operation due to lack of suitable geometry.
Based on the unit suitability analysis result, each Conzone was classified into three types: Type 1, which is suitable for both traffic environment and geometric conformity to operate platooning; Type 2, which has geometrical conditions but requires improvement of traffic environment; and Type 3, which requires geometrical improvement. The results displayed on the GIS are shown in Figure 4.
It was found that Conzones on expressways adjacent to the Seoul metropolitan area such as Gyeongbu, Yeongdong, and Jungbu Naeryuk expressways, are mainly appropriate for truck platooning. Among the characteristics of suitable Conzones for truck platooning, the AADT for truck and the number of lanes seem to have played a major role.

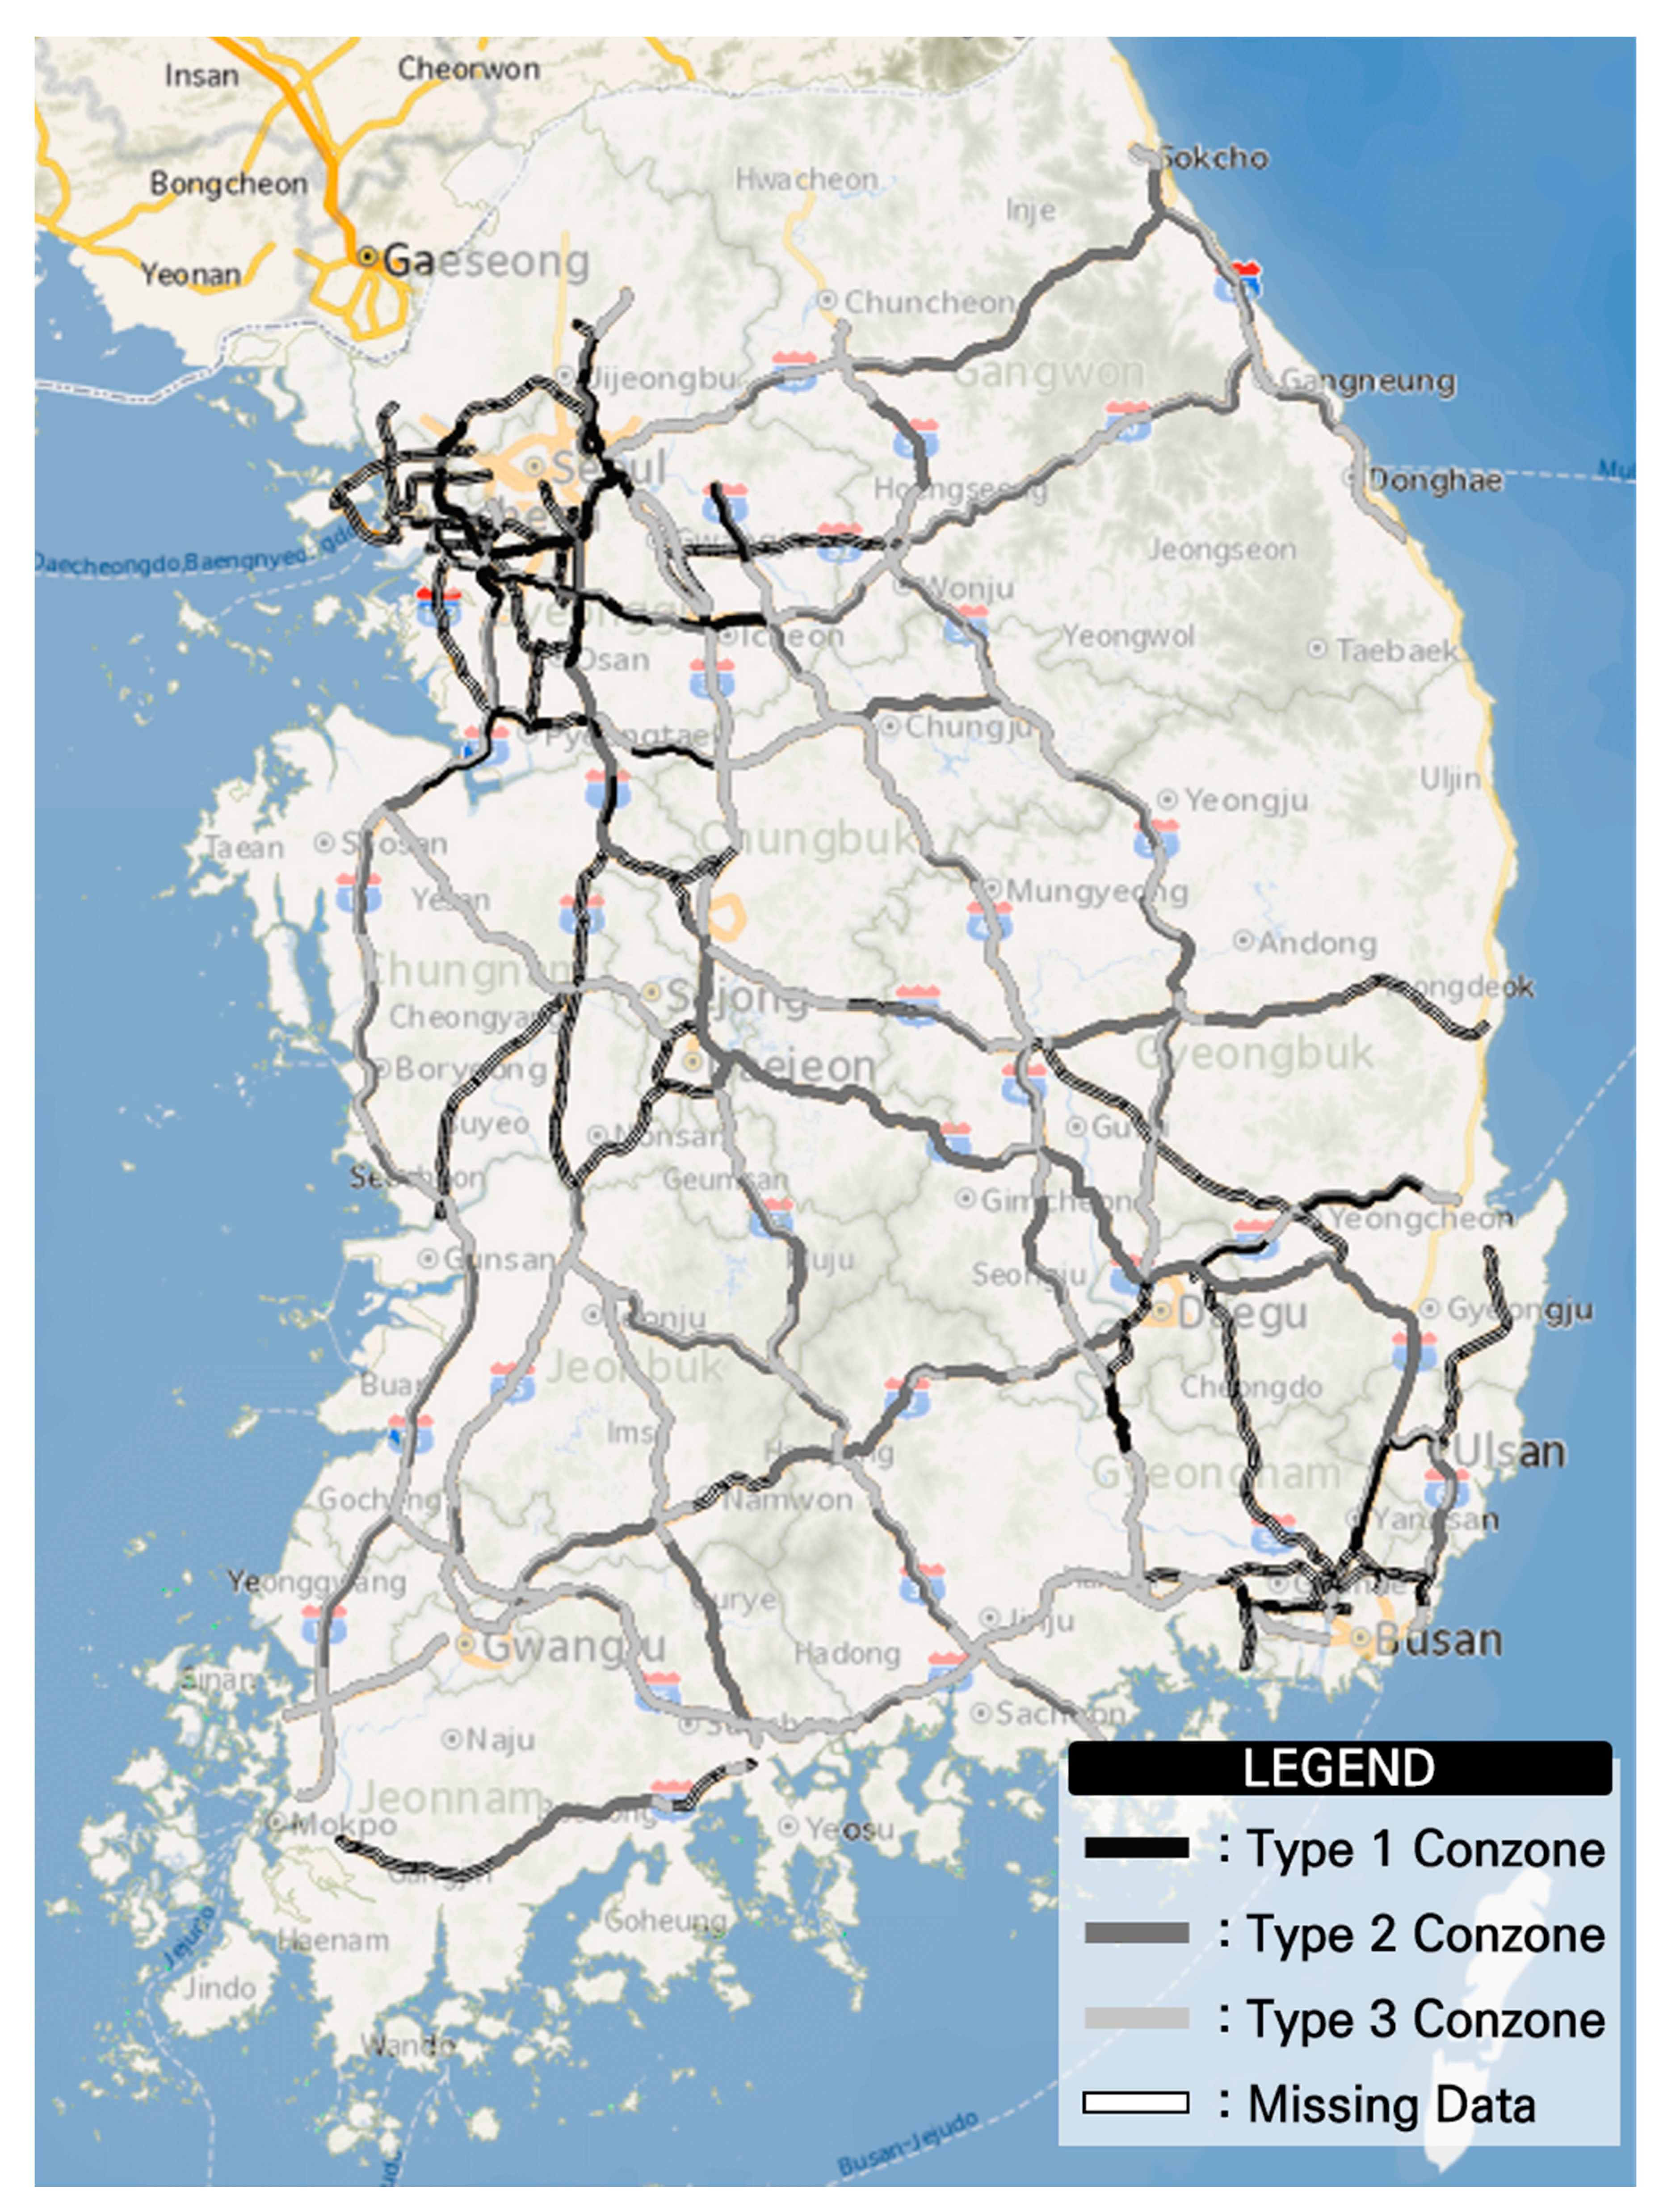
3.5. Sectional Expansion

In the previous section, the most suitable expressway Conzones for truck platooning are classified as Type 1 based on two aspects: the traffic environment and geometry. However, the length of the Conzone is too short so that it is inappropriate to designate the operational expressways for truck platooning in the Conzone unit. Therefore, Conzones are expanded into sections suitable for truck platooning by combining several neighboring Conzones. For the expansion to sections, the following criteria are established in this study:
First, only Type 1 Conzones are combined and expanded into sections. If there exists a logistics and national industrial complex that can induce demand for freight vehicles around the Type 2 Conzone, it is treated as a Type 1 Conzones during the expansion. Second, when three or more consecutive Conzone belonging to Type 1 exist in a row, they form a section. Third, if a Type 2 Conzone exists between two and more Conzones belonging to Type 1, it is included in a section. Here, the logistics and national industrial complexes correspond to the diamond and black dots in Figure 5, respectively.
The final result of suitable section selection for truck platoon operation based on the aforementioned conditions is listed in Table 5, which illustrates 14 sections in 9 expressway lines, including Gyeongbu, West Coast, and Seoul Outer Ring expressways. Most selected sections are concentrated in the Seoul metropolitan area, among which, the 90.94 km section of the Pangyo junction-Cheonggye tollgate section of the Seoul Outer Ring expressway is determined as the most suitable section for truck platooning in Korea.

4. Conclusions and Future Research

4.1. Conclusions

In this study, appropriate sections for truck platooning operations were investigated for the expressway network in Korea. First, after establishing the scope and content, the related theory and study were discussed. Next, through an expert survey, elements that can impact truck platooning on expressways were determined. In addition, the importance of each element was calculated through AHP analysis along with the data collection for the derived elements.
Finally, using the calculated weights, each Conzone was divided into three clusters based on traffic environment and geometry. Moreover, the Conzones in Type 1, which are suitable for both the indices of traffic environment and geometric commodity, were expanded in units of sections to increase the network connectivity and truck platoon operability.
The analytical results suggested that 14 sections in 9 expressway lines are suitable for truck platooning. Among all the investigated expressways, the Seoul Outer Ring expressway exhibited the highest proportion of suitable sections. Moreover, most of the selected sections were found to be adjacent to the metropolitan area. This was because of the geometric elements built to handle more traffic in the metropolitan than in rural areas, and the traffic volume of freight cars concentrated in the logistics and industrial complexes located near this area. One additional contributing factor is the installation of C-ITS facilities for V2X communication in that region.
This study is a basic research related to the operation of truck platooning currently being developed, and is expected to contribute to maximizing positive effects such as capacity increase, fuel saving, and traffic safety improvement by determining a section suitable for truck platooning.

4.2. Future Research

In this study, Conzones suitable for truck platooning were first identified, and then expanded to different sections. However, it suffers from limitations regarding increasing the reliability and applicability of truck platooning, which need to be handled in related future studies.
First, it is necessary to study additional elements that may affect the truck platooning. For example, weather, gradient, number of entry and exit facilities, emissions, fuel consumption, and so on. Therefore, it is essential to develop additional traffic environment and geometric elements.
Second, it is fundamental to reflect the travel patterns of actual truck drivers. To increase the acceptability of the technology, we must analyze the characteristics and preferences of truck drivers who will actually use the platooning technology.
Third, it is crucial to investigate the optimal operating conditions for truck platooning. In addition to selecting an appropriate expressway section, it is necessary to derive conditions such as main-ship traffic, lorry traffic, as well as inflow and outflow traffics, etc., that exhibit optimal performance in that section. We believe that it is necessary to determine the conditions that affect the vehicle through actual experiments and simulations, and expect that more successful operation of truck platooning would be possible through the development of corresponding operating technology.
Finally, most of the studies related to truck platooning focus on the development of truck platooning system as well as the estimation of benefits of truck platooning (for example, saving on fuel consumption). There have been few studies on the analysis of appropriate highways or networks for truck platooning covered in this paper. In that respect, in the future, research related to creating an environment for truck platooning needs to be conducted in more depth.

Author Contributions

Conceptualization, H.J. and I.Y.; methodology, H.J. and S.P. (Sangmin Park); software, H.J. and S.P. (Sungho Park); validation, S.P. (Sungho Park), H.C. and I.Y.; formal analysis, H.J.; investigation, H.J.; resources, H.C.; data curation, H.C.; writing—original draft preparation, I.Y.; writing—review and editing, I.Y.; visualization, H.J.; supervision, I.Y.; project administration, H.C.; funding acquisition, I.Y. All authors have read and agreed to the published version of the manuscript.

Funding

This study was supported by the Ministry of Land, Infrastructure and Transport’s Transportation Logistics Research Project funding (Task No.: 20TLRP-B147674-03) and by Basic Science Research Program through the National Research Foundation of Korea (NRF) funded by the Ministry of Education (NRF-2020R1I1A1A01072166).

Conflicts of Interest

The authors declare no conflict of interest.

Data Availability

The data used in this study cannot be made available due to the Korea Expressway Corporation (KEC)’s policy.

References

  1. Tsugawa, S.; Kato, S.; Aoki, K. An Automated Truck Platoon for Energy Saving. In Proceedings of the IEEE/RSJ International Conference on Intelligent Robots and Systems 2011, San Francisco, CA, USA, 25–30 September 2011. [Google Scholar] [CrossRef]
  2. Bergenhem, C.; Shladover, S.; Coelingh, E.; Englund, C.; Tsugawa, S. Overview of Platooning Systems. In Proceedings of the 19th World Congress on Intelligent Transport Systems, Vienna, Austria, 22–26 October 2012. [Google Scholar]
  3. Nguyen, T.; Xie, M.; Liu, X.; Arunachalam, N.; Rau, A.; Lechner, B.; Busch, F.; Wong, Y.D. Platooning of Autonomous Public Transport Vehicles: The InfluencE of Ride Comfort on Travel Delay. Sustainability 2019, 11, 5237. [Google Scholar] [CrossRef] [Green Version]
  4. Zhang, L.L.; Chen, F.; Ma, X.X.; Pan, X.D. Fuel Economy in Truck Platooning: A Literature Overview and Directions for Future Research. J. Adv. Transp. 2020, 2020, 1–10. [Google Scholar] [CrossRef]
  5. Lammert, M.P.; Duran, A.; Diez, J.; Burton, K.; Nicholson, A. Effect of Platooning on Fuel Consumption of Class 8 Vehicles Over a Range of Speeds Following Distances and Mass. SAE Int. J. Commer. Veh. 2014, 7, 626–639. [Google Scholar] [CrossRef] [Green Version]
  6. Agriesti, S.; Gandini, P.; Marchionni, G.; Paglino, V.; Ponti, M.; Studer, L. Evaluation Approach for a Combined Implementation of Day 1 C-ITS and Truck Platooning. In Proceedings of the 2018 IEEE 87th Vehicular Technology Conference (VTC Spring), Porto, Portugal, 3–6 June 2018; pp. 1–6. [Google Scholar] [CrossRef]
  7. Bibeka, A.; Songchitruksa, P.; Zhang, Y. Assessing environmental impacts of ad-hoc truck platooning on multilane freeways. J. Intell. Transp. Syst. 2019. [Google Scholar] [CrossRef]
  8. Jo, Y.; Kim, J.; Oh, C.; Kim, I.; Lee, G. Benefits of travel time savings by truck platooning in Korean freeway networks. Transp. Policy 2019, 83, 37–45. [Google Scholar] [CrossRef]
  9. Ploeg, J.; Serrarens, A.; Heijenk, G. Connect & Drive: Design and Evaluation of Cooperative Adaptive Cruise Control for Congestion Reduction. J. Mod. Transp. 2011, 19, 207–213. [Google Scholar] [CrossRef] [Green Version]
  10. Bergenhem, C.; Hedin, E.; Skarin, D. Vehicle-to-Vehicle Communication for a Platooning System, Transport Research Aren–Europe. Procedia-Soc. Behav. Sci. 2012, 48, 1222–1233. [Google Scholar] [CrossRef] [Green Version]
  11. European Road Transport Research Advisory Council. Automated Driving Roadmap. 2015. Available online: https://www.ertrac.org/uploads/documentsearch/id38/ERTRAC_Automated-Driving-2015.pdf (accessed on 29 September 2020).
  12. Janssen, R.; Zwijnenberg, H.; Blankers, I.; de Kruijff, J. Truck Platooning–Driving the Future of Transportation; TNO: The Hague, The Netherlands, 2015. [Google Scholar]
  13. Amoozadeh, M.; Deng, H.; Chuah, C.N.; Zhang, H.M.; Ghosal, D. Platoon Management with Cooperative Adaptive Cruise Control Enabled by VANET. Veh. Commun. 2015, 2, 110–123. [Google Scholar] [CrossRef] [Green Version]
  14. Kim, D.G.; Lee, C.; Park, B.J. Use of Digital Tachograph Data to Provide Traffic Safety Education and Evaluate Effects on Bus Driver Behavior. Transp. Res. Rec. 2016, 2585, 77–84. [Google Scholar] [CrossRef]
  15. Wang, L.; Pei, Y. The impact of continuous driving time and rest time on commercial drivers’ driving performance and recovery. J. Saf. Res. 2014, 50, 11–15. [Google Scholar] [CrossRef] [PubMed]
  16. Saaty, T.L. How to make a decision: The Analytic Hierarchy Process. Eur. J. Oper. Res. 1990, 48, 9–26. [Google Scholar] [CrossRef]
  17. Yuan, C.; Yang, H. Research on K-Value Selection Method of K-Means Clustering Algorithm. Multidiscip. Sci. J. 2019, 2, 226–235. [Google Scholar] [CrossRef] [Green Version]
Figure 1. Research Procedure.
Sustainability 12 08058 g001
Figure 2. Elements Affecting Expressway Truck Platooning.
Sustainability 12 08058 g002
Figure 3. Result of Clustering Analysis.
Sustainability 12 08058 g003
Figure 4. Three Types of Conzone for Truck Platooning.
Sustainability 12 08058 g004
Figure 5. Distribution of Logistic and Industrial Complexes.
Sustainability 12 08058 g005
Table 1. Level of Platooning Technology.
Platooning LevelsFeaturesRemarks
1: CACC truck platooningAutomation of longitudinal controlDrivers have to ride in each vehicle
2: Automated truck platooningAutomation of longitudinal and lateral controlDrivers have to ride in each vehicle
3: Highway pilot platooningAutomation of longitudinal and lateral control
Lane change, overtaking
Unmanned following vehicle in specific road
Source: European Road Transport Research Advisory Council [11].
Table 2. Result of Weight Calculation.
ClassificationElementsWeights
Traffic environmentAADT for all vehicle types0.057
AADT for truck0.160
Average daily speed for all vehicle types0.039
Peak-hour concentration rate0.072
Continuous driving times index0.078
Number of traffic crashes0.104
GeometryNumber of lanes0.186
Length of Conzone0.172
Number of bridges and tunnels0.051
Number of rest areas and Drowsy shelters0.081
Table 3. Basic Descriptive Statistics of 10 Elements.
ElementsMeansStandard DeviationsMinMax
AADT for all vehicle types in vehicles per day31,152.6326,186.56786.00141,472.00
AADT for truck in vehicles per day8400.006522.5970.0034,406.00
Average daily speed for all vehicle types in kph94.5612.6614.72112.11
Peak-hour concentration rate in percentage0.210.040.080.42
Continuous driving times index2.963.160.0039.40
Number of traffic crashes1.262.720.0015.00
Number of lanes2.470.792.006.00
Length of Conzone in kilometer7666.155269.41110.0030,790.00
Number of bridges and tunnels3.894.990.0030.00
Number of rest areas and Drowsy shelters0.190.430.002.00
Table 4. Number of Conzones by Cluster Types.
Cluster TypesType 1Type 2Type 3
Number of Conzones in Cluster147212583
Table 5. Suitable section for truck platooning operation.
Expressway LinesLine Lengths (km)SectionsDirectionLengths (km)
Gyoengbu431.50Nopo IC–W.Ulsan ICSeoul33.40
431.50Cheonan IC–Singal JCSeoul54.82
South Cost171.99E.Changwon–Gimhae JCSuncheon22.40
West Cost340.60Dangjin IC–Ansan JCSeoul61.62
Guri-Pochoen89.20S.Guri–Soheul JCPocheon30.52
Jungbu117.19E.Seoul TG–Hanam JCHanam7.62
Pyeongtaek-Jecheon126.91W.Pyeongtaek JC–Ansung ICJechoen23.70
126.91Ansung IC–W.Pyeongtaek JCPyeongtaek23.70
Yeongdong243.7Ansan JC–Yangji ICGangneung43.37
243.7W.Ansan IC–Seochang JCIncheon11.98
Yeoju JC–DeokPyeong ICIncheon20.72
Seoul Outer Ring128.00Pangyo JC–Cheonggye TGOuter90.94
Cheonggye TG–Pangyo JCInner90.94
The 2nd Gyeongin49.55Munhak IC–Anhyeon JCSeongnam9.09
Note: IC, JC, and TG mean interchange, junction, and tollgate, respectively.

