Applications of Local Climate Zone Classification Scheme to Improve Urban Sustainability: A Bibliometric Review


Abstract
1. Introduction
2. Methods
2.1. Concept, Data, and Tool
2.2. Performed Analyses
3. Results
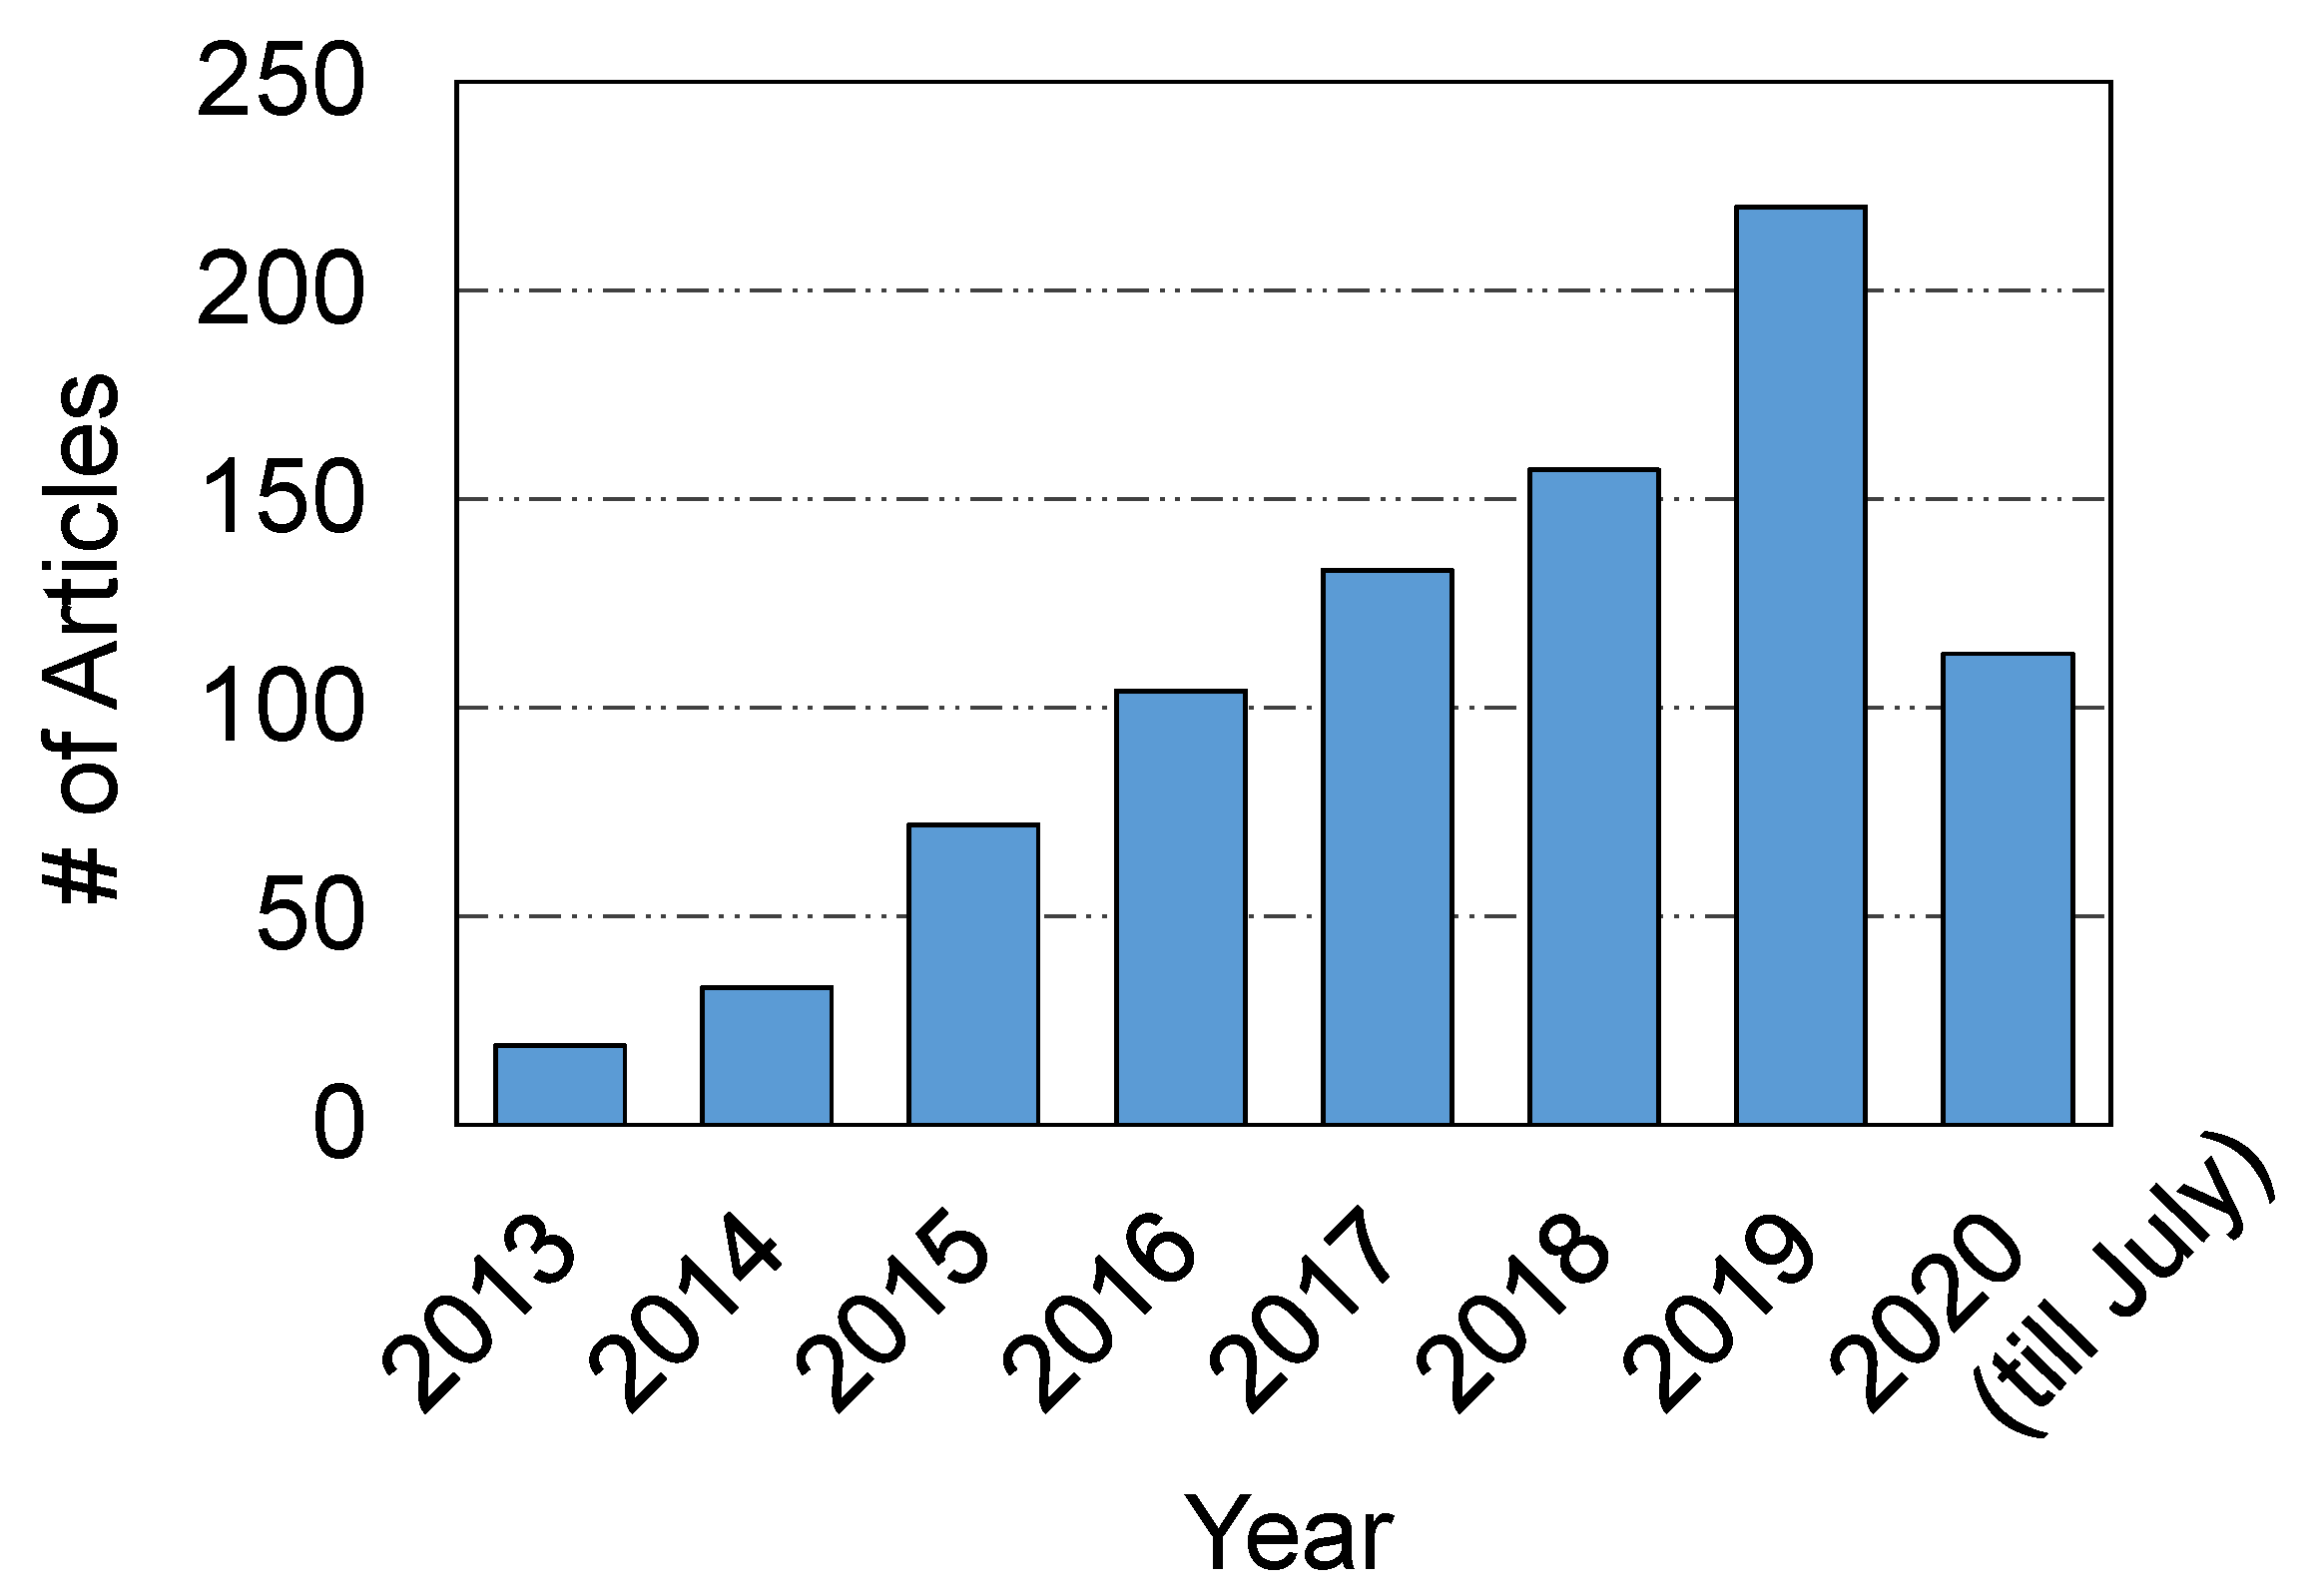
3.1. Descriptive Analysis
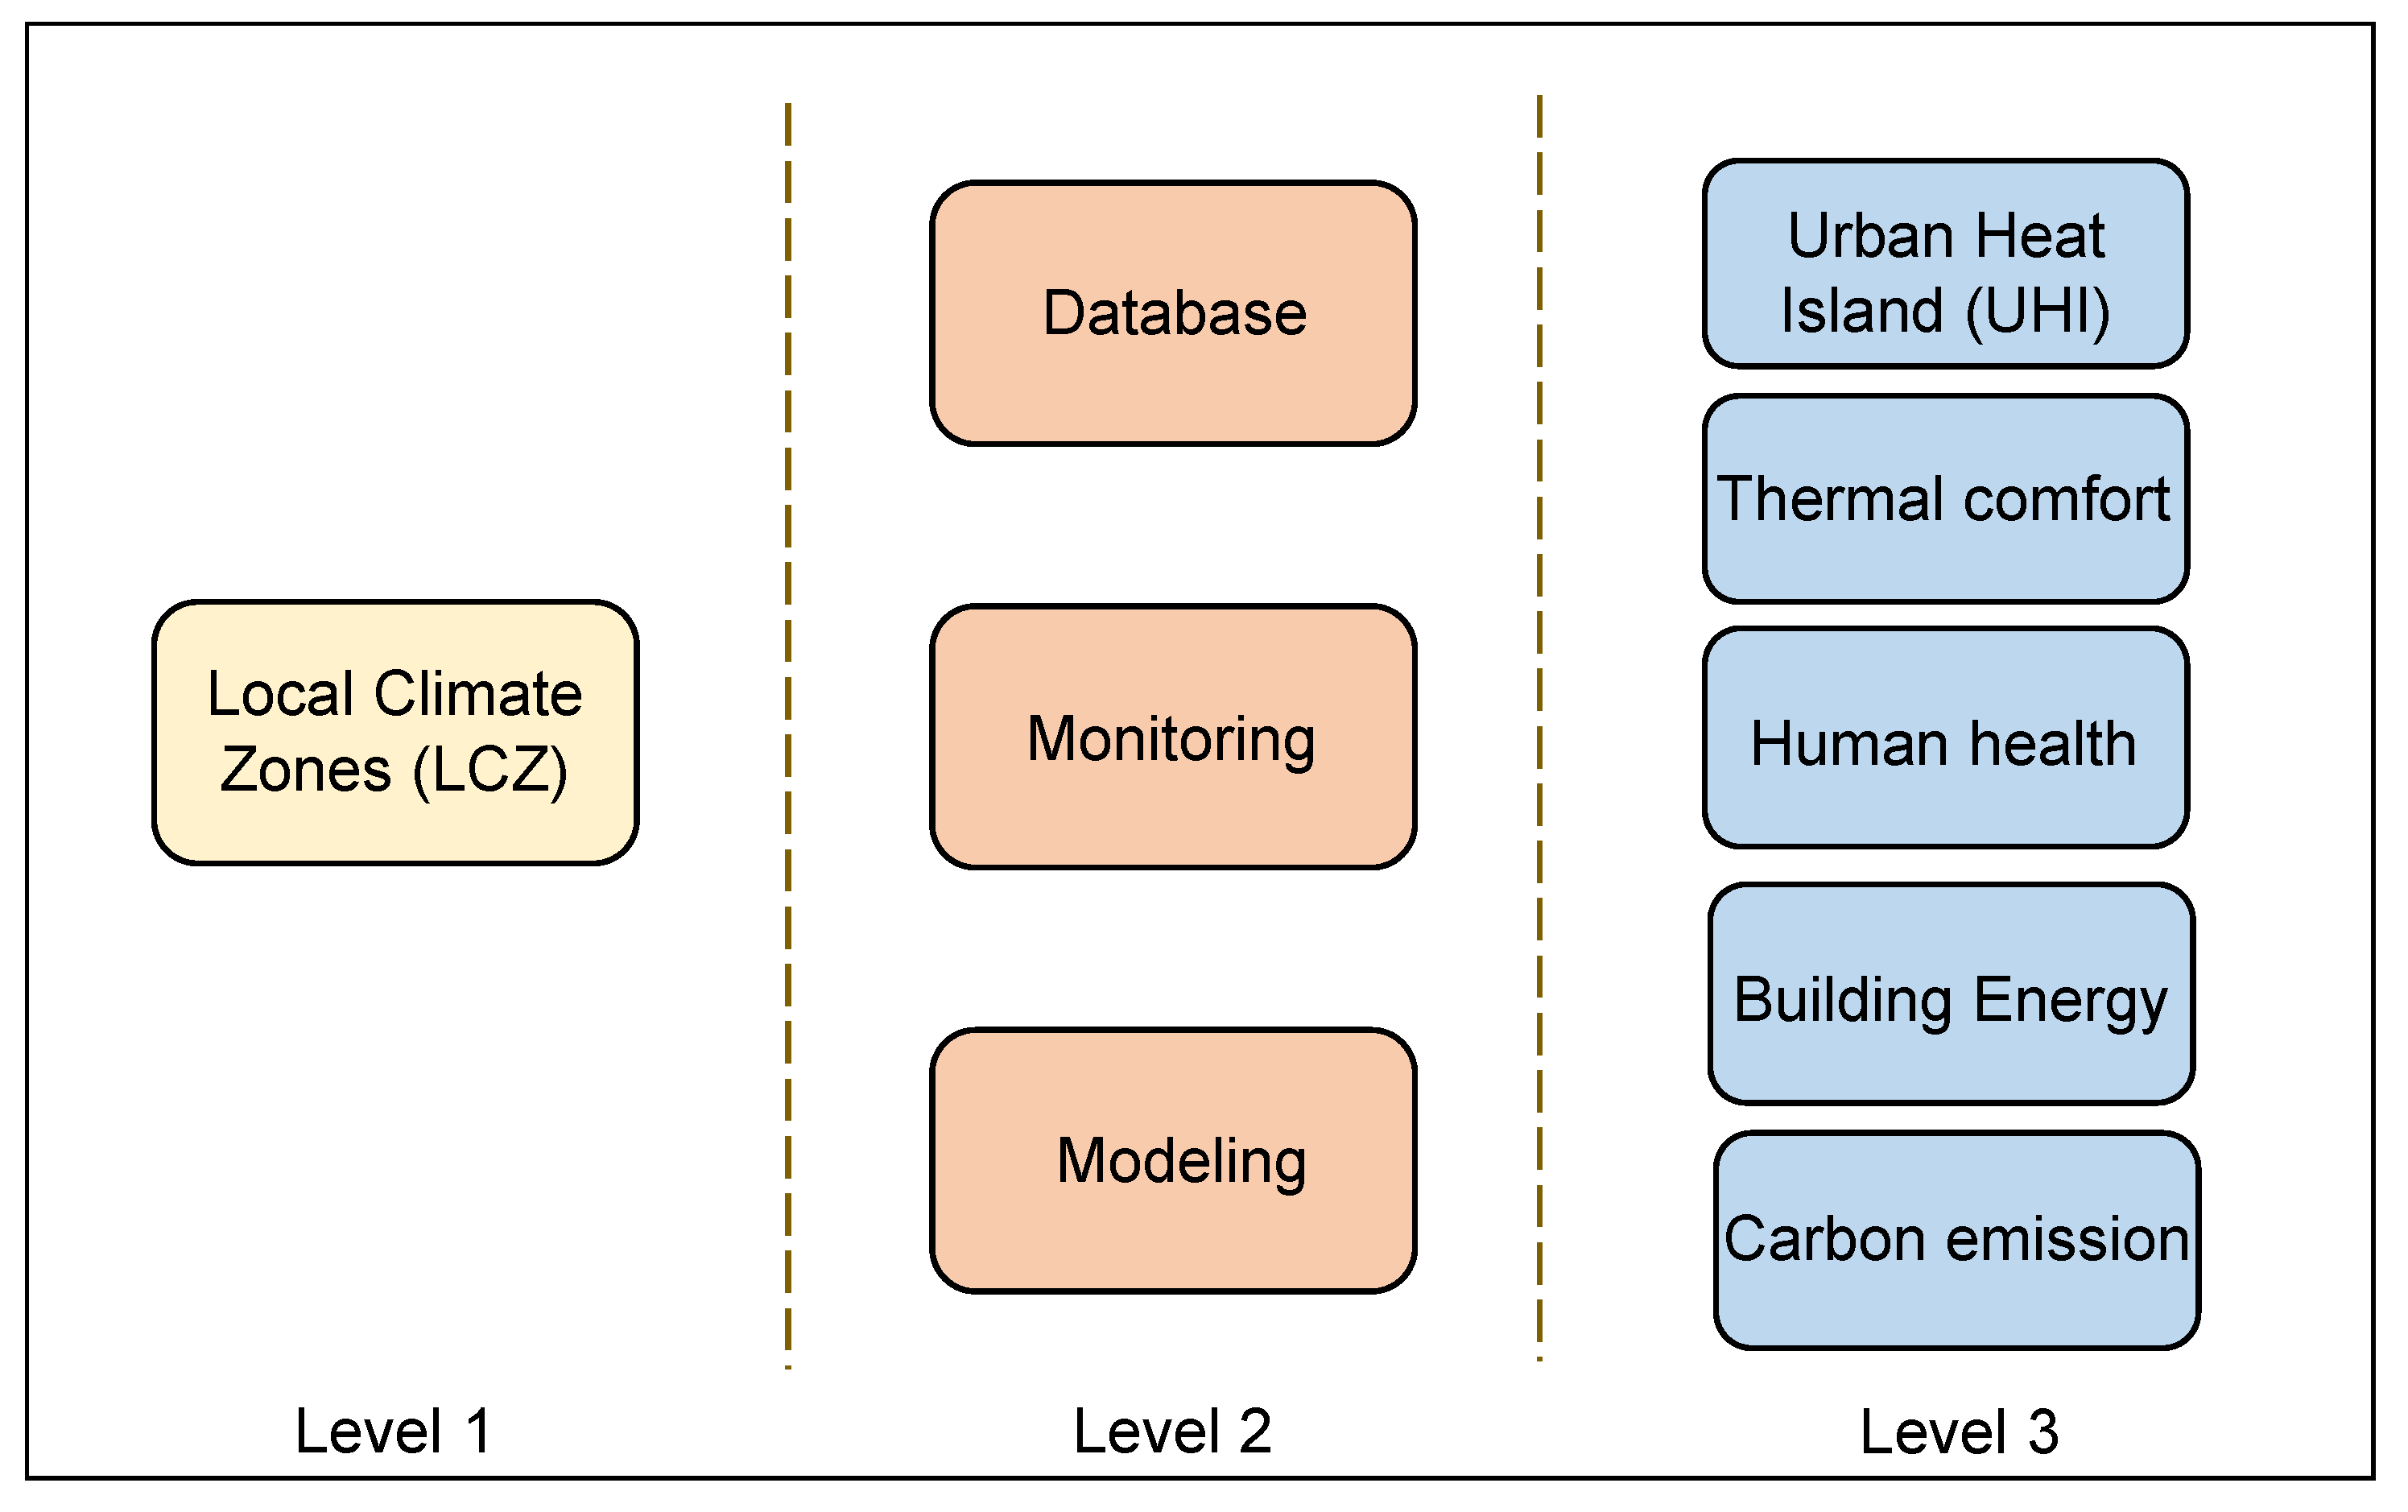
3.2. Research Topics
3.2.1. Level 1: Local Climate Zones (LCZ)
3.2.2. Level 2: Database
3.2.3. Level 2: Monitoring
3.2.4. Level 2: Modeling
3.2.5. Level 3: Urban Heat Islands (UHI)
3.2.6. Level 3: Outdoor Thermal Comfort
3.2.7. Level 3: Human Health
3.2.8. Level 3: Building Energy
3.2.9. Level 3: Carbon Emission
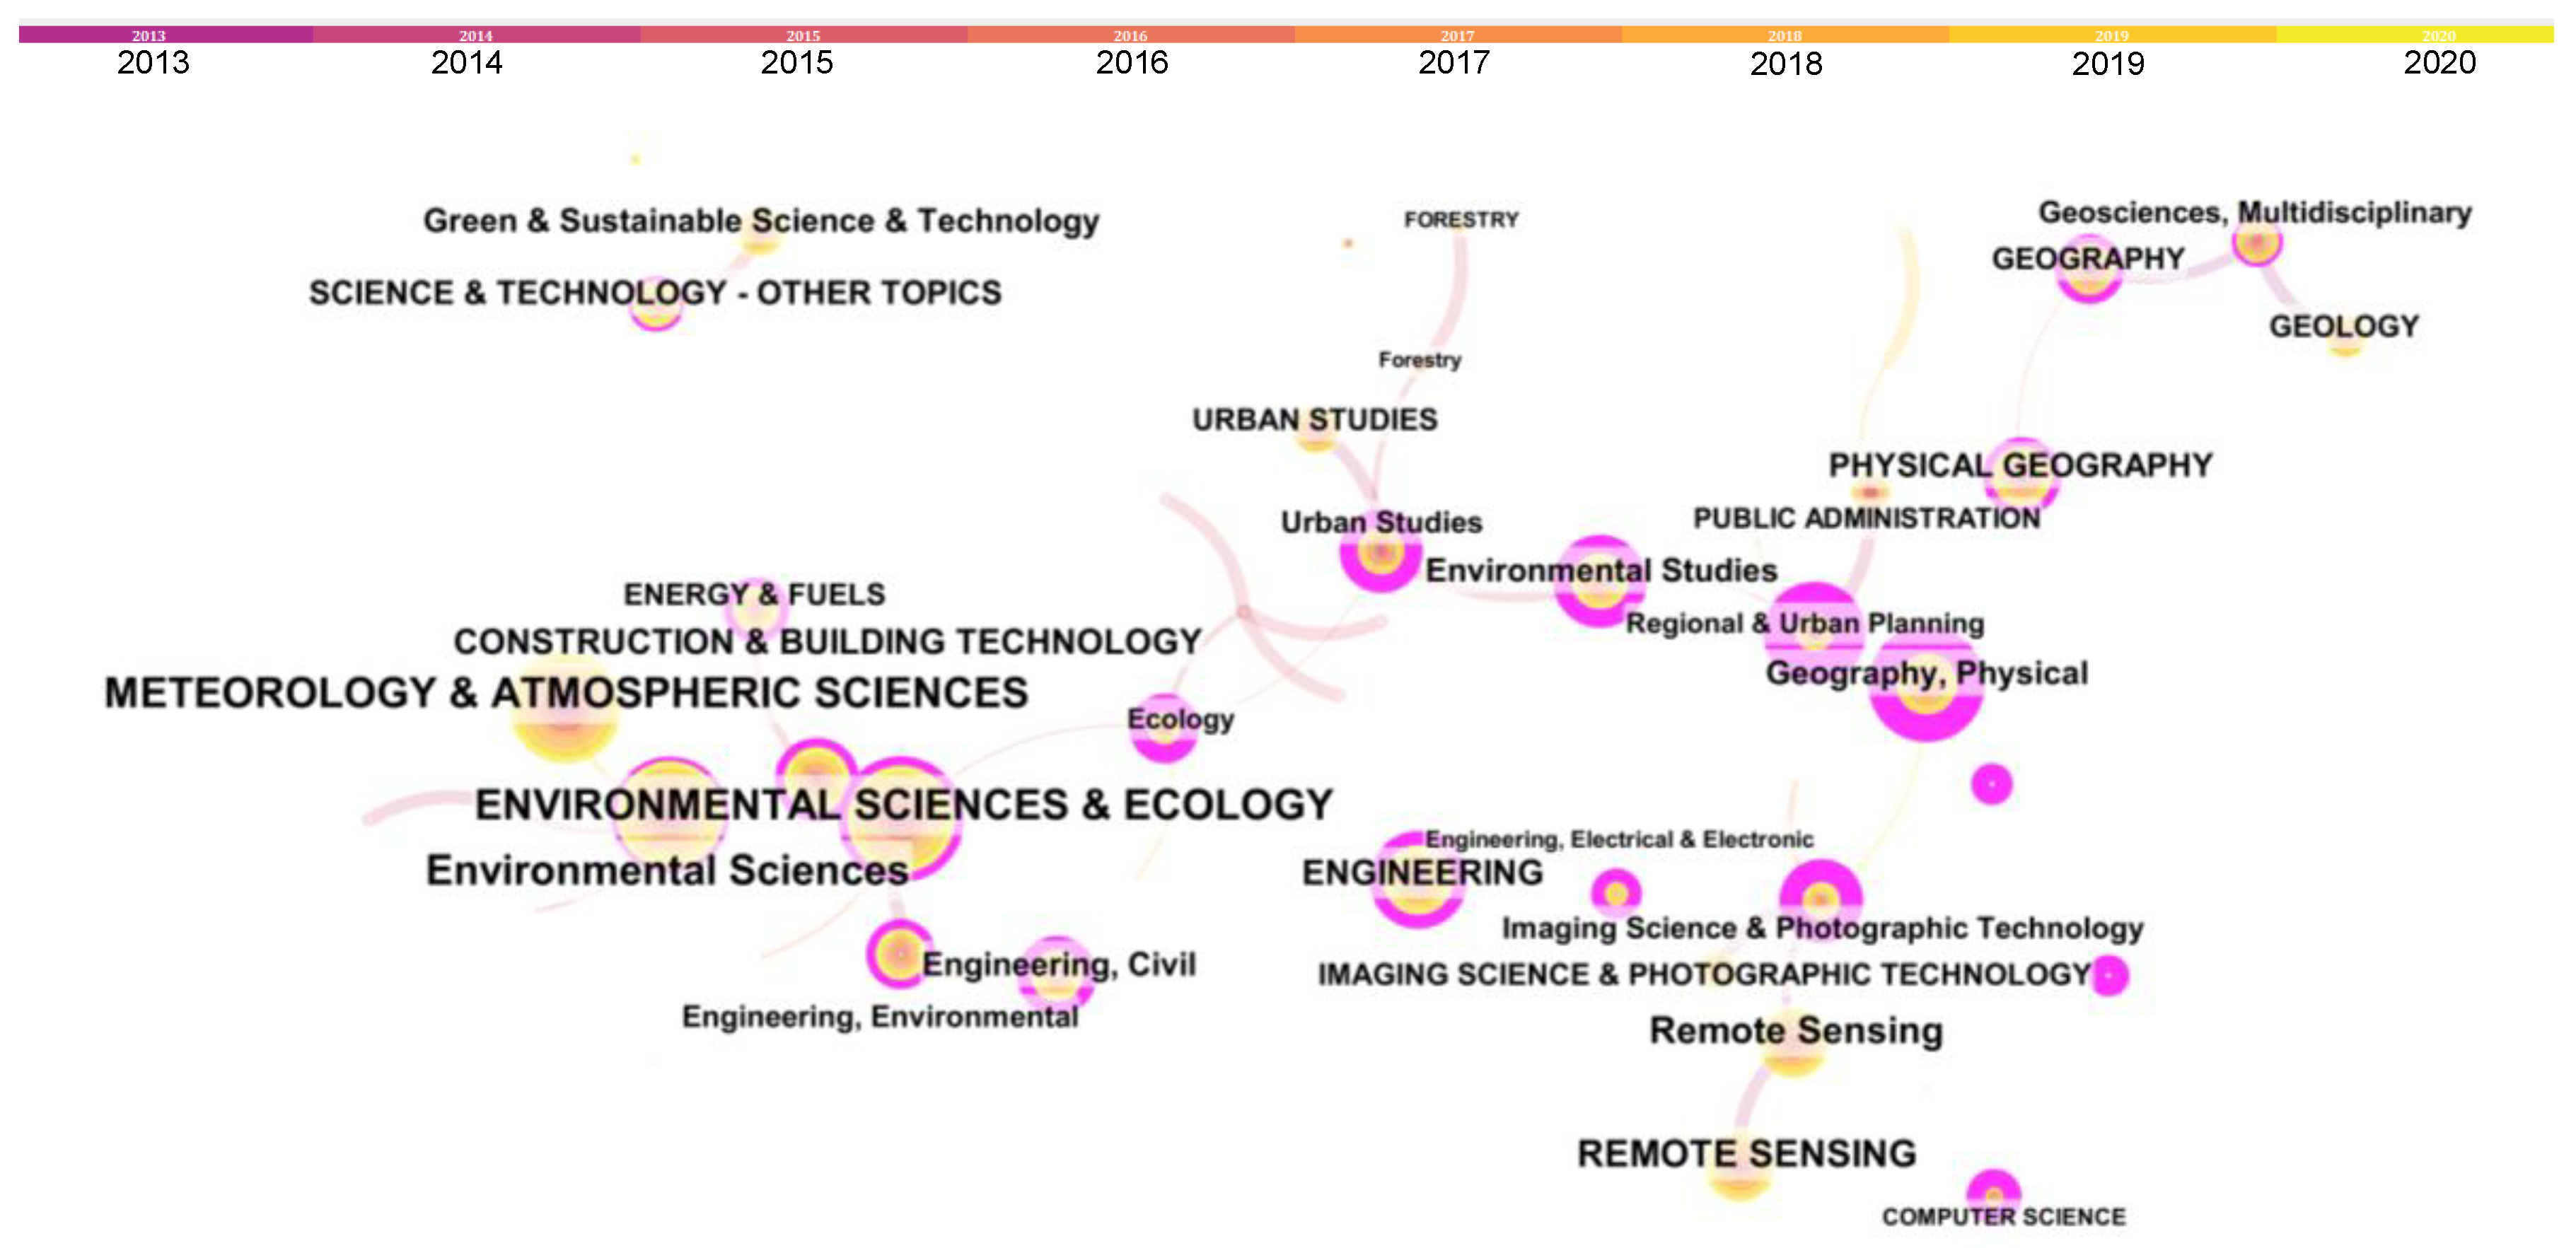
3.3. Research Subjects
4. Discussion
5. Conclusions
Author Contributions
Funding
Conflicts of Interest
References
- Population Reference Bureau. 2020 World Population Data Sheet; Population Reference Bureau: Washington, DC, USA, 2020. [Google Scholar]
- Lai, D.; Liu, W.; Gan, T.; Liu, K.; Chen, Q. A review of mitigating strategies to improve the thermal environment and thermal comfort in urban outdoor spaces. Sci. Total Environ. 2019, 661, 337–353. [Google Scholar] [CrossRef] [PubMed]
- Lai, D.; Lian, Z.; Liu, W.; Guo, C.; Liu, W.; Liu, K.; Chen, Q. A comprehensive review of thermal comfort studies in urban open spaces. Sci. Total Environ. 2020, 742, 140092. [Google Scholar] [CrossRef] [PubMed]
- Vanos, J.K.; Kalkstein, L.S.; Sanford, T.J. Detecting synoptic warming trends across the US Midwest and implications to human health and heat-related mortality. Int. J. Climatol. 2015, 35, 85–96. [Google Scholar] [CrossRef]
- Meng, L.; Mao, J.; Zhou, Y.; Richardson, A.D.; Lee, X.; Thornton, P.E.; Ricciuto, D.M.; Li, X.; Dai, Y.; Shi, X.; et al. Urban warming advances spring phenology but reduces the response of phenology to temperature in the conterminous United States. Proc. Natl. Acad. Sci. USA 2020, 117, 4228–4233. [Google Scholar] [CrossRef]
- Li, X.; Zhou, Y.; Yu, S.; Jia, G.; Li, H.; Li, W. Urban heat island impacts on building energy consumption: A review of approaches and findings. Energy 2019, 174, 407–419. [Google Scholar] [CrossRef]
- Stewart, I.D.; Oke, T.R. Local Climate Zones for Urban Temperature Studies. Bull. Am. Meteorol. Soc. 2012, 93, 1879–1900. [Google Scholar] [CrossRef]
- Perera, N.G.R.; Emmanuel, R. A “Local Climate Zone” based approach to urban planning in Colombo, Sri Lanka. Urban Clim. 2018, 23, 188–203. [Google Scholar] [CrossRef]
- Yang, X.; Peng, L.L.H.; Jiang, Z.; Chen, Y.; Yao, L.; He, Y.; Xu, T. Impact of urban heat island on energy demand in buildings: Local climate zones in Nanjing. Appl. Energy 2020, 260. [Google Scholar] [CrossRef]
- Lee, D.Y.; Seo, B.M.; Yoon, Y.B.; Hong, S.H.; Choi, J.M.; Lee, K.H. Heating energy performance and part load ratio characteristics of boiler staging in an office building. Front. Energy 2018, 13, 339–353. [Google Scholar] [CrossRef]
- Sahdev, R.K.; Kumar, M.; Dhingra, A.K. A comprehensive review of greenhouse shapes and its applications. Front. Energy 2017, 13, 427–438. [Google Scholar] [CrossRef]
- Talele, S.; Traylor, C.; Arpan, L.; Curley, C.; Chen, C.-F.; Day, J.; Feiock, R.; Hadzikadic, M.; Tolone, W.J.; Ingman, S.; et al. Energy modeling and data structure framework for Sustainable Human-Building Ecosystems (SHBE)—A review. Front. Energy 2018, 12, 314–332. [Google Scholar] [CrossRef]
- Zhang, H.; Zhang, C.; Wen, F.; Xu, Y. A comprehensive energy solution for households employing a micro combined cooling, heating and power generation system. Front. Energy 2018, 12, 582–590. [Google Scholar] [CrossRef]
- Sharmin, T.; Steemers, K.; Matzarakis, A. Analysis of microclimatic diversity and outdoor thermal comfort perceptions in the tropical megacity Dhaka, Bangladesh. Build. Environ. 2015, 94, 734–750. [Google Scholar] [CrossRef]
- Chen, C. CiteSpace II: Detecting and visualizing emerging trends and transient patterns in scientific literature. J. Am. Soc. Inf. Sci. Technol. 2006, 57, 359–377. [Google Scholar] [CrossRef]
- Small, H. Co-citation in the scientific literature: A new measure of the relationship between two documents. J. Am. Soc. Inf. Sci. 1973, 24, 265–269. [Google Scholar] [CrossRef]
- Stewart, I.D.; Oke, T.R.; Krayenhoff, E.S. Evaluation of the ‘local climate zone’ scheme using temperature observations and model simulations. Int. J. Climatol. 2014, 34, 1062–1080. [Google Scholar] [CrossRef]
- Zheng, Y.; Ren, C.; Xu, Y.; Wang, R.; Ho, J.; Lau, K.; Ng, E. GIS-based mapping of Local Climate Zone in the high-density city of Hong Kong. Urban Clim. 2018, 24, 419–448. [Google Scholar] [CrossRef]
- He, S.; Zhang, Y.; Gu, Z.; Su, J. Local climate zone classification with different source data in Xi’an, China. Indoor Built Environ. 2018, 28, 1190–1199. [Google Scholar] [CrossRef]
- Zhao, C.; Jensen, J.; Weng, Q.; Currit, N.; Weaver, R. Application of airborne remote sensing data on mapping local climate zones: Cases of three metropolitan areas of Texas, U.S. Comput. Environ. Urban Syst. 2019, 74, 175–193. [Google Scholar] [CrossRef]
- Ren, C.; Cai, M.; Li, X.; Zhang, L.; Wang, R.; Xu, Y.; Ng, E. Assessment of Local Climate Zone Classification Maps of Cities in China and Feasible Refinements. Sci. Rep. 2019, 9, 18848. [Google Scholar] [CrossRef]
- Ching, J.; Mills, G.; Bechtel, B.; See, L.; Feddema, J.; Wang, X.; Ren, C.; Brousse, O.; Martilli, A.; Neophytou, M.; et al. WUDAPT: An Urban Weather, Climate, and Environmental Modeling Infrastructure for the Anthropocene. Bull. Am. Meteorol. Soc. 2018, 99, 1907–1924. [Google Scholar] [CrossRef]
- Mills, G.; Ching, J.; See, L.; Bechtel, B.; Foley, M. An introduction to the WUDAPT project. In Proceedings of the 9th International Conference on Urban Climate, Toulouse, France, 20–24 July 2015; pp. 20–24. [Google Scholar]
- Bechtel, B.; Alexander, P.; Böhner, J.; Ching, J.; Conrad, O.; Feddema, J.; Mills, G.; See, L.; Stewart, I. Mapping Local Climate Zones for a Worldwide Database of the Form and Function of Cities. ISPRS Int. J. Geo-Inf. 2015, 4, 199–219. [Google Scholar] [CrossRef]
- Muller, C.L.; Chapman, L.; Grimmond, C.S.B.; Young, D.T.; Cai, X. Sensors and the city: A review of urban meteorological networks. Int. J. Climatol. 2013, 33, 1585–1600. [Google Scholar] [CrossRef]
- Uijlenhoet, R.; Van Delden, A.J.; Steeneveld, G.J.; Leijnse, H.; Overeem, A.; Pape, J.J.; Droste, A.M. Crowdsourcing Urban Air Temperatures through Smartphone Battery Temperatures in São Paulo, Brazil. J. Atmos. Ocean. Technol. 2017, 34, 1853–1866. [Google Scholar] [CrossRef]
- Chapman, L.; Muller, C.L.; Young, D.T.; Warren, E.L.; Grimmond, C.S.B.; Cai, X.-M.; Ferranti, E.J.S. The Birmingham Urban Climate Laboratory: An Open Meteorological Test Bed and Challenges of the Smart City. Bull. Am. Meteorol. Soc. 2015, 96, 1545–1560. [Google Scholar] [CrossRef]
- Alexander, P.J.; Mills, G.; Fealy, R. Using LCZ data to run an urban energy balance model. Urban Clim. 2015, 13, 14–37. [Google Scholar] [CrossRef]
- Oke, T.R.; Mills, G.; Christen, A.; Voogt, J.A. Urban Climates; Cambridge University Press: Cambridge, UK, 2017. [Google Scholar]
- Middel, A.; Häb, K.; Brazel, A.J.; Martin, C.A.; Guhathakurta, S. Impact of urban form and design on mid-afternoon microclimate in Phoenix Local Climate Zones. Landsc. Urban Plan. 2014, 122, 16–28. [Google Scholar] [CrossRef]
- van Hove, L.W.A.; Jacobs, C.M.J.; Heusinkveld, B.G.; Elbers, J.A.; van Driel, B.L.; Holtslag, A.A.M. Temporal and spatial variability of urban heat island and thermal comfort within the Rotterdam agglomeration. Build. Environ. 2015, 83, 91–103. [Google Scholar] [CrossRef]
- Xia, L.; Lan, L.; Tang, J.; Wan, Y.; Lin, Y.; Wang, Z. Bed heating improves the sleep quality and health of the elderly who adapted to no heating in a cold environment. Energy Build. 2020, 210, 109687. [Google Scholar] [CrossRef]
- He, M.; Lian, Z.; Chen, P. Evaluation on the performance of quilts based on young people’s sleep quality and thermal comfort in winter. Energy Build. 2019, 183, 174–183. [Google Scholar] [CrossRef]
- Shen, J.; Zhang, X.; Lian, Z. Impact of wooden versus nonwooden interior designs on office workers’ cognitive performance. Percept. Mot. Skills 2020, 127, 36–51. [Google Scholar] [CrossRef]
- Lau, K.K.-L.; Chung, S.C.; Ren, C. Outdoor thermal comfort in different urban settings of sub-tropical high-density cities: An approach of adopting local climate zone (LCZ) classification. Build. Environ. 2019, 154, 227–238. [Google Scholar] [CrossRef]
- Liu, L.; Lin, Y.; Xiao, Y.; Xue, P.; Shi, L.; Chen, X.; Liu, J. Quantitative effects of urban spatial characteristics on outdoor thermal comfort based on the LCZ scheme. Build. Environ. 2018, 143, 443–460. [Google Scholar] [CrossRef]
- Das, M.; Das, A.; Mandal, S. Outdoor thermal comfort in different settings of a tropical planning region: A study on Sriniketan-Santiniketan Planning Area (SSPA), Eastern India. Sustain. Cities Soc. 2020, 63. [Google Scholar] [CrossRef]
- Salata, F.; Golasi, I.; de Lieto Vollaro, R.; de Lieto Vollaro, A. Outdoor thermal comfort in the Mediterranean area. A transversal study in Rome, Italy. Build. Environ. 2016, 96, 46–61. [Google Scholar] [CrossRef]
- Shooshtarian, S.; Ridley, I. The effect of individual and social environments on the users thermal perceptions of educational urban precincts. Sustain. Cities Soc. 2016, 26, 119–133. [Google Scholar] [CrossRef]
- Verdonck, M.-L.; Demuzere, M.; Hooyberghs, H.; Beck, C.; Cyrys, J.; Schneider, A.; Dewulf, R.; Van Coillie, F. The potential of local climate zones maps as a heat stress assessment tool, supported by simulated air temperature data. Landsc. Urban Plan. 2018, 178, 183–197. [Google Scholar] [CrossRef]
- Höppe, P. The physiological equivalent temperature—A universal index for the biometeorological assessment of the thermal environment. Int. J. Biometeorol. 1999, 43, 71–75. [Google Scholar] [CrossRef] [PubMed]
- Jendritzky, G.; de Dear, R.; Havenith, G. UTCI—Why another thermal index? Int. J. Biometeorol. 2012, 56, 421–428. [Google Scholar] [CrossRef] [PubMed]
- Ching, J.K.S. A perspective on urban canopy layer modeling for weather, climate and air quality applications. Urban Clim. 2013, 3, 13–39. [Google Scholar] [CrossRef]
- Brousse, O.; Georganos, S.; Demuzere, M.; Vanhuysse, S.; Wouters, H.; Wolff, E.; Linard, C.; van Lipzig, N.P.M.; Dujardin, S. Using Local Climate Zones in Sub-Saharan Africa to tackle urban health issues. Urban Clim. 2019, 27, 227–242. [Google Scholar] [CrossRef]
- Wu, Y.; Sharifi, A.; Yang, P.; Borjigin, H.; Murakami, D.; Yamagata, Y. Mapping building carbon emissions within local climate zones in Shanghai. Energy Procedia 2018, 152, 815–822. [Google Scholar] [CrossRef]
- Järvi, L.; Havu, M.; Ward, H.C.; Bellucco, V.; McFadden, J.P.; Toivonen, T.; Heikinheimo, V.; Kolari, P.; Riikonen, A.; Grimmond, C.S.B. Spatial Modeling of Local-Scale Biogenic and Anthropogenic Carbon Dioxide Emissions in Helsinki. J. Geophys. Res. Atmos. 2019, 124, 8363–8384. [Google Scholar] [CrossRef]
- Zhao, Z.; Shen, L.; Li, L.; Wang, H.; He, B.-J. Local Climate Zone Classification Scheme Can Also Indicate Local-Scale Urban Ventilation Performance: An Evidence-Based Study. Atmosphere 2020, 11, 776. [Google Scholar] [CrossRef]
- Yang, J.; Jin, S.; Xiao, X.; Jin, C.; Xia, J.; Li, X.; Wang, S. Local climate zone ventilation and urban land surface temperatures: Towards a performance-based and wind-sensitive planning proposal in megacities. Sustain. Cities Soc. 2019, 47. [Google Scholar] [CrossRef]
- Zhou, X.; Okaze, T.; Ren, C.; Cai, M.; Ishida, Y.; Watanabe, H.; Mochida, A. Evaluation of urban heat islands using local climate zones and the influence of sea-land breeze. Sustain. Cities Soc. 2020, 55. [Google Scholar] [CrossRef]
- Li, H.; Sodoudi, S.; Liu, J.; Tao, W. Temporal variation of urban aerosol pollution island and its relationship with urban heat island. Atmos. Res. 2020, 241. [Google Scholar] [CrossRef]
- Li, H.; Meier, F.; Lee, X.; Chakraborty, T.; Liu, J.; Schaap, M.; Sodoudi, S. Interaction between urban heat island and urban pollution island during summer in Berlin. Sci. Total Environ. 2018, 636, 818–828. [Google Scholar] [CrossRef]
- Bartesaghi-Koc, C.; Osmond, P.; Peters, A. Spatio-temporal patterns in green infrastructure as driver of land surface temperature variability: The case of Sydney. Int. J. Appl. Earth Obs. Geoinf. 2019, 83. [Google Scholar] [CrossRef]
- Bartesaghi Koc, C.; Osmond, P.; Peters, A. A Green Infrastructure Typology Matrix to Support Urban Microclimate Studies. Procedia Eng. 2016, 169, 183–190. [Google Scholar] [CrossRef]


| # | Journal | # of Records |
|---|---|---|
| 1 | Urban Climate | 97 |
| 2 | Science of The Total Environment | 48 |
| 3 | Building and Environment | 39 |
| 4 | Sustainable Cities and Society | 35 |
| 5 | Remote Sensing | 33 |
| 6 | International Journal of Climatology | 27 |
| 7 | Landscape and Urban Planning | 25 |
| 8 | Sustainability | 22 |
| 9 | Theoretical and Applied Climatology | 22 |
| 10 | Journal of Applied Meteorology and Climatology | 17 |
| 11 | Atmosphere | 16 |
| 12 | Energy and Buildings | 14 |
| 13 | Remote Sensing of Environment | 13 |
| 14 | Climate | 12 |
| 15 | Environmental Research Letters | 12 |
| 16 | IEEE Journal of Selected Topics in Applied Earth Observations and Remote Sensing | 12 |
| 17 | Urban Forestry and Urban Greening | 12 |
| 18 | Atmospheric Environment | 11 |
| 19 | Journal of Geophysical Research Atmospheres | 11 |
| 20 | ISPRS International Journal of Geo Information | 10 |
| 21 | International Journal of Biometeorology | 9 |
| # | Countries | # of Records |
|---|---|---|
| 1 | China | 276 |
| 2 | USA | 199 |
| 3 | Germany | 145 |
| 4 | England | 103 |
| 5 | Canada | 62 |
| 6 | Australia | 57 |
| 7 | Italy | 47 |
| 8 | Netherlands | 42 |
| 9 | Austria | 36 |
| 10 | Belgium | 36 |
| 11 | France | 36 |
| 12 | Japan | 32 |
| 13 | Singapore | 30 |
| 14 | India | 26 |
| 15 | South Korea | 26 |
| 16 | Spain | 24 |
| 17 | Switzerland | 23 |
| 18 | Ireland | 21 |
| 19 | Brazil | 19 |
| 20 | Czech Republic | 19 |
| 21 | Sweden | 17 |
| 22 | Hungary | 16 |
| 23 | Greece | 15 |
| # | Institutions | # of Records |
|---|---|---|
| 1 | Arizona State University | 112 |
| 2 | Chinese Academy of Sciences | 87 |
| 3 | University of Reading | 52 |
| 4 | University of Hamburg | 50 |
| 5 | University of Hong Kong | 37 |
| 6 | Helmholtz Association | 33 |
| 7 | University of New South Wales Sydney | 28 |
| 8 | Chinese University of Hong Kong | 25 |
| 9 | German Aerospace Centre | 22 |
| 10 | Ghent University | 22 |
| 11 | University of California System | 22 |
| 12 | Centre National De La Recherche Scientifique | 21 |
| 13 | Wageningen University Research | 21 |
| 14 | KU Leuven | 19 |
| 15 | National University of Singapore | 19 |
| 16 | China Meteorological Administration | 18 |
| 17 | Humboldt University of Berlin | 17 |
| 18 | University College Dublin | 17 |
| 19 | Massachusetts Institute of Technology | 16 |
| # | Authors | # of Records |
|---|---|---|
| 1 | Bechtel B | 35 |
| 2 | Grimmond CSB | 33 |
| 3 | Ren C | 24 |
| 4 | Demuzere M | 21 |
| 5 | Mills G | 16 |
| 6 | Masson V | 15 |
| 7 | Xu Y | 15 |
| 8 | Martilli A | 14 |
| 9 | Middel A | 14 |
| 10 | See L | 14 |
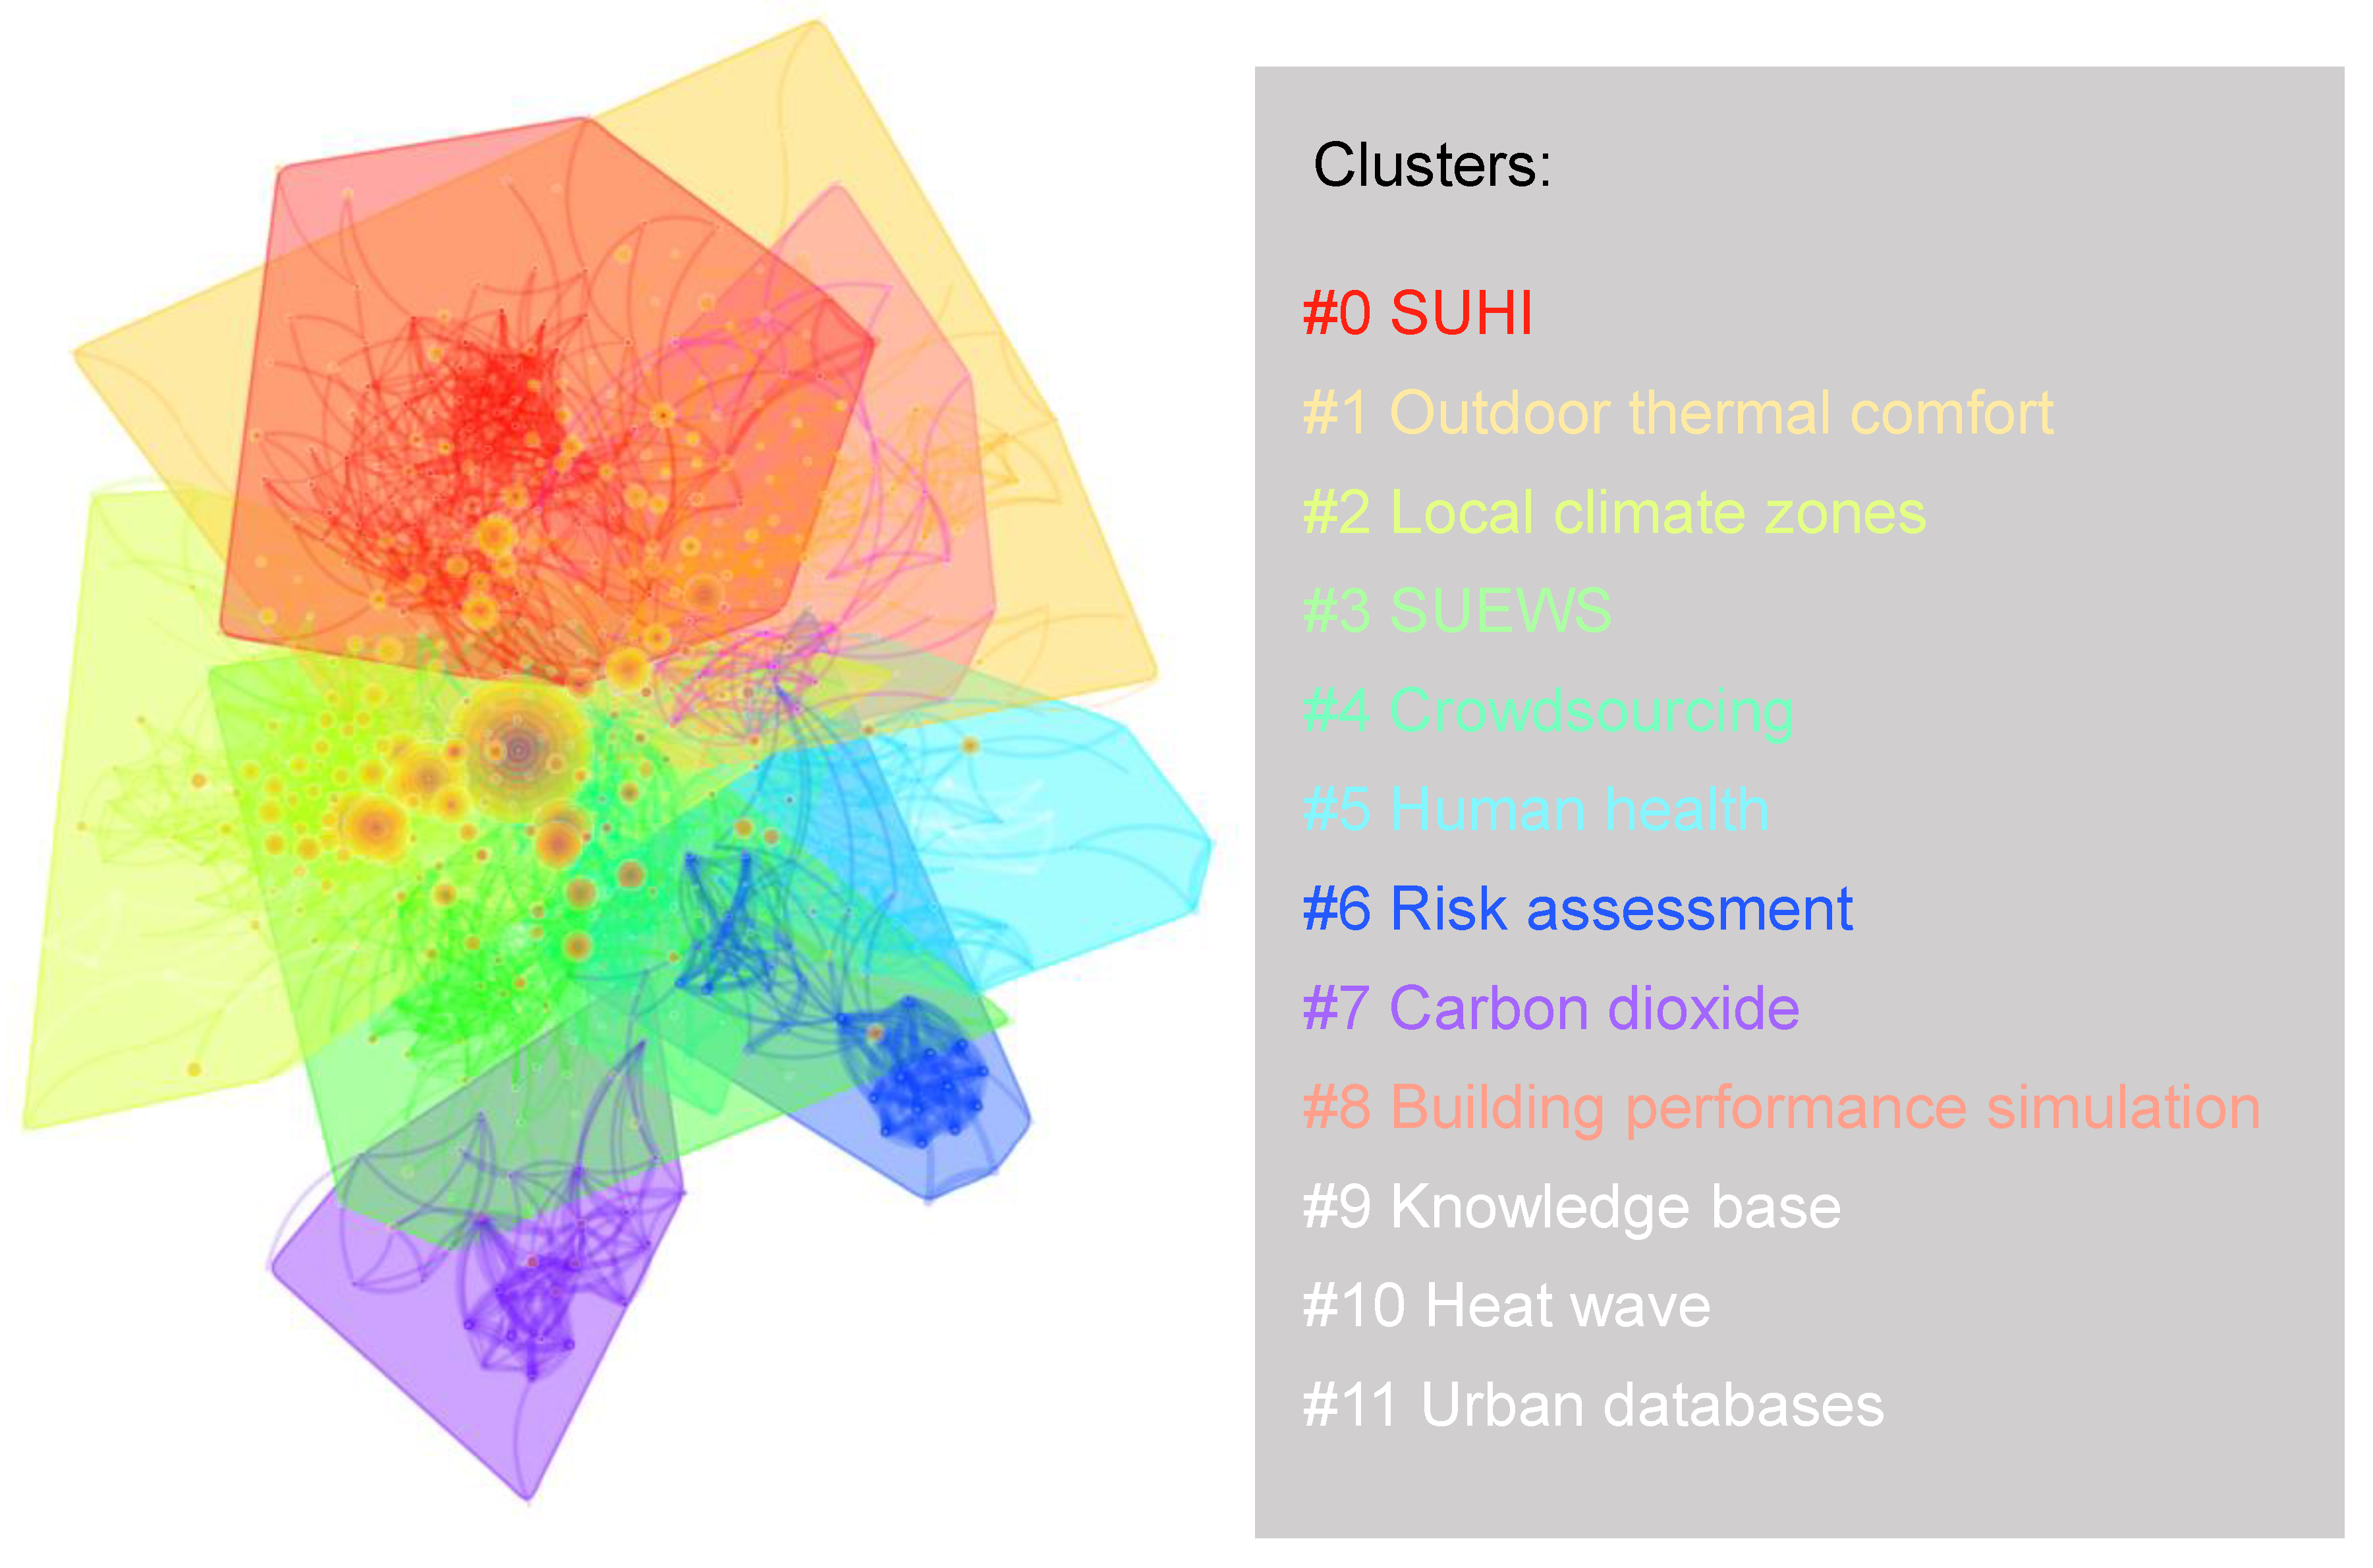
| Cluster ID | Size | Top 5 Labels |
|---|---|---|
| 0 | 109 | surface urban heat island, land surface temperature, MODIS (Moderate Resolution Imaging Spectroradiometer), thermal remote sensing, urban heat island effect |
| 1 | 102 | outdoor thermal comfort, Envi-met, thermal comfort, PET (Physiologically Equivalent Temperature), field survey |
| 2 | 101 | local climate zones, remote sensing, Sentinel-2, urban areas, convolutional neural network |
| 3 | 78 | SUEWS (Surface Urban Energy and Water Balance Scheme), energy balance, WRF (Weather Research and Forecasting Model), land surface model, regional climate modeling |
| 4 | 61 | crowdsourcing, citizen weather station, cyber-infrastructure, wireless sensor networks, crowdsourcing air temperature |
| 5 | 45 | human health, NDVI (normalized difference vegetation index), thermal behavior, synoptic weather type, cool pavements |
| 6 | 40 | risk analysis, mortality, Germany, intra-urban air temperature, Envi-met modeling |
| 7 | 29 | carbon dioxide, eddy covariance, source area, urban environment, emissions inventory |
| 8 | 29 | building performance simulation, sea breeze, density, urban weather generator, urban building energy performance |
| 9 | 6 | knowledge base, personal weather station, relative land surface temperature, human health, building |
| 10 | 5 | heat wave, thermal comfort, air temperature, local climate zones, urban climate |
| 11 | 5 | urban databases, CO2 fluxes, urban climate maps, urban canopy layer model, MApUCE |
| # | Category | % |
|---|---|---|
| 1 | Environmental sciences & ecology | 32 |
| 2 | Meteorology & atmospheric sciences | 15 |
| 3 | Remote sensing | 6 |
| 4 | Engineering | 6 |
| 5 | Construction & building technology | 5 |
| 6 | Science & technology - other topics | 4 |
| 7 | Geography, physical | 3 |
| 8 | Engineering, civil | 3 |
| 9 | Green & sustainable science & technology | 3 |
| 10 | Energy & fuels | 3 |
© 2020 by the authors. Licensee MDPI, Basel, Switzerland. This article is an open access article distributed under the terms and conditions of the Creative Commons Attribution (CC BY) license (http://creativecommons.org/licenses/by/4.0/).
Share and Cite
Xue, J.; You, R.; Liu, W.; Chen, C.; Lai, D. Applications of Local Climate Zone Classification Scheme to Improve Urban Sustainability: A Bibliometric Review. Sustainability 2020, 12, 8083. https://doi.org/10.3390/su12198083
Xue J, You R, Liu W, Chen C, Lai D. Applications of Local Climate Zone Classification Scheme to Improve Urban Sustainability: A Bibliometric Review. Sustainability. 2020; 12(19):8083. https://doi.org/10.3390/su12198083
Chicago/Turabian StyleXue, Jiao, Ruoyu You, Wei Liu, Chun Chen, and Dayi Lai. 2020. "Applications of Local Climate Zone Classification Scheme to Improve Urban Sustainability: A Bibliometric Review" Sustainability 12, no. 19: 8083. https://doi.org/10.3390/su12198083
APA StyleXue, J., You, R., Liu, W., Chen, C., & Lai, D. (2020). Applications of Local Climate Zone Classification Scheme to Improve Urban Sustainability: A Bibliometric Review. Sustainability, 12(19), 8083. https://doi.org/10.3390/su12198083