Article

Measurement of Fairness Perceptions in Energy Transition Research: A Factorial Survey Approach

1
Department of Sociology, University of Warwick, Coventry CV4 7AL, UK
2
Institute of Landscape Architecture and Environmental Planning, Technische Universität, 10623 Berlin, Germany
*
Author to whom correspondence should be addressed.
Sustainability 2020, 12(19), 8084; https://doi.org/10.3390/su12198084
Submission received: 24 August 2020 / Revised: 21 September 2020 / Accepted: 26 September 2020 / Published: 30 September 2020
(This article belongs to the Special Issue Energy Transition and Climate Change in Decision-making Processes)

Abstract

:
Justice and fairness are increasingly popular concepts in energy research and comprise several justice dimensions, including distributive and procedural justice, related to energy production and consumption. In this paper, we used factorial survey experiments—a method employed in sociological justice research—for energy transition research. In a factorial survey, respondents evaluated one or more situations described by several attributes, which varied in their levels. The experimental setup of factorial surveys is one of its advantages over simple survey items, as based on this, the relative importance of each attribute for justice evaluations can be determined. We employed the method in a study on the perceived fairness of renewable energy expansion projects related to wind energy, solar energy, and biomass in Germany, and considered aspects of procedural and distributive justice. We show that the effects of these justice dimensions can be separated and the heterogeneity in justice evaluations can be explained. Compared to previous studies applying factorial survey experiments to explain the acceptance of renewable energy projects, we employed the method to directly measure justice concerns and asked respondents to evaluate the vignettes in terms of perceived fairness. This is important because acceptance and fairness as well as inequality and injustice are different phenomena.

1. Introduction

While much research on energy production and consumption is concerned with the concept of justice [1,2,3,4], there is little empirical quantitative research that directly measures citizens’ justice concerns and fairness perceptions. For example, in research on the acceptance of energy infrastructure, most researchers frame their work in the context of justice but empirically measure acceptance [5,6,7,8]. A direct measurement of justice perceptions is important because social inequalities related to energy production and consumption do not necessarily imply injustice: inequality and perceived injustice regarding the exposure to environmental harms and goods are two different phenomena. Inequalities in exposure to renewable energy projects, for example, an unequal distribution of power plants across geographical areas or social strata, might be accepted by citizens because they perceive such unequal distributions as unavoidable. At the same time, support or opposition do not automatically imply that renewable energy projects and policies are perceived as fair or unfair, respectively. Although support and fairness perceptions can be gathered under the same umbrella term of social acceptance [9], they refer to distinct concepts [10]. Therefore, the direct measurement of fairness perceptions is an important aspect of empirical justice research in sociology and other social sciences [11].
Research on environmental justice differentiates between distributive justice (distribution of environmental harms/goods in society), procedural justice (participation of citizens in environmental decision-making), and recognition (attention to group differences in society) [3,12,13]. With regard to justice concerns, the environmental justice movement typically strives for an equal distribution of environmental harms and goods across social groups in society. This means that all groups in society are equally affected, for example, by renewable energy production. On the other hand, it is well known that there are many different justice theories and principles, and the question that emerges is which principle is supported by whom and how this depends on the social context [14,15,16,17]. For example, not all socioeconomic groups might perceive an equal exposure to renewable power plants or equal burden of rising energy costs as equally fair. Also, citizens in different countries might evaluate an equal share of the costs of climate change mitigation across countries differently. The same can be true for aspects of procedural justice, that is, citizens’ participation opportunities.
While the literature on energy production and consumption suggests that many aspects are relevant for fairness judgements [1,2,3,11], including distributive and procedural justice, it is empirically challenging to disentangle the effects of these aspects. For example, using standard survey items it is difficult to clarify whether distributive justice is more relevant than procedural justice, or vice versa, for the perceived fairness and local acceptance of renewable–energy projects.
In a factorial survey experiment (FSE), also called a vignette experiment, respondents evaluate a situation (i.e., vignette) which is described by experimentally manipulated attributes (i.e., actors) which vary in their levels [18]. The respondents are then asked to evaluate these situations according to criteria such as support, agreement, or perceived fairness. Given that typically more than one attribute is manipulated, FSEs belong to multifactorial methods, which allow for the identification of causal effects due to the experimental setup [18,19]. The method was introduced in Sociology by Rossi and Lazarsfeld in the 1950s [20] and, since the 1970s, has become an important tool for the study of many phenomena, including social norms and justice concerns [18,19,21,22,23]. The FSE employs multiple factors and respondents have to make trade-offs, and therefore it lowers socially desirable response behavior [24]. FSEs are similar to stated choice experiments, which are often employed in energy research [6,25,26]. In stated choice experiments, respondents compare alternatives that vary in multiple attributes and choose the alternative they prefer most. This method has advantages for measuring citizens’ preferences and estimating welfare measures, for example, citizens’ willingness to pay for renewable energy expansion, but it is less suitable for measuring attitudes, (normative) beliefs, and (fairness) perceptions. In social science research the latter are instead examined using FSEs, where respondents can express their fairness concerns on an ordinal or rating scale [18,23].
To our knowledge, there are two previous studies applying FSEs in the context of renewable energy expansion, more specifically on the social acceptance of wind energy projects [27,28]. Yet, in these applications the explanandum is acceptance and not fairness. We go beyond these previous applications of FSEs and directly measure fairness perceptions related to renewable energy projects and compare this with an acceptance measure of such projects. We uncover the causal effects of different justice dimensions, taking the heterogeneity of justice concerns into account. Moreover, we consider three renewable energy sources—wind energy, solar energy, and biomass—and compare the importance of justice dimensions and fairness perceptions across the different energy sources.

2. Factorial Survey Experimental Design and Data

2.1. Experimental Design
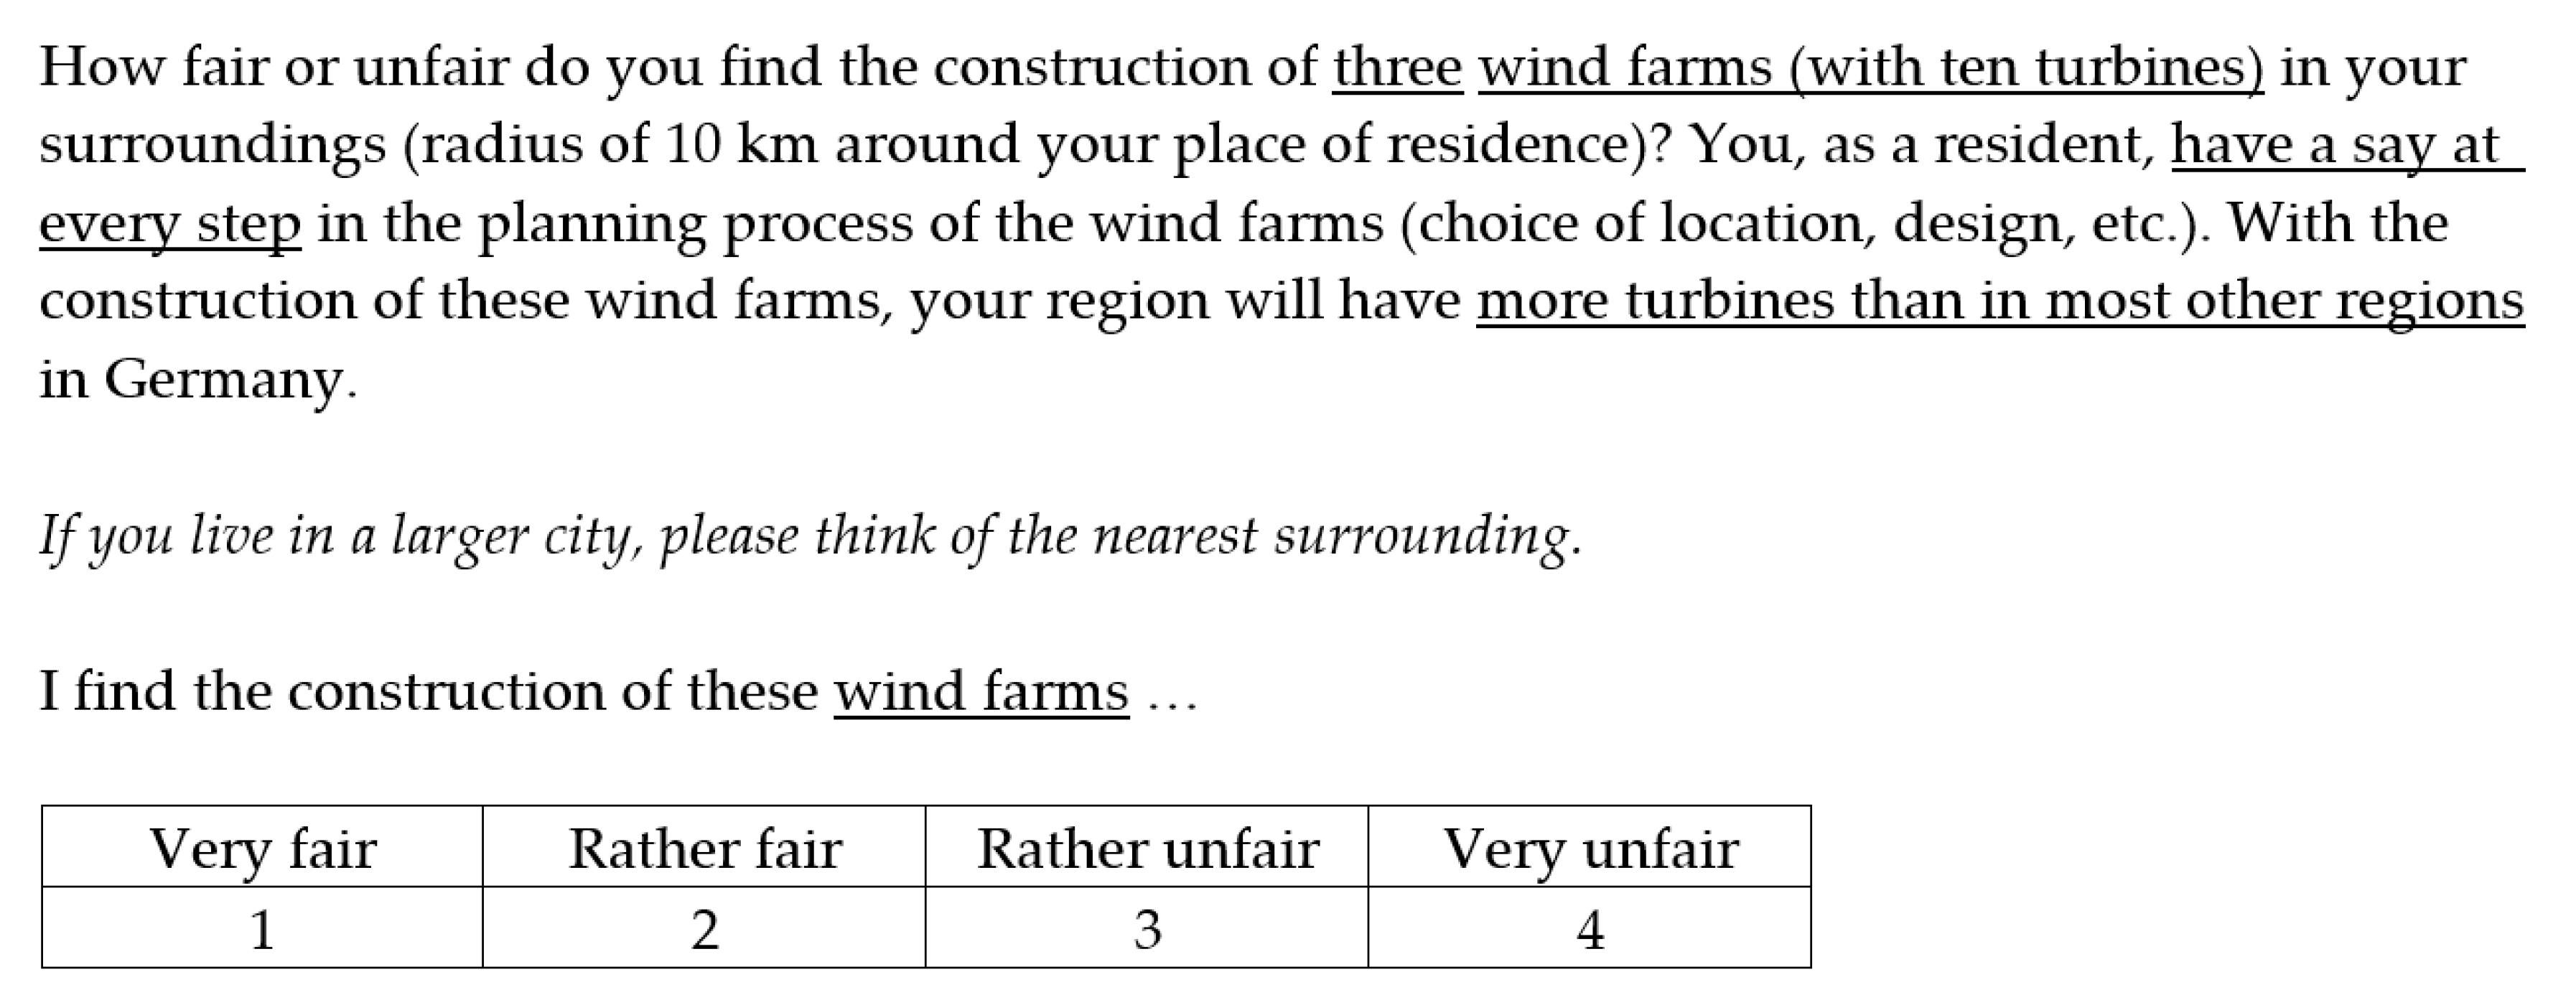
In designing and conducting an FSE (see [18] for state-of-the art guidelines), researchers have to decide on the number of attributes (factors or characteristics) of a situation, and attribute levels have to be assigned. In our example on renewable energy projects, we described projects to construct a renewable energy site in respondents’ vicinity (10-km radius from their place of residence) and were interested in how unfair or fair the respondents perceive these projects to be. We varied four attributes across vignettes. First, the project referred with (1) a wind farm (10 turbines), (2) a photovoltaic power station, or (3) a biogas plant to different types of renewable energy and, second, with (1) one, (2) three, or (3) five power plants to different magnitudes of exposure to power plants. Third, based on the literature on environmental justice, we included the attributes procedural justice, that is, citizens have (1) no say in the planning process, (2) partial say in the planning process, or (3) a say at every step in the planning process, and fourth, distributive justice—with the planned project respondents have (1) fewer power plants, (2) the same number, or (3) more power plants in their region than in other regions in Germany.
Combining all possible attribute combinations—3 × 3 × 3 × 3—gave a the so-called full factorial of 81 vignettes and hence 81 different project descriptions. We employed the full factorial and each respondent answered one vignette which was randomly chosen from the full factorial. Using randomization and the full factorial, we were able to experimentally isolate all main effects, two-way effects, and three-way effects between attributes. If a factorial survey study comprises more attributes or attribute levels, the full factorial is often too large to consider all vignettes. Thus, an experimental design is used to reduce the number of vignettes that respondents face, but at the same time, to maintain the possibility of separating the effects of single factors. Researchers also have to choose a response scale for recording respondents’ judgments (e.g., four-point, five-point, seven-point, or eleven-point response scales). While the literature suggests longer response scales [18], in this study we opted for a four-point scale because we wanted to fully label each category of the scale using the words “fair” and “unfair”. Figure 1 provides an example of a vignette as used in the study.
Figure 1. Example of a vignette used in the factorial survey.
Sustainability 12 08084 g001
Note: Attributes and attribute levels that varied across vignettes are underlined.

2.2. Data and Variables

We embedded the FSE in an online survey on renewable energy expansion in Germany. The survey was conducted in September and October 2013 [29]. Participants were members of an access panel who were actively recruited by phone (no opt-in panel) and represented the German population that uses the internet at least once a week. We used quota sampling representing the German population regarding gender and age as close as possible. After inspection of the data, out of 3400 completed questionnaires, 3199 usable interviews remained for analyzing the factorial survey (due to missing values and implausible answers). The response rate (standard RR1, [30]) was 26%. Prior to the survey, six focus groups and two pretest surveys were conducted.
In our sample, women (45% in the sample, 51% in the population) and those living in mid-sized cities (33% in the sample, 42% in the population) were underrepresented and those with higher education, i.e., a university entrance diploma or higher, overrepresented (61% in the sample, 31% in the population). The mean values for age (43 years, SD = 14) and household net income (3048 Euro, SD = 1.519) were fairly close to the average values for the German population [31]. While the sample was clearly not representative, it contained sufficient variance on sociodemographics in order to take heterogeneity in population characteristics into account. Individuals in rural areas are more affected by renewable energy expansion compared to those in urban areas, and our data also show considerable variance along the rural-urban continuum (31% rural areas, 33% mid-sized cities, 36% large cities).
The survey also included questions on place attachment, which we considered in the regression models on heterogeneity of fairness evaluations. The corresponding variable was an additive index of answers to the following four survey items, all answered on a four-point response scale (1 = strongly disagree to 4 = strongly agree): “I like to be in the landscape next to my place of residence”, “Often, I spend my free time in the landscape next to my place of residence”, “The landscape around my place of residence is a part of me”, “It is very important to me that the landscape around my place of residence does not change”. Cronbach’s alpha for the index was 0.7714; the index ranged between 4 and 16 with a mean of 13.085 and standard deviation of 2.233.
In the survey we considered three renewable energy sources: wind energy, solar energy, and biomass. At the beginning of the survey, respondents were shown pictograms and definitions of these renewables (see Table 1). It was also clarified that the survey focused on renewables in the open landscape and did not consider energy production in urban areas, for example, through solar panels on roofs. In contrast to wind and solar energy the energy source is not unboundedly available in the case of biomass. Therefore, we asked respondents to consider the cultivation of raw material and the power plant when rating the renewable energy biomass. For the most part, biomass is used for electricity generation at the place of production.
The survey also included a question regarding the general acceptance of the construction of renewable power plants in respondents’ vicinity. The exact wording of this acceptance question was as follows: “How strongly would you support or oppose the construction of the following renewable power plants [solar energy, wind energy and biomass] within a 10 km radius of your place of residence?” Respondents answered this question on a four-point response scale (strongly oppose, somewhat oppose, somewhat support, strongly support).

3. Results

3.1. Overall Fairness Evaluation and Acceptance Figures

Table 2 shows the fairness evaluations regarding the construction of new power plants in respondents’ vicinity across all vignettes and per renewable energy type. The figures indicate that there was remarkable variance on the fairness scale. However, for each energy type the majority of respondents perceived the construction of an additional plant as rather fair or very fair. The corresponding figures were 81% for solar energy, 67% for wind energy, and 56% for biomass. We can compare these figures with those from the question on the general acceptance of the construction of additional power plants in citizens’ vicinity. Both fairness perception and acceptance were measured on four-point scales. While there was a substantial positive correlation between the fairness and acceptance measure (all significant at p < 0.001), both were not perfectly correlated (Pearson correlations of r = 0.529 for wind energy, r = 0.350 for solar energy, and r = 0.514 for biomass). In other words: these measures discriminated to some extent, even if they correlated with each other. On the other hand, it needs to be kept in mind that the fairness question referred to “concrete” project descriptions presented in the vignettes, while the acceptance question referred to the construction of power plants in general; yet both questions were related to a 10 km radius of the respondents’ place of residence. This could explain that, in Table 2, the mean values of the perceived fairness of the construction of “concrete” wind energy and solar energy plants are lower than the corresponding mean values of general acceptance. However, for biomass we found the opposite pattern—that is, mean fairness values for concrete projects were higher than mean general acceptance values. This can be interpreted as another indication that fairness perceptions and agreement are conceptually different. Further, the correlations between fairness and acceptance in the present study are similar to the ones presented in a vignette study on airport expansion scenarios, which included both measures at the vignette level [10], supporting our claim that fairness and acceptance are not (entirely) the same.

3.2. Effects of Vignette Attributes on Fairness Evaluations
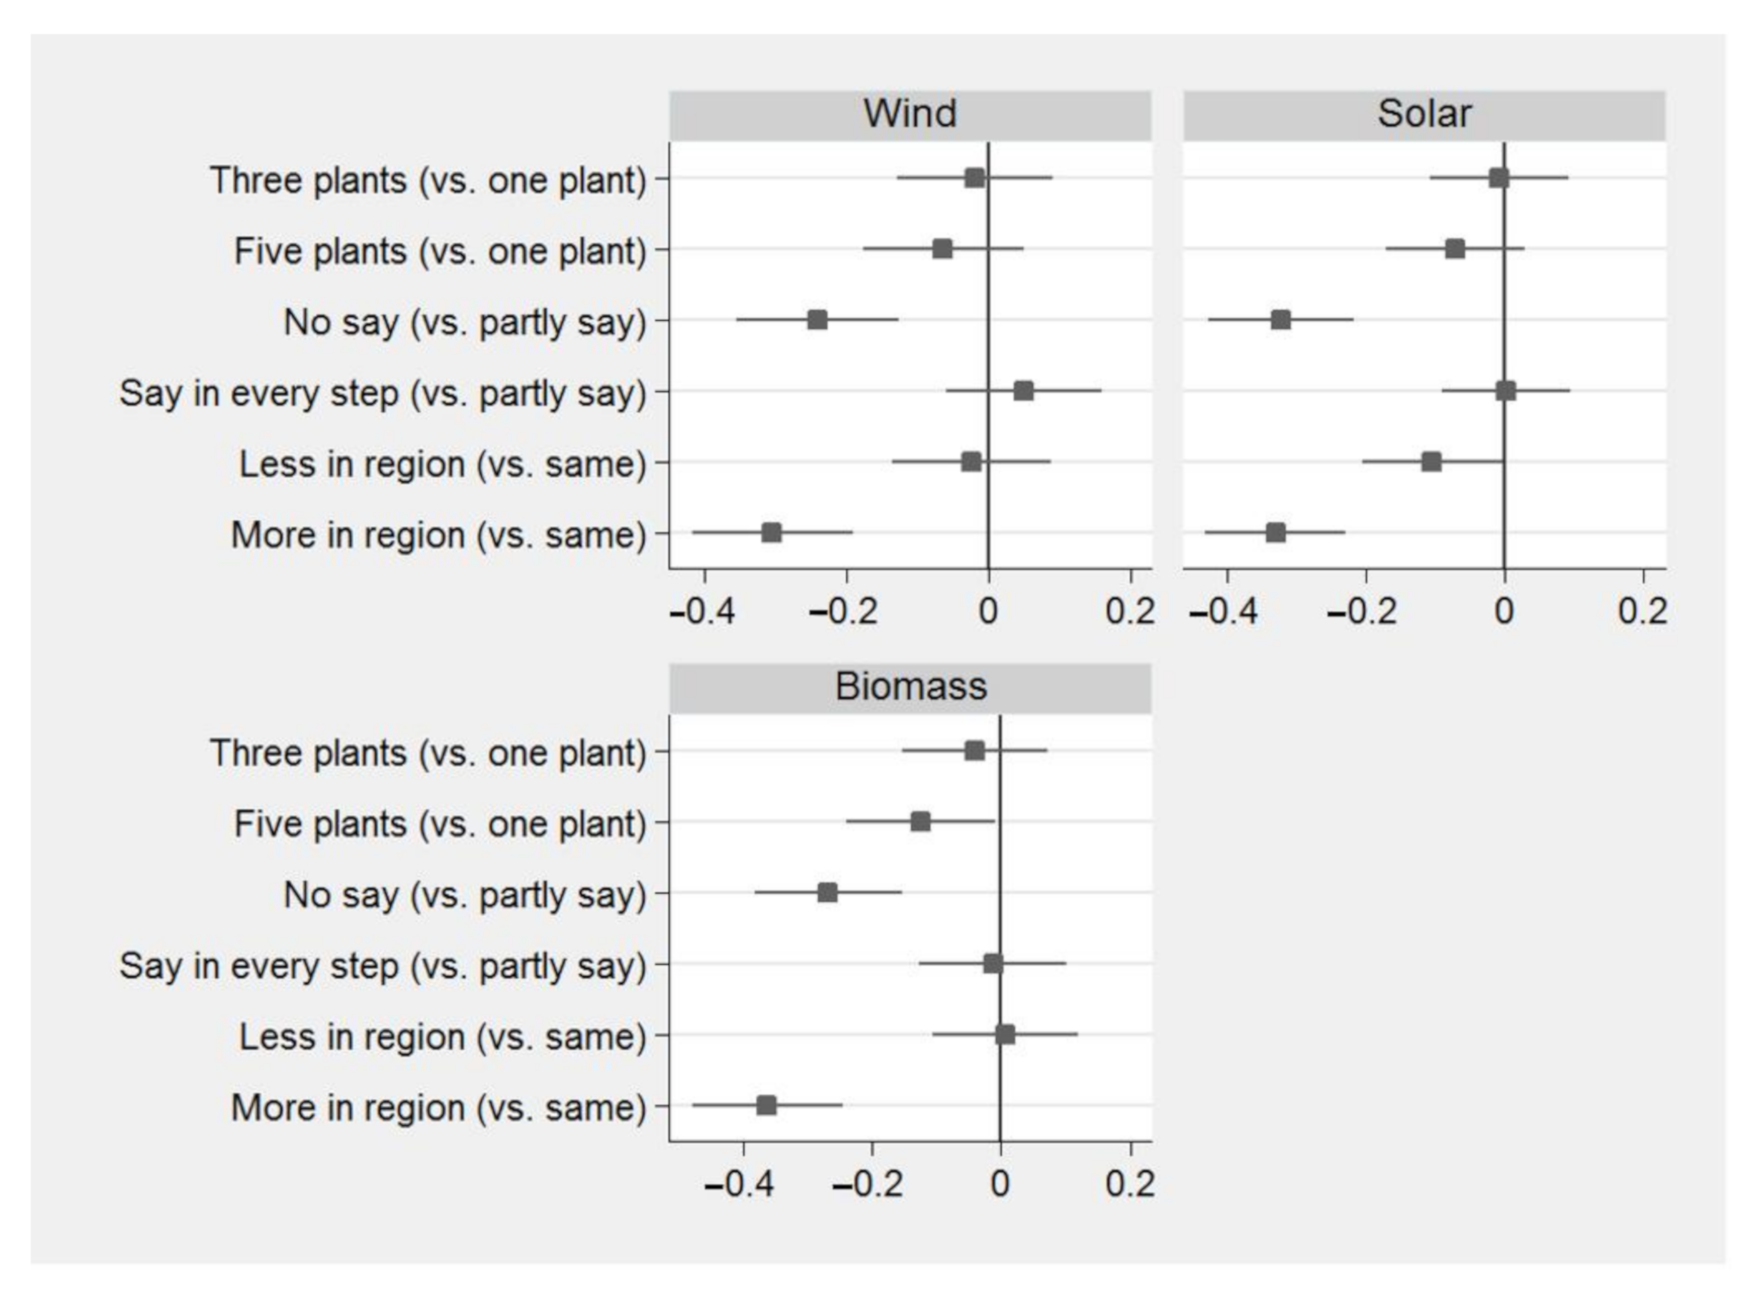
In the following, we present plots for linear regression models on fairness evaluations per renewable energy type: first for models only including the vignette attributes (Figure 2) and second for models including the vignette attributes and additional variables to explain heterogeneity in fairness evaluations (Figure 3). The full regression models underlying Figure 2 and Figure 3 can be found in Table A1 in the Appendix A. Further, Table A2 in the Appendix A contains for each renewable energy type a comparison of the results of a linear regression model, an ordered logit model and a binary logit model. In the latter, the dependent variable has value of 1 for the categories “very fair” and “rather fair”, and 0 for the categories “rather unfair” and very unfair” on the four-point fairness scale. Since the results are similar across the different modeling variants, we present the results of linear regression models.
The results in Figure 2 (also Table A1) show that the number of renewable power plants does not have a significant effect on fairness evaluations regarding wind power and solar energy. There was only one negative and statistically significant effect for biomass indicating that the construction of five plants compared to one plant is associated with lower fairness perceptions. There are clear indications that procedural and distributive justice matter. With respect to all the renewable energies, having no say in the planning process was perceived as more unfair than having a partial say in the planning process. The corresponding effects were statistically significant and amounted to 0.3 points on the four-point fairness scale. Yet, there was no statistically significant difference for having a say in all steps of the planning process compared to having a partial say in the planning process. It seems that respondents valued the general possibility of participating in the planning process and not so much the extent of it. Regarding the distributive justice, respondents perceived more unfairness if the new power plants lead to overall more renewable power plants in their region as compared to other regions. The effects had a similar size to the ones for procedural justice and were all highly statistically significant. Only for solar energy did respondents perceive more unfairness also if they had fewer power plants in their region as compared to other regions. For wind energy and biomass, we found no statistically significant differences between less exposure and equal exposure to power plants across regions.
We also checked interaction effects between vignette attributes. Taking all possible two-way and three-way interaction effects into account, we only found one statistically significant two-way interaction and three-way interaction in the model for wind energy. They showed that the construction of five plants was evaluated as less unfair if respondents still had fewer renewable energy plants in their region compared to other regions. Yet, this interaction was evaluated to be less fair if residents had a say in the planning process compared to having a partial say.
Figure 2. Regression models for fairness evaluations and vignette attributes.
Sustainability 12 08084 g002
Note: unstandardized coefficients and 95% confidence intervals of linear regression models with the four-point fairness scale as dependent variable and the vignette attributes as independent variables. The model characteristics are as follows: for wind energy, F(6, 1044) = 10.85, Prob > F = 0.000, R2 = 0.0596, n = 1051; for solar energy, F(6, 1068) = 15.12, Prob > F = 0.000, R2 = 0.0844, n = 1075; for biomass, F(6, 1066) = 13.99, Prob > F = 0.000, R2 = 0.0746, n = 1073.

3.3. Effects of Respondent Characteristics on Fairness Evaluations

Figure 3 presents models that include additional variables to explain heterogeneity in fairness evaluations; the figure only depicts variables that had statistically significant effects on fairness evaluations at the 5% level (full models are presented in Table A2 in the Appendix A). The main insights are that, as already shown above, the general acceptance of new renewable power plants in respondents’ vicinity did have a positive effect on the perceived fairness; yet, causation can go in both directions, i.e., acceptance can affect fairness and vice versa. The effect sizes for a unit change ranged between 0.36 (solar energy) and 0.46 (wind energy and biomass) on the four-point fairness scale. Higher education was significantly associated with higher levels of perceived fairness at the 5% level in the models on wind and solar energy.
Rural areas are more affected by renewable energy expansion than urban areas. However, we did not find remarkable differences in fairness evaluations between respondents living in medium-sized or large cities and those living in villages. Yet, there was one exception: compared to those living in villages, respondents residing in large cities perceived the construction of biomass power plants as rather fair. The effect amounted to 0.15 points on the four-point fairness scale. Place attachment did not significantly affect fairness concerns regarding solar and biomass but it had a negative and statistically significant effect on the perceived fairness of the construction of new wind energy plants. Of note, a 10-point increase on the place-attachment scale, with a minimum value of 4 and a maximum value of 16, is associated with a 0.25 decrease on the four-point fairness scale. This effect for wind energy might be due to the higher visibility of wind farms as compared with solar and biomass plants.
Figure 3. Regression models for fairness evaluations, vignette attributes, and respondents’ characteristics.
Sustainability 12 08084 g003
Note: unstandardized coefficients and 95% confidence intervals of linear regression models with the four-point fairness scale as dependent variable, and the vignette attributes and respondents’ characteristics as independent variables. Not all respondent characteristics are shown; the underlying models also included gender, age, income, but these characteristics had statistically insignificant effects in all three models depicted. The model characteristic are as follows: for wind energy, F(14, 1036) = 44.12, Prob > F = 0.000, R2 = 0.3617, n = 1051; for solar energy, F(14, 1060) = 18.18, Prob > F = 0.000, R2 = 0.2226, n = 1075; for biomass, F(14, 1058) = 44.63, Prob > F = 0.000, R2 = 0.3504, n = 1073.

4. Discussion and Conclusion

4.1. Heterogeneity of Justice Concerns

Justice is a multi-dimensional concept and it is challenging to disentangle the importance of each of the dimensions for justice/fairness evaluations. In this paper, we focused on distributive and procedural justice related to renewable energy expansion. Both dimensions are commonly discussed in the environmental justice and energy-related literature [2,4,12,32,33]. We demonstrated how using factorial surveys can contribute to research on energy production. By directly measuring justice/fairness perceptions and varying justice-related attributes across vignettes, we examined and disentangled the relevance of different justice dimensions for energy-related projects. Our study showed, for example, that the number of renewable energy plants is less important than aspects of procedural and distributive justice. The latter justice dimensions are equally important, which is in contrast to previous FSE research on the local acceptance of wind energy plants [27], indicating that participatory justice might be more important than distributive justice. Yet, this research measured acceptance and not fairness and also included more vignette attributes. It is not clear whether the relative importance of justice dimensions depends on the outcome measure (fairness versus acceptance) and/or the information provided about renewable energy projects. For example, it could be that distributive justice related to the number of power plants across regions becomes less relevant if further information about a project is given, such as who is investing in the project and how benefits are allocated.
Our application of FSEs revealed heterogeneity regarding justice concerns. First, it is noteworthy that in terms of fairness, respondents evaluated having more power plants in their region than in other regions differently than having fewer power plants than in other regions. If outcome equality holds, respondents should also have disvalued a disproportionately lower exposure to renewable energy power plants. This was clearly not the case and only for solar energy did we find a significant effect that lower exposure levels were perceived as rather unfair compared to equal exposure levels. However, compared with equal exposure across regions, the effect for lower exposure levels was weaker than the one for higher exposure levels. The fact that there was an effect for solar energy might be associated with its large general support as compared with wind energy and especially biomass, as well as with our finding that place attachment is not a significant determinant of fairness perceptions related to photovoltaic power stations (compared to wind turbines). Such perceptions of distributive justice are likely to affect not only the acceptance of renewable energy projects at the local level but also the spatial allocation of power plants at the country level, where depending on the underlying justice principle efficient allocations can vary remarkably [34].
Second, we found a heterogeneity in justice concerns affected by education, place of residence, and place attachment as well as the type of renewable energy production. For all energy sources we found a positive effect of education on fairness perceptions related to the construction of new power plants. Education is positively related to knowledge about environmental issues, which in turn can positively affect environmental attitudes and pro-environmental behavior [35], as well as fairness concerns related to renewable energy expansion. We found that placement attachment was important for fairness perceptions related to the construction of wind turbines but not for photovoltaic power stations and biogas plants; this could be explained by the higher visibility of wind turbines as well as the fact that, at the time of the survey, respondents were more likely to be actually exposed to wind turbines compared with photovoltaic power stations and biogas plants. The place-attachment effect could be considered in decision-making processes and explicitly taken into account by addressing corresponding concerns when discussing with citizens, and in the framing of wind energy projects. As the place-attachment effect was specific for wind power it illustrates that the relevance of determinants of fairness concerns can differ across energy sources.
While our survey was carried out over five years ago and meanwhile renewable energy expansion has progressed in Germany, many of our findings are in line with more recent studies on the acceptance of renewable energy expansion in Germany. This includes the citizens’ overall higher support of solar energy, followed by wind power and biomass [36], as well as the finding that the place of residence does not have strong effects regarding wind turbine acceptance [27]. Yet, in our study citizens living in large cities evaluated biogas plants more positively than those in rural areas.

4.2. The Merits of FSEs

Turning to the merits of FSEs as a methodological tool in energy research, FSEs have several advantages over standard survey items to measure justice concerns. Based on Liebig et al. [19], Table 3 provides an overview of common problems in quantitative research on energy production and consumption and refers to advantages of using FSEs to solve these problems. A standard survey item does not consider context information and this might prompt specific answers. In FSEs, respondents receive more context information, for example by combining different attributes of wind power plants and hence prompting, such as overstating the importance of one attribute (e.g., distributive justice), should be less likely. Using standard survey items, it is difficult to determine the relative importance of justice dimensions such as participatory and distributive justice related to wind power plants. The experimental design underlying FSEs makes it possible to single out the relative importance of each dimension. Responses to standard survey items might lead to biased response behavior. For example, renewable energy expansion might be perceived as socially desirable and hence respondents might tend to agree with survey items in favor of renewable energy expansion. This cannot be completely ruled out in FSEs but should be less likely because respondents have to consider and make trade-offs between several attributes. Further, in research on justice concerns related to energy production, researchers explicitly or implicitly assume causal effects of justice dimensions on outcomes related to energy production and consumption. Yet, causal effects cannot be studied based on standard survey items and cross-sectional data. They can be examined, however, in factorial surveys and other population-based survey experiments [37].
We believe that FSEs can complement the researcher’s toolbox in energy research as a useful tool to measure justice beliefs, fairness perceptions, attitudes, and normative beliefs. In this regard they have clear advantages over single survey items or (multifactorial) stated choice experiments, which can be employed to measure preferences and to obtain welfare measures [38]. FSEs should be combined with qualitative methods such as focus groups to develop valid vignette scenarios and attributes and to obtain an impression on how respondents handle the vignettes in order to check their suitability. As any other method, FSEs are not free of methodological issues, such as the complexity of vignettes, the role of the response format (e.g., closed-ended versus open-ended question format), and order effects and fatigue, if multiple vignettes are presented per respondent [39,40]. These need to be considered when planning an FSE.

4.3. Desiderata for Future Research

In this paper, we presented a rather simple application of FSEs. As already mentioned above, in another study on the local acceptance of wind power projects in Germany and Poland, Liebe et al. [27] also included attributes on the type of investor, the use of electricity (in the region versus for export), and the tax revenue resulting from the power plant. This means more justice dimensions and context factors can and possibly should be considered in FSEs. It would be important in future research to apply such more comprehensive FSEs in a multi-country context or multi-regional context within countries to systematically explore how cultural differences, social and economic contexts affect justice evaluations. For example, it could be examined whether higher economic inequality at the country or regional level leads to differences in the relevance of distributive justice related to renewable energy projects. Also, it can be studied how the evaluation of distributive and participatory justice changes if more information is given about the renewable energy project at hand. Complementing other empirical approaches, such as case studies, FSE research can help decision-makers to better predict which contexts might result in higher or lower levels of perceived fairness of energy transition initiatives.
Previous applications of FSEs [27] measured justice/fairness concerns indirectly; they used an acceptance scale to measure respondents’ evaluation of renewable energy projects. In future research it should be considered that, even if correlated, acceptance is not the same as justice, and more generally, that environmental inequality does not equal environmental injustice. Therefore, it is important to further explore differences between acceptance and justice measurement instruments, as well as under which conditions perceived unfairness results in non-acceptance of energy transition projects. In other words: similar to inequality, unfairness does not necessarily mean non-acceptance/opposition and subsequently protesting against renewable energy projects. There is a need for a better understanding of conditions and mechanisms that link justice and social acceptance, including fairness perceptions, support, and protest behavior, both at the country and regional level. Again, insights from basic research in this regard can be helpful in shaping energy transition projects with higher (local) acceptance levels.
Finally, besides energy production, FSEs can also be applied to justice concerns regarding energy poverty, involuntary resettlement, fossil fuel pollution, nuclear waste, climate change, etc. The method is also applicable in the global south [41]. The present paper paves the way for employing FSEs for direct measurement of justice concerns and for disentangling the importance of different justice dimensions and thereby complementing existing research on energy production and consumption and subsequently informing (political) decision making.

Author Contributions

Conceptualization, U.L. and G.M.D.; methodology, U.L. and G.M.D.; investigation, U.L. and G.M.D.; writing—original draft preparation, U.L. and G.M.D.; funding acquisition, U.L. All authors have read and agreed to the published version of the manuscript.

Funding

“This research was funded by the German Federal Ministry for Education and Research, grant number 01LA1110C (Research Project “Efficient and fair allocation of renewable energy production at the national level” (EnergyEFFAIR)).

Acknowledgments

We thank our colleagues from the EnergyEFFAIR project for kind collaboration.

Conflicts of Interest

The authors declare no conflict of interest. The funders had no role in the design of the study; in the collection, analyses, or interpretation of data; in the writing of the manuscript, or in the decision to publish the results.

Appendix A

Table A1. Full linear regressions models underlying Figure 2 and Figure 3 in the main text.
Figure 2Figure 3
WindSolarBiomassWindSolarBiomass
Three plants (vs. one plants)−0.0177
(−0.32)
−0.0127
(−0.25)
−0.0457
(−0.80)
−0.0746
(−1.67)
−0.0233
(−0.51)
−0.0601
(−1.23)
Five plants (vs. one plant)−0.0660
(−1.15)
−0.0753
(−1.48)
−0.123 *
(−2.08)
−0.0915
(−1.88)
−0.0540
(−1.13)
−0.117 *
(−2.37)
No say (vs. partial say)−0.242 ***
(−4.14)
−0.319 ***
(−6.00)
−0.276 ***
(−4.74)
−0.239 ***
(−4.99)
−0.320 ***
(−6.46)
−0.264 ***
(−5.21)
Say in every step (vs. partial say)0.0526
(0.95)
0.000746
(0.02)
−0.0122
(−0.21)
0.0636
(1.41)
−0.0184
(−0.43)
0.00744
(0.16)
Less in region (vs. same)−0.0290
(−0.51)
−0.105 *
(−2.06)
0.0101
(0.18)
−0.0422
(−0.88)
−0.113 *
(−2.36)
−0.00116
(−0.02)
More in region (vs. same)−0.307 ***
(−5.35)
−0.334
(−6.50)
−0.360 ***
(−6.09)
−0.316 ***
(−6.71)
−0.360 ***
(−7.69)
−0.341 ***
(−6.99)
Acceptance of plant in vicinity 0.459 ***
(19.16)
0.359 ***
(11.40)
0.457 ***
(17.96)
Woman (vs. man) −0.0356
(−0.89)
−0.00455
(−0.12)
−0.00282
(−0.07)
Age in years −0.000910
(−0.60)
−0.00266
(−1.83)
−0.00359 *
(−2.32)
Higher education (vs. less education) 0.142 ***
(3.39)
0.130 **
(3.06)
0.0823
(1.86)
Net income in Euro 0.00000384
(0.18)
0.0000278
(1.34)
0.00000583
(0.26)
Medium-sized city (vs. small city) 0.0179
(0.35)
−0.0583
(−1.19)
0.0812
(1.53)
Large city (vs. small city) 0.0823
(1.66)
0.0203
(0.43)
0.151 **
(2.92)
Place attachment −0.0251 **
(−2.75)
−0.00297
(−0.31)
−0.00954
(−0.90)
Constant2.931 ***
(49.33)
3.256 ***
(58.16)
2.779 ***
(43.85)
1.879 ***
(11.03)
2.132 ***
(11.92)
1.777 ***
(9.76)
R20.0600.0840.0750.3620.2230.350
n105110751073105110751073
Note: t statistics in parentheses; * p < 0.05, ** p < 0.01, *** p < 0.001.
Table A2. Comparison of linear regression, ordered logit, and binary logit models.
WindWindWindSolarSolarSolarBiomassBiomassBiomass
LinearOrderedBinaryLinearOrderedBinaryLinearOrderedBinary
Three plants (vs. one plants)−0.0177
(−0.32)
−0.0594
(−0.42)
−0.149
(−0.89)
−0.0127
(−0.25)
−0.0137
(−0.09)
−0.0646
(−0.32)
−0.0457
(−0.80)
−0.173
(−1.24)
−0.332 *
(−2.11)
Five plants (vs. one plant)−0.0660
(−1.15)
−0.169
(−1.16)
−0.293
(−1.75)
−0.0753
(−1.48)
−0.213
(−1.44)
−0.292
(−1.50)
−0.123 *
(−2.08)
−0.311 *
(−2.18)
−0.321 *
(−2.05)
No say (vs. partial say)−0.242 ***
(−4.14)
−0.632 ***
(−4.31)
−0.764 ***
(−4.58)
−0.319 ***
(−6.00)
−0.928 ***
(−5.90)
−1.135 ***
(−5.77)
−0.276 ***
(−4.74)
−0.659 ***
(−4.75)
−0.667 ***
(−4.30)
Say in every step (vs. partial say)0.0526
(0.95)
0.0978
(0.68)
−0.102
(−0.59)
0.000746
(0.02)
−0.0464
(−0.33)
−0.114
(−0.52)
−0.0122
(−0.21)
−0.00331
(−0.02)
0.0499
(0.32)
Less in region (vs. same)−0.0290
(−0.51)
−0.102
(−0.69)
−0.155
(−0.89)
−0.105 *
(−2.06)
−0.380 *
(−2.48)
−0.238
(−1.13)
0.0101
(0.18)
0.0279
(0.20)
0.0149
(0.09)
More in region (vs. same)−0.307 ***
(−5.35)
−0.849 ***
(−5.70)
−0.965 ***
(−5.76)
−0.334 ***
(−6.50)
−1.046 ***
(−6.77)
−0.924 ***
(−4.66)
−0.360 ***
(−6.09)
−0.873 ***
(−6.11)
−0.943 ***
(−6.00)
Constant2.931 ***
(49.33)
1.562 ***
(7.96)
3.256 ***
(58.16)
2.454 ***
(9.66)
2.779 ***
(43.85)
0.979 ***
(5.68)
Cut point 1 −3.233 ***
(−15.71)
−4.387 ***
(−17.72)
−2.709 ***
(−14.75)
Cut point 2 −1.318 ***
(−8.17)
−2.385 ***
(−12.82)
−0.908 ***
(−5.63)
Cut point 3 1.414 ***
(8.91)
0.590 ***
(3.58)
1.919 ***
(10.91)
R2/Pseudo R20.0600.02890.05130.0840.04270.06710.0750.03390.0566
n105110511051107510751075107310731073
Note: t statistics in parentheses; * p < 0.05, *** p < 0.001.

References

  1. Sovacool, B.K.; Heffron, R.J.; McCauley, D.; Goldthau, A. Energy decisions reframed as justice and ethical concerns. Nat. Energy 2016, 1, 16024. [Google Scholar] [CrossRef] [Green Version]
  2. Wolsink, M. Wind Power wind power: Basic Challenge Concerning Social Acceptance wind power social acceptance. In RENEWABLE Energy Systems: 3 Volumes; Kaltschmitt, M., Ed.; Springer: New York, NY, USA, 2013; ISBN 978-1-4614-5819-7. [Google Scholar]
  3. Jenkins, K.; McCauley, D.; Heffron, R.; Stephan, H.; Rehner, R. Energy justice: A conceptual review. Energy Res. Soc. Sci. 2016, 11, 174–182. [Google Scholar] [CrossRef] [Green Version]
  4. Perlaviciute, G.; Steg, L. Contextual and psychological factors shaping evaluations and acceptability of energy alternatives: Integrated review and research agenda. Renew. Sustain. Energy Rev. 2014, 35, 361–381. [Google Scholar] [CrossRef]
  5. Langer, K.; Decker, T.; Menrad, K. Public participation in wind energy projects located in Germany: Which form of participation is the key to acceptance? Renew. Energy 2017, 112, 63–73. [Google Scholar] [CrossRef]
  6. Lienhoop, N. Acceptance of wind energy and the role of financial and procedural participation: An investigation with focus groups and choice experiments. Energy Policy 2018, 118, 97–105. [Google Scholar] [CrossRef]
  7. Walker, C.; Baxter, J. “It’s easy to throw rocks at a corporation”: Wind energy development and distributive justice in Canada. J. Environ. Policy Plan. 2017, 19, 754–768. [Google Scholar] [CrossRef]
  8. Walker, B.J.A.; Russel, D.; Kurz, T. Community Benefits or Community Bribes? An Experimental Analysis of Strategies for Managing Community Perceptions of Bribery Surrounding the Siting of Renewable Energy Projects. Environ. Behav. 2016, 49, 59–83. [Google Scholar] [CrossRef] [Green Version]
  9. Wüstenhagen, R.; Wolsink, M.; Bürer, M.J. Social acceptance of renewable energy innovation: An introduction to the concept. Energy Policy 2007, 35, 2683–2691. [Google Scholar] [CrossRef] [Green Version]
  10. Liebe, U.; Preisendörfer, P.; Bruderer Enzler, H. The social acceptance of airport expansion scenarios: A factorial survey experiment. Transp. Res. Part D Transp. Environ. 2020, 84, 102363. [Google Scholar] [CrossRef]
  11. Baxter, J. Energy justice: Participation promotes acceptance. Nat. Energy 2017, 2, 17128. [Google Scholar] [CrossRef]
  12. Schlosberg, D. Defining Environmental Justice. Theories, Movements, and Nature; Oxford University Press: Oxford, UK, 2007; ISBN 9780199286294. [Google Scholar]
  13. Fuller, S.; McCauley, D. Framing energy justice: Perspectives from activism and advocacy. Energy Res. Soc. Sci. 2016, 11, 1–8. [Google Scholar] [CrossRef]
  14. Liu, F. Environmental Justice Analysis. Theories, Methods, and Practice; CRC Press: Boca Raton, FL, USA, 2001; ISBN 1566704030. [Google Scholar]
  15. Miller, D. Distributive Justice: What the People Think. Ethics 1992, 102, 555–593. [Google Scholar] [CrossRef]
  16. Miller, D. Principles of Social Justice; Harvard Univ. Press: Cambridge, MA, USA, 1999; ISBN 0-674-70628-5. [Google Scholar]
  17. Sandel, M.J. Justice. What’s the Right Thing to Do? Penguin Books: London, UK, 2010; ISBN 9780141041339. [Google Scholar]
  18. Auspurg, K.; Hinz, T. Factorial Survey Experiments; Sage: Los Angeles, CA, USA, 2015; ISBN 978-1-4522-7418-8. [Google Scholar]
  19. Liebig, S.; Sauer, C.; Friedhoff, S. Using Factorial Surveys to Study Justice Perceptions: Five Methodological Problems of Attitudinal Justice Research. Soc. Just. Res. 2015, 28, 415–434. [Google Scholar] [CrossRef] [Green Version]
  20. Rossi, P.H. Vignette analysis: Uncovering the normative structure of complex judgements. In Qualitative and Quantitative Social Research: Papers in Honor of Paul F. Lazarsfeld; Merton, R.K., Coleman, J.S., Rossi, P.H., Eds.; Free Press: New York, NY, USA, 1979; ISBN 0029209307. [Google Scholar]
  21. Jasso, G.; Opp, K.-D. Probing the character of norms: A factorial survey analysis of the norms of political action. Am. Sociol. Rev. 1997, 62, 947–964. [Google Scholar] [CrossRef]
  22. Jasso, G.; Rossi, P.H. Distributive Justice and Earned Income. Am. Sociol. Rev. 1977, 42, 639. [Google Scholar] [CrossRef]
  23. Wallander, L. 25 years of factorial surveys in sociology: A review. Soc. Sci. Res. 2009, 38, 505–520. [Google Scholar] [CrossRef]
  24. Auspurg, K.; Hinz, T.; Sauer, C.; Liebig, S. The Factorial Survey as Method for Measuring Sensitive Issues. In Improving Survey Methods: Lessons from Recent Research; Engel, U., Jann, B., Lynn, P., Scherpenzeel, A.C., Sturgis, P., Eds.; Routledge: New York, NY, USA, 2015; ISBN 9780415836258. [Google Scholar]
  25. Dimitropoulos, A.; Kontoleon, A. Assessing the determinants of local acceptability of wind-farm investment: A choice experiment in the Greek Aegean Islands. Energy Policy 2009, 37, 1842–1854. [Google Scholar] [CrossRef]
  26. García, J.H.; Cherry, T.L.; Kallbekken, S.; Torvanger, A. Willingness to accept local wind energy development: Does the compensation mechanism matter? Energy Policy 2016, 99, 165–173. [Google Scholar] [CrossRef]
  27. Liebe, U.; Bartczak, A.; Meyerhoff, J. A turbine is not only a turbine: The role of social context and fairness characteristics for the local acceptance of wind power. Energy Policy 2017, 107, 300–308. [Google Scholar] [CrossRef] [Green Version]
  28. Walter, G.; Gutscher, H. Generelle Befürwortung von Windkraftanlagen vor Ort vs. Befürwortung spezifischer Windkraftprojekte: Der Einfluss von Projekt- und Verfahrensparametern. Umweltpsychologie 2013, 17, 124–144. [Google Scholar]
  29. Liebe, U.; Dobers, G.M. Decomposing public support for energy policy: What drives acceptance of and intentions to protest against renewable energy expansion in Germany? Energy Res. Soc. Sci. 2019, 47, 247–260. [Google Scholar] [CrossRef] [Green Version]
  30. American Association for Public Opinion Research (AAPOR). Standard Definitions: Final Dispositions of Case Codes and Outcome Rates for Surveys. 2016. Available online: https://www.aapor.org/AAPOR_Main/media/publications/Standard-Definitions20169theditionfinal.pdf (accessed on 28 March 2018).
  31. Federal Statistical Office of Germany. Statistisches Jahrbuch Deutschland und Internationales, Red.-Schluss: 01. August 2015; Federal Statistical Office of Germany: Wiesbaden, Germany, 2015; ISBN 978-3-8246-1037-2. [Google Scholar]
  32. Wolsink, M. Planning of renewables schemes: Deliberative and fair decision-making on landscape issues instead of reproachful accusations of non-cooperation. Energy Policy 2007, 35, 2692–2704. [Google Scholar] [CrossRef]
  33. Wolsink, M. Wind power implementation: The nature of public attitudes: Equity and fairness instead of ‘backyard motives’. Renew. Sustain. Energy Rev. 2007, 11, 1188–1207. [Google Scholar] [CrossRef]
  34. Drechsler, M.; Egerer, J.; Lange, M.; Masurowski, F.; Meyerhoff, J.; Oehlmann, M. Efficient and equitable spatial allocation of renewable power plants at the country scale. Nat. Energy 2017, 2, 289. [Google Scholar] [CrossRef]
  35. Kollmuss, A.; Agyeman, J. Mind the Gap: Why do people act environmentally and what are the barriers to pro-environmental behavior? Environ. Educ. Res. 2002, 8, 239–260. [Google Scholar] [CrossRef] [Green Version]
  36. Agentur für Erneuerbare Energien (AEE). Klares Bekenntnis der Deutschen Bevölkerung zu Erneuerbaren Energien. Available online: https://www.unendlich-viel-energie.de/themen/akzeptanz-erneuerbarer/akzeptanz-umfrage/klares-bekenntnis-der-deutschen-bevoelkerung-zu-erneuerbaren-energien (accessed on 21 September 2020).
  37. Mutz, D.C. Population-Based Survey Experiments; Princeton Univ. Press: Princeton, NJ, USA, 2011; ISBN 9780691144528. [Google Scholar]
  38. Louviere, J.J.; Hensher, D.A.; Swait, J.; Adamowicz, W.L. Stated Choice Methods. Analysis and Applications; Cambridge University Press: Cambridge, UK, 2010; ISBN 9780521782753. [Google Scholar]
  39. Sauer, C.G.; Auspurg, K.; Hinz, T.; Liebig, S. The application of factorial surveys in general population samples: The effects of respondent age and education on response times and response consistency. Surv. Res. Methods 2011, 5, 89–102. [Google Scholar]
  40. Auspurg, K.; Jäckle, A. First Equals Most Important? Order Effects in Vignette-Based Measurement. Sociol. Methods Res. 2015, 46, 490–539. [Google Scholar] [CrossRef] [Green Version]
  41. Liebe, U.; Moumouni, I.M.; Bigler, C.; Ingabire, C.; Bieri, S. Using Factorial Survey Experiments to Measure Attitudes, Social Norms, and Fairness Concerns in Developing Countries. Sociol. Methods Res. 2017, 43, 1–32. [Google Scholar] [CrossRef] [Green Version]
Table 1. Definition of renewable energy sources as used in the survey.
Sustainability 12 08084 i001 Sustainability 12 08084 i002 Sustainability 12 08084 i003
Wind Energy refers to electricity generation with single wind turbines and wind farms onshore only.Solar Energy refers exclusively to the production of electricity with photovoltaic systems in the open landscape, i.e., solar fields.Biomass refers to the production of biogas and its electricity and includes both the biogas plant and the cultivation of the required biomass (such as corn).
Table 2. Fairness evaluations and acceptance levels per type of renewable energy plant.
Plant TypeVery Unfair (Strongly Oppose) (1)Rather Unfair (Somewhat Oppose) (2)Rather Fair (Somewhat Support) (3)Very Fair (Strongly Support) (4)Mean (SD)
Wind
(n = 1051)
7%
(8%)
26%
(19%)
54%
(47%)
13%
(26%)
2.73 (0.78)
(2.91 (0.88))
Solar
(n = 1075)
3%
(2%)
16%
(9%)
60%
(50%)
21%
(39%)
2.97 (0.71)
(3.26 (0.70))
Biomass
(n = 1073)
13%
(15%)
31%
(34%)
48%
(41%)
8%
(10%)
2.51 (0.81)
(2.46 (0.87))
Note: First number in each cell refers to responses to the vignette/fairness question and the second number in parentheses to the acceptance question.
Table 3. Advantages of factorial survey experiments (FSEs) in research on energy production and consumption.
Problems of Empirical ResearchAdvantages of Using FSEs
Single-item measures lack context-information on different energy-related attributes and might prompt certain answers, such as overstating the importance of an attribute.FSEs consider several energy-related attributes, e.g., regarding renewable energy power plants and hence include more context information. Respondents have to make trade-offs. This should make prompting less likely.
Uncovering the relative importance of factors relevant for justice evaluations regarding energy-related issuesBased on a multifactorial design and trade-offs between justice attributes/factor, the effect/importance of each factor for justice evaluations can be determined.
Justice as a normative concept might be prone to socially desirable response behavior, e.g., overstating support for renewable energy productionBy presenting several factors at the same time, socially desirable responses are less likely. Respondents need to make trade-offs between attributes.
Causal effects, e.g., regarding renewable energy power plant attributes on fairness evaluations, cannot be identified.By randomly varying vignette attributes causal effects can be estimated.
Note: This table is based on [19].