A Quantitative Approach to Characterizing the Changes and Managing Urban Form for Sustaining the Suburb of a Mega-Urban Region: The Case of North Cianjur


Abstract
:1. Introduction
2. Materials and Methods
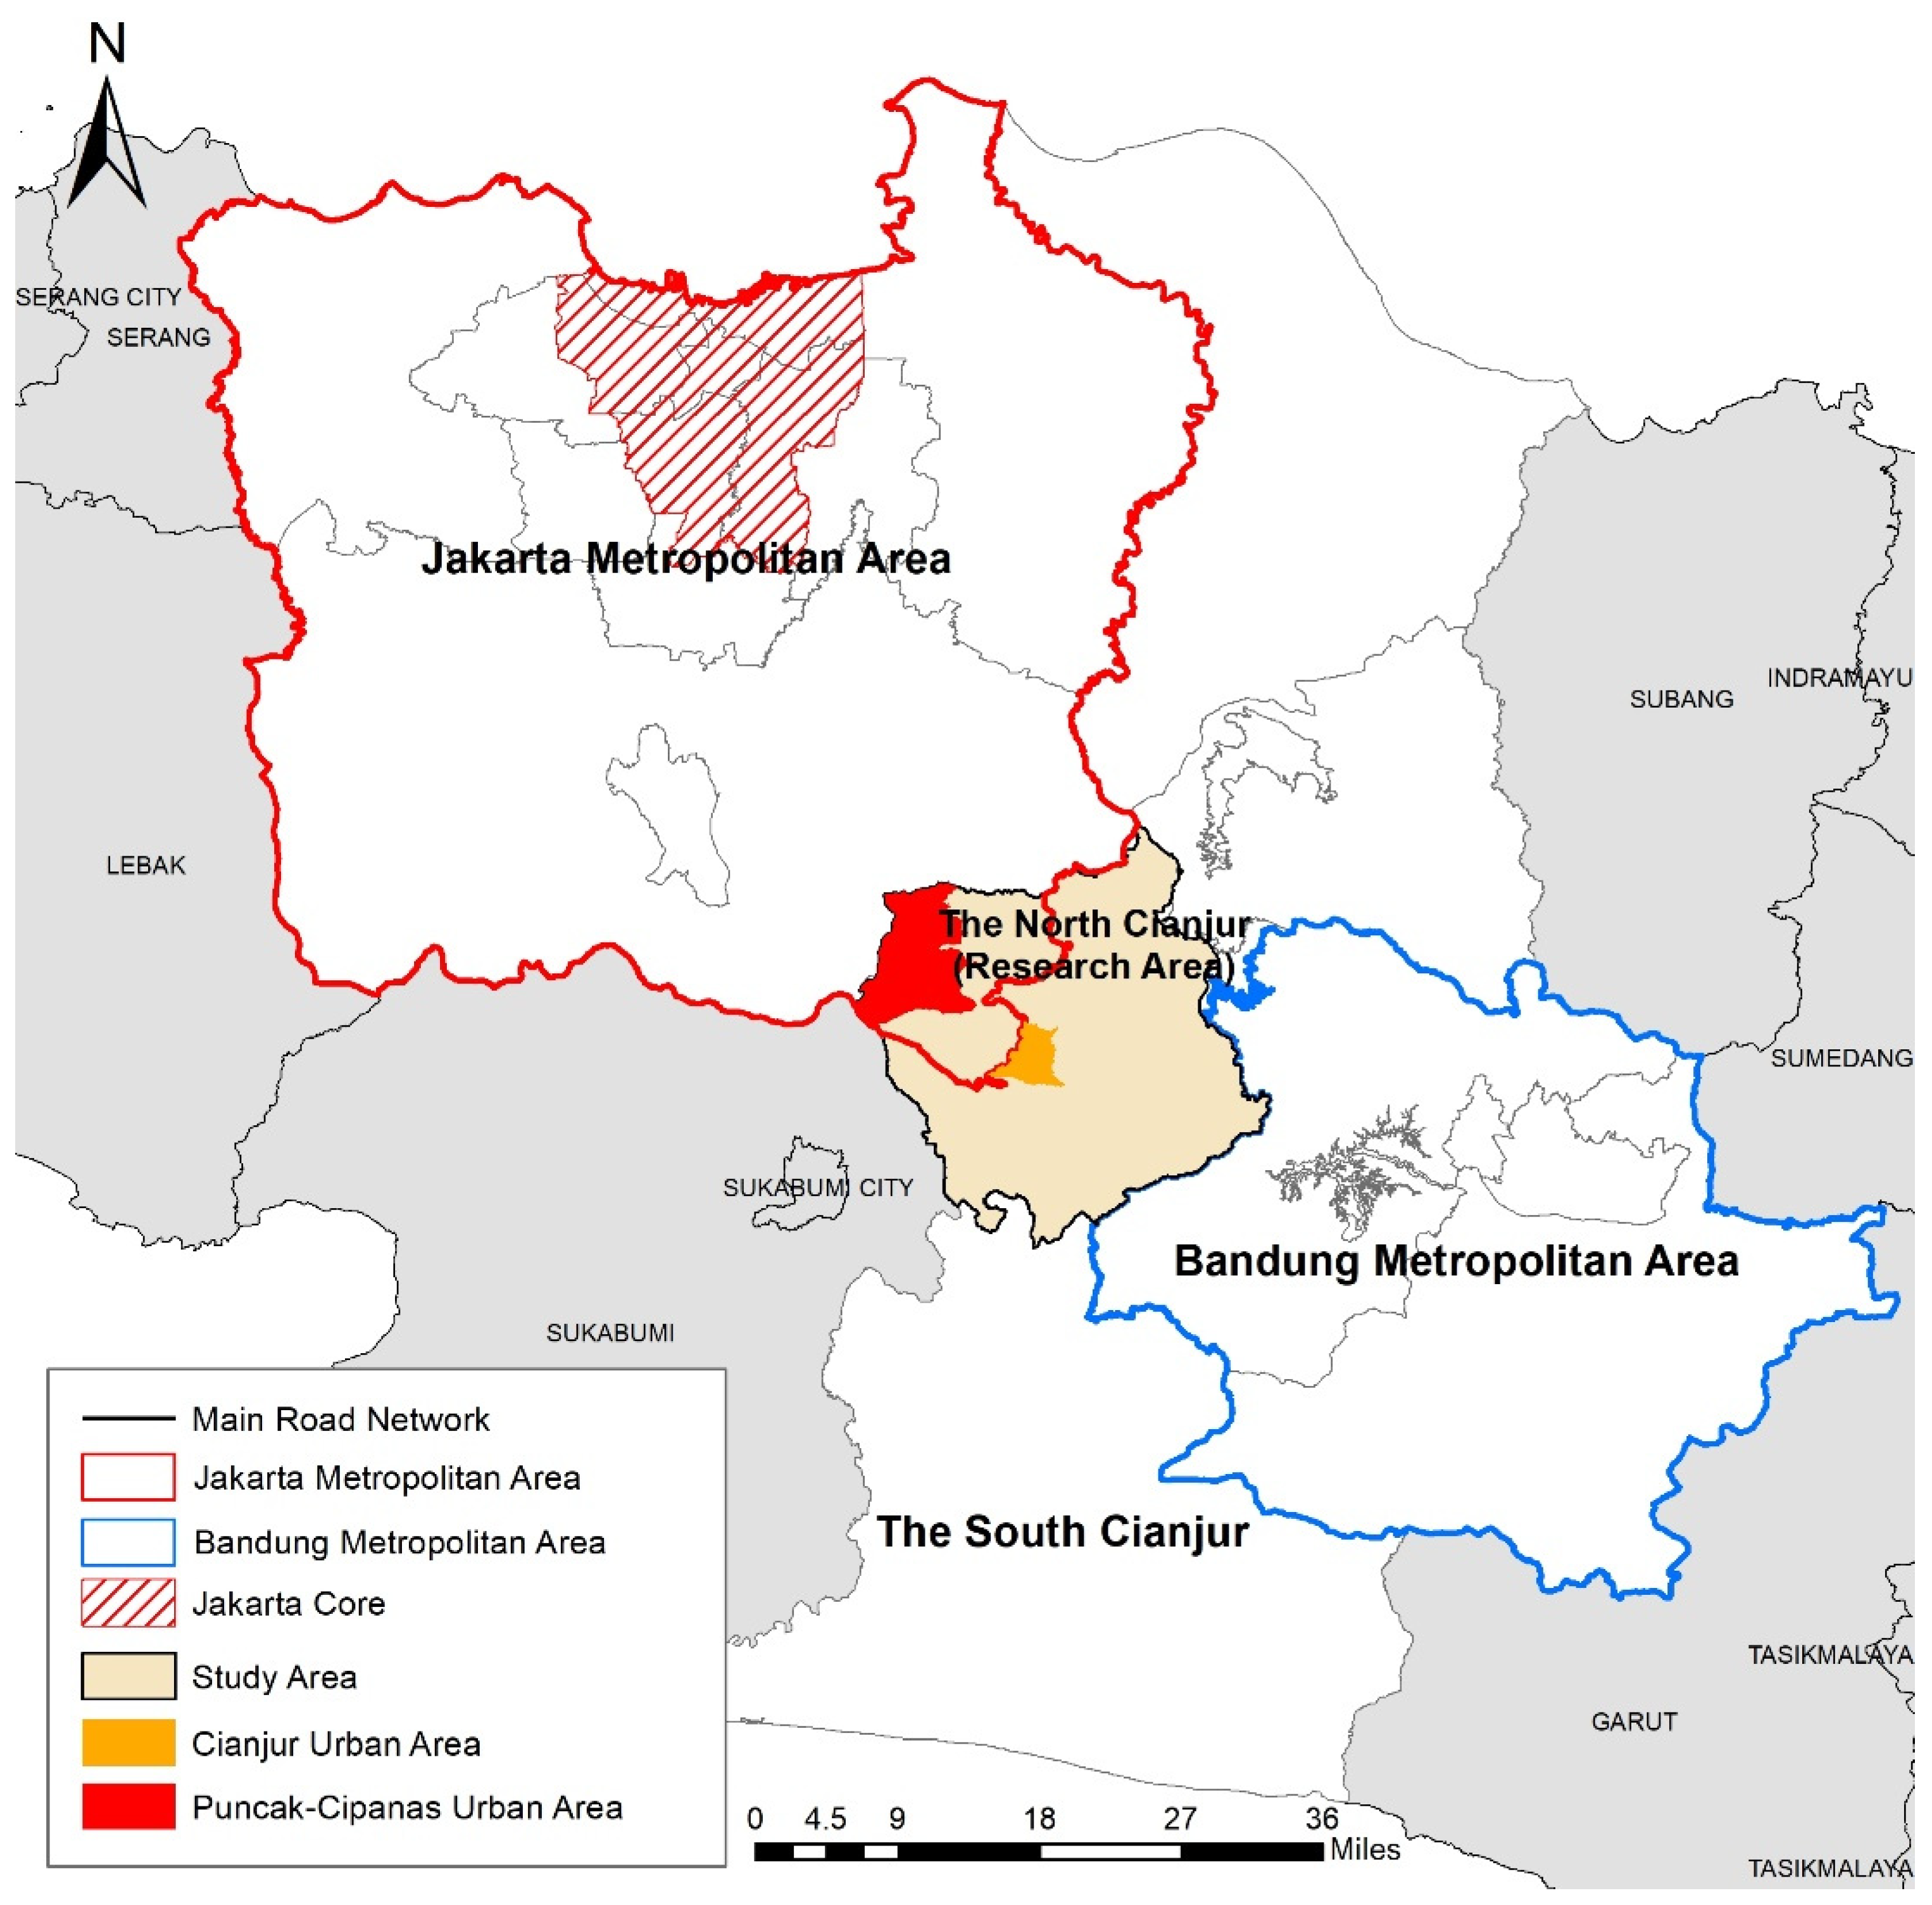
2.1. Study Area
2.2. Data
2.3. Methods
2.3.1. Spatial Clustering
- z = standardized value
- x = variable’s original value
- μ = mean
- σ = standard deviation
2.3.2. Spatial Metric
3. Results
3.1. Land Use Changes in North Cianjur
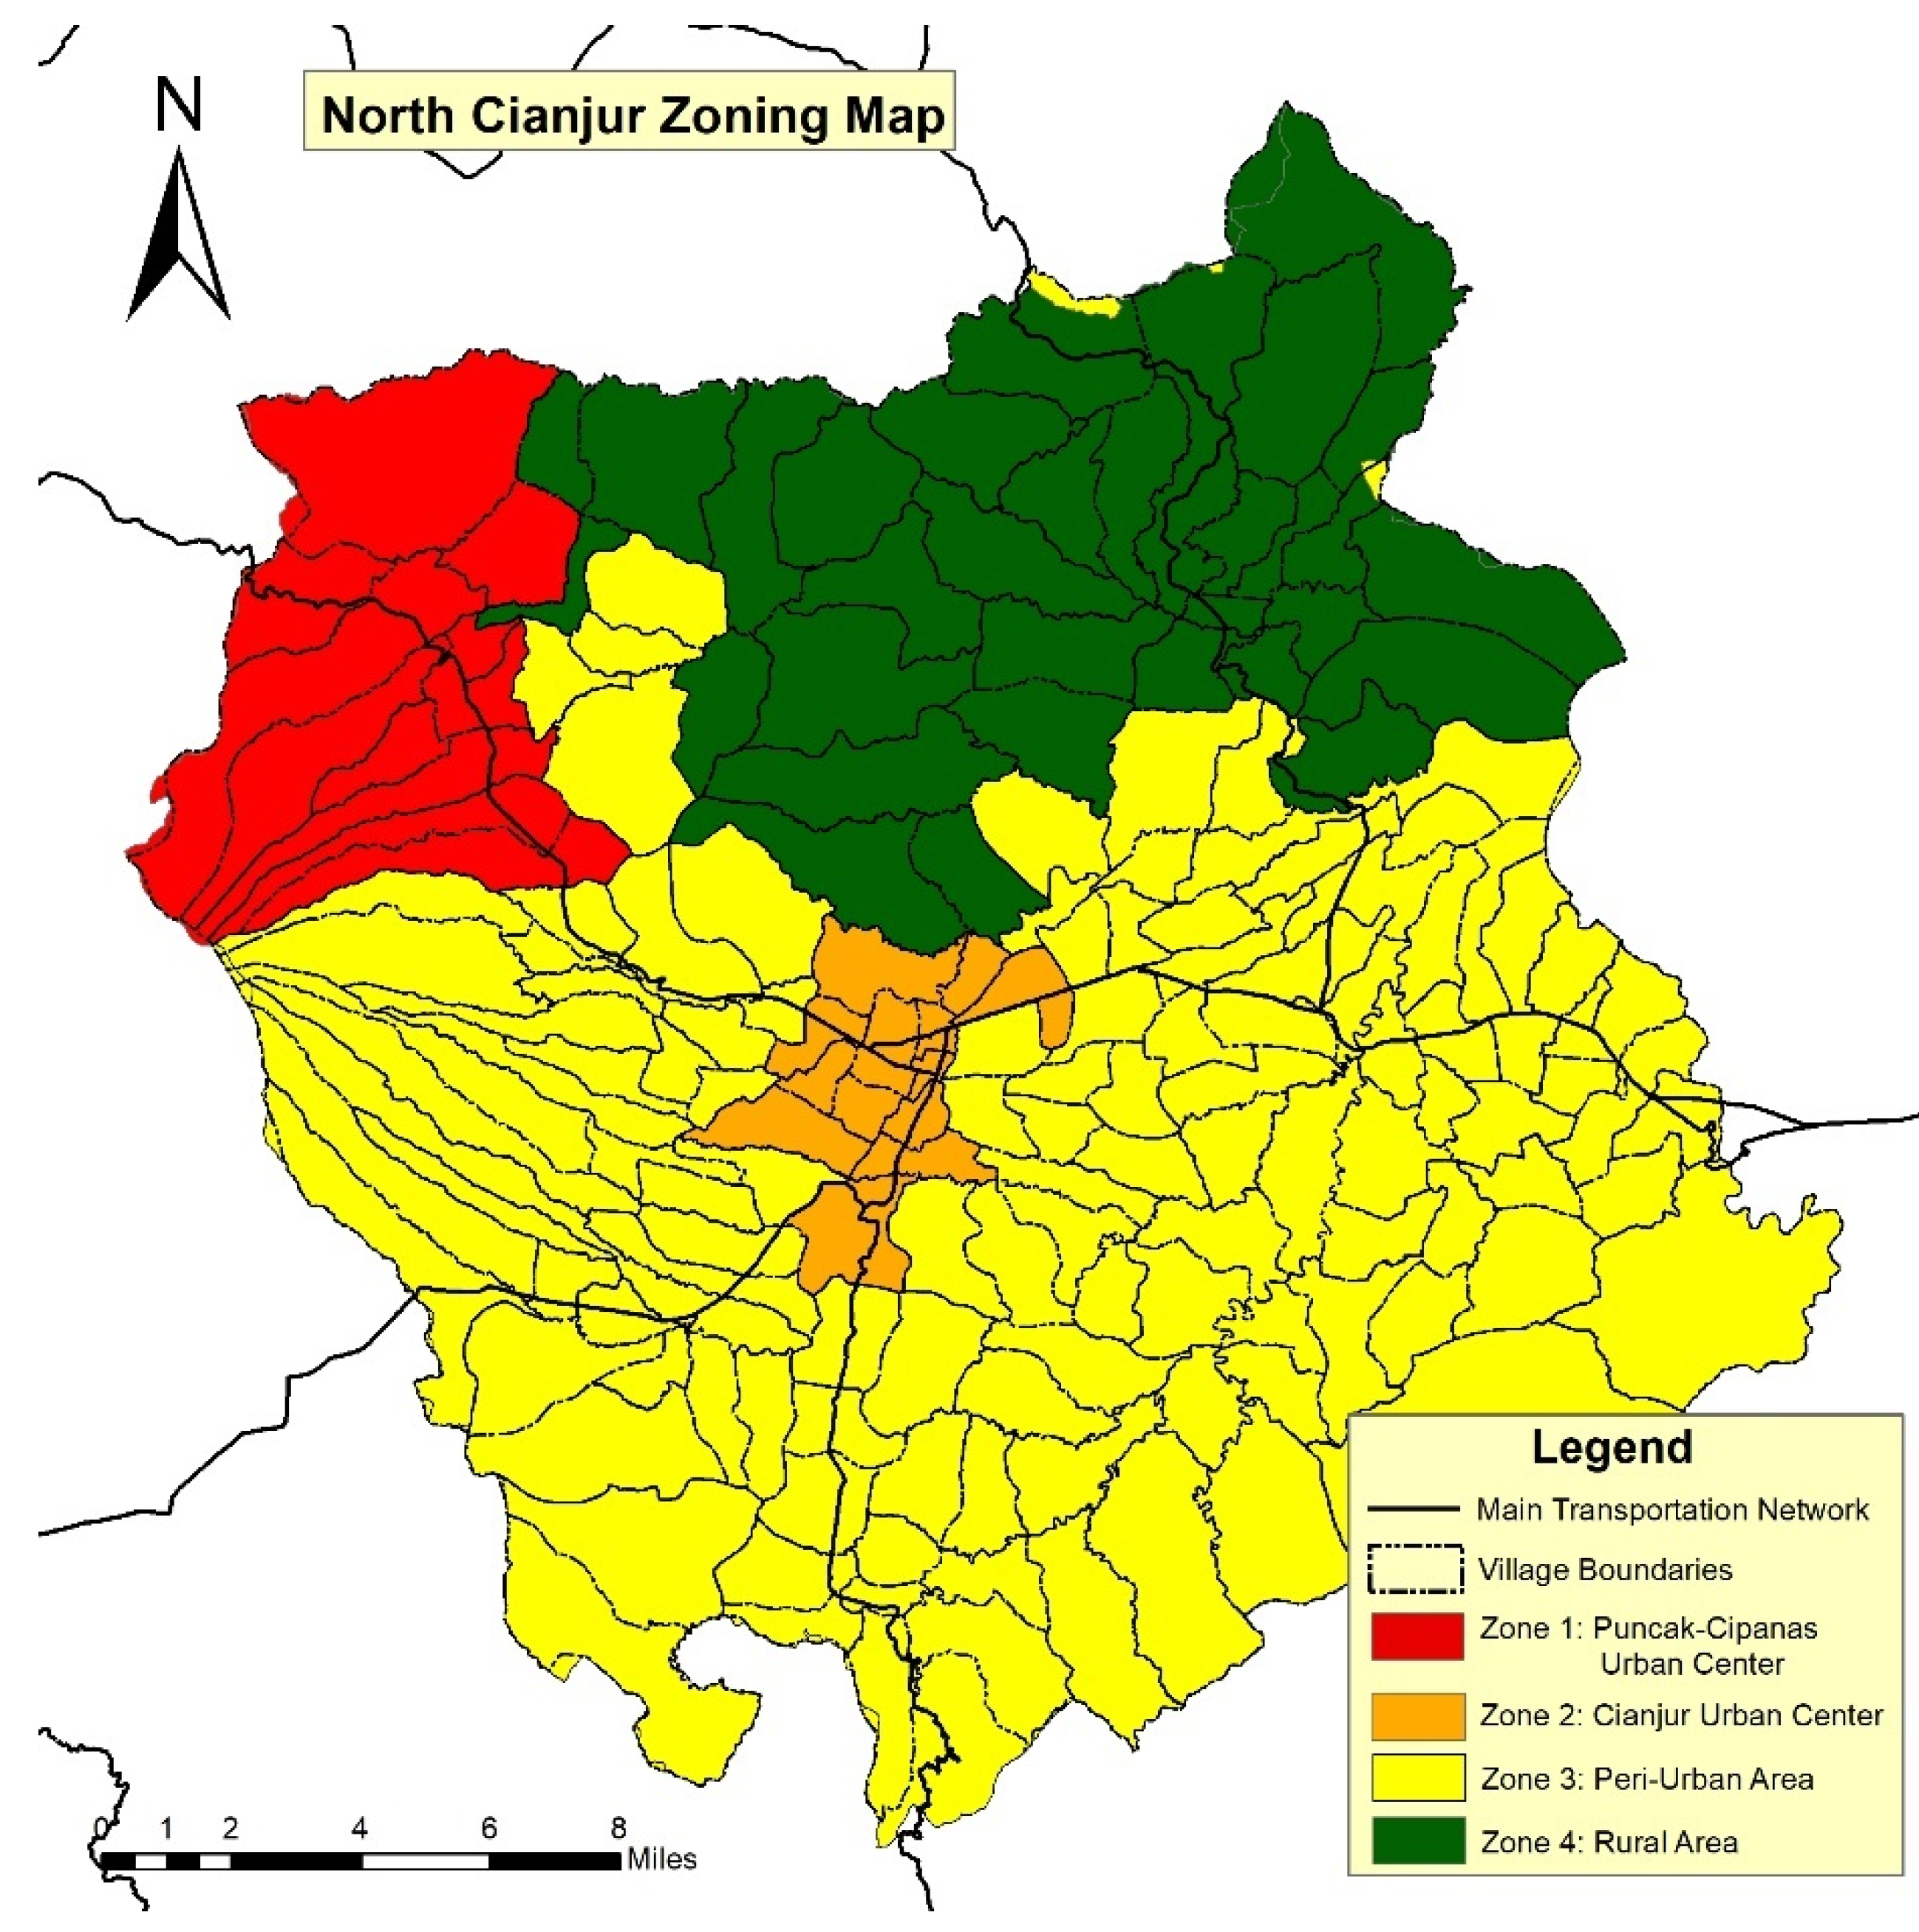
3.2. Regional Typology of North Cianjur
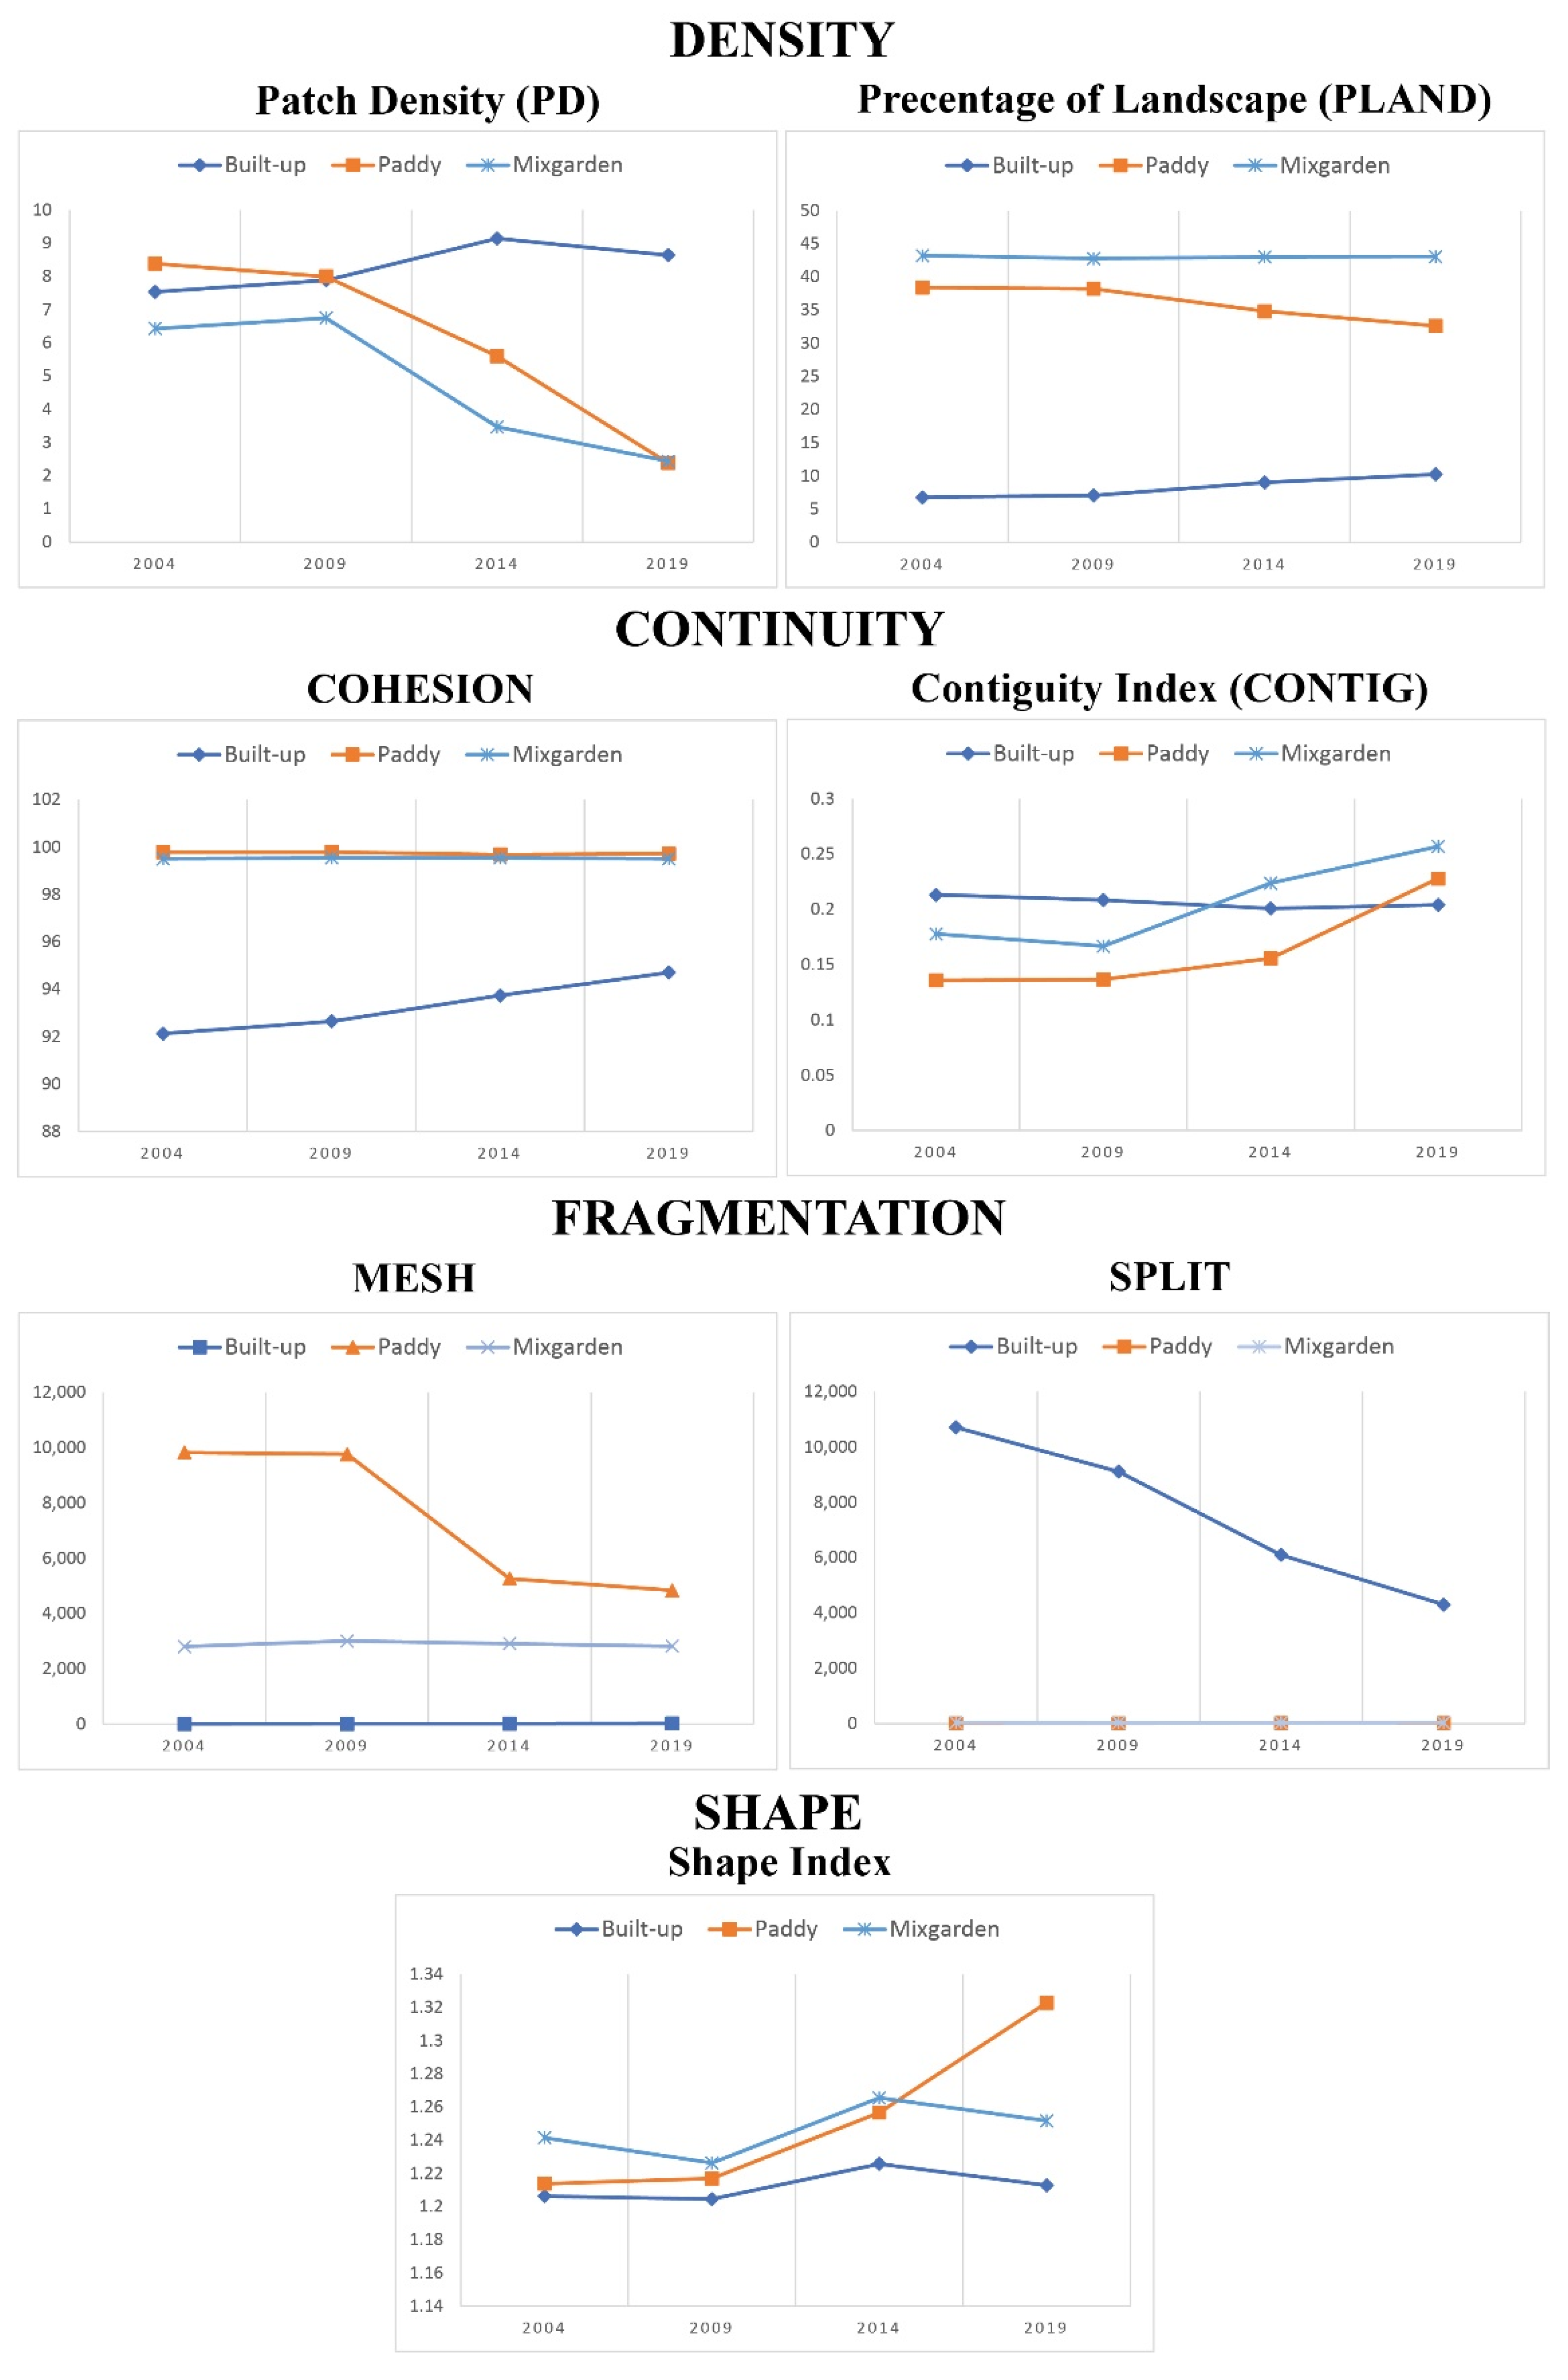
3.3. Spatial Pattern Dynamics of Land Use and Urban Form in North Cianjur
4. Discussion
4.1. Urban Expansion and Lacking of Cianjur Regency Spatial Planning Policy in Managing Urban Expansion
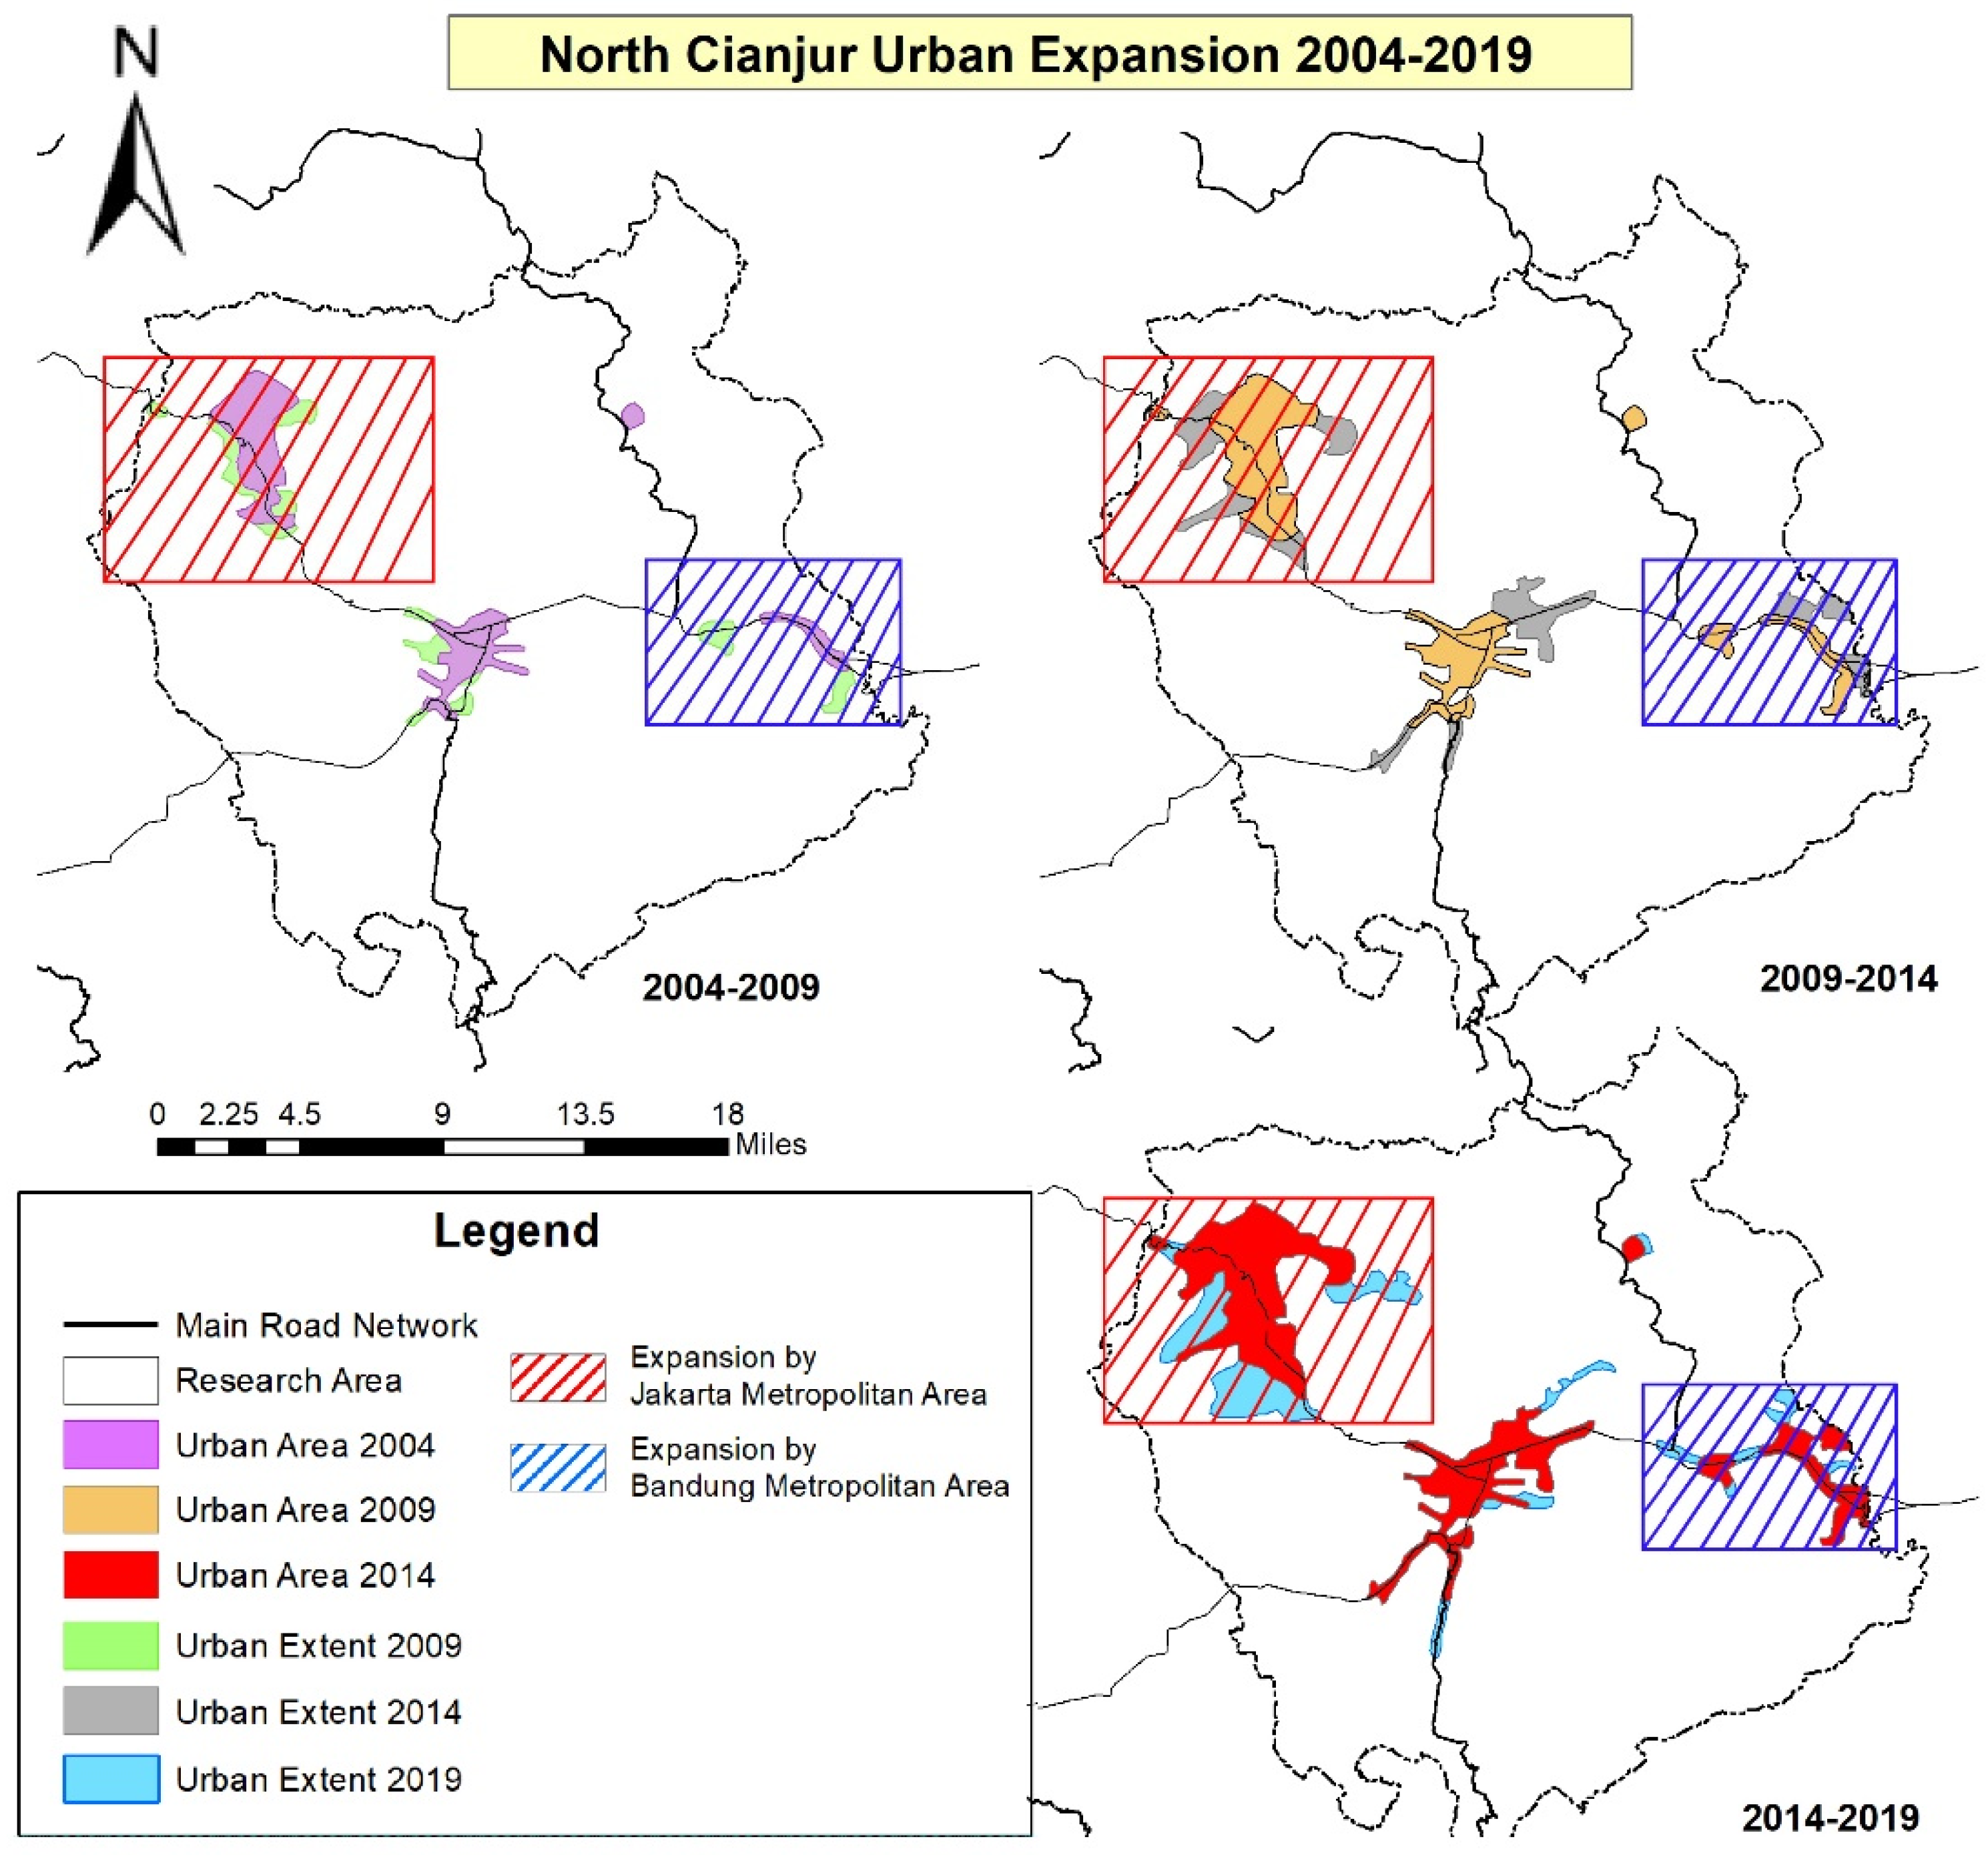
- Expansion driven by Jakarta Metropolitan AreaExpansion driven by Jakarta Metropolitan Area is the biggest driving factor of urban expansion in North Cianjur. This expansion has led to the formation of Puncak-Cipanas urban center (Z1), that previously was planned as protected and agricultural areas. After Puncak-Cipanas urban center (Z1) was formed, this expansion factor pushed urban expansion further to the east towards Cianjur urban center (Z2) in a continuous edge expansion pattern (see Figure 8 and Figure 9) that led to the connectedness of the Puncak-Cipanas (Z1) and Cianjur urban centers (Z2).
- Expansion driven by Bandung Metropolitan AreaBandung Metropolitan Area is one of the urban expansion factors in the North Cianjur region in the eastern part. This expansion comes in the form of industrialization in the eastern part of the North Cianjur, as assigned by the spatial planning policy of Cianjur regency and West Java Province (i.e., the province where Cianjur regency becomes part of it). This expansion was followed by the improvement of the transportation network and planned settlement areas in Sukaluyu and Ciranjang sub-districts. This expansion comes from eastern part of the North Cianjur and is headed towards Cianjur urban center (Z2), forming Cianjur-Bandung corridor. However, the drive for expansion is not as big as the expansion driven by Jakarta Metropolitan Area, but this followed the same pattern which is continuous edge expansion (see Figure 8 and Figure 9).
- Expansion driven by Cianjur Urban Center (Z2)Along with the regional growth, Cianjur urban center has driven urban expansion with the direction of expansion towards the south. This expansion occurs as it is supported by the existing planning instruments. This expansion follows the improvement of transportation infrastructures which is aimed at increasing connectivity as well as decreasing the disparity between northern and southern part of the Cianjur regency. This expansion comes in the form of small and dispersed built-up areas, especially unplanned settlement areas.
4.2. Insight and Addition from Quantitative Zoning Approach in Urban Expansion Management in the Suburban Areas of a Mega-Urban Region
5. Conclusions
Author Contributions
Funding
Conflicts of Interest
References
- McGee, T.; Greenberg, C. The Emergence of Extended Metropolitan Regions in ASEAN. ASEAN Econ. Bull. 1992, 9, 10–34. [Google Scholar] [CrossRef] [PubMed]
- Dorodjatoen, A.M. The Emergence of Jakarta-Bandung Mega-Urban Region and Its Future Challenges. J. Perenc. Wil. Dan Kota 2009, 20, 15–33. [Google Scholar]
- McGee, T. The Emergence of Desakota Regions in Asia: Expanding a Hypothesis. Ext. Metrop. Settl. Transit. Asia 1991, 12, 3–25. [Google Scholar]
- Rustiadi, E.; Mizuno, K.; Kobayashi, S. Measuring Spatial Pattern of the Suburbanization Process. A Study Case of Bekasi District, Indonesia. J. Rural Plan. Assoc. 1999, 18, 31–42. [Google Scholar] [CrossRef]
- Curran-Cournane, F.; Cain, T.; Greenhalgh, S. Attitudes of a Farming Community towards Urban Growth and Rural Fragmentation—An Auckland Case Study. Land Use Policy 2016, 58, 241–250. [Google Scholar] [CrossRef] [Green Version]
- Sinha, S.K. Causes of Urban Sprawl: A comparative study of Developed and Developing World Cities. Res. Rev. Int. J. Multidiscip. 2018, 3, 1–5. [Google Scholar]
- Ramachandra, T.; Bharath, H.; Vinay, S.; Joshi, N.; Kumar, N.; Venugopal, R. Modelling Urban Revolution in Greater Bangalore, India. In Proceedings of the 30th Annual In-House Symposium on Space Science and Technology, Bangalore, India, 7–8 November 2013; Space Technology Cell, Indian Institute of Science: Bangalore, India, 2013. [Google Scholar]
- Sorensen, A.; Okata, J. Megacities: Urban Form, Governance, and Sustainability; Springer: Tokyo, Japan, 2011. [Google Scholar]
- Yokohari, M.; Takeuchi, K.; Watanabe, T.; Yokota, S. Beyond greenbelts and zoning: A new planning concept for the environment of Asian mega-cities. Landsc. Urban Plan. 2000, 47, 159–171. [Google Scholar] [CrossRef]
- Milojevic, B. Urban Development and Influential Factors on Urban form of Towns in Bosnia and Herzegovinan the Period of Socialism and Transition (Case Study of Banjaluka and Trebinje). Facta Univ. Archit. Civ. Eng. 2013, 11, 237–249. [Google Scholar] [CrossRef]
- Varkey, A.M.; Manasi, S. A Review of Peri-Urban Definitions, Land Use Changes and Challenges to Development. Urban India 2019, 39, 96–111. [Google Scholar]
- Milder, J. Sustainable Urban Form. In Sustainable Urban Environments; van Bueren, E., van Bohemen, H., Itard, L., Visscher, H., Eds.; Springer: Dordrecht, The Netherland, 2011. [Google Scholar]
- Rustiadi, E.; Kobayashi, S. Contiguous Spatial Classification: A New Approach on Quantitative Zoning Method. J. Geogr. Educ. 2000, 43, 122–136. [Google Scholar]
- Sabatini, M.C.; Verdiel, A.; Rodriguez, R.M.; Vidal, I.M. A Quantitative Method for Zoning of Protected Areas and its Spatial Ecological Implications. J. Environ. Manag. 2007, 83, 198–206. [Google Scholar] [CrossRef] [PubMed]
- Firman, T. The continuity and change in mega-urbanization in Indonesia: A Survey of Jakarta–Bandung Region (JBR) development. Habitat Int. 2009, 33, 327–339. [Google Scholar] [CrossRef]
- Winarso, H.; Hudalah, D.; Firman, T. Peri-urban transformation in the Jakarta metropolitan area. Habitat Int. 2015, 49, 221–229. [Google Scholar] [CrossRef]
- Fitriani, R. The Extent of Sparwl in the Fringe of Jakarta Metropolitan Area from the Perspective of Externalities. In Proceedings of the 55th Annlual Australian Agricultural and Resource Economics Society Conference, Melbourne, Australia, 8–11 February 2011; University of Sydney: Sydney, Australia, 2011. [Google Scholar]
- Hudalah, D.; Firman, T. Beyond Property: Industrial Estates and Post-Suburban Transformation in Jakarta Metropolitan Region. Cities 2012, 29, 40–48. [Google Scholar] [CrossRef]
- Pribadi, D.O.; Pauleit, S. Peri-Urban Agriculture in Jabodetabek Metropolitan Area and Its Relationship with the Urban Socioeconomic System. Land Use Policy 2016, 55, 265–274. [Google Scholar] [CrossRef]
- Cianjur Regency Government. Cianjur Regency Spatial Planning 2011–2031; Cianjur Regency Development Planning Agency: Cianjur, Indonesia, 2012.
- West Java Government. West Java Spatial Planning 2009–2029; West Java Development Planning Agency: Bandung, Indonesia, 2010.
- Douglass, M. Mega-Urban Regions and World City Formation: Globalisation, the Economic Crisis and Urban Policy Issues in Pacific Asia. Urban Stud. 2000, 37, 231–245. [Google Scholar] [CrossRef]
- Marinescu, I.E.; Ayram, S. Evaluation of Urban Fragmentation in Craiova City, Romania. Landsc. Environ. Eur. Identity 2012, 14, 207–215. [Google Scholar] [CrossRef] [Green Version]
- Bharath, H.; Chandan, M.; Vinay, S.; Ramachandra, T. Modelling Urban Dynamics in Rapidly Urbanising Indian Cities. Egypt. J. Remote Sens. Space Sci. 2018, 21, 201–210. [Google Scholar] [CrossRef]
- Bhatta, B. Analysis of Urban Growth and Sprawl from Remote Sensing Data; Springer Science & Business Media: Berlin, Germany, 2010. [Google Scholar]
- Anthony, A.F.; Offia, I.E.; Abidemi, B.R.; Kamoru, O.K.G. Urban Sustainability Concepts and Their Implications on Urban Form. Urban Reg. Plan. 2018, 3, 27–33. [Google Scholar] [CrossRef]
- Mahtta, R.; Mahendra, A.; Seto, K.C. Building up or spreading out? Typologies of urban growth across 478 cities of 1 million+. Environ. Res. Lett. 2019, 14, 124077. [Google Scholar] [CrossRef] [Green Version]
- Kin, B.; Verlinde, S.; Macharis, C. Sustainable urban freight transport in megacities in emerging markets. Sustain. Cities Soc. 2017, 32, 31–41. [Google Scholar] [CrossRef]
- Tan, M. Uneven growth of urban clusters in megaregions and its policy implications for new urbanization in China. Land Use Policy 2017, 66, 72–79. [Google Scholar] [CrossRef]
- He, D.; Sun, Z.; Gao, P. Development of Economic Integration in the Central Yangtze River Megaregion from the Perspective of Urban Network Evolution. Sustainability 2019, 11, 5401. [Google Scholar] [CrossRef] [Green Version]
- Tran, T.N.Q.; Fanny, Q.; Claude, M.; Vinh, N.Q.; Nam, L.V.; Truong, T.H. Trends of Urbanization and Suburbanization in Southeast Asia; Ho Chi Minh City General Publishing House: Ho Chi Minh, Vietnam, 2012. [Google Scholar]
- Xu, G.; Dong, T.; Cobbinah, P.B.; Jiao, L.; Sumari, N.S.; Chai, B.; Liu, Y. Urban Expansion and form Changes across African Cities with a Global Outlook: Spatiotemporal Analysis of Urban Land Densities. J. Clean. Prod. 2019, 224, 802–810. [Google Scholar] [CrossRef]
- Kim, K.J.; Choe, S.C. In Search of Sustainable Urban Form for Seoul. In Megacities: Urban Form, Governance, and Sustainability; Dalam Sorensen, A., Okata, J., Eds.; Springer: Tokyo, Japan, 2011. [Google Scholar]
- Okazawa, Y.; Murakami, N. Case Study on Managing Urban Expansion in Tokyo; World Bank Group: Tokyo, Japan, 2017. [Google Scholar]
- Perez, J.; Araldi, A.; Fusco, G.; Fuse, T. The Character of Urban Japan: Overview of Osaka-Kobe’s Cityscapes. Urban Sci. 2019, 3, 105. [Google Scholar] [CrossRef] [Green Version]
- Firman, T.; Fahmi, F.Z. The Privatization of Metropolitan Jakarta’s (Jabodetabek) Urban Fringes: The Early Stages of “Post-Suburbanization” in Indonesia. J. Am. Plan. Assoc. 2017, 83, 68–79. [Google Scholar] [CrossRef]
- Talitha, T.; Firman, T.; Hudalah, D. Welcoming two decades of decentralization in Indonesia: A regional development perspective. Territ. Politics Gov. 2019, 7, 1–19. [Google Scholar] [CrossRef]
- Cianjur Regency Statistical Bureau. Cianjur Regency in Figures 2020; Cianjur Regency Statistical Bureau: Cianjur, Indonesia, 2020.
- Silva, E.A.; Acheampong, R.A. Developing an Inventory and Typology of Land-Use Planning Systems and Policy Instruments in OECD Countries. OECD Environ. Work. Pap. 2015, 94, 1–52. [Google Scholar]
- Starikova, T.V. The regional typology development in the system of strategic planning. J. Ind. Econ. 2017, 10, 172–180. [Google Scholar] [CrossRef]
- Housley, J.L. Megacity Analysis: A Clustering Approach to Classification. Master’s Thesis, Naval Postgraduate School, Monterey, CA, USA, 2017. [Google Scholar]
- Fang, C.; Yu, D. Urban agglomeration: An evolving concept of an emerging phenomenon. Landsc. Urban Plan. 2017, 162, 126–136. [Google Scholar] [CrossRef]
- Rodrigue, J.P. Freight, Gateways and Mega-Urban Regions: The Logistical Integration of the Bostwash Corridor. Tijdschr. Econ. Soc. Geogr. 2004, 95, 147–161. [Google Scholar] [CrossRef]
- Tan, P.N.; Steinbach, M.; Karpatne, A.; Kumar, V. Introduction to Data Mining; Pearson: Dearborn, MI, USA, 2013. [Google Scholar]
- Mulyana, W. Rural-Urban Linkages: Indonesia Case Study. In Working Paper Series RIMISP Document No. 126 Working Group: Development with Territorial Cohesion; Rimisp: Santiago, Chile, 2014. [Google Scholar]
- Budiyantini, Y.; Pratiwi, V. Peri-urban typology of Bandung Metropolitan Area. Procedia Soc. Behav. Sci. 2016, 227, 833–837. [Google Scholar] [CrossRef] [Green Version]
- McGarigal, K.; Marks, B.J. FRAGSTATS: Spatial Pattern Analysis Program for Quantifying Landscape Structure; United States Department of Agriculture: Corvalis, OR, USA, 1995.
- Gustafson, E.J. Quantifying Landscape Spatial Pattern: What Is the State of the Art. Us For. Serv. 1998, 1, 143–156. [Google Scholar] [CrossRef]
- Debbage, N.A. Quantifying Urban Form via Spatial Metrics and Its Climatic Implication; The University of Georgia: Athens, GA, USA, 2012. [Google Scholar]
- Brody, S.D.; Kim, H.; Gunn, J. The Effect of Urban Form on Flood Damage along the Gulf of Mexico Coast. J. Am. Plan. Assoc. 2013, 5, 289–306. [Google Scholar]
- Magidi, J.; Ahmed, F. Assessing Urban Sprawl Using Remote Sensing and Landscape Metrics: A Case Study of City of Tshwane, South Africa. Egypt. J. Remote Sens. Space Sci. 2018, 21, 241–253. [Google Scholar]
- Dempsey, N.; Brown, C.; Raman, S.; Porta, S.; Jenks, M.; Jones, C.; Bramley, G. Elements of Urban Forms. In Dimensions of the Sustainable Cities; Dalam Jenks, M., Jones, C., Eds.; Springer: London, UK, 2010; pp. 21–51. [Google Scholar]
- Xu, Q.; Zheng, X.; Zhang, C. Quantitative Analysis of the Determinants Influencing Urban Expansion: A Case Study in Beijing, China. Sustainability 2018, 10, 1630. [Google Scholar] [CrossRef] [Green Version]
- Wheeler, S. Regions, Megaregions, and Sustainability. Reg. Stud. 2009, 43, 863–876. [Google Scholar] [CrossRef]
- Wheeler, S.M. The Evolution of Urban Form in Portland and Toronto: Implications for sustainability planning. Local Environ. Int. J. Justice Sustain. 2010, 8, 317–336. [Google Scholar] [CrossRef]
- Schneider, A.; Woodcock, C.E. Compact, Dispersed, Fragmented, Extensive? A Comparison of Urban Growth in Twenty-five Global Cities Using Remotely Sensed Data, Pattern Metrics and Census Information. Urban Stud. 2008, 45, 659–692. [Google Scholar] [CrossRef]
- Mukhopadhyay, C. Megaregions: Globalization’s New Urban Form? Eur. Plan. Stud. 2016, 24, 420–422. [Google Scholar] [CrossRef]
- Rodrigue, J.P.; Comtois, C.; Slack, B. The Geography of Transport System, 3rd ed.; Routledge: New York, NY, USA, 2013. [Google Scholar]
- Lowry, J.H.; Lowry, M.B. Comparing spatial metrics that quantify urban form. Comput. Environ. Urban Syst. 2014, 44, 59–67. [Google Scholar] [CrossRef]
- Clarke, K.C.; Gaydos, L.J. Loose-coupling a cellular automaton model and GIS: Long-term urban growth prediction for San Francisco and Washington/Baltimore. Int. J. Geogr. Inf. Sci. 1998, 12, 699–714. [Google Scholar] [CrossRef] [PubMed] [Green Version]
- Forman, R.T. Land Mosaics: The Ecology of Landscapes and Regions; Cambridge University Press: Cambridge, UK, 1995. [Google Scholar]
- Echenique, M.H.; Hargreaves, A.J.; Mitchell, G.; Namdeo, A. Growing Cities Sustainably. J. Am. Plan. Assoc. 2012, 78, 121–137. [Google Scholar] [CrossRef]
- Kawakami, M.; Shen, Z.; Pai, J.T.; Gao, X.S.; Zhang, M. Spatial Planning and Sustainable Development: Approaches for Achieving Sustainable Urban Form in Asian Cities; Springer: New York, NY, USA, 2013. [Google Scholar]
- Liu, Y.; Peter, H.; Song, X. Research on the relationship between urban form and urban smog in China. Environ. Plan. B Urban Anal. City Sci. 2017, 44, 328–342. [Google Scholar] [CrossRef]
- Dandekar, H.C. Qualitative Methods in Planning Research and Practice. J. Arch. Plan. Res. 2005, 22, 129–137. [Google Scholar]
- Coman, A.; Munoz-Avila, H. Qualitative vs. Quantitative Plan Diversity in Case-Based Planning. In Integration of Sequence Learning and CBR for Complex Equipment Failure Prediction; Compta, M., Lopez, B., Eds.; Springer: Girona, Spain, 2011. [Google Scholar]
- Groff, S.P.; Rau, S. China’s City Clusters: Pioneering Future Mega-Urban Governance. Am. Aff. 2019, 3, 134–150. [Google Scholar]
- Bathelt, H.; Zhao, J. Conceptualizing multiple clusters in mega-city regions: The case of the biomedical industry in Beijing. Geoforum 2016, 75, 186–198. [Google Scholar] [CrossRef]
- Fu, Y.; Zhang, X. Mega urban agglomeration in the transformation era: Evolving theories, research typologies and governance. Cities 2020, 105, 102813. [Google Scholar] [CrossRef]
- International Transport Forum (ITF). Connectivity and City Clusters; OECD Publishing: Paris, France, 2018. [Google Scholar]
- Aguilar, A.G.; Ward, P. Globalization, Regional Development, and Mega-City Expansion in Latin America: Analyzing Mexico City’s Peri-Urban Hinterland. Cities 2003, 20, 3–21. [Google Scholar] [CrossRef]
- Sassi, E.; Benabdelhafid, A.; Hammami, S. A Methodological Approach of a Hinterland Planning Project Decision Support. Int. J. Traffic Transp. Eng. 2019, 8, 59–71. [Google Scholar]


| Indicator | Metric | Formula | Description |
|---|---|---|---|
| Density |
|
| |
| Continuity |
|
| |
| Clustering |
|
| |
| Shape |
|
|
| Land-Use Class | Total Area (Ha) | |||
|---|---|---|---|---|
| 2004 | 2009 | 2014 | 2019 | |
| Built-up | 6109.21 | 7274.66 | 9775.89 | 14,114.1 |
| Paddy | 40,803.08 | 40,171.09 | 38,684.08 | 35,309.25 |
| Mixgarden | 46,559.59 | 46,272.78 | 45,617.08 | 45,594.8 |
| Dryland | 6759.59 | 6672.78 | 6533.24 | 6150.15 |
| Forest | 6095.79 | 5935.95 | 5716.97 | 5158.96 |
| Water | 1886.49 | 1886.49 | 1886.49 | 1886.49 |
| Total | 108,213.8 | 108,213.8 | 108,213.8 | 108,213.8 |
| Variables | Definition | Urban | Peri-Urban | Rural |
|---|---|---|---|---|
| z1 | Population Density (person/ha) | High | Mid | Low |
| z2 | Village Facilities Index | High | Low | Mid |
| z3 | Built-Up Area (ha) | High | Mid | Low |
| z4 | Agriculture Area (ha) | Low | High | Mid |
| z5 | Farmer Household Percentage (%) | Low | Mid | High |
| z6 | Non-Farmer Household Percentage (%) | High | Mid | Low |
| z7 | Distance to the Main Transportation Network (km) | Low | Mid | High |
| z8 | Total Public Facilities (unit) | High | Mid | Low |
| z9 | Numbers of Households Below Poverty Line (Household) | High | Mid | Low |
| z10 | Numbers of Households Above Poverty Line (Household) | High | Mid | Low |
| Urban Form Indicators | The Trend of Urban Form Changes | ||||
|---|---|---|---|---|---|
| All | Z1 | Z2 | Z3 | Z4 | |
| Density | ↑↑ | ↑↑ | ↑ | ↑↑ | ↑ |
| Continuity | ↑ | ↑ | ↑↑ | ↑ | ↓↓ |
| Shape | ↑ | ↑ | ↓ | ↑ | ↑ |
| Fragmentation | ↓↓ | ↓ | ↓↓ | ↑↑ | ↑ |
© 2020 by the authors. Licensee MDPI, Basel, Switzerland. This article is an open access article distributed under the terms and conditions of the Creative Commons Attribution (CC BY) license (http://creativecommons.org/licenses/by/4.0/).
Share and Cite
Jatayu, A.; Rustiadi, E.; Pribadi, D.O. A Quantitative Approach to Characterizing the Changes and Managing Urban Form for Sustaining the Suburb of a Mega-Urban Region: The Case of North Cianjur. Sustainability 2020, 12, 8085. https://doi.org/10.3390/su12198085
Jatayu A, Rustiadi E, Pribadi DO. A Quantitative Approach to Characterizing the Changes and Managing Urban Form for Sustaining the Suburb of a Mega-Urban Region: The Case of North Cianjur. Sustainability. 2020; 12(19):8085. https://doi.org/10.3390/su12198085
Chicago/Turabian StyleJatayu, Anoraga, Ernan Rustiadi, and Didit Okta Pribadi. 2020. "A Quantitative Approach to Characterizing the Changes and Managing Urban Form for Sustaining the Suburb of a Mega-Urban Region: The Case of North Cianjur" Sustainability 12, no. 19: 8085. https://doi.org/10.3390/su12198085