Article

Durability of Mortar Containing Coal Bottom Ash as a Partial Cementitious Resource

by
Nafissatou Savadogo
1,*,
Adamah Messan
1,
Kinda Hannawi
2,
William Prince Agbodjan
2 and
François Tsobnang
1
1
Institut International d’Ingénierie de l’Eau et de l’Environnement (2iE), Laboratoire Eco-Matériaux et Habitat Durable (LEMHaD), Rue de la Science, Ouagadougou 01, Burkina Faso
2
Institut National des Sciences Appliquées de Rennes (INSA), Laboratoire Génie Civil et Génie Mécanique (LGCGM), 35000 Rennes, France.
*
Author to whom correspondence should be addressed.
Sustainability 2020, 12(19), 8089; https://doi.org/10.3390/su12198089
Submission received: 8 September 2020 / Revised: 26 September 2020 / Accepted: 28 September 2020 / Published: 30 September 2020
(This article belongs to the Special Issue Sustainable Materials for Construction)

Abstract

:
This research work focuses on the study of the durability of composite cements based on coal bottom ash powder produced by SONICHAR in Niger. After a physicochemical and environmental characterization of the coal bottom ash powder, mortar test specimens were made. In these specimens, 10%, 15% and 20% of cement were replaced by identical mass percentages of coal bottom ash powder. Durability studies focused on the determination of the chloride ions apparent diffusion coefficient, the measurement of the depth of carbonation and the accelerated ammonium nitrate leaching. The influence of carbonation and leaching were examined using the following parameters: pore distribution, gas permeability, porosity accessible to water, capillary absorption and electrical resistivity. The results show that the incorporation of coal bottom ash powder into CEM I leads to an increase in the depth of carbonation. This increase is more significant when the substitution rate exceeds 10%. In the leaching test, the partial substitution of coal bottom ash powder in CEM I up to 20% does not significantly affect the durability parameters of the composites compared to the control mortar. Diffusion test shows that for mortars containing less than 15% substitution, there is no significant influence on the chloride diffusion coefficient. A slight decrease is observed for mortar containing 20% substitution.

1. Introduction

On the one hand, Portland Artificial Cement (CEM I) has for many years been the most widely used building material in the world. Its production is very energy-intensive and emits a significant amount of carbon dioxide (CO2). Indeed, CO2 emissions from the cement industry have been estimated to account for nearly 5–7% of global emissions, with 0.9 tons of CO2 emitted into the atmosphere to produce one ton of cement [1].
On the other hand, the vast majority of developing countries and in particular those in sub-Saharan Africa show the highest demographic trends. Consequently, there is a great need for housing and construction, which encourages the establishment of new cement plants in Africa. Burkina Faso has seen the creation of three (03) new cement plants on its territory in the year 2015 alone.
It is in this context that we look at the study of the use of an industrial byproduct, with pozzolanic characteristics, in the production of cement. It is coal bottom ash, which is a residue of coal combustion from the Société Nigérienne de Charbon (SONICHAR). In fact, SONICHAR, through its energy production activity based on coal extracted in TEFEREYE, rejects in nature more than 150,000 tons of coal bottom ash every year and is nowadays invaded by more than six (06) million tons of coal bottom ash.
One of the solutions to reduce the negative impact of the cement industry on the environment is indeed to partially substitute clinker in Portland cement with pozzolanic materials to produce eco-cement. These pozzolanic materials are either natural materials such as natural pozzolan [2], heat-treated materials such as metakaolin [3] or industrial byproducts such as silica fume and fly ash [4,5] and coal bottom ash [6,7].
However, the first studies on mineral additions in Portland cement focused on the pozzolanic effect [6], the optimization of the substitution rate [7,8] and the impact of mineral additions on the physicomechanical properties of fresh and hardened concrete [9,10]. An analysis of the reactivity of Tefereyre’s coal bottom ash powder showed that it has a slow reactivity that only starts after 14 days of curing [11] and similar observations have been made by Cheriaf et al. [6]. This low reactivity leads to a drop in the compressive strength of the mortars at 28 days of curing with an optimal substitution rate of 15% [12]. However, after 90 days of curing, mortars containing bottom ash powder practically show the same strength as a control mortar containing 0% bottom ash powder [11].
In recent studies, efforts are increasingly focused on durability [13]. The latter is very important because previous work has shown a dependency of durability properties on the mineralogical composition of binders and environmental conditions. Moreover, the slow reactivity of bottom ash powder could influence the microstructure of the mortars and therefore affect their durability.
Thus, the main objective of this work is to study the resistance of mortars, containing coal bottom ash powder as a partial mass substitute to cement, in aggressive environments compared to a control mortar without addition. More specifically, it consists in analyzing the evolution of the durability factors of these mortars after tests of carbonation, ammonium nitrate leaching and diffusion of chloride ions.
Carbonation of cementitious materials results in a decrease in pore volume due to the fact that the carbonation products of portlandite (calcite, aragonite, vaterite) have larger molar volumes than portlandite [14,15,16]. However, this decrease in pore volume does not affect all pore types. It appears from the literature [17,18,19] that carbonation leads to a decrease in the volume of micropores but causes the appearance of macroporosity. With regard to pozzolanic additions, studies have shown that they lead to materials with a low portlandite content and that, as a result, a smaller amount of CO2 is sufficient to consume the entire portlandite and cause a significant drop in pH [20]. This induces greater carbonation depths than in the case of CEM I [21,22].
According to the literature, the addition of pozzolanic additions as partial substitutes for cement increases leaching depth [23] because of the low rate of portlandite that is consumed by the pozzolanic reaction.
For the diffusion of chloride ions, the literature shows that cementitious materials containing mineral additions have at long-term a lower chloride ion penetration rates than those of CEM I-based materials [24,25,26].
In this experimental study, the influence of carbonation and accelerated ammonium nitrate leaching on the physical parameters of mortars containing 10%, 15% and 20% of coal bottom ash powder as a substitute for CEM I is investigated. This study compared to a control mortar containing 100% of CEM I focuses on poral distribution, gas permeability, water accessible porosity, capillary absorption and electrical resistivity. In addition, the evolution of the apparent diffusion of chloride ions with the rate of bottom ash powder compared to the control mortar is analyzed.

2. Materials and Methods

2.1. Mixtures Proportion

The cement used for this study is a CIMTOGO CEM I 42.5 according to EN 197-1, whose granular distribution is given in Figure 1. Its physical characteristics are summarized in Table 1. Its setting time is about 170 min.
The coal bottom ash comes from the combustion of a coal mined at Tefereyre in Niger. It is presented in granular form with a grain size corresponding to sandy gravel with grain diameters between 20 mm and 75 µm. In order to use it as a mineral addition, the Tefereyre coal bottom ash is ground with a ball mill in order to obtain the 80 micron sieve pass.
A laser particle size analysis of the powder obtained gives the particle size distribution shown in Figure 1. It can be noted that the bottom ash powder has a coarser particle size than Portland cement Table 1. The bottom ash powder used has a specific gravity of 2.31 t/m3 and a bulk density of 0.77 t/m3. The BET and Blaine specific surfaces obtained are 3.67 m2/g and 4109 cm2/g, respectively. These high values compared to those of cement which are 1.47 m2/g and 3565 cm2/g are due to the presence of intragranular porosity at the bottom ash powder as shown in the SEM image in Figure 2.
The determination of the mineralogical composition shows that Tefereyre’s bottom ash is composed of more than 79% of silica, alumina and iron oxide. This composition shows that Tefereyre coal bottom ash corresponds to a type F fly ash according to ASTM C 618 [27]. The diffractogram in Figure 3 shows the presence of quartz minerals, mullite and hematite in the coal bottom ash and a halo centered around 2 theta equal to 25° indicating the presence of an amorphous phase.
An environmental study carried out shows that the use of bottom ash does not represent a danger according to the Landfill Directive [28], from the point of view of the release of heavy metals into the environment.
The sand used is locally available natural sand. A particle size analysis carried out on the sand shows that it has a spread grain size because its uniformity coefficient Cu = 3 > 2 but that it is a poorly graded sand with a curvature coefficient Cc = 0.9. The sand equivalent [29] shows that the sand used is a clean sand with a low percentage of fine clayey materials, good for high quality concrete, as it gives a sight sand equivalent (SSE) of 81.12 and a piston sand equivalent (PSE) of 74.49. Its bulk density is 1.53 t/m3, its specific density is 2.67 t/m3 and its fineness modulus is 2.90.

2.2. Mixtures Proportion

In this study, the various tests are carried out on cement mortars manufactured according to EN 196-1 [30]. Four formulations were studied: a control formulation based on CEM I and three study formulations prepared by carrying out a partial mass substitution of the cement by Tefereyre coal bottom ash powder. The three substitution rates studied are 10%, 15% and 20%. The mortar is made according to the mass ratios of a conventional normal mortar (sand/binder = 3, water/binder = 0.5). A superplasticizer is used at an admixture/binder ratio = 0.02 to solve the consistency problem observed with the addition of bottom ash powder in order to facilitate mortar placement. The compositions of the different formulations are shown in Table 2.
Cylindrical specimens of diameter Φ 40 mm and height H 60 mm are then made and removed from the mould 24 h later to be stored in water saturated with lime until the day of the test in a room with a temperature of 20 °C ± 2 and a relative humidity of 50% ± 5.

2.3. Test Procedures

2.3.1. Durability Parameters

The durability parameters measured in this study are pore distribution, gas permeability, water accessible porosity, capillary absorption and electrical resistivity. The measurements are made after 90 days of mortar curing to take into account the slow reactivity of the bottom ash powder. These tests were repeated after carbonation and leaching of the mortar specimens. For each parameter, the tests are carried out on three samples of each mixture. Thus, the results presented are the average of the three measured values.
The porous distribution was determined on mortar powder with a grain size of less than 100 µm. The calculation of the pore distribution in the mortar is carried out according to the BJH method [31] which estimates the size distribution of mesopores with a radius of 2–50 nm. For the nitrogen gas sorption isotherm, we used a Gemini VII 2390 isothermal analyzer. The porous distribution is calculated automatically by the program included in the analyzer.
Gas permeability is measured using a constant load permeameter and helium is used as the percolation fluid. For each sample, four (04) pressures (0.2, 0.3, 0.4 and 0.6 MPa) were carried out in order to identify intrinsic permeability using the Klinkenberg approach. The principle consists of maintaining a constant gas pressure difference between the two ends of the sample studied and measuring the resulting flow rate when steady state is established. At each maturity, the specimens are dried in an oven at 105 °C to constant mass and then cooled in a desiccator where they are stored before the measurements are started.
The porosity accessible to water displays the communicating porosity or open porosity of the material accessible to water. In this study, the test is carried out according to the AFPC-AFREM procedure [32].
Capillary absorption measures the rate of water absorption by capillary suctions from dried mortar specimens brought into contact with water without hydraulic pressure. The test is also carried out according to the AFPC-AFREM procedure [32].
Electrical resistivity is defined as the ability of a medium to oppose the passage of electricity and it is calculated according to Ohm’s law. In this study, resistivity measurements are carried out on fully saturated mortar specimens. The test consists of placing the saturated specimens between two electrodes (connected to a voltmeter and an ammeter) and allowing the current to flow.
The diffusion of chloride ions is carried out on specimens which are first saturated under vacuum using a 0.1M NaOH solution for 24 h. After saturation, the lateral surface and one of the basal surfaces are sealed with a silicone sealant. The other basal surface kept free will be in contact with the corrosive solution.
After this preparation, the specimens are partially immersed at a height of 20 mm in a solution of 0.51M NaCl and 0.1M NaOH. After 60 days, the specimens are removed from the basin and freed of the silicone layer. They are split, and on the sides obtained, the depth of penetration of the chloride ions is determined by spraying a 0.1M silver nitrate (AgNO3) solution. From the values of the depth of penetration of the ions, the apparent diffusion coefficient can be calculated according to the formula proposed by V. Baroghel-Bouny et al. [33]:
D ns dif = X d 2 4 t
where Dns(dif) is the apparent diffusion coefficient of the chloride ions in the saturated condition (m2/s), xd is the depth of penetration of the chloride ions (m) and t is the immersion time of the specimens in the solution (s).

2.3.2. Cement Material Degradation Phenomena

The study consisted of carbonation and leaching tests on 90-day-old specimens for 28 days. At the end of this period, the carbonated and leached specimens were first tested for gas permeability, water-accessible porosity, capillary absorption coefficient and electrical resistivity. The results obtained are compared with those obtained in the healthy state of the specimens before degradation.
They are then split to determine the depth of carbonation and leaching using the phenolphthalein test.
Finally, the porous distribution of the degraded zone is measured.
  • Carbonation
The carbonation test is carried out on samples dried at 105 °C to constant mass, then kept in a climatic chamber for 7 days at 20 °C, 65% relative humidity to homogenize the internal humidity. At the end of these 7 days, the two basal surfaces of the specimens are protected with silicone so as to favour the lateral diffusion of CO2 within the sample. The specimens prepared in this way are then kept for 28 days in a chamber whose temperature, relative humidity and CO2 content are regulated at 20 °C, 65% RH and 20% CO2, respectively.
  • Ammonium nitrate leaching
For this test, 90-day-old mortar specimens are immersed for 28 days in a 480 g/L (6M) ammonium nitrate solution.
A sufficiently large volume of solution is prepared to ensure that the choice of nonrenewal during the test is valid. At the start of the test, the pH of the solution is of the order of 5.8, but it increases and stabilizes rapidly around 7. The volume (Vs) of the solution is calculated on the basis of the cement content in the material, the calcium content in the cement and the volume of material to be degraded [34].
V s   =   0.048 C γ V d
with C the cement content in the mixture (kg/m3), γ the CaO content (%) in the cement and Vd the volume of material to be degraded (m3).
After 28 days, the specimens are removed from the solution and rinsed by immersion for more than two days in pure water (pure water is changed three times during this period).

3. Results and Discussion

3.1. Carbonation

3.1.1. Carbonation Depth

The values of the carbonation depth are given in Figure 4. It can be seen that the carbonation depth increases with the evolution of the rate of bottom ash powder in the cement so that the M20 mortar has completely carbonated. The results show a slight increase in gas permeability with the addition of bottom ash powder and this may be one of the causes of the high carbonation of these mortars. In addition, similar results observed in the literature with other pozzolanic additions are explained by the authors by the low portlandite content in these mortars [21,22]. Thus, the use of coal bottom ash powder at a rate of more than 10% could compromise the durability of reinforced concrete structures.

3.1.2. Poral Distribution by Nitrogen Adsorption Desorption

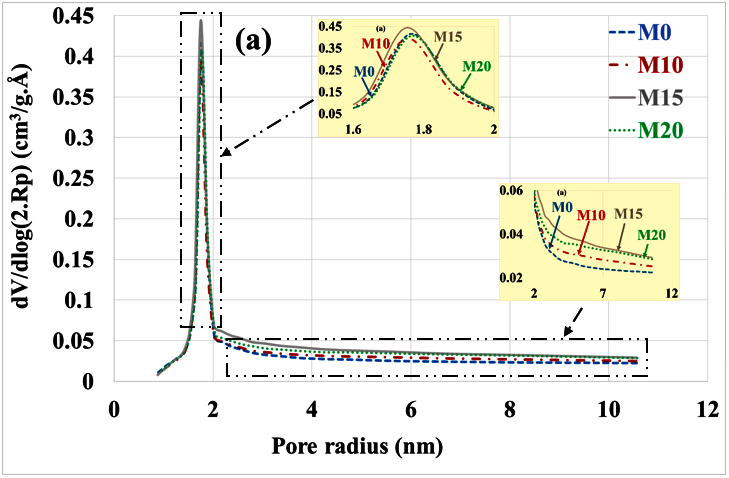
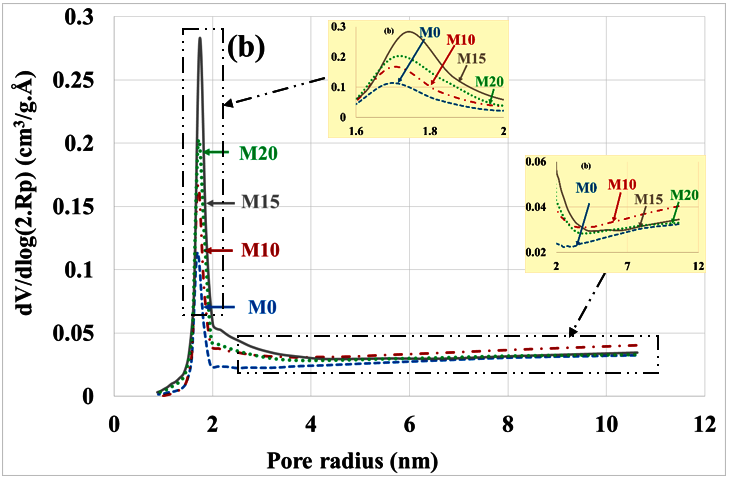
An evaluation of the pore distribution of the carbonate part of mortars compared to the healthy state is given in Figure 5a,b. In a healthy state, it can be seen that mortars containing bottom ash powder have almost the same volumes of micropores and mesopores as the control mortar. This is due to the fact that the bottom ash powder has a slow pozzolanic reactivity.
There is a decrease in the volume of micropores (radius < 2 nm) and mesopores (radius 2 to 50 nm) compared to the healthy state. This result is consistent with other findings in the scientific literature that indicate a reduction in porosity by progressive pore sealing through the formation of CaCO3 [35]. The volume of micropores is significantly higher in mortars based on bottom ash powder than in the control mortar. Since these mortars contain less portlandite, the C-S-H had to carbonate and give porous silica gels [36]. The M15 mortar having the best mechanical resistance [12] would present more carbonated C-S-H than the M10 and M20 mortars.
The means radius of the mesopores increases after the carbonation of mortars as shown in Table 3. Most authors attribute this increase in mesopore radius to the carbonation shrinkage phenomenon [17,18,19]. Others explain it by the porous structure of silica gels formed during carbonation [36].
The reduction in the volume of micropores and mesopores is more pronounced for the control mortar compared to the mortar containing coal bottom ash powder. For micropores, the reduction is 73%, 61%, 40% and 47% respectively for M0, M10, M15 and M20. For mesopores it is 28%, 14%, 16% and 26% for M0, M10, M15 and M20, respectively. This can be explained by the fact that the control mortar contains more portlandite and therefore more carbonatable hydrates than bottom ash powder mortars.

3.1.3. Gas Permeability Coefficient

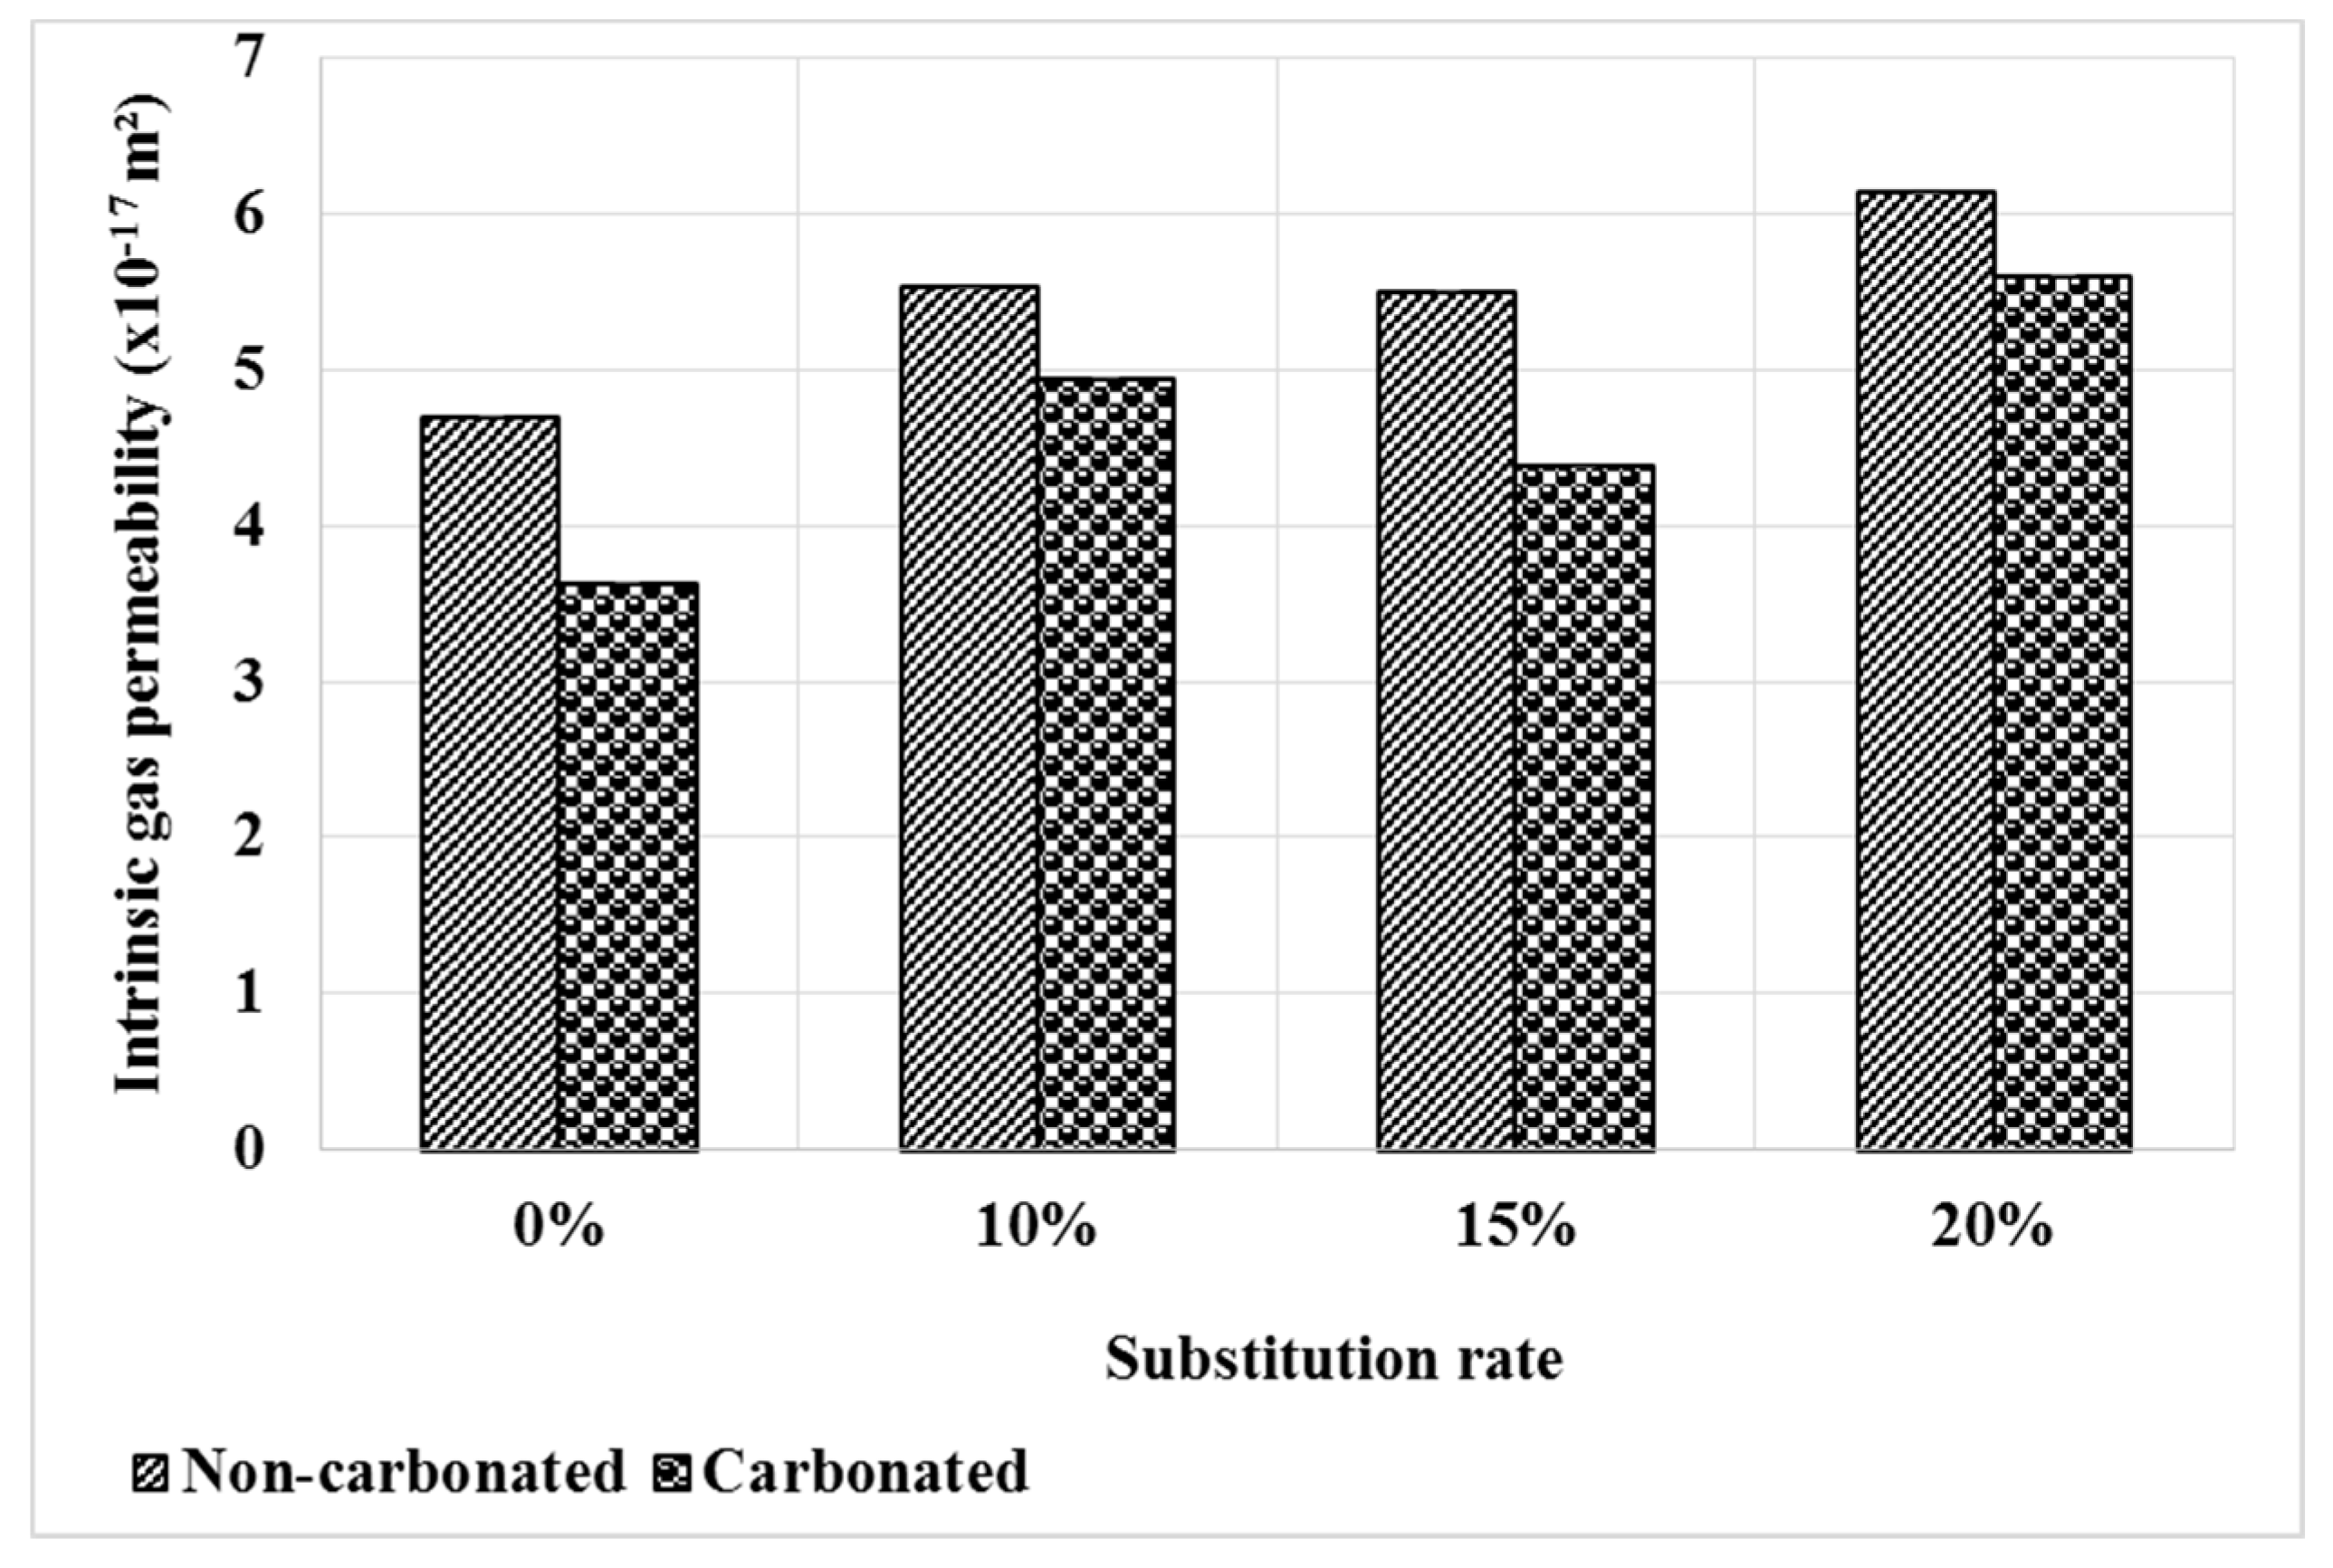
Figure 6 shows the evolution of the intrinsic permeability of mortars after carbonation compared to the healthy state. At the healthy state, mortars based on bottom ash powder have a slightly higher gas permeability and this is explained by the low reactivity of the bottom ash powder.
It can be seen that the permeability decreases after the carbonation test. This result is consistent with that of the pore distribution, which shows a decrease in pore volume with the carbonation Figure 5. The permeability decreases by 23%, 11%, 21% and 9% respectively for M0, M10, M15 and M20. This evolution can also be related to the higher content of cement carbonate hydrates in the M0 mortar.

3.1.4. Water-Accessible Porosity

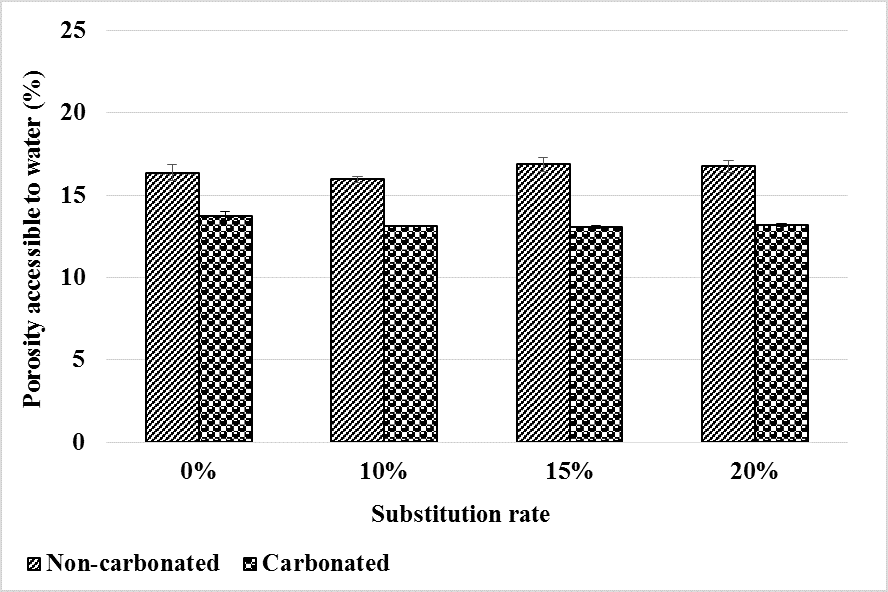
The water-accessible porosity of the mortars before and after carbonation is shown in Figure 7. Before carbonation, it is observed that the bottom ash powder does not affect the water accessible porosity of the mortars and this up to 20% substitution. This is explained by the low and slow pozzolanic reactivity of the bottom ash powder. Thus, in our previous work, we note a decrease in the porosity accessible to water after 28 days of curing of bottom ash powder mortars compared to the control mortar [11]. However, due to the pozzolanic reactivity of the bottom ash powder, it increases to equal the porosity of the control mortar after 90 days of curing.
Carbonation reduces the porosity accessible to water by filling pores with formed carbonates.
However, just as in a healthy state, the addition of bottom ash powder has little effect on water-accessible porosity after carbonation. Thus, the carbonates formed would affect the micropores and mesopores but not the pores accessible to water. Therefore, up to 20% of CEM I can be substituted by bottom ash powder without noticeable impact on the water-accessible porosity of mortars after carbonation.

3.1.5. Capillary Absorption

The results of the capillary absorption test performed on the specimens before and after carbonation are shown in Figure 8a,b. Globally, carbonate mortars have a lower absorption coefficient than noncarbonated mortars. The decrease in the absorption coefficient is much more marked for the control mortar: 79%, 64%, 65% and 45% respectively for M0, M10, M15 and M20. This is also likely related to the fact that pore filling is more efficient on the control mortar, which contains more carbonatable cement hydrates.

3.1.6. Electrical Resistivity

The electrical resistivity of mortars depends on the physical properties of the constituents, their microstructural arrangement and the composition of the interstitial liquid. In this study, the resistivity was measured on previously saturated specimens. Figure 9 shows the evolution of the electrical resistivity after carbonation compared to the healthy state of the mortars. At the healthy state, the resistivity of the mortars increases slightly with the substitution rate compared to the control mortar. As the test specimens are saturated and have almost the same porosity accessible to water, the improved resistivity of these mortars would be due to a low concentration of ions in their interstitial solution, the pozzolanic reaction having consumed part of the portlandite.
It can be seen that carbonation leads to an increase in the resistivity of mortars. This can be explained by the reduction in porosity (Figure 7) and the impoverishment of the interstitial solution in ions (Ca2+ and OH-) because the carbonates formed are less soluble than the portlandite consumed. This development is reinforced for mortars containing bottom ash powder which already contained fewer ions due to the pozzolanic reaction. The higher carbonation depths (Figure 4) in these mortars contribute to further deplete the interstitial liquid and explains the higher resistivity of these mortars compared to the control. This increase in electrical resistivity means a decrease in the corrosion potential of the armatures.

3.2. Ammonium Nitrate Leaching

3.2.1. Leaching Depth

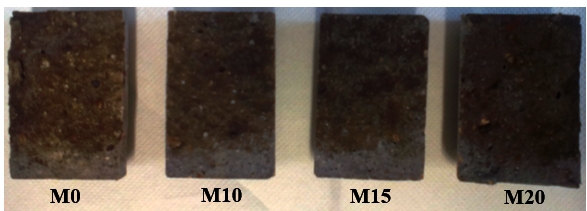
For the determination of the leaching depth, we used phenolphthalein, which is a colour indicator that turns pink-purple when the pH value is above about 9.2. The observation of the results presented in Figure 10 shows that bottom ash powder does not alter the leaching resistance of mortars. However, it can be seen that the colour of the nondegraded zone of the bottom ash powder mortars is lighter than that of the reference mortar. This difference in shade in bottom ash powder mortars could be explained by a lower pH value but still above 9.2. This is especially true since the colour becomes lighter as the bottom ash powder in the mortar increases. The drop in pH in these mortars may be due either to the pozzolanic reaction [23] or to a weak leaching of the mortars at greater depths.
We therefore believe that the thickness of the outer zone is not sufficient to reflect the depth of degradation.

3.2.2. Poral Distribution by Nitrogen Adsorption Desorption

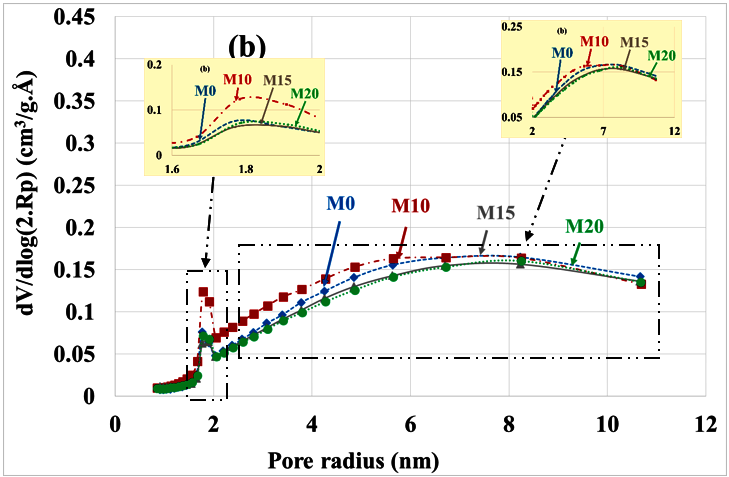
The poral distribution before and after leaching is shown in Figure 11a,b. It is clear that leaching has led to an overall increase in porosity and in particular a relative increase in the volume of mesopores at the expense of micropores. This is due to the dissolution of hydrates and therefore the partial disappearance of the microporosity of these hydrates. Other authors also observe that leaching results in increased porosity due to the dissolution of hydrates, particularly portlandite [37,38,39].
Table 4 summarizes the variations in poral volumes and radius. It can be noted: decrease in the volume of micropores (from approximately 1 cm3/g. Å to 0.26 cm3/g. Å), increase in the volume of mesopores (from roughly 0.46 cm3/g. Å to 1.5 cm3/g. Å) and increase in the mean radius of these mesopores (from roughly 3.5 nm to 4.5 nm). There is no significant difference between the different types of mortars, but the porosity of the M10 mortar is significantly higher than that of other mortars.

3.2.3. Gas Permeability Coefficient

Figure 12 shows the evolution of permeability under the effect of leaching. As expected, permeability increases after leaching for all composites. However, when bottom ash powder mortars are compared to the reference mortar, a smaller increase is observed for mortars containing bottom ash powder. This result is consistent with the evolution of the pore distribution shown in Figure 11. The pozzolanic reactivity of the bottom ash powder leads to the decrease of the portlandite rate in the mortars, thus a decrease of the leachable phases and could explain the low permeability values of the M15 and M20 mortars compared to the control [40]. However, this observation is only valid for a substitution rate higher than 10%.

3.2.4. Water-Accessible Porosity

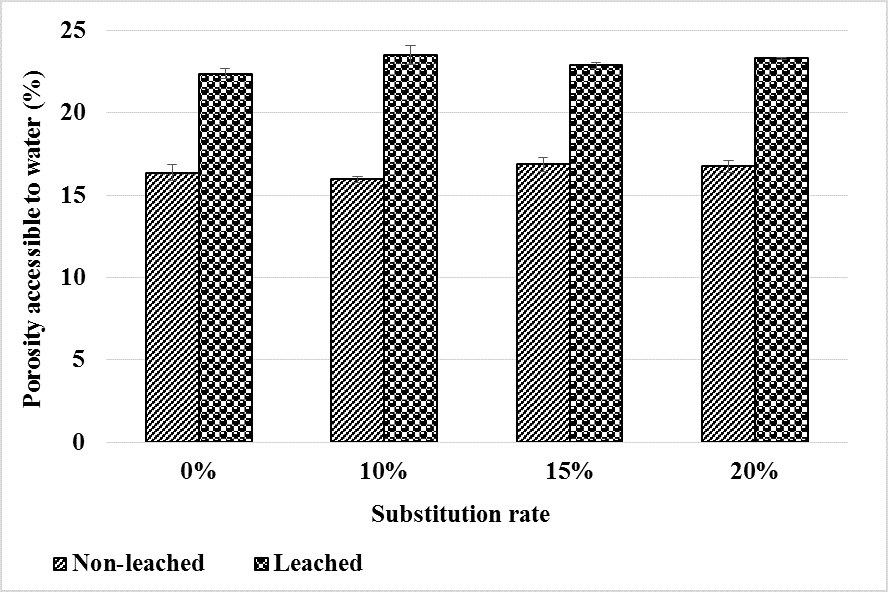
The results of the water-accessible porosity before and after leaching are shown in Figure 13. We note that porosity increases compared to the healthy state for all four types of mortar. This increase would be due to the increase in pore volume after hydrate leaching. However, bottom ash powder does not have a considerable influence on the evolution of water-accessible porosity after leaching. This means that up to 20% of the cement can be substituted by bottom ash powder without noticeable impact on the porosity of mortar water accessible after leaching.

3.2.5. Capillary Absorption

The capillary absorption coefficients were determined on the different mortars before and after leaching; the results are shown in Figure 14a,b.
After leaching, the reference mortar M0 degrades more than the bottom ash powder mortars M10 and M15, which have a lower absorption coefficient. Everything happens as if these bottom ash powder mortars are more resistant to leaching. This is understandable since these mortars contain less cement hydrates and therefore fewer leachable phases. However, the absorption coefficient of mortar containing 20% bottom ash powder is higher than that of the reference mortar. The porosity of this mortar may be less segmented due to the low cement content.

3.2.6. Electrical Resistivity

Figure 15 shows the results of the electrical resistivity measurements made before and after the leaching of the mortars. It can be seen that the resistivity decreases sharply after leaching. This is likely related to the increased porosity of the mortars after leaching as shown in Figure 13.
The addition of bottom ash powder as a partial replacement for CEM I has little effect on resistivity compared to the control mortar. At the healthy state, the resistivity being slightly higher for bottom ash powder mortars, it would seem that the decrease in resistivity is slightly greater for the latter than for the control mortar. As the porosity of these mortars after leaching does not differ from that of the control mortar, it could be thought that there were more phases leached out in the control mortar than in those containing bottom ash powder, so that they have the same content of pore solution ions.

3.3. Chloride Ions Diffusion

The apparent diffusion coefficient of chloride ions is calculated from the penetration depth measured on the specimens after spraying a silver nitrate solution which colours the chloride-containing zone in white (Figure 16).
The results obtained and presented in Table 5 show that the substitution of bottom ash powder for CEM I does not significantly affect the diffusion of chloride ions for substitution rates below 15%. For mortar containing 20% substitution, a slight decrease in the diffusion coefficient is observed compared to the reference mortar M0. These variations are probably related to changes in the microstructure of the mortars. In fact, the addition of bottom ash powder does not appreciably modify the porosity accessible to the water in the test specimens after 90 days of curing (Figure 13); this result suggests the presence of greater tortuosity in the M20 mortar. Previous work has shown that the use of pozzolanic mineral additions such as silica fume, fly ash, metakaolin, reduces the diffusion of chlorides by refining the porous network [25,26].

4. Conclusions

The objective of this work is to study the durability of a cementitious mortar made from a bottom ash powder. For this purpose, some samples of the mortar were subjected to carbonation and ammonium nitrate leaching and the consequences of these treatments were examined.
In the carbonation test, the partial substitution of the bottom ash powder for CEM I causes an increase of the CO2 penetration depth. This could lead to a significant degradation of the mortar if it contains more than 10% substitution. Results show that carbonation causes a decrease of the pore volume, the gas permeability, the capillary absorption and the water accessible porosity. These decreases are however smaller than those obtained with the mortar which does not contain the bottom ash powder. After carbonation, the mortars containing the ash powder show a higher increase of the electrical resistivity compared to that of the control mortar. This is an advantage with regard to the corrosion of the reinforcement.
In the leaching test, the partial substitution of the bottom ash powder for CEM I slightly increases the depth of degradation. Leaching causes an overall increase in porosity compared to the healthy state. There is no significant difference in the pore distribution between the different types of mortars. The porosity accessible to water is also of the same order for all mortars. The electrical resistivity decreases after leaching, but the values are also of the same order for all mortars. There is also an increase in the absorptivity of the mortars after leaching compared to the healthy state, but the M10 and M15 bottom ash powder mortars have a lower absorption coefficient than the reference mortar M0.
Diffusion test shows that for mortars containing less than 15% substitution, there is no significant influence on the chloride diffusion coefficient. A slight decrease is observed for mortar containing 20% substitution.

Author Contributions

Conceptualization: N.S., A.M., K.H., F.T., W.P.A.; methodology: N.S., A.M., K.H., F.T., W.P.A.; formal analysis and investigation: N.S., A.M., K.H., F.T., W.P.A.; writing—original draft preparation: N.S.; writing—review and editing: N.S., A.M., K.H., F.T., W.P.A. All authors have read and agreed to the published version of the manuscript.

Funding

This research received no external funding.

Acknowledgments

Société Nigérienne de Charbon (SONICHAR).

Conflicts of Interest

The authors declare no conflict of interest.

References

  1. Emad, B.; Gholamreza, Z.; Ezzatollah, S.; Alireza, B. Global strategies and potentials to curb CO2 emissions in cement industry. J. Clean. Prod. 2013, 51, 142–161. [Google Scholar]
  2. Mokhtaria, B.; Fatiha, K.A.; Abdelaziz, S. Durabilité des mortiers à base de pouzzolane naturelle et de pouzzolane artificielle. Rev. Nat. Technol. 2009, 1, 63–73. [Google Scholar]
  3. Rashad, A. Metakaolin as cementitious material: History, scours, production and composition – A comprehensive overview. Constr. Build. Mater 2013, 41, 303–318. [Google Scholar] [CrossRef]
  4. Hosseini, M.M.; Shao, Y.; Whalen, J.K. Biocement production from silicon-rich plant residues: Perspectives and future potential in Canada. Biosyst. Eng. 2011, 110, 351–362. [Google Scholar] [CrossRef]
  5. Ayrinhac, F. Valorisation des Cendres Volantes de Chaudière à Lit Fluidisé Circulant dans la Filière du Génie Civil. Ph.D. Thesis, Institut National des Sciences Appliquées de Toulouse, Toulouse, France, June 2005. [Google Scholar]
  6. Cheriaf, M.; Rocha, J.; Pera, J. Pozzolanic properties of pulverized coal combustion bottom ash. Cem. Concr. Res. 1999, 29, 1387–1391. [Google Scholar] [CrossRef]
  7. Haldun, K.; Mine, K. Usage of coal combustion bottom ash in concrete mixture. Constr. Build. Mater. 2007, 1922–1928. [Google Scholar] [CrossRef]
  8. Kula, I.; Olgun, A.; Erdogan, Y.; Sevinç, V. Effects of colemanite waste, cool bottom ash, and fly ash on the properties of cement. Cem. Concr. Res. 2001, 31, 491–494. [Google Scholar] [CrossRef]
  9. Ramezanianpour, A.; Jovein, H.B. Influence of metakaolin as supplementary cementing material on strength and durability of concretes. Constr. Build. Mater. 2012, 30, 470–479. [Google Scholar] [CrossRef]
  10. Wongkeo, W.; Thongsanitgarn, P.; Chaipanich, A. Compressive strength and drying shrinkage of fly ash-bottom ash-silica fume multi-blended cement mortars. Mater. Des. 2012, 36, 655–662. [Google Scholar] [CrossRef]
  11. Savadogo, N. Élaboration et Caractérisation d’un Éco-ciment à Base de Poudre de Mâchefer de Charbon. Ph.D. Thesis, Institut National des Sciences Appliquées de Rennes, Rennes, France, 2017. [Google Scholar]
  12. Savadogo, N.; Messan, A.; Hannawi, K.; Tsobnang, F.; Prince, A.W. Durabilité d’un ciment composé à base de mâchefer de Tefereyre (Niger): Absorption capillaire, porosité accessible à l’eau et attaque acide. J. Mater. Eng. Struct. 2015, 2, 213–223. [Google Scholar]
  13. Argiz, C.; Moragues, A.; Menéndez, E. Use of ground coal bottom ash as cement constituent in concretes exposed to chloride environments. J. Clean. Prod. 2018, 170, 25–33. [Google Scholar] [CrossRef]
  14. Thiery, M.; Villain, G.; Platret, G. Effect of carbonation on density, microstructure and liquid water saturation of concrete. In Proceedings of the 9th Engineering Conference on Advances in Cement and Concrete, Copper Mountain, CO, USA, 10–14 August 2003; Lange, D.A., Scrivener, K.L., Marchand, J., Eds.; Engineering Conferences International (E.C.I.): New York, NY, USA, 2003; pp. 481–490. [Google Scholar]
  15. Ngala, V.; Page, C. Effects of carbonation on pore structure and diffusional properties of hydrated cement pastes. Cem. Concr. Res. 1997, 27, 995–1007. [Google Scholar] [CrossRef]
  16. Metalssi, O.O.; Aït-Mokhtar, A.; Turcry, P.; Ruot, B. Consequences of carbonation on microstructure and drying shrinkage of a mortar with cellulose ether. Constr. Build. Mater. 2012, 34, 218–225. [Google Scholar] [CrossRef]
  17. Miragliotta, R. Modélisation des Processus Physico-Chimiques de la Carbonatation des Bétons Préfabriqués—Prise en Compte des Effets de Paroi. Ph.D. Thesis, l’Université de la Rochelle, La Rochelle, France, 2000. [Google Scholar]
  18. Thiery, M. Modelling of Atmospheric Carbonation of Cement Based Materials Considering the Kinetic Effects and Modifications of the Microstructure. Ph.D. Thesis, L’école Nationale des Ponts et Chausses, Champs-sur-Marne, France, 2005. [Google Scholar]
  19. Darkhmouche, F. Carbonatation des Béton Adjuvantés à Base de Ressources Locales Algériennes. Ph.D. Thesis, Université d’Orléans, Orléans, France, 2009. [Google Scholar]
  20. Neville, A. Propriétés des Bétons; Eyrolles: Paris, France, 2000; p. 806. ISBN 10: 2-212-01320-5. [Google Scholar]
  21. Khan, M.I.; Lynsdale, C. Strength, permeability, and carbonation of high-performance concrete. Cem. Concr. Res. 2002, 32, 123–131. [Google Scholar] [CrossRef]
  22. Atis, C.D. Accelerated carbonation and testing of concrete made with fly ash. Constr. Build. Mater. 2003, 17, 147–152. [Google Scholar] [CrossRef]
  23. Kaid, N.; Cyr, M.; Julien, S.; Khelafi, H. Durability of concrete containing a natural pozzolan as defined by a performance-based approach. Constr. Build. Mater. 2009, 23, 3457–3467. [Google Scholar] [CrossRef]
  24. Andrade, C.; Bujak, R. Effects of some mineral additions to Portland cement on reinforcement corrosion. Cem. Concr. Res. 2013, 53, 59–67. [Google Scholar] [CrossRef]
  25. Byfors, K. Influence of silica fume and fly ash on chloride diffusion and pH values in cement paste. Cem. Concr. Res. 1987, 17, 115–130. [Google Scholar] [CrossRef]
  26. Elahi, A.; Basheer, P.; Nanukuttan, S.; Khan, Q. Mechanical and durability properties of high perfomance concretes containing supplementary materials. Constr. Build. Mater. 2010, 24, 292–299. [Google Scholar] [CrossRef]
  27. ASTM International. Norme, ASTM Standard, C618-08a: Standard Specification for Coal Fly Ash and Raw or Calcined Natural Pozzolan for Use in Concrete; Annual Book of ASTM Standards; ASTM International: West Conshohocken, PA, USA, 2008. [Google Scholar]
  28. Directive 1999/31/CE. Directive du conseil concernant la mise en décharge des déchets. J. Officiel Communautés Européennes 1999. Available online: aida.ineris.fr.
  29. AFNOR. NF EN 933-8+A1: Essais pour déterminer les caractéristiques géométriques des granulats-Partie 8: évaluation des fines-Équivalent de sable, Juillet 2015; AFNOR: Saint-Denis, France, 2016; Available online: www.boutique.afnor.org (accessed on 30 September 2020).
  30. AFNOR. EN 196-1: Méthodes D’essais des Ciments-Partie 1: Détermination des Résistances Mécaniques; AFNOR: Saint-Denis, France, 2016; Available online: www.boutique.afnor.org (accessed on 30 September 2020).
  31. Barrett, E.P.; Joyner, L.G.; Halenda, P.P. The Determination of Pore Volume and Area Distributions in Porous Substances. I. Computations from Nitrogen Isotherms. J. Am. Chem. Soc. 1951, 73, 373–380. [Google Scholar] [CrossRef]
  32. AFPC-AFREM: Durabilité des bétons « Méthodes recommandées pour la mesure des grandeurs associées à la durabilité » Compte-rendu des journées techniques. In Proceedings of the Technical AFCP/AFREM Days on Concrete Durability, “Recommended methods for measuring of durability parameters”, Toulouse France, 11–12 December 1997; Laboratoire Matériaux et Durabilité des Constructions: Toulouse, France, 1997.
  33. Baroghel-Bouny, V.; Belin, P.; Maultzsch, M.; Henry, D. AgNO3 spray tests: Advantages, weaknesses, and various applications to quantify chloride ingress into concrete. Part 2: Non-steady-state migration tests and chloride diffusion coefficients. Mater. Struct. 2007, 40, 783–799. [Google Scholar] [CrossRef]
  34. Bellégo, C.L.; Gérard, B.; Pijaudier Cabot, G. Mechanical Analysis of Concrete Structures Submitted to an Aggressive Water. Fracture Mechanics of Concrete Structures; Swets and Zeitlinger: Lisse, The Netherlands, 2001; pp. 239–246. [Google Scholar]
  35. Auroy, M. Impact de la Carbonatation sur les Propriétés de Transport d’Eau des Matériaux Cimentaires. Ph.D. Thesis, Ecole Nationale des Ponts et Chaussées, Champs-sur-Marne, France, 2014. [Google Scholar]
  36. Eitel, W. Silicate Science: Ceramics and Hydraulic Binders; Academic Press: New York, NY, USA, 1966; Volume 5. [Google Scholar]
  37. Adenot, F.; Buil, M. Modelling of the corrosion of the cement paste by deionized water. Cem. Concr. Res. 1992, 22, 489–496. [Google Scholar] [CrossRef]
  38. Carde, C. Caractérisation et Modélisation de l’Altération des Propriétés Mécaniques dus à la Lixiviation des Matériaux Cimentaires. Ph. D. Thesis, INSA Toulouse, Toulouse, France, 1996. [Google Scholar]
  39. Carde, C.; François, R. Effect of the leaching of calcium hydroxide from cement paste on mechanical and physical properties. Cem. Concr. Res. 1997, 27, 539–550. [Google Scholar] [CrossRef]
  40. Gaitero, J.; Campillo, I.; Guerrero, A. Reduction of the calcium leaching rate of cement paste by addition of silica nanoparticles. Cem. Concr. Res. 2008, 38, 1112–1118. [Google Scholar] [CrossRef] [Green Version]
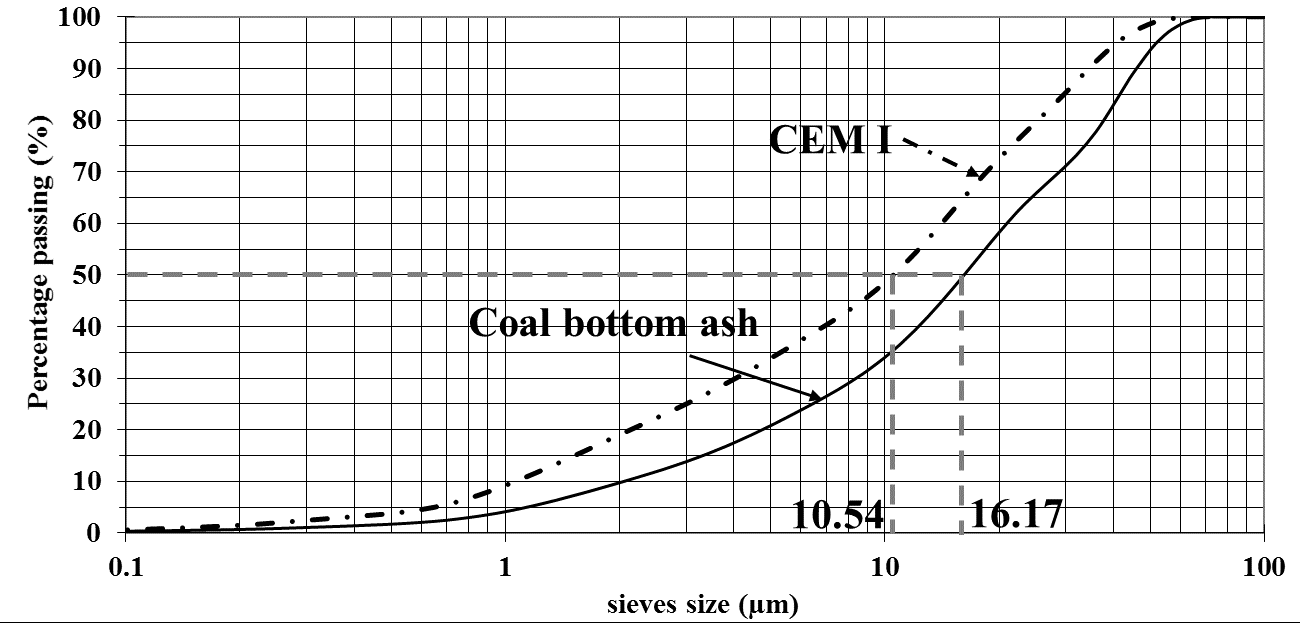
Figure 1. Granular distribution of coal bottom ash powder and CEM I.
Sustainability 12 08089 g001
Figure 2. SEM image of coal bottom ash powder.
Sustainability 12 08089 g002
Figure 3. Diffractogram of coal bottom ash powder.
Sustainability 12 08089 g003
Figure 4. Carbonation depth of mortars.
Sustainability 12 08089 g004
Figure 5. Poral distribution (a) before and (b) after mortar carbonation.
Sustainability 12 08089 g005aSustainability 12 08089 g005b
Figure 6. Gas permeability of mortars before and after carbonation.
Sustainability 12 08089 g006
Figure 7. Water-accessible porosity evolution before and after mortar carbonation.
Sustainability 12 08089 g007
Figure 8. Capillary absorption before (a) and after (b) carbonation.
Sustainability 12 08089 g008
Figure 9. Evolution of electrical resistivity before and after mortar carbonation.
Sustainability 12 08089 g009
Figure 10. Leaching depth of mortars.
Sustainability 12 08089 g010
Figure 11. Poral distribution (a) before and (b) after leaching with substitution rate.
Sustainability 12 08089 g011aSustainability 12 08089 g011b
Figure 12. Gas permeability of mortars before and after leaching.
Sustainability 12 08089 g012
Figure 13. Evolution of porosity before and after mortar leaching.
Sustainability 12 08089 g013
Figure 14. Capillary absorption (a) before and (b) after leaching.
Sustainability 12 08089 g014
Figure 15. Evolution of electrical resistivity before and after leaching of mortars.
Sustainability 12 08089 g015
Figure 16. Depth of chloride ion penetration.
Sustainability 12 08089 g016
Table 1. Chemical composition and physical properties of CEM I and coal bottom ash.
CEM ICoal Bottom Ash
Chemical composition (% by weight)
SiO218.653.2
CaO59.60.41
Al2O34.7322.2
Fe2O33.114.36
K2O0.261.90
Na2O0.100.22
MgO2.570.56
Mn2O30.0850.012
TiO20.241.67
Cl0.030.01
SO32.620.30
SrO0.0240.013
P2O50.470.042
Loss on ignition7.515.0
Physical characteristics
D50 (µm)10.5416.17
Specific density (t/m3)3.102.31
Apparent density (t/m3)1.060.77
BET specific surface area (m2/g)1.473.67
Blaine specific surface area (cm2/g)35654109
Table 2. Identification of different mortar formulations.
CodeBottom Ash Powder Rate (%) Constituent Mass (kg/m3)
BinderBottom AshSandWaterAdjuvant
M00292.208761455.8
M1010260.3298761455.8
M1515244.643.28761455.8
M202022957.38761455.8
Table 3. Distribution and mean radius of micropores and mesopores before and after carbonation.
NoncarbonatedCarbonated
MicroporesMesoporesMicroporesMesopores
Volume cm3/g·ÅRm (nm)Volume cm3/g·ÅRm (nm)Volume cm3/g·ÅRm (nm)Volume cm3/g·ÅRm (nm)
M00.961.630.463.450.261.670.334.28
M100.901.620.513.510.351.710.444.10
M151.001.630.633.480.601.660.533.57
M200.951.640.573.570.501.670.423.95
Table 4. Distribution and mean radius of micropores and mesopores before and after leaching.
NonleachedLeached
MicroporesMesoporesMicroporesMesopores
Volume cm3/g·ÅRm (nm)Volume cm3/g·ÅRm (nm)Volume cm3/g·ÅRm (nm)Volume cm3/g·ÅRm (nm)
M00.961.630.463.450.261.581.494.68
M100.901.620.513.510.421.611.684.42
M151.001.630.633.480.261.521.414.67
M200.951.640.573.570.281.541.394.71
Table 5. Apparent diffusion coefficient according to substitution rate.
Substitution Rate (%)Penetration Depth Xd (mm)Diffusion Dns (dif) (10−12 m2/s)
09.834.67 ± 0.27
1010.675.50 ± 0.59
1510.174.99 ± 0.29
209.174.05 ± 0.26