1. Introduction
Sustainable development requires an in-depth understanding of the mounting environmental challenges faced by every nation. As the global population continues to grow and critical resources become more scarce, enacting sustainable environmental policies will become increasingly important. Currently, 844 million people lack access to safe drinking water, 2.3 billion people lack access to good sanitation facilities [
1], and 9 out of 10 people worldwide breathe polluted air [
2]—enhancing environmental performance is thus a path towards improving the basic quality of life for billions of people. Measurements of environmental performance provide benchmarks for understanding the efficacy of sustainability related policies and action plans enacted worldwide [
3]. These measurements, or metrics, of environmental performance vary widely—from ecosystem-based measures, such as biodiversity or forest cover, to health-based measures, such as water or air quality. Given the variety of metrics that contribute to the overall sustainability of a country, synthesizing the relative environmental performance of different sectors into a holistic measurement is vital for evaluating the progress of nations in the course of building sustainable futures. Environmental sustainability indices are often the mode of this synthesis, allowing for the measurement of successful policies and interventions designed to reduce environmental impact.
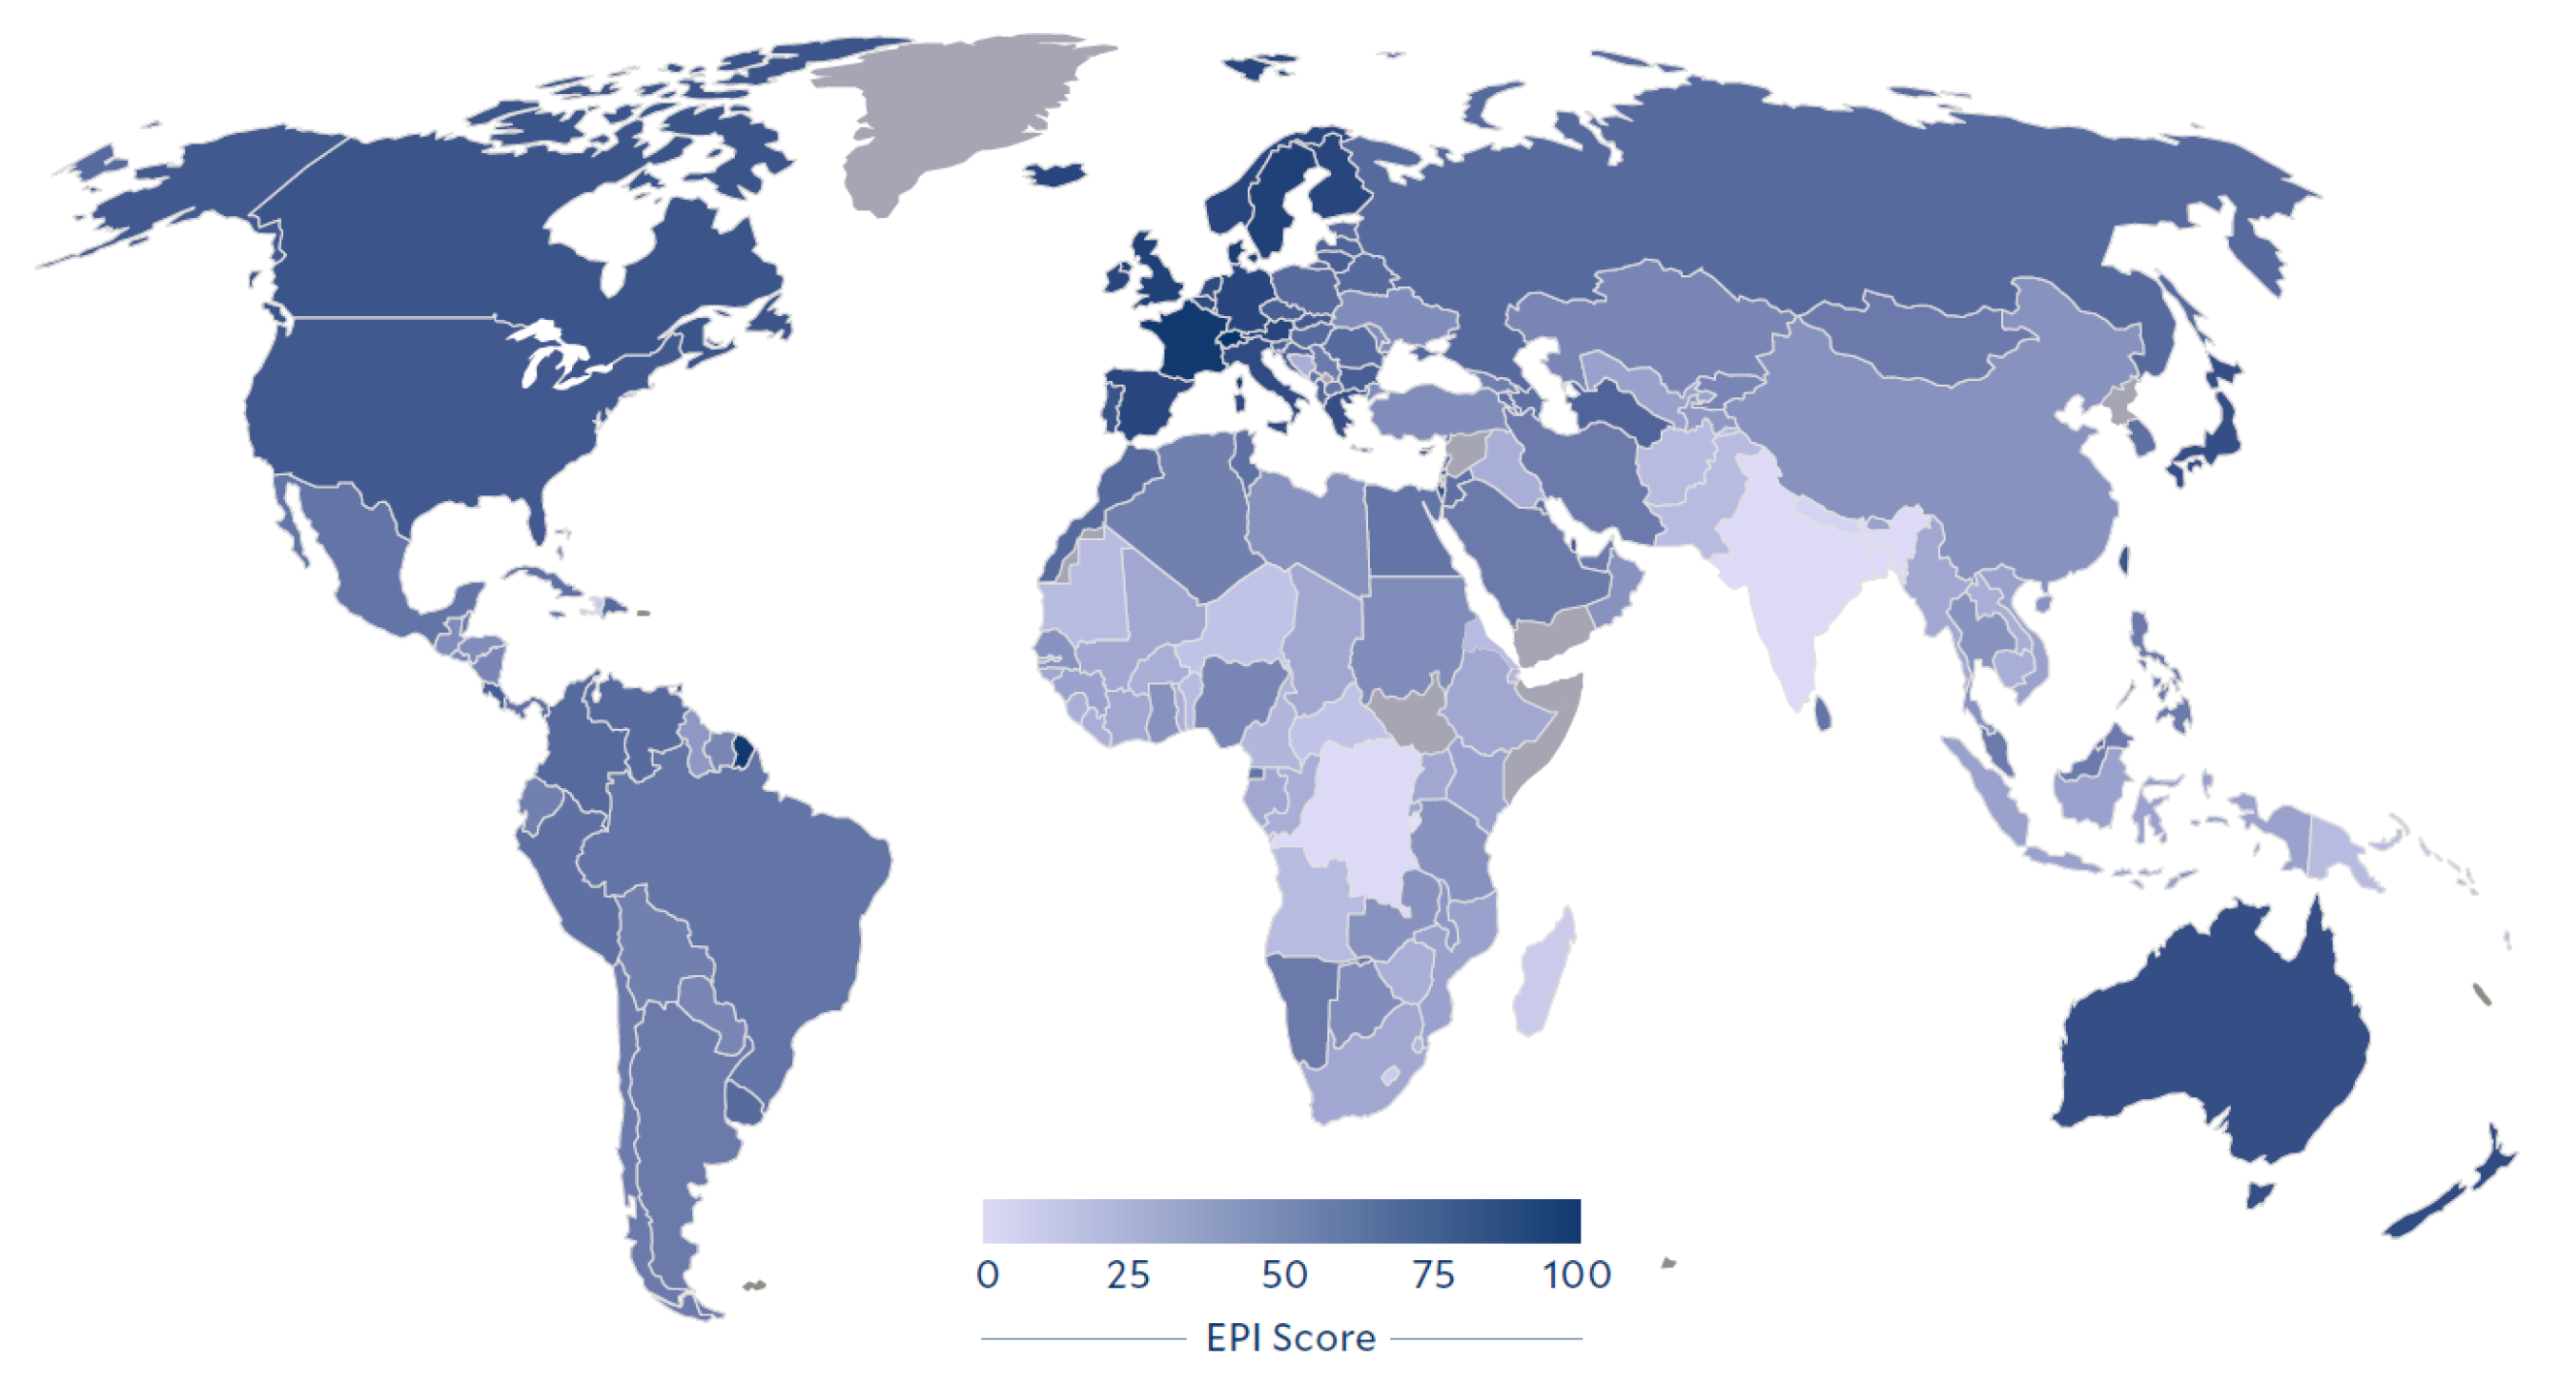
One of the most widely accepted tools for the measurement of environmental impact is the Environmental Performance Index (EPI), a composite index developed in line with the United Nations Millennium Development Goals (MDG) to rank the sustainability of each country based on a variety of metrics [
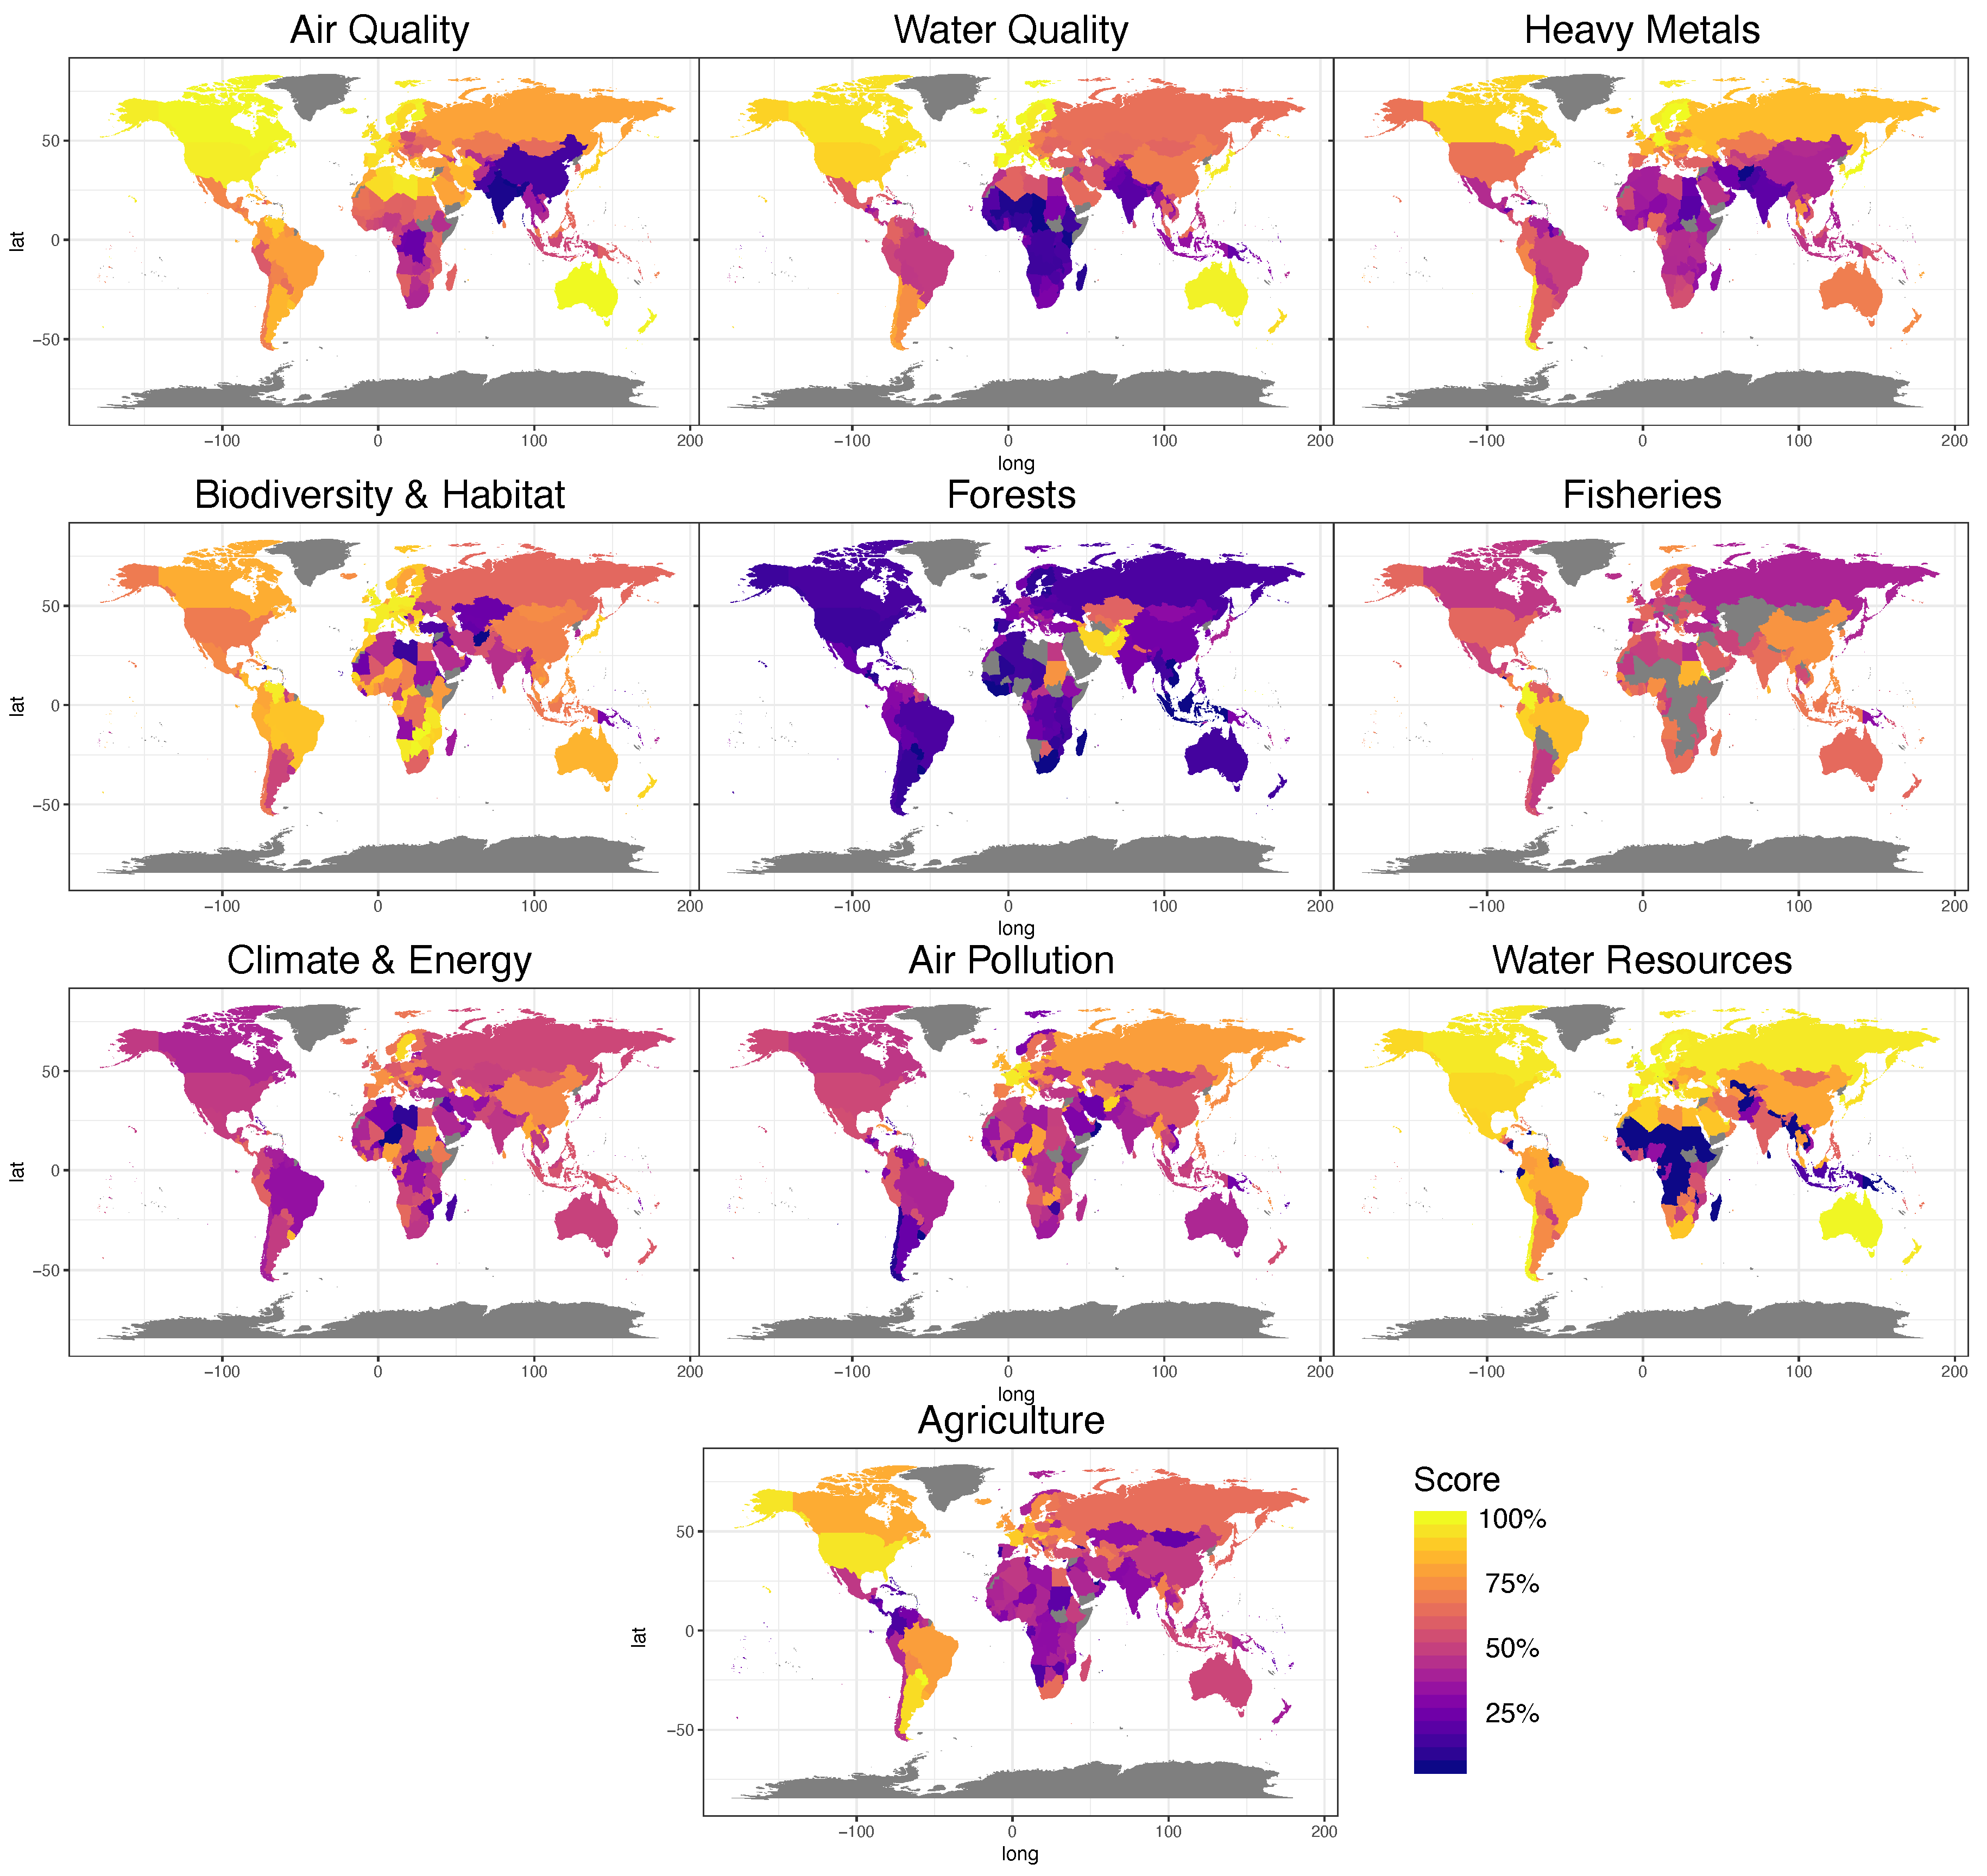
4]. The EPI is calculated on a scale from 0 to 100 as a weighted combination of 10 different aspects of environmental sustainability: air quality, water quality, prevalence of heavy metal exposure, preservation of biodiversity and natural habitats, deforestation rate, exploitation of fisheries, greenhouse gas (GHG) emissions, air pollution, water treatment, and agricultural nitrogen use efficiency [
4]. The total EPI score of every country in 2018 is shown in
Figure 1, while the distribution within the categories for the same year can be found in
Figure 2. The EPI is frequently criticized because of the inherent bias in selecting the variables to be included in the measure as well as the inconsistent weighting processes and the yearly changes in the calculation procedures [
5,
6]. Despite the increasing amount of credible criticism of the EPI, it continues to be used to monitor and rank environmental sustainability around the world.
In light of these deficiencies, there is significant ongoing work aimed at developing improved modes of assessing environmental sustainability, including the development of new indices. One such index was developed by leveraging structural equation modeling [
7] to rank countries based on relative environmental impact [
8]. Bradshaw et al. found that their ranks differed from widely used composite indices, such as the EPI, possibly due to the exclusion of human health-related indicators [
8]. An additional index was developed by Kuosmanen and Kortelainen based on eco-efficiency scores [
9]. The eco-efficiency index provides an alternative to the EPI, but still relies on the selection of indicators and a weighting process that could be different from year to year. Finally, a model referred to as the Sustainability Assessment by Fuzzy Evaluation (SAFE) was developed to create an index to rank the sustainability of countries, which is advantageous in environmental sustainability analyses [
10]. Despite these efforts to create better environmental performance indices, there remains a reliance on weighting and aggregation.
The weighting and aggregation process in the EPI, as well as other composite indices, is often criticized for being biased and potentially under-weighting important variables due to lack of data [
5]. As such, there is significant work being done to improve the weighting process. For example, many authors have leveraged data envelopment analysis (DEA), which selects weights based on an optimization scheme [
11]. In one study, for example, DEA was used to develop a composite index based on the EPI indicators [
12]. This resulted in slightly different rankings than the EPI, as well as being more interpretable from a decision-making standpoint. In another study, Bi et al. leveraged DEA to analyze the environmental performance of the Chinese industrial sector at the national scale [
13]. Nonetheless, these weighting and aggregation methods still depend on the analyzer’s choice of method, potentially introducing bias. To reduce this bias, Gan et al. developed a cyclical process for selecting the optimal weighting and aggregation procedure with limited user intervention [
14]. Although these advancements in selecting weighting and aggregation procedures have greatly reduced the inherent biases in composite indices used for evaluating environmental performance, the indicators considered within the index play an important role in the final results, making sustainability indicators another crucial area for research.
As mentioned above, indicator selection process of the EPI and other composite indices tends to be somewhat arbitrary, with potential for introducing bias [
15]. To counteract this arbitrariness, researchers are working to improve the selection process. For example, several authors have proposed classifying indicators based on the Driver-Pressure-State-Impact-Response (DPSIR) [
16] methodology, which provides justification for the inclusion of various indicators [
17,
18]. Other work has proposed a more computational approach based on the Entangled Economy Model [
19]. By applying a version of the Entangled Economy Model, Vasquez et al. were able to determine the optimal sustainability indicators for a given study area without relying on expert opinions [
20]. Ultimately, this model helped reduce bias introduced via the indicator selection process; however, most models still rely on ranking countries based on their environmental sustainability. Ranking countries creates difficulties for policymakers, as the rankings may change from year to year with or without improvement, making it difficult to determine potential paths forward.
Overall, the literature on global sustainability contains a number of studies outlining the problems associated with composite indices, such as the EPI, as well solutions to those problems. However, the solutions have often fallen short in terms of reducing the inherent biases of composite indices. For example, many authors have pointed to the weighting process as being a source of bias in the EPI and other composite indices. However, solutions to this weighting problem often still rely on weighting processes, albeit ones that reduce the chance for human-introduced bias via computational algorithms. Similarly, while the methodologies based on ranking lead to an easily grasped “big picture” of global sustainability, they fail to provide specific areas of environmental performance in which countries need to focus. With this in mind, this study addressed the gaps surrounding the weighting and ranking processes. First, the proposed framework does not weight indicators based on any preconceived notions of importance. Secondly, the framework does not rank countries in terms of environmental sustainability, rather clusters countries based on their similarities. Finally, through the proposed framework, the authors seek to provide specific pathways towards improving environmental performance by showing the exact indicators in which a country is doing poorly, rather than a relative rank that combines all indicators.
In particular, in this paper, we aim to leverage recent advancements in unsupervised learning, namely Self-Organized Maps (SOM) [
21], to create a data-driven framework for clustering and tracking countries’ respective environmental performance based on the indicators used in the EPI analysis. Through the use of SOM, we extract the inherent relational trends within the environmental performance data of all countries worldwide, resulting in the determination of the relative similarity of countries rather than an explicit ranking. In this way, we circumvent problems faced with the arbitrary assignment of weights and ranking countries, ultimately providing a more objective tool for policymakers who are aiming to evaluate their environmental sustainability. It is hypothesized that any discrepancies between the EPI rankings and the results from our data-driven framework would demonstrate that such composite indices, especially those that rely on ranking countries, may be misleading when used for measuring countries’ environmental performance over time. This work not only represents a novel method to evaluate environmental performance, but also presents a generalizable framework for objectively assessing and tracking environmental performance.
The structure of the paper is as follows. First, we discuss the data and methods, including detailing the specific algorithm (Self-Organized Maps) and generalized modeling framework developed as part of this study. Then, we discuss the results of applying the framework before delving into a comparison between the EPI findings and the results of the proposed framework. Finally, we conclude the paper and discuss policy implications.
3. Results and Discussion
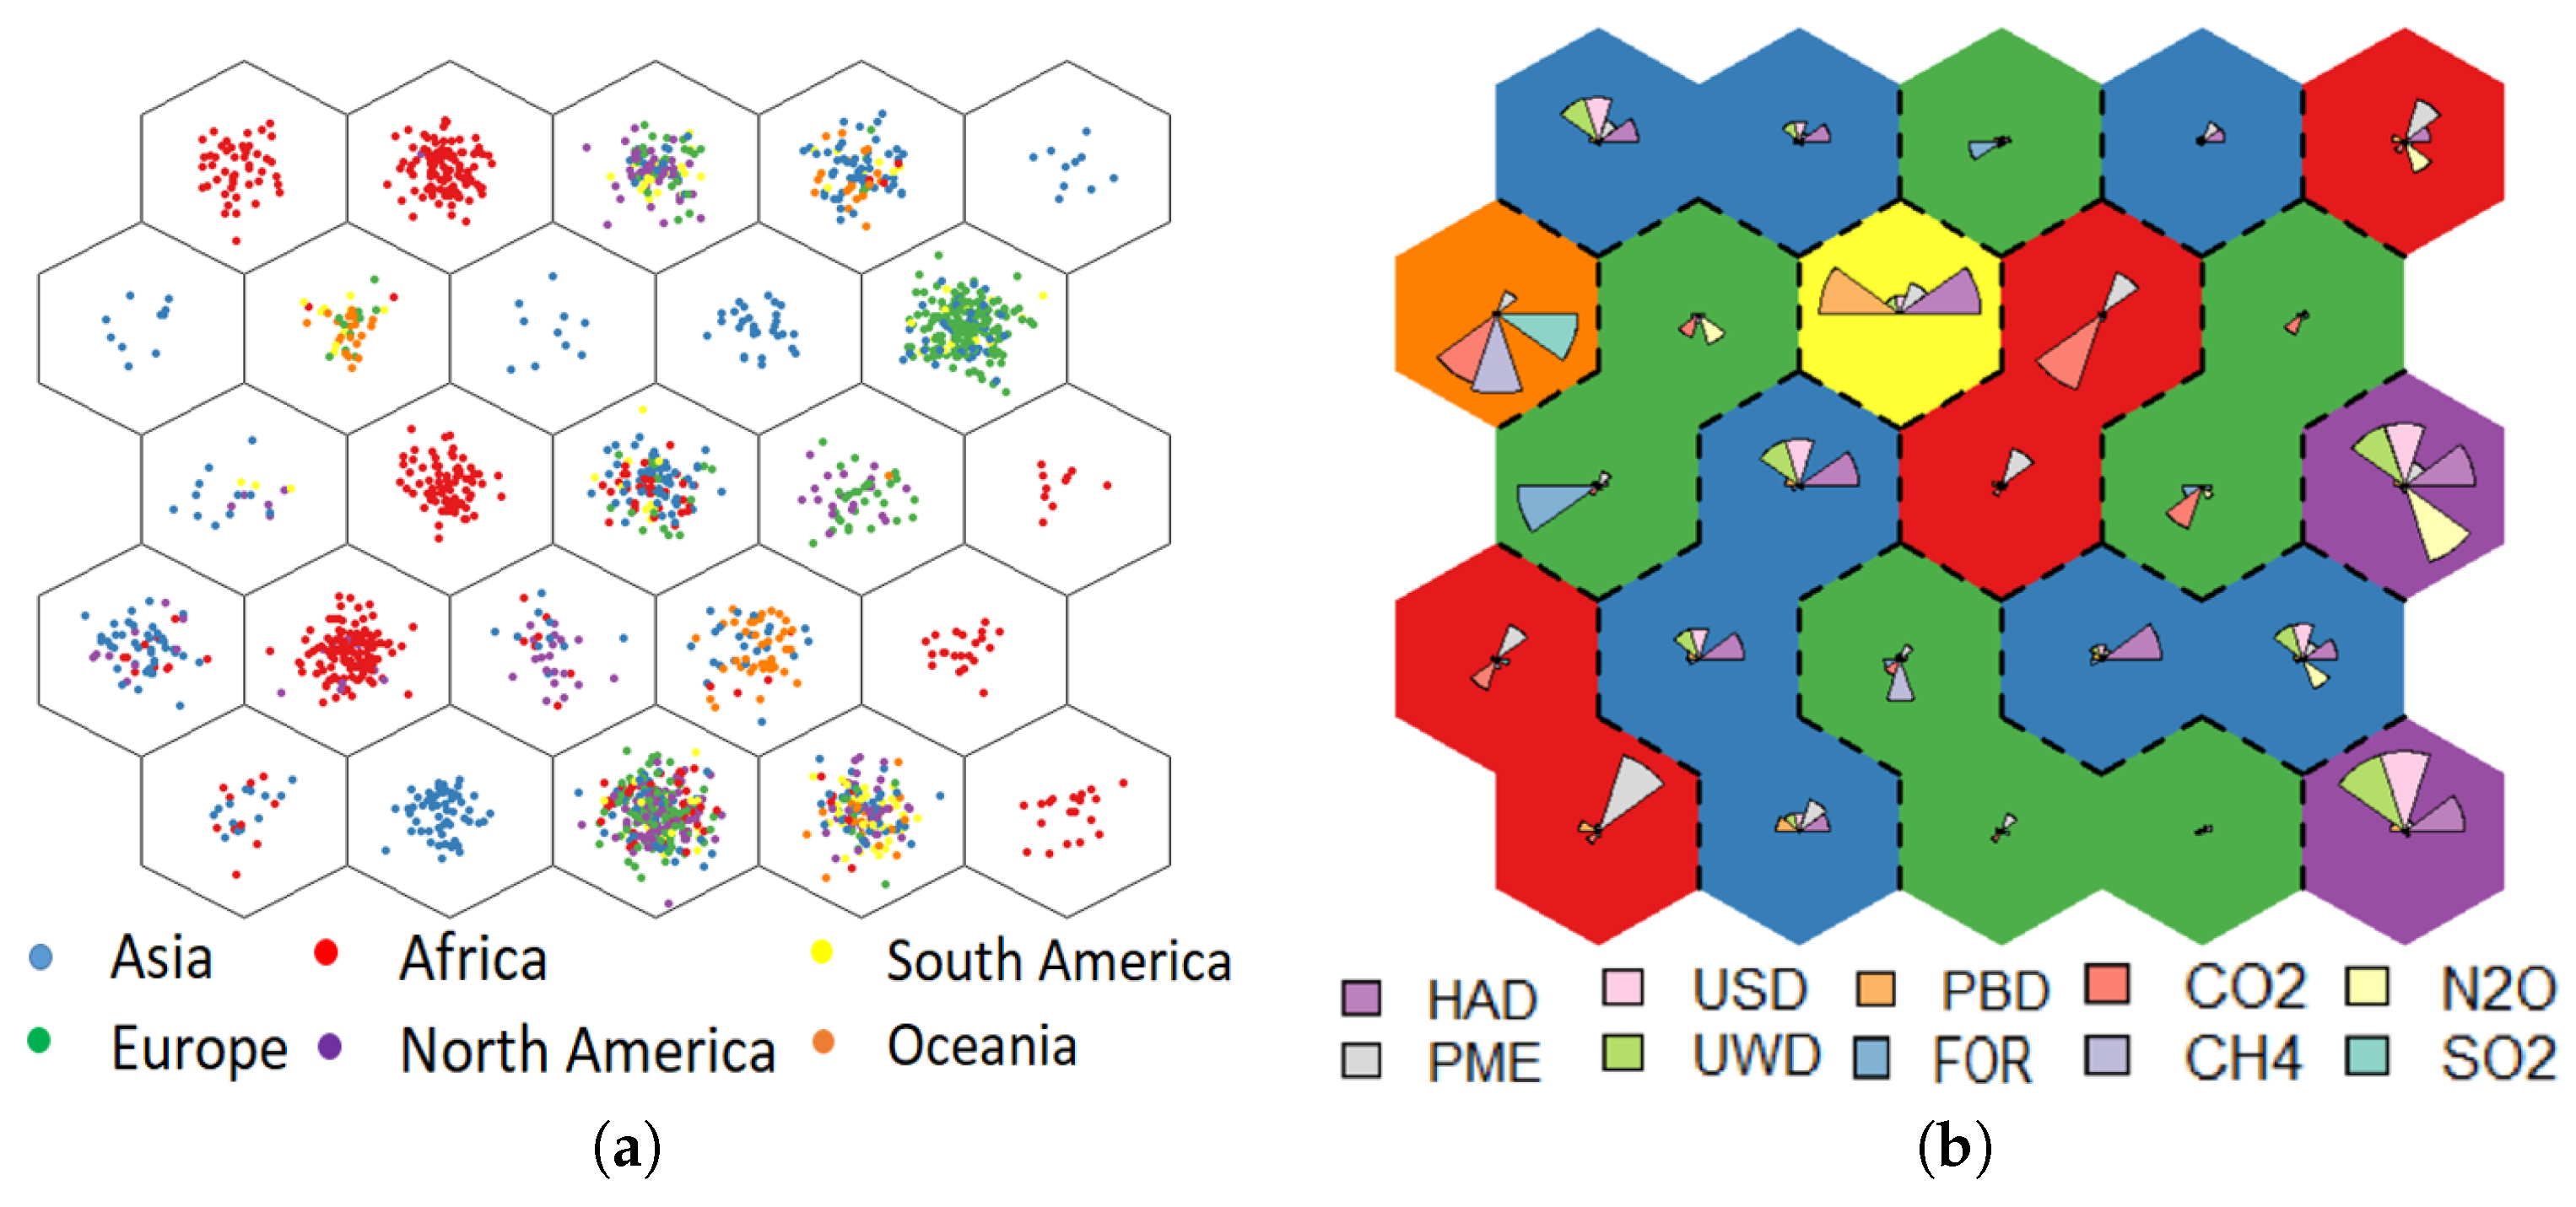
The output of the SOM algorithm is a map of nodes, which are directly related to the environmental performance data considered in the study. Each country is categorized to a node based on their performance within all the indicators. In this sense, the countries are clustered based on their similar environmental performance. The results of the modeling framework are shown in
Figure 3a,b. Each hexagon in
Figure 3 represents one of the SOM nodes. Accordingly, countries assigned to each node represent those which have similar performance within the various indicators. Analyzing the distribution of countries across the SOM nodes and categorizing them by their continent, there are clear trends in the environmental performance (see
Figure 3a). Countries in Africa (red points), for example, tend to cluster by their environmental performance as well as countries in Europe (green points). Within each cluster, average environmental performance as measured by each indicator is shown in
Figure 3b. Larger wedges indicate higher values of a given indicator, consequently indicating poorer environmental performance. In this sense, one can determine the relative environmental performance of each cluster based on the size of the wedges. This results in a snapshot of relative environmental performance, and provides a clear pathway for determining which aspects drive inclusion in a cluster.
A key benefit of this methodology is the ability for decision makers and policymakers to evaluate how one country performs relative to another and to determine the specific indicators in which a country is not performing well. For example, a country located in the bottom right node in
Figure 3b would not be performing well in terms of access to clean drinking water (UWD) and sanitation facilities (USD), as indicated by the relatively high magnitude of those wedges. Policymakers, therefore, would know to focus on drinking water and sanitation to improve their overall environmental performance, as opposed to trying to focus on all aspects of sustainability at once. Additionally, it can be used to assess not only the current state of environmental sustainability, but also the level of improvement or deterioration over time. This framework, therefore, circumvents the biases inherent in weighting and ranking processes raised in
Section 1, and allows for assessing the trajectory of countries’ environmental performances relative to one another. A schematic of how the method detailed above can be used to determine progression of the environmental sustainability in a given country can be seen in
Figure 4.
To determine a country’s improvement over time, both with regard to specific indicators and overall environmental performance, one can use
Figure 4. For example, if a country is located in the node of interest, circled in yellow, it tends to have lower life expectancy due to the use of house solid fuels (HAD), poor sanitation conditions (USD), and poor drinking water conditions (UWD). If that same country, in later years, shifts to a node circled in red, it would be considered a negative progression, as the indicators of interest (i.e., HAD, USD, and UWD) are significantly larger in those nodes than the original node. On the other hand, if the country shifts to the node circled in green, it would be a positive progression, as the magnitude of the indicators is smaller than the original node. Finally, if a country shifts to the node circled in blue, it would be difficult to track the progression (i.e., the progression is incomparable), as the country now has new challenges, namely higher CO
2 emissions (CO
2) and lower life expectancy due to particulate matter emissions (PME).
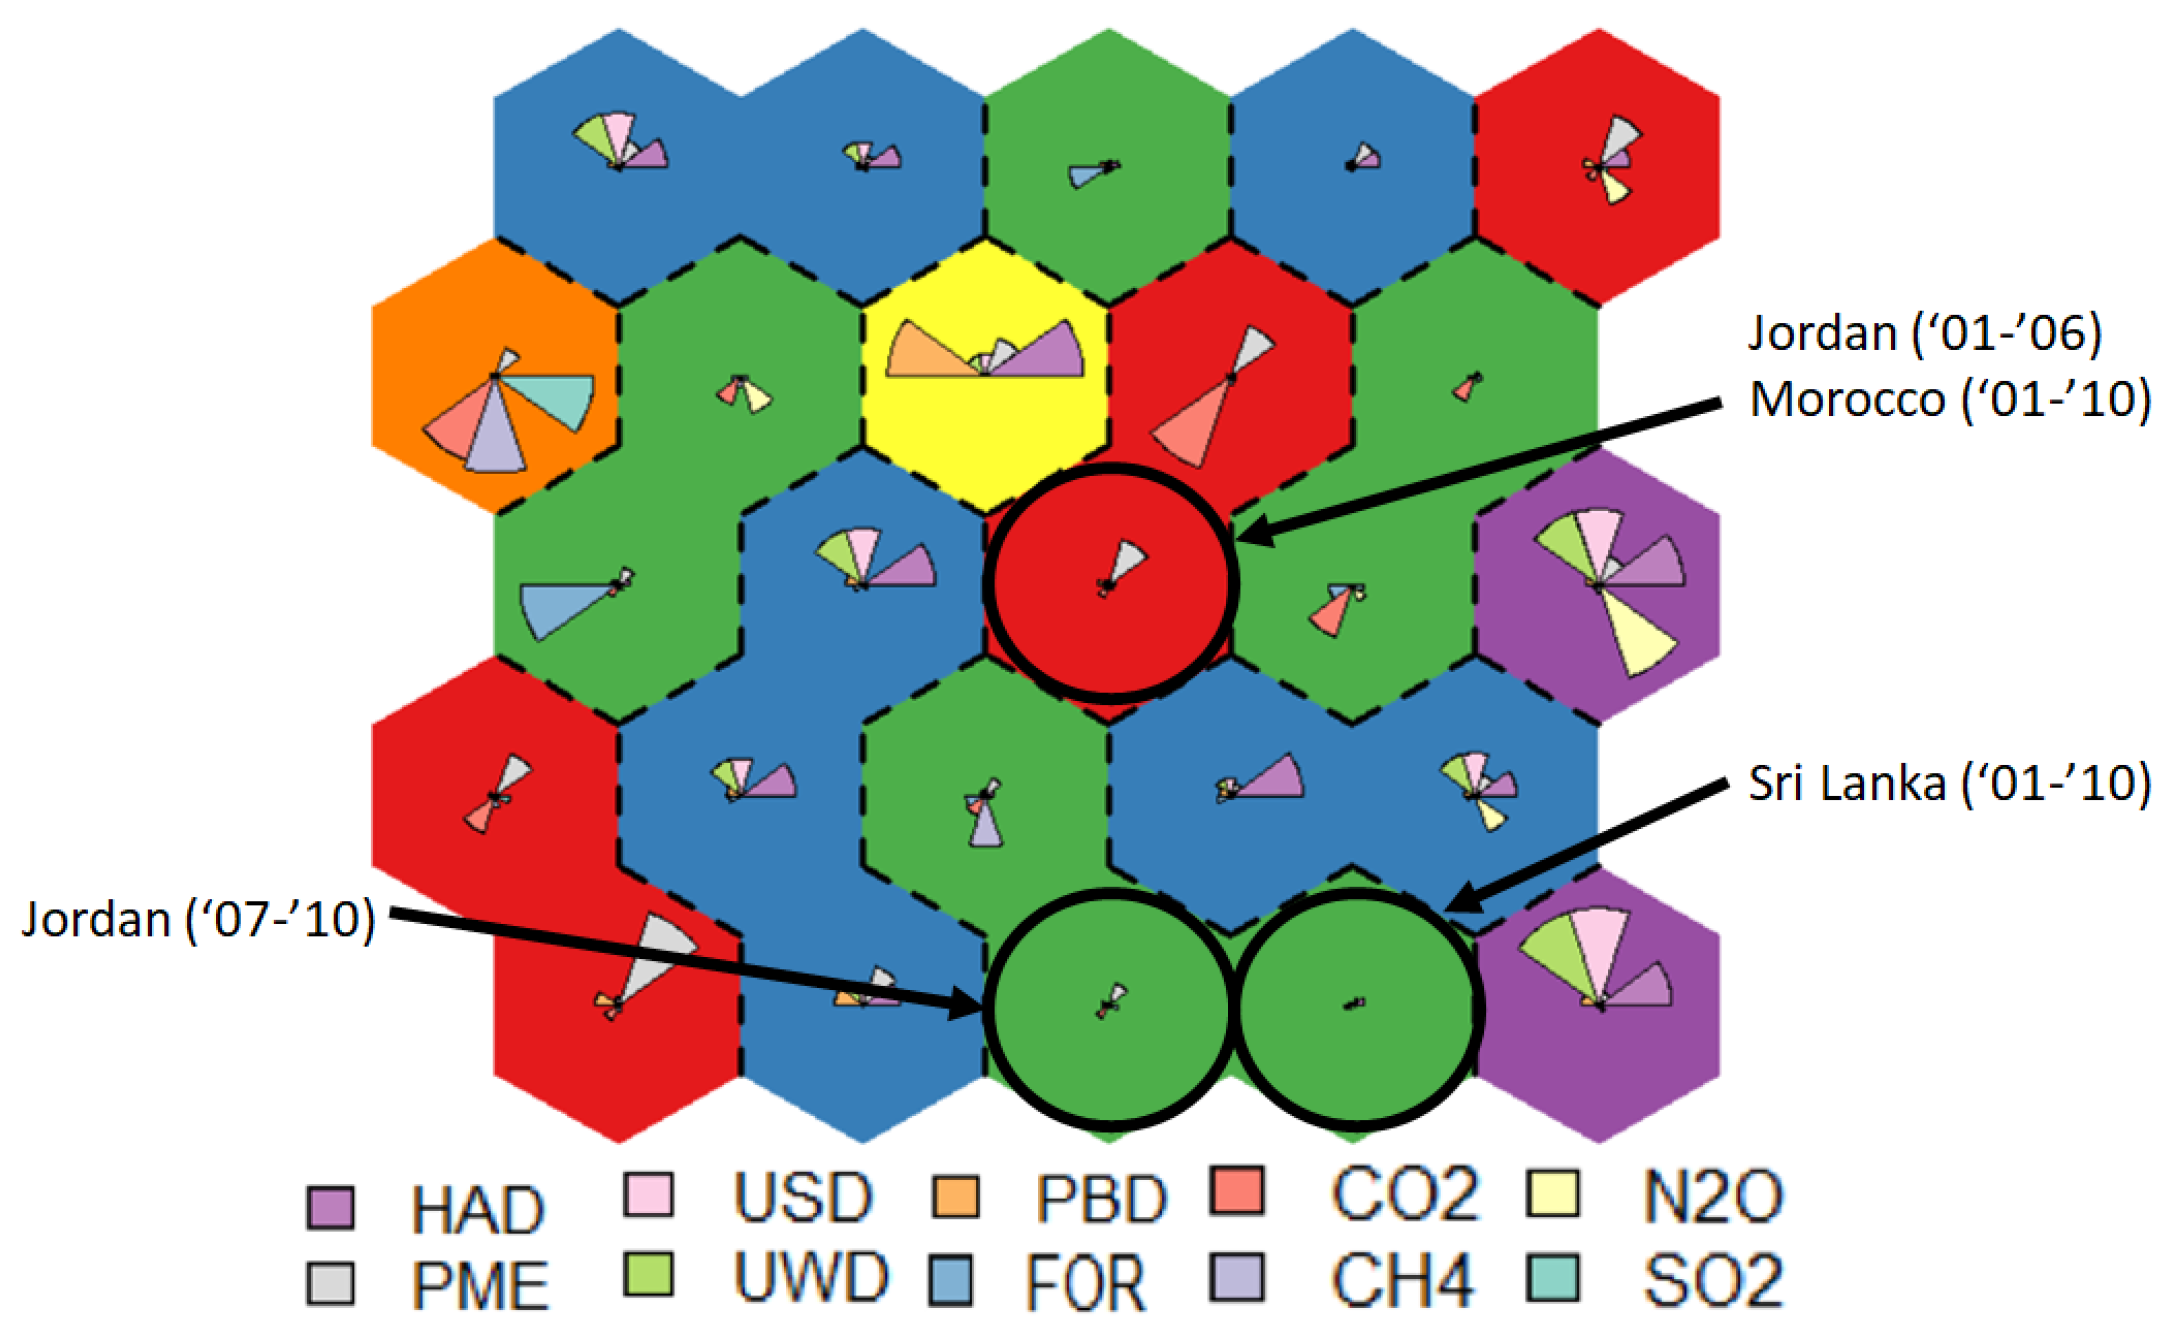
This way of evaluating changes in environmental sustainability has significant implications for countries working on developing policies aimed at improving sustainability. If one considers the countries of Jordan, Morocco, and Sri Lanka, for example, we see different progressions in the proposed framework than those of the EPI. In the EPI, Jordan was ranked 64th in 2006 and dropped to 70th in 2008, an apparent deterioration in ranking. However, as demonstrated in
Figure 5, Jordan actually improved its environmental sustainability between 2006 and 2008. Specifically, Jordan spent 2001–2006 in a node represented by lower life expectancy due to particulate matter emissions (PME), but, from 2007 to 2010, the country shifted to a node with a lower PME magnitude—indicating a positive shift in overall environmental sustainability. By following the EPI ranking, the policymakers in Jordan may have assumed that their decisions between 2006 and 2008 led to a deterioration in environmental sustainability, when, in fact, the inconsistent nature of the weighting process involved in the EPI rankings is a likely cause. Similar to Jordan, Morocco dropped in rank between 2006 and 2008, falling from 68th to 72nd. However, in the method presented here, Morocco saw no change over the years; instead, they remained stagnant in the same node that Jordan was in from 2001 to 2006. This presents an opportunity for Morocco, should they wish to improve their environmental sustainability, since Jordan would make an optimal model of a country that was in their node and was able to progress to a relatively better node. Finally, between 2006 and 2008, Sri Lanka was considered to have improved in environmental sustainability, rising from 67th to 50th. The proposed method, on the other hand, shows no change for Sri Lanka over the 10-year period studied. In fact, Sri Lanka remained in one of the nodes that represent relatively better environmental sustainability for the entire period. In this sense, Sri Lanka’s increase in EPI rank does not necessarily imply an improvement on their part, but more likely the continuation of successful policies while other countries dropped. For the node locations of all 180 countries over the 10-year period, see
Table S1.
4. Conclusions
The purpose of this study was to develop a framework to better assess environmental sustainability worldwide. Many of the current indices, including the Environmental Performance Index (EPI), rely on somewhat arbitrary data weighting and transformation processes that may change from year to year. This practice introduces biases to the final outcomes. Moreover, most indices present the results as ordinal rankings, which only demonstrates environmental performance relative to other countries. The framework presented here aimed to circumvent these shortcomings (i.e., weighting, transformations, and ranking) by leveraging an unsupervised data clustering technique known as Self-Organized Maps to extract the inherent patterns present in the environmental performance data. In contrast with traditional ranking measures such as the EPI, the proposed framework for analyzing the environmental performance of countries does not use arbitrary rankings or data transformations and instead constructs a data-driven representation of the underlying similarity between the respective environmental performance of countries. The results demonstrate significant discrepancies between the EPI rankings and cluster membership. For example, the country of Jordan dropped in EPI rank over time; however, our analysis showed that Jordan had a positive progression through the clusters, based on key improvements in a few critical environmental performance indicators. This is indicative that the EPI might not be the optimal measure of environmental sustainability, especially given the criticisms of the weighting and transformation processes.
The proposed framework can be utilized by decision-makers and policymakers to not only determine their level of environmental sustainability, but also which particular indicators they need to work on (if any). This ability to see which indicators are impacting their environmental performance is crucial to using the framework to enact real change, and something that ranked indices do not provide. Additionally, the nature of the clustering map provides the opportunity for sustainability role models, so to speak. For example, Jordan and Morocco were initially in the same cluster, but Jordan improved over time and eventually moved into a relatively better cluster. In this sense, Morocco could use Jordan as a role model for developing and implementing policies. Finally, the presented framework was developed for the purposes of environmental sustainability and included indicators that were relevant to that topic. These indicators, however, are interchangeable depending on the application, making the framework itself generalizable across a variety of different disciplines and research areas. In conclusion, the framework presented here evaluates environmental performance in a way that is both practical for policymakers working to improve environmental sustainability in their country, as well as researchers and practitioners interested in objectively evaluating environmental performance.

 and
and 


