Article

Temporal and Spatial Changes in Crop Water Use Efficiency in Central Asia from 1960 to 2016

1
State Key Laboratory of Desert and Oasis Ecology, Xinjiang Institute of Ecology and Geography, Chinese Academy of Sciences, Urumqi 830011, China
2
Research Center for Ecology and Environment of Central Asia, Chinese Academy of Sciences, Urumqi 830011, China
3
College of Resources and Environment, University of Chinese Academy of Sciences, Beijing 100049, China
4
State Key Laboratory of Water School of Environment, Beijing Normal University, Beijing 100875, China
*
Author to whom correspondence should be addressed.
Sustainability 2020, 12(2), 572; https://doi.org/10.3390/su12020572
Submission received: 6 December 2019 / Revised: 5 January 2020 / Accepted: 9 January 2020 / Published: 12 January 2020

Abstract

:
Water resources among five Central Asian countries are distributed unevenly. Since the collapse of the Soviet Union, the conflict between water and land use has become increasingly serious. Due to limited data, the temporal and spatial characteristics and trends of crop water use efficiency in Central Asia over the past 60 years remain unclear. This paper combines state-level agricultural statistics data and cultivated land data (1975, 2005 and 2015) from remote sensing imagery and calculates crop water use efficiency based on the FAO crop coefficient method. The results are as follows: (1) the development of crop cultivation in Central Asia is divided into an expansion period (1960–1990), a reduction period (1990–2000), and a recovery period (2000–2016); (2) the grain yield in Central Asia increased from 0.9 to 1.9 t/ha during 1960–2016, with Uzbekistan having the highest, reaching 4.2 t/ha in 2016. Cotton yield increased during 1960–1990 and decreased from 1990 to 2016. (3) The grain water use efficiency in Central Asia increased from 0.22 kg/m3 to 0.39 kg/m3 during 1960–2016. The cotton water use efficiency increased from 0.23 kg/m3 to 0.30 kg/m3 during 1960–1990, has decreased since 1990, and is currently close to the 1960s level.

1. Introduction

The water resources in Central Asia mainly depend on the meltwater of glaciers and snow [1,2]. Global warming has increased the uncertainty of water distribution and supply in the region [3,4]. At the same time, human activities such as population growth, economic development, and arable land expansion have intensified water stress and crisis in Central Asia [5,6]. From the 1960s to the 1980s, the Soviet government carried out large-scale water and land resource exploitation in Central Asia. This resulted in an increase in sown area, from 34 × 106 ha to 43 × 106 ha. The collapse of the Soviet Union occurred simultaneously with political and management system reform in Central Asia [7,8]. A large amount of cultivated land was abandoned due to a lack of labor and agricultural machinery, such as in northern Kazakhstan [9]. By the end of the 20th century, the total sown area of Central Asia had decreased by nearly 50%. After independence, Central Asian farmers adjusted the crop planting structure and increased the proportion of grain to meet the urgent needs of food self-sufficiency [10]. In the past 60 decades, the agricultural management methods of Central Asians, especially irrigation methods, have not shown an obvious change, with flood and furrow irrigation being the main methods [11]. High irrigation quotas, high evapotranspiration and high water loss rates in irrigation channels have caused the serious waste of agricultural water use in Central Asia [12,13]. In addition, the export of agricultural products has caused local water resources to be transferred abroad in the form of virtual water [14]. For example, Uzbekistan’s virtual water exports in 2013 reached 28.3 km3, of which 72% came from cotton production [15]. At present, agricultural water in Central Asia accounts for more than 80% of total water use [16]. The key to reducing water consumption via agriculture in Central Asia is to improve the efficiency of agricultural water use [17]. It is important to understand the temporal and spatial distribution characteristics of agricultural water use efficiency in Central Asia during the past half century. This is of great significance for ensuring food security and maintaining sustainable agricultural development in the region [18]. At the same time, it is also conducive to coping with the severe situation of increased water resource shortages in Central Asia.
Crop water use efficiency refers to the quantity of crop output that can be produced by the consumption per unit of water [19,20]. This is an important indicator for evaluating the efficiency of agricultural water use. At present, the research methods for crop water use efficiency are divided into the following categories: site observation [21,22,23,24], statistical analysis [25,26], model simulation [27,28,29,30] and remote sensing inversion [31,32,33,34]. Based on field observation research, the calculation of crop water use efficiency is more accurate, but the number of sample points is limited, and the sample selection process is strongly influenced by human factors. There is uncertainty regarding whether sample points can represent regional crop water use efficiency. Zhou X [21] and Reddy J M [22] designed field experiments on the Loess Plateau of China and the Fergana Basin of Central Asia to determine crop water use efficiency. The advantage of the statistical analysis method is that the data are highly obtainable and that the calculation is simple. However, limited by the statistical unit, the spatial heterogeneity of the crop water use efficiency within the statistical unit cannot be recognized. Zhang J [25] used the statistics of yield and water consumption to calculate the water use efficiency of rice, wheat and cotton in the Aral Sea Basin of Central Asia. Using model simulation, a large amount of field observation data was needed to parameterize and correct the model features, such as soil properties, crop parameters and meteorological data. This method is very useful for field-scale simulation, while, for large areas, the results are uncertain. Mbangiwa N C [28] simulated soybean water use efficiency in Natal, South Africa, based on the AquaCrop crop growth model. Remote sensing can be used to estimate crop water use efficiency in large areas, but there are limitations of short time series and image quality. It is difficult to use remote sensing to invert more than 30 years of crop water use efficiency. Li F [31] estimated the yield and evapotranspiration of winter wheat and summer maize in China’s Haihe River Basin from 2003 to 2007 based on MODIS images and calculated crop water use efficiency. Platonov A [35] calculated the cotton water use efficiency of the Galaba farm in the Syr Darya Basin in 2006 through Landsat ETM+ remote sensing data and produced a spatial distribution map of cotton water use efficiency.
Since there is a certain limitation in using a single method to calculate crop water use efficiency, calculating crop water use efficiency by combining multisource data is trending. Campos I [36] used remote sensing technology to assist crop growth models to estimate the water use efficiency of corn and soybeans in Nebraska, USA, and to extend crop models to regional scales. Xu Z [32] combined statistical data with crop evapotranspiration data to calculate the crop water use efficiency at the county scale in China’s North China Plain from 1986 to 2010, which displayed the advantage of statistical data with a long time series. Over the past 60 years, the crop planting structure in Central Asia has undergone significant changes, resulting in changes in the production of major crops and agricultural water consumption. Single site observation or remote sensing inversion methods are not sufficient to reflect the temporal and spatial variations in long-term crop water use efficiency in Central Asia, and multisource data are required.
In summary, this paper combines statistical data and remote sensing data using geographic information system (GIS) technology to spatialize crop planting structure and yield in Central Asia and estimate the water consumption of main crops by referencing the Food and Agriculture Organization’s (FAO’s) crop coefficient method to calculate crop water use efficiency. This paper reconstructs the spatial datasets of crop planting structure and yield at the pixel scale from 1960 to 2016. We calculated the water use efficiency of crops in Central Asia and analyzed the temporal and spatial changes.

2. Data and Methodology

2.1. Study Area

Central Asia consists of three plain countries—Kazakhstan, Uzbekistan and Turkmenistan—and two mountain countries—Kyrgyzstan and Tajikistan (Figure 1)—and covers approximately 4 million km2. The landforms of Central Asia are mainly grassland and desert. The terrain is high in the east and low in the west. The Pamir Plateau in Tajikistan is 4000–7500 m above sea level, which is the highest elevation in the region. The plain and basin are 200–400 m above sea level. The precipitation in this area is unevenly distributed. The annual precipitation in mountainous areas can reach more than 1000 mm, and the annual precipitation in plains and desert areas is less than 200 mm. The average temperature is approximately 8 °C, of which the average annual temperature of Turkmenistan is above 15 °C, while the annual average temperature of some parts of Tajikistan and Kyrgyzstan is below 0 °C.
The five countries of Central Asia have abundant agricultural resources. Annual average sunshine duration is 2000–3000 h, which is conducive to crop growth and nutrient accumulation, and total fresh water is approximately 1000 km3, of which the available water resources are approximately 206 km3. The Tianshan Mountains in southern Central Asia are known as the “Central Asian Water Tower” [37]. The agricultural land area is approximately 2.8 million km2 (90% of which is pasture, and 10% is farmland), accounting for 70% of the land area of Central Asia [38]. However, the unbalanced allocation of agricultural resources limits the agricultural development of Central Asia. For example, Kyrgyzstan and Tajikistan have the most abundant water resources. The land resources of Kazakhstan are abundant. Uzbekistan and Turkmenistan have an advantage in soil, topography and labor resources [16]. During the Soviet era, under the planned economy system, the five Central Asian countries were economically interdependent. Agriculture is the main economic sector of each country, accounting for 10%–45% of the gross domestic product (GDP) and employing 25%–50% of the labor force [10]. Today, agriculture is still an important part of the GDP for the five Central Asian countries (5.2% in Kazakhstan, 18.5% in Uzbekistan, 7.5% in Uzbekistan, 20.8% in Kyrgyzstan, and 23.3% in Tajikistan). Kazakhstan is the largest country among the five countries (accounting for 68% of Central Asia), and the crops are mainly dry wheat. During the Soviet era, Kazakhstan launched a Virgin Lands Campaign and became the commodity grain base of the Soviet Union, accounting for 20% of the total wheat purchases in the Soviet Union. Uzbekistan is a populous country (accounting for 45% of Central Asia’s population) and is an important cotton production area, accounting for 67% of Soviet cotton production. The vast deserts of the country and the building of the Karakum Canal have made the area of irrigated agriculture expand rapidly, making it an important cotton-producing area, after Uzbekistan. Among the other two mountainous countries, Tajikistan agriculture is dominated by cotton production, and Kyrgyzstan developed animal husbandry. The current agricultural production structure of the five Central Asian countries has changed compared with the Soviet period structure. Compared with 1990, the grain output of Kazakhstan in 2016 decreased by 21%; the cotton production in Uzbekistan, Turkmenistan and Tajikistan in 2016 reduced by 36%, 44%, and 62%, respectively. Contrary to the decrease in cotton production, the grain output of the three countries increased by 250%, 363%, and 347%, respectively.

2.2. Data

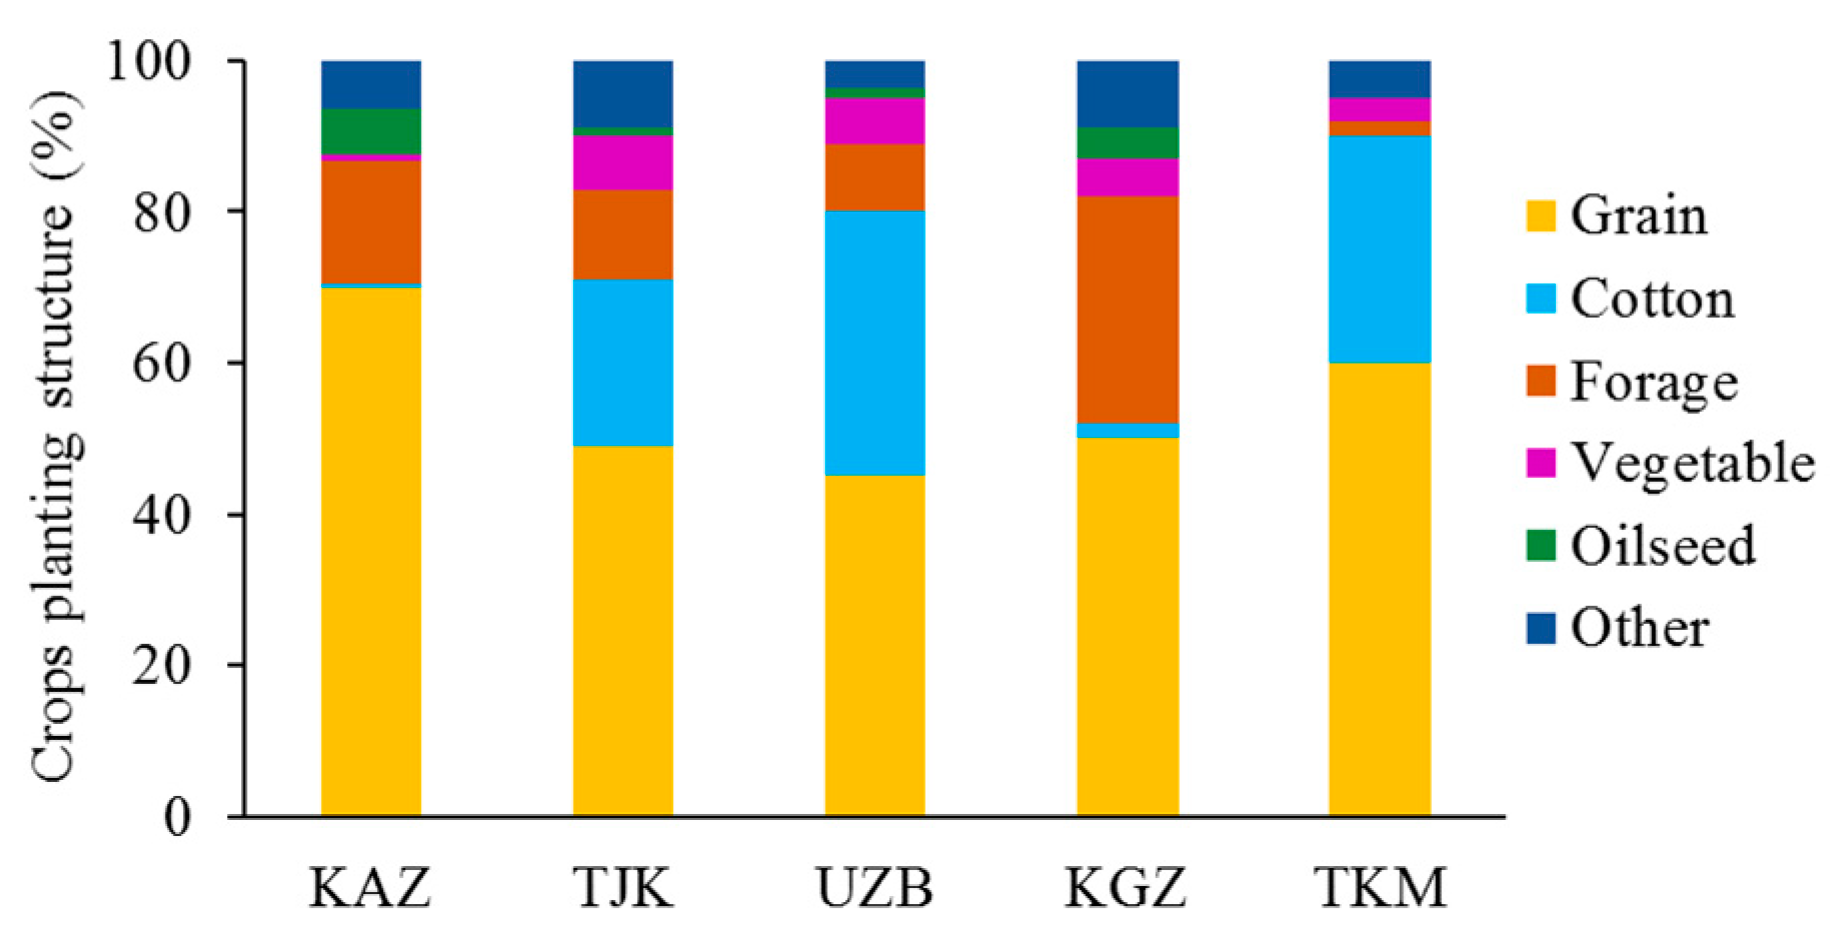
The data used in this paper include map data, meteorological data, land use and land cover (LULC) data, and agricultural statistics data (Table 1). In the past 60 years, the administrative boundaries and names of the five Central Asian countries have changed, resulting in inconsistencies in statistics before and after the collapse of the Soviet Union. Based on the 2010 national borders and state boundaries of the five Central Asian countries, this paper unifies the administrative units (names and boundaries) so that the statistics are consistent. This paper selects the Climatic Research Unit’s (CRU’s) latest dataset (CRU TS v.4.03), including temperature and potential evapotranspiration data. The temperature data are used to calculate the January average temperature, which determines the spring and winter wheat subregions. When the temperature is below −9 °C, winter wheat is difficult to grow, and dead seedlings are common. The potential evapotranspiration data are used to calculate the water consumption of crops. The spatial distribution of cultivated land in the five Central Asian countries was extracted from remote sensing images supplied by the Landsat satellite. The crops in the five Central Asian countries include wheat, barley, corn, rice, cotton, alfalfa, sunflower, beets, vegetables, and grapes. Grain, cotton and forage are the main crops in the region (Figure 2). Grain is important to guarantee the basic life of the people, and cotton is an important cash crop and export commodity in Central Asia. Forage account for a relatively high proportion of crops in Kazakhstan and Kyrgyzstan. However, due to the lack of harvest data of forage, this study only considers grain and cotton.
Grain accounted for 66.5% of the planting structure in the whole region, and cotton accounted for 7.5%. Grain includes wheat, barley, oats, maize and rice, of which wheat (winter and summer) accounts for 81.3% (2016).

2.3. Methodology

2.3.1. Spatialization of Crop Planting Structure and Yield in Central Asia from 1960 to 2016

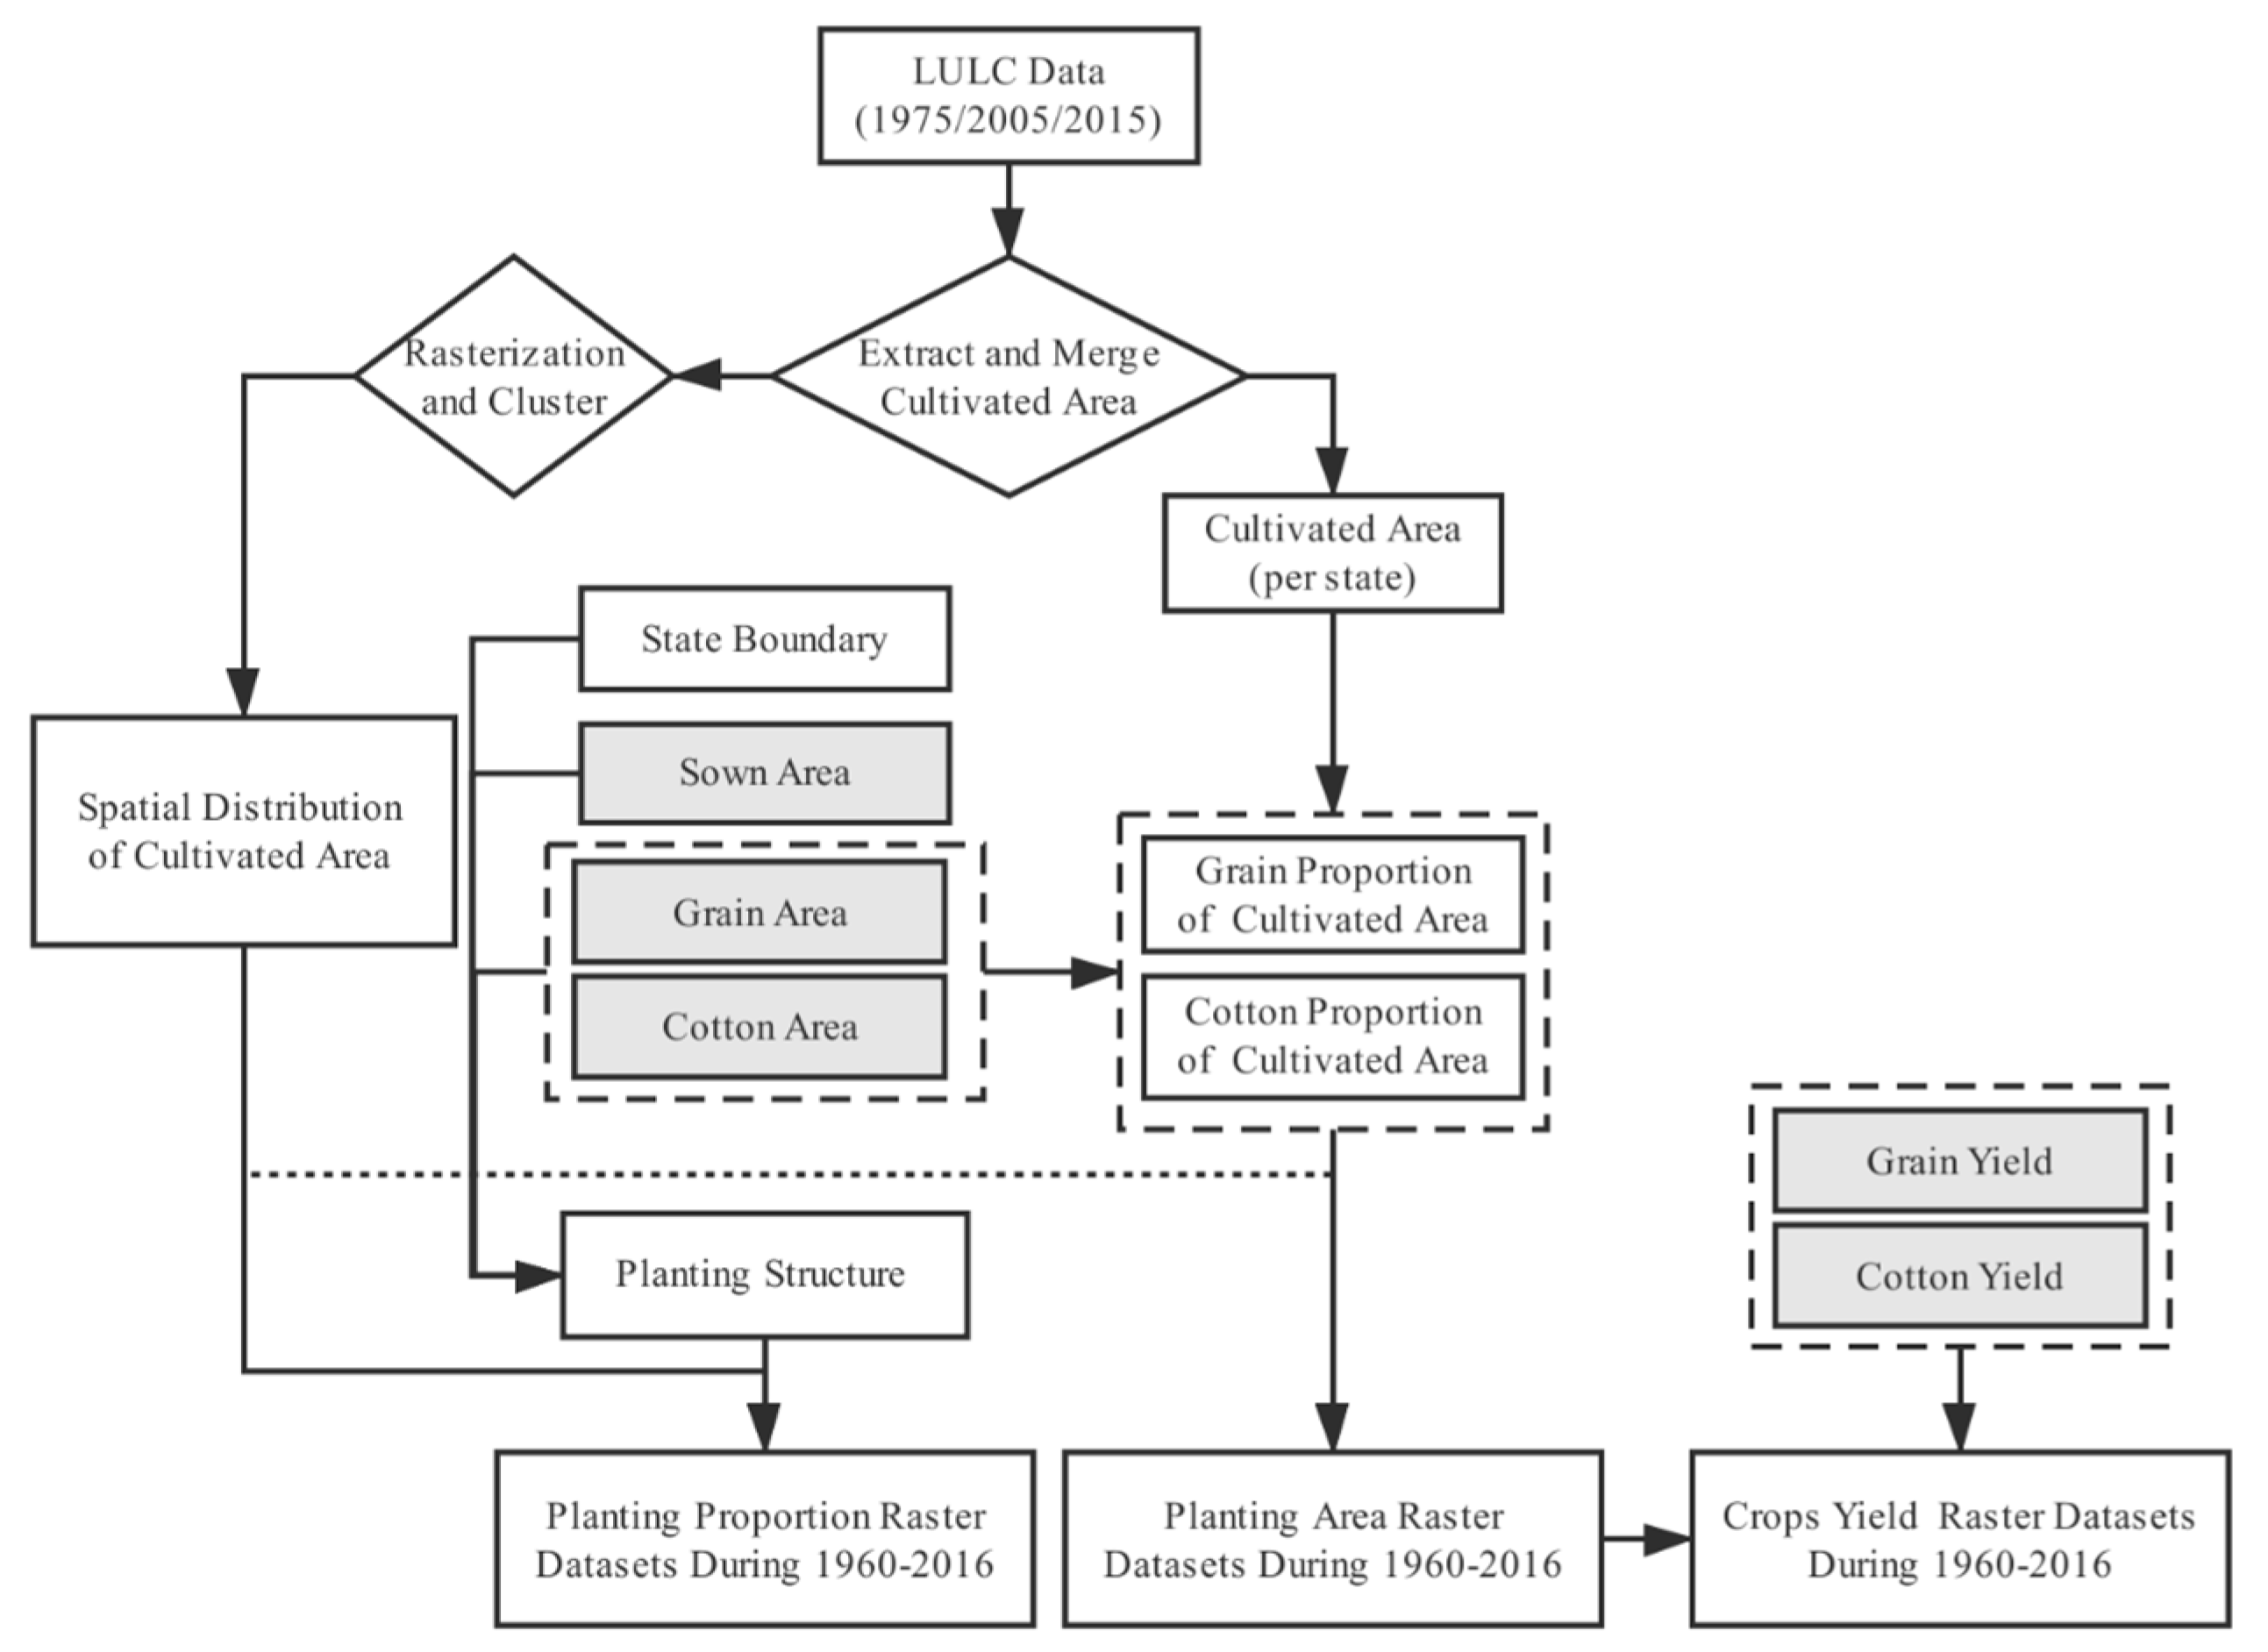
Based on the spatial analysis function in ArcGIS, the cultivated land area of three LULC datasets was extracted and merged, and the distribution range of the largest cultivated land in the five countries of Central Asia from 1960 to 2016 was obtained. Based on this, the arable land data were rasterized and clustered to generate 0.5 × 0.5 degree raster data. The proportions of grain and cotton were calculated and associated with arable land raster data. The 1960–2016 annual planting ratio (grain and cotton) raster dataset was produced. Similar to this process, a 1960–2016 annual planting area raster dataset and a 1960–2016 annual yield raster dataset were generated (Figure 3).

2.3.2. Calculate Crop Evapotranspiration, Virtual Water and Water Use Efficiency

The FAO’s recommended crop coefficient method has been widely accepted for calculating crop evapotranspiration [39]. This method is used to calculate the actual evapotranspiration of crops in this paper
ET = K c × ET 0
where ET represents the actual evapotranspiration of the crop (mm); Kc represents the crop coefficient of different growth stages; ET0 is the potential evapotranspiration (mm). The value of Kc is determined by local phenology. Due to the climate difference between northern and southern Central Asia, spring wheat is common in the northern region, and winter wheat is the main grain in the southern region. Spring wheat requires 90–110 days from planting to harvesting in northern Central Asia. The winter wheat needs 210–270 days [40] in southern Central Asia. Cotton is sown in early April and harvested in early October [41]. In addition, the crop growth period published by the FAO is referenced to determine the average growth period of the major crops and the crop coefficients of the corresponding growth period in Central Asia (Table 2).
ET 0 = 0.48 Δ ( R n G ) + γ × 900 T + 273 × U 2 ( e a e d ) Δ + γ ( 1 + 0.34 U 2 )
Reference crop evapotranspiration selected from the CRU’s latest dataset (CRU TS vs. 4.03), which is calculated on the basis of the FAO Penman–Monteith equation [42]. ET0 is the reference crop evapotranspiration (mm/day); Rn is the net radiation at the crop surface (MJ/(m2 day)); G is the soil heat flux (MJ/(m2 day)); T is the average air temperature (°C); U2 is the wind speed measured at 2 m height (m/s); ea is the saturation vapour pressure (kPa) and ed is the actual vapour pressure (kPa); Δ is the slope of the vapour pressure curve (kPa/°C); and γ is the psychrometric constant (kPa/°C).
We applied the approach from Hoekstra [43] to calculate virtual water, and substituted crop area for crop yield.
V W [ n , c ]   = T E T [ n , c ] A r e a [ n , c ]
Here, VW denotes the specific water demand of crop c in country n (m3); TET denotes the crop water requirement (m3/ha) and Area denotes the crop c area in country n (ton/ha). We assume that the crop yields in Central Asia are unstable and affected by many factors, while the crop area and the water consumption per hectare are relatively stable.
The formula for calculating the water use efficiency of crops is as follows
WUE = Y × 1000 ET
where WUE indicates the water use efficiency of crops (kg/m3); Y indicates crop yield (t/ha); and ET indicates the actual evapotranspiration of crops (m3/ha), which also represents the actual water consumption of farmlands.

3. Results

3.1. Temporal and Spatial Changes in Crop Planting Structures in Central Asia from 1960 to 2016

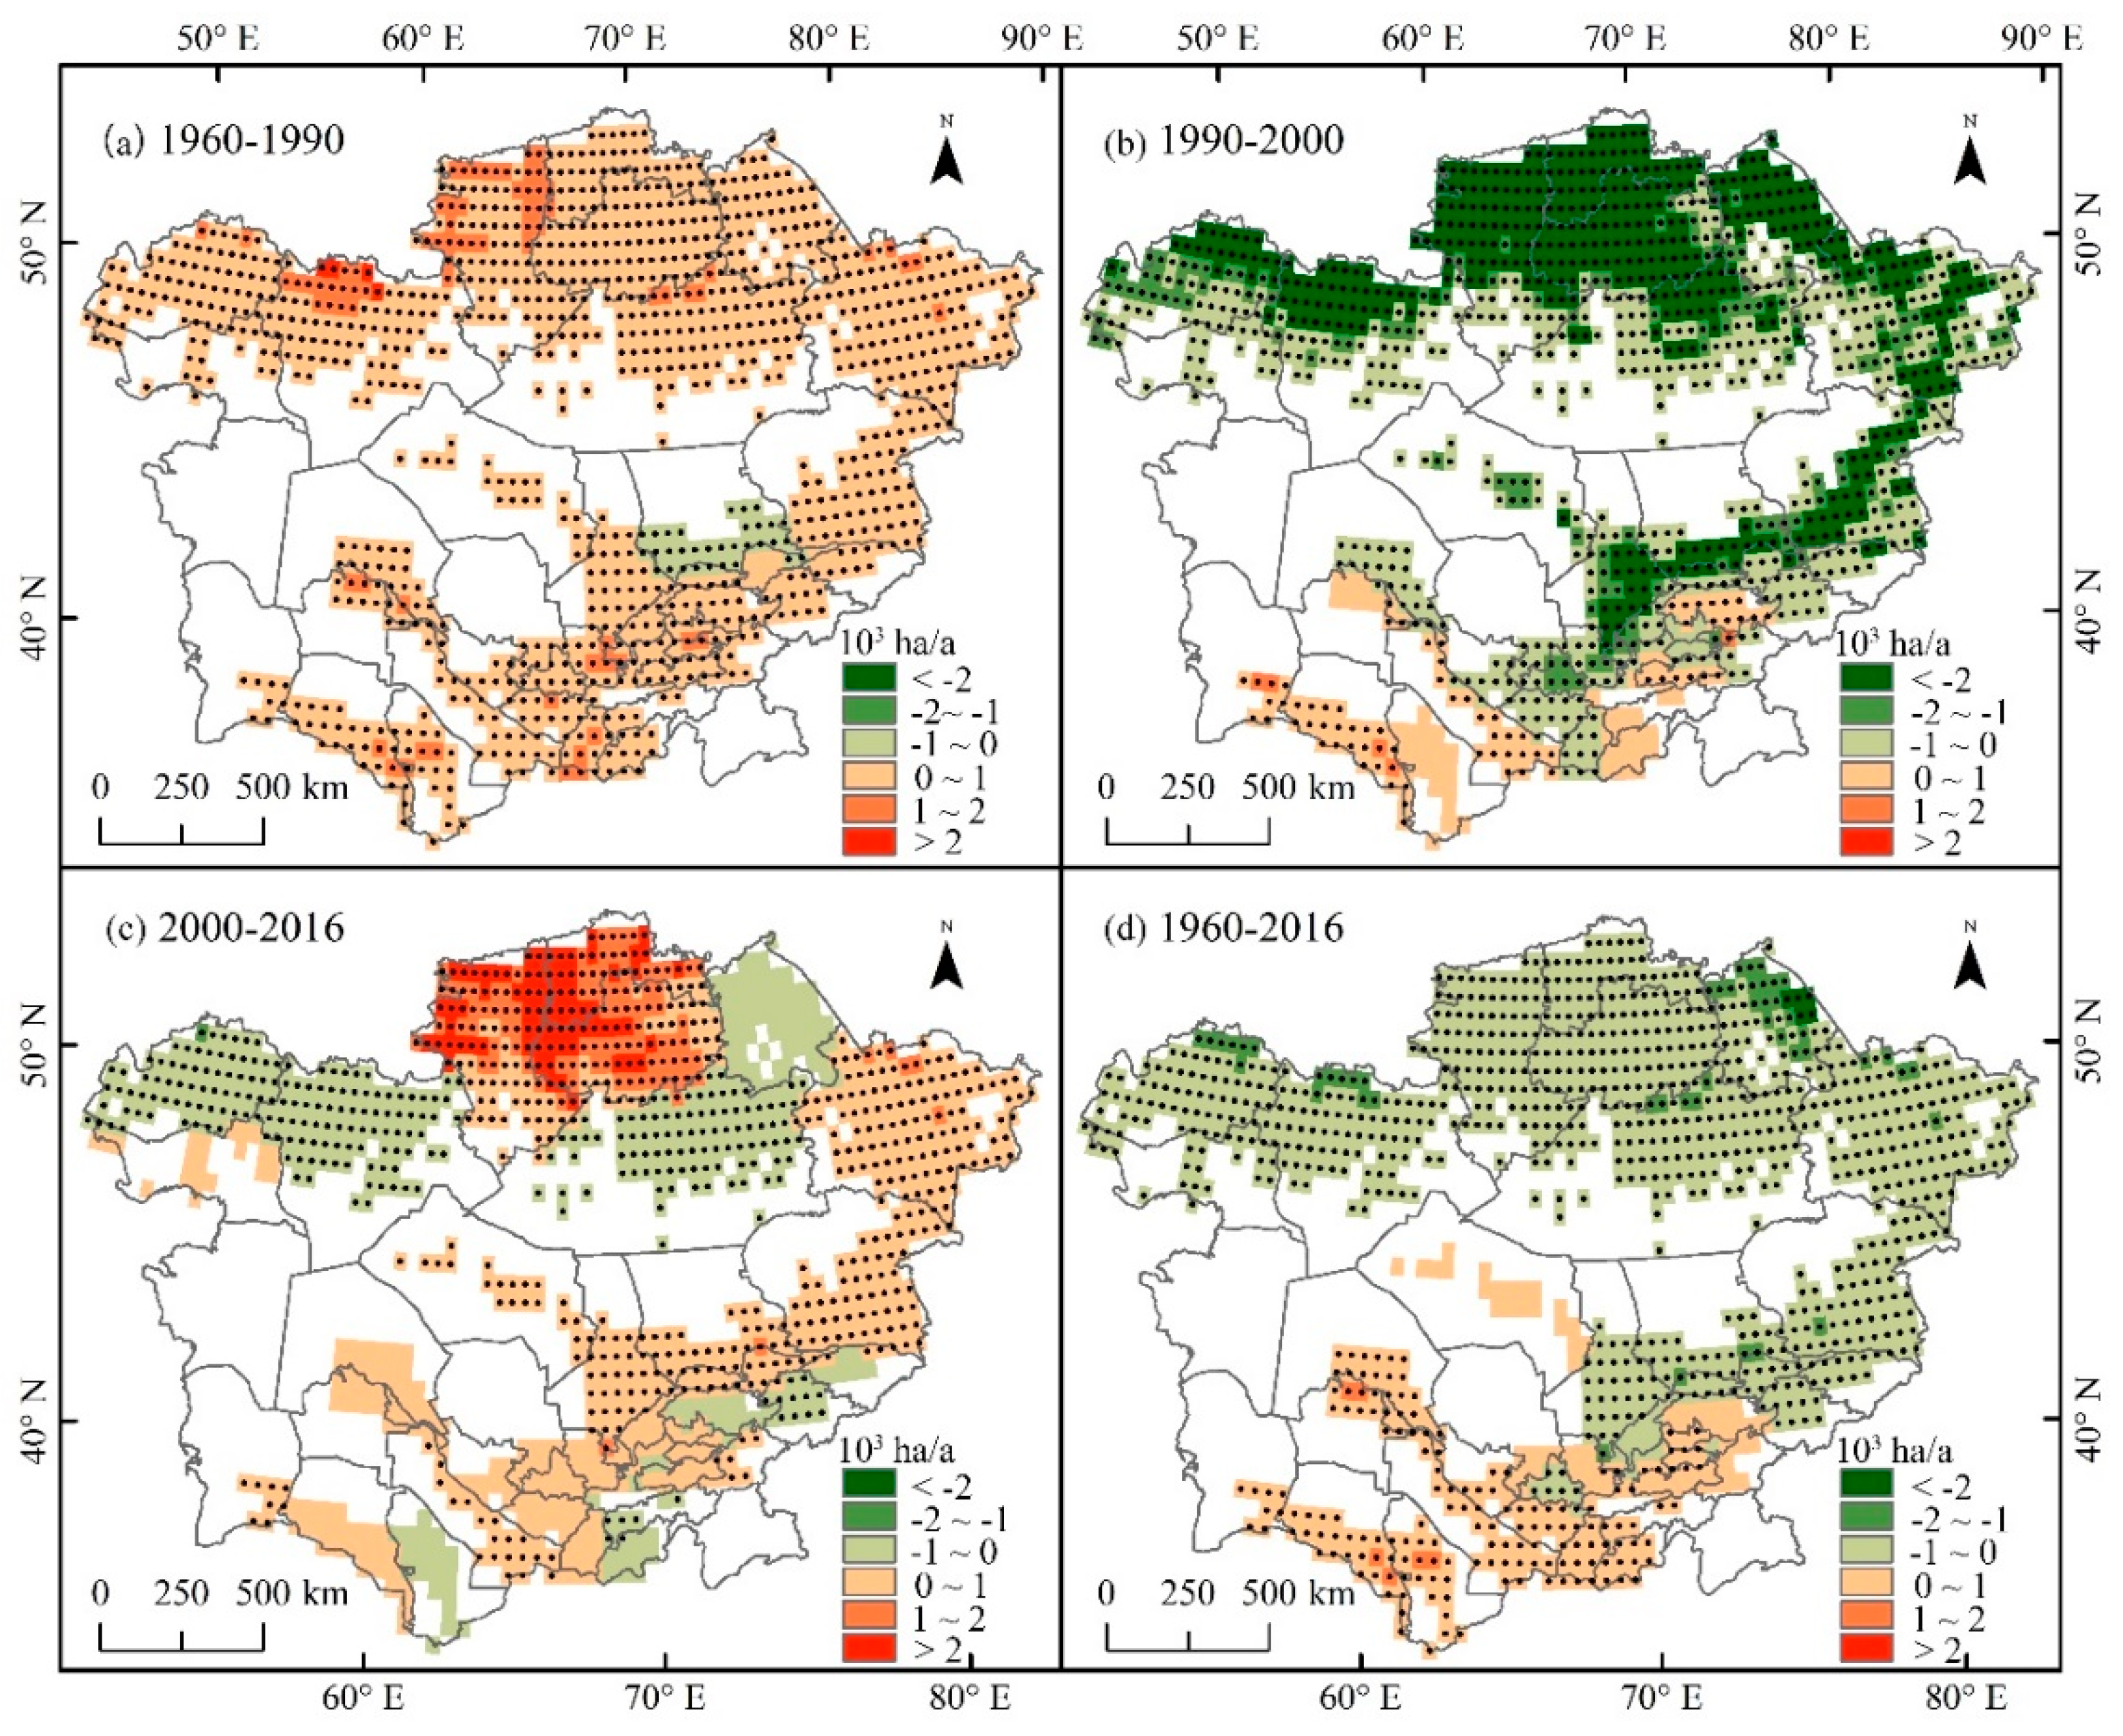
The sown area increased from 34.1 × 10⁶ to 42.7 × 10⁶ ha from 1960 to 1990 in Central Asia. Affected by the collapse of the Soviet Union, many arable lands were abandoned in Central Asia. In 2000, the sown area in Central Asia decreased by 45.0% compared with 1990 to only 23.5 × 10⁶ ha. In the 2000–2016 period, the sown area increased by 23.8% in Central Asia. Based on the changes in sown area in Central Asia, 1960 to 1990 was the expansion period, 1990 to 2000 was the reduction period, and 2000 to 2016 was the recovery period.
From 1960 to 1990 (Figure 4a), except for Zhambylsky State in the southern part of Kazakhstan, the sown area in Central Asia showed an increasing trend and, except for Chui State in the northern part of Kyrgyzstan, there was a significant increasing trend. From 1990 to 2000 (Figure 4b), the sown areas in Kazakhstan, Uzbekistan and Kyrgyzstan showed a significant downward trend; at the same time, Turkmenistan and Kyrgyzstan showed an increasing trend. From 2000 to 2016 (Figure 4c), the reduced sown area regions included four states in the northern part of Kazakhstan (West Kazakhstan, Aktyubinsk, Karaganda, and Pavlodar), northern Kyrgyzstan, Mary state of Turkmenistan, and Tajikistan. From 1960 to 2016 (Figure 4d), the spatial characteristics of the sown area in Central Asia increased in the north and decreased in the south.
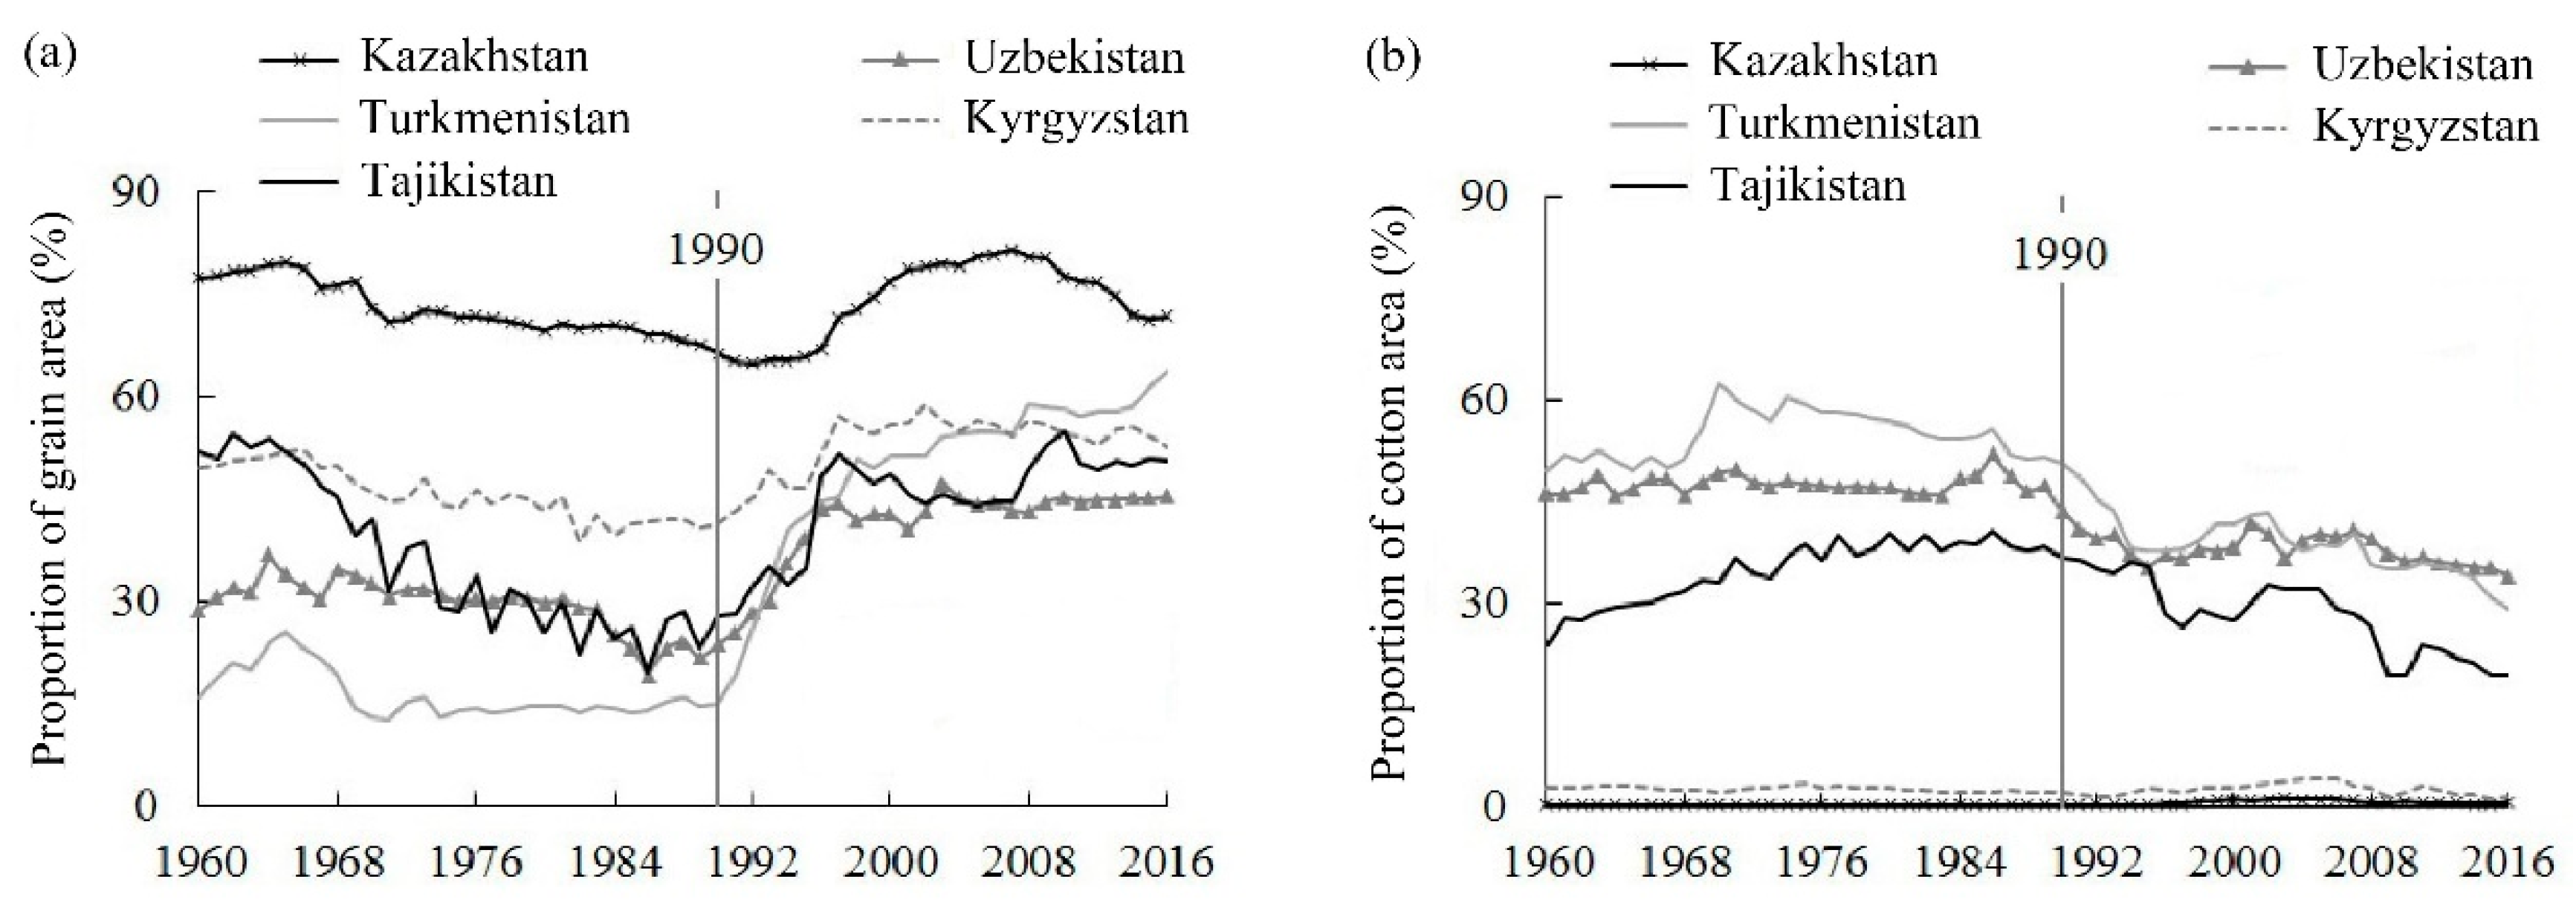
In addition to changes in sown area, the proportion of major crops (grain and cotton) in Central Asia also changed during the period 1960–2016 (Figure 5). As the country with the highest proportion of grain in the five Central Asian countries, Kazakhstan’s grain area ratio fell from 77.4% to 66.4% in 1960–1990, and the proportion returned to 71.7% in 2016. Turkmenistan, as the country with the lowest proportion of grain area, experienced rapid growth from 15.0% to 63.8% after the collapse of the Soviet Union. From 1960 to 2016, the proportion of cotton area in the five Central Asian countries changed. The cotton-planting ratios of Uzbekistan, Turkmenistan and Tajikistan, which are the main cotton production areas, increased before 1990 and decreased after 1990. Take Tajikistan as an example: from 1960 to 1990, the proportion of cotton area increased from 23.8% to 36.8%. Since 1990, the proportion of cotton area has decreased, and it was only 19.4% in 2016.

3.2. Water Consumption and Yield Changes in Central Asia from 1960 to 2016

Equation (4) shows that water consumption and yield determine crop water use efficiency. In this study, the calculated crop water consumption is the maximum water consumption without considering the water deficit condition. From 1960 to 2016, there was no significant change in the water consumption per hectare of grain and cotton in Central Asia, and the water consumption was 4326–5417 and 8155–9157 m3/ha, respectively. However, there are differences when comparing countries and crop types (Figure 6). The water consumption per hectare of grain and cotton in Turkmenistan is the highest, at 6764 and 9800 m3/ha, respectively. The water consumption per hectare of grain and cotton in Kyrgyzstan is 4114 and 6729 m3/ha, respectively, which is the lowest in Central Asia.
The yield of grain and cotton in Central Asia showed different characteristics. The grain yield increased from 0.9 to 1.9 t/ha in Central Asia during 1960–2016 (Figure 6b–f). According to the grain yield change trend, the five countries are divided into three categories: Kazakhstan, Uzbekistan and Tajikistan show higher growth rates after 1990; Kyrgyzstan shows lower growth rates after 1990; and the grain yield decreases in Turkmenistan after 1990. For Central Asia as a whole (Figure 6g), cotton yield increased from 1.9 to 2.6 t/ha during 1960–1990 and then decreased to 1.9 t/ha during 1990–2016. From 1960 to 1990, the cotton yield of the five Central Asian countries showed an increasing trend. According to the cotton yield change trend during 1990–2016, the five countries are divided into three categories: there was no significant change in cotton yield for Uzbekistan and Tajikistan (Figure 6l, respectively), cotton yield in Turkmenistan (Figure 6j) decreased significantly, and cotton yield in Kazakhstan (Figure 6h) and Kyrgyzstan (Figure 6k) increased.

3.3. Temporal Changes in Virtual Water in Central Asia from 1960 to 2016

The virtual water of grain and cotton of Central Asia increased from 109.4 × 10⁹ m3 in 1960 to 144.1 × 10⁹ m3 in 1990, then decreased to 96.5 × 10⁹ m3 in 2000, and increased to 108.2 × 10⁹ m3 in 2016. The virtual water of grain increased during 1960–1980, then decreased in the period 1980–2010, and has increased since 2010 (Figure 7a). Kazakhstan accounts for 75% of the virtual water of grain. Kazakhstan exports about 3.83 million tons of wheat every year and the wheat virtual water is about 4300 m3/ton. The export volume of wheat virtual water in Kazakhstan reaches 16.5 km3. By contrast, the other four countries in the region depend heavily on imported cereals. Cotton virtual water continued to increase from 1960 to 1990 and decreased after 1990 (Figure 7b). Among the five countries in Central Asia, Uzbekistan has the highest percentage of cotton virtual water, followed by Turkmenistan, accounting for 55% and 26%, respectively. The five Central Asian countries are all cotton exporters, of which Uzbekistan’s cotton exports are the largest. In 1992, Uzbekistan’s cotton exports reached 1.04 million tons. However, Uzbekistan has gradually reduced its cotton exports in recent years. In 2016, the cotton export volume was only 160,000 tons. The cotton virtual water is about 6500 m3/ton. The export volume of cotton virtual water in Uzbekistan has dropped from 6.8 to 1 km3 during 1992 to 2016.

3.4. Temporal and Spatial Changes in Crop Water Use Efficiency in Central Asia from 1960 to 2016

From 1960 to 2016, the grain water use efficiency in Central Asia increased from 0.22 to 0.39 kg/m3, showing an increasing trend from 1960 to 1990 (Figure 8a), in Central Asia, except for the four states of Kostanajsky, Akmolinsky, West Kazakhstan and Atyrausky in Kazakhstan. The grain water use efficiency in other regions showed an increasing trend. The increased trends were particularly marked in Uzbekistan, Turkmenistan and Kyrgyzstan. From 1990 to 2000 (Figure 8b), grain water use efficiency increased significantly in Uzbekistan but showed a significant downward trend in Turkmenistan. From 2000 to 2016 (Figure 8c), the grain water use efficiency in Central Asia showed a decreasing trend, except for Kostanajsky and Aktyubinsk in northern Kazakhstan and northern Kyrgyzstan. The increasing trends are significant in Uzbekistan, Turkmenistan and Tajikistan. From 1960 to 1990 (Figure 8d), the grain water use efficiency in all Central Asian countries showed an increasing trend, with Kyrgyzstan being the highest and Kazakhstan being the lowest. From 1990 to 2016, the grain water use efficiency in Uzbekistan and Tajikistan increased, which was consistent with Kyrgyzstan, reaching 0.69–0.71 kg/m3. In the same period, the grain water use efficiency in Kazakhstan and Turkmenistan was low (approximately 0.22 kg/m3), with no obvious change in trend.
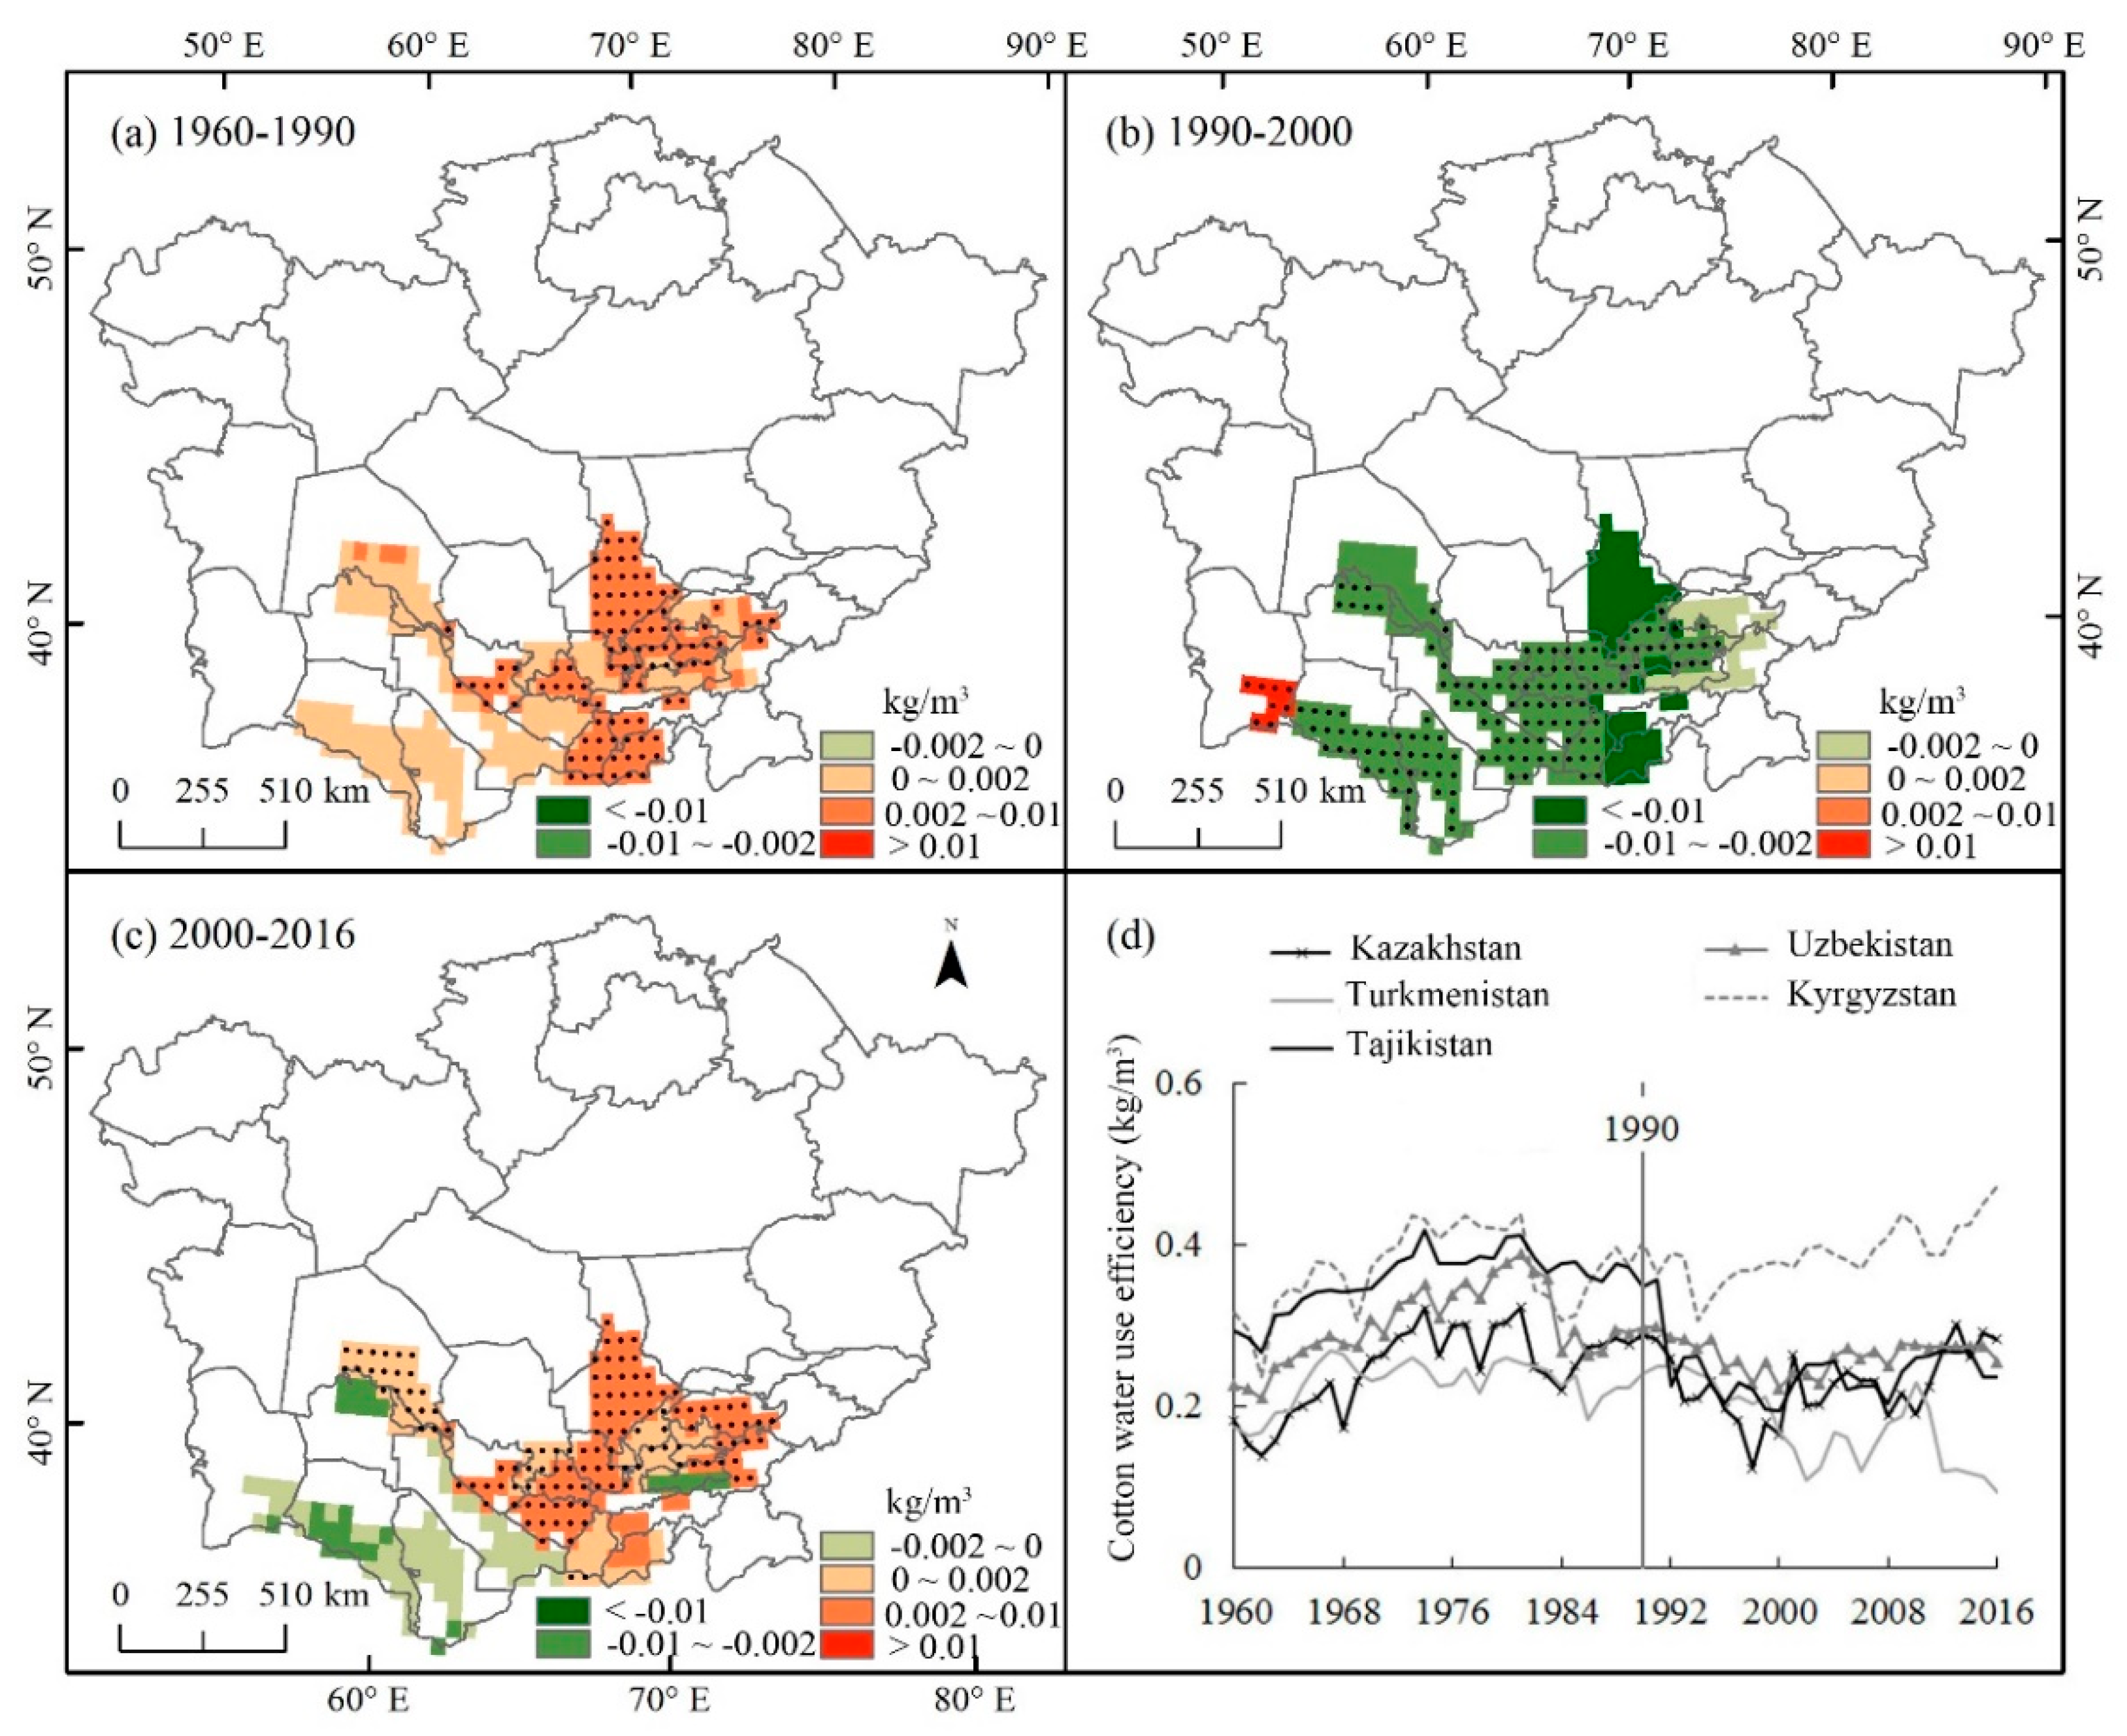
The cotton water use efficiency in Central Asia increased from 0.23 to 0.30 kg/m3 from 1960 to 1990 and has decreased since 1990, with only 0.22 kg/m3 in 2016. From 1960 to 2016, the cotton water use efficiency in Central Asia experienced a process of increasing first and then decreasing. From 1960 to 1990 (Figure 9a), the cotton water use efficiency in Central Asia showed an increasing trend, especially in the Ferghana Basin. From 1990 to 2000 (Figure 9b), the cotton water use efficiency in Central Asia showed a decreasing trend, except for Balkan in Turkmenistan. From 2000 to 2016 (Figure 9c), the cotton water use efficiency increased in most parts of Central Asia, except for Turkmenistan and Batken in Kyrgyzstan. From 1960 to 1990 (Figure 9d), the cotton water use efficiency in the five Central Asian countries showed an increasing trend. From 1990 to 2016, the cotton water use efficiency in Kyrgyzstan increased from 0.41 kg/m3 in 1990 and reached 0.48 kg/m3 in 2016. The remaining four countries showed a downward trend. The cotton water use efficiency in Turkmenistan experienced the most significant decrease, from 0.24 to 0.09 kg/m3 during 1990–2016.

4. Discussion

4.1. Comparison with Previous Studies

In this paper, the calculation results of grain water use efficiency in Central Asia from 2000 to 2016 are 0.24–0.39 kg/m3, and the cotton water use efficiency is 0.21–0.27 kg/m3. These results are lower than the results based on field observations (Table 3) and close to the results based on remote sensing estimates (Note 1 in Table 3). Considering the sample areas of those studies based on field observations located in the Ferghana Basin and Tashkent area, which have high farmland management levels and high yields; our result is the average of the whole sown area of Central Asia. Compared with the crop water use efficiency in arid and semiarid regions of China, the average wheat water use efficiency in the Heihe River Basin is 0.83 kg/m3, which is two to three times that of Central Asia. The crop water use efficiency in Central Asia has great potential for improvement. In this paper, the maximum evapotranspiration of crops is selected to calculate water use efficiency, which means sufficient water for crop growth, and water deficit scenarios are not considered. Therefore, there are some unavoidable gaps between the estimation of crop water use efficiency and the actual situation.

4.2. Analysis of Factors Affecting Crop water Use Efficiency in Central Asia

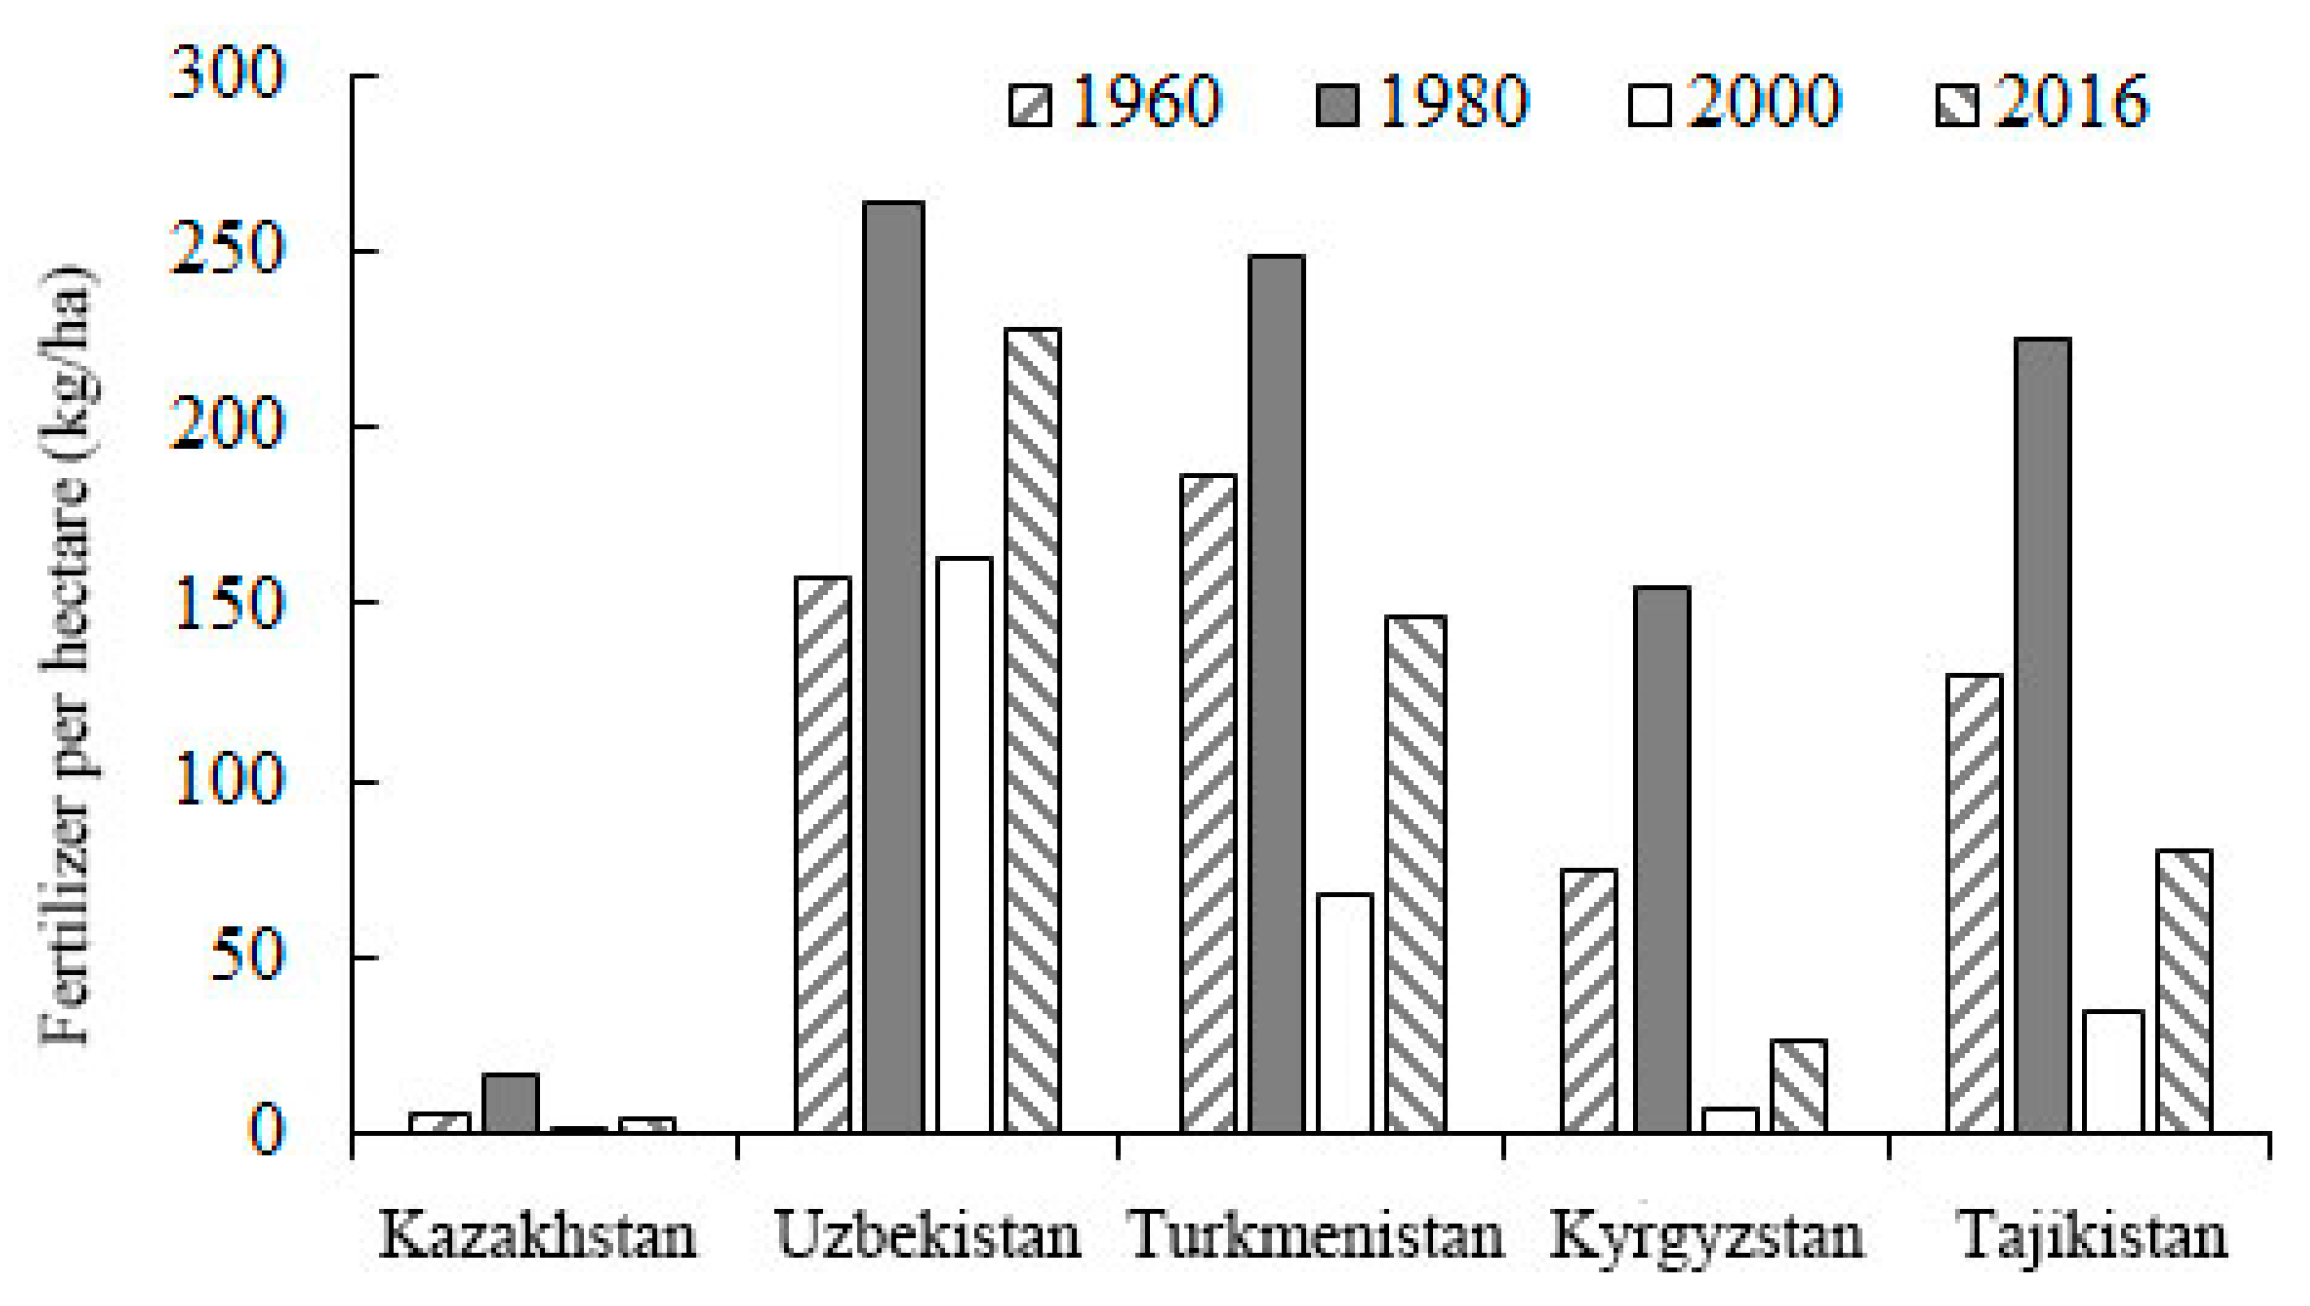
According to the results of Section 3.2, there has been no obvious change in crop water consumption per hectare in the five countries of Central Asia in the past 60 years. The main factor affecting crop water use efficiency is yield. Economic and technological factors such as chemical fertilizers, pesticides, improved seeds, and agricultural machinery affect crop yield. Moreover, natural disasters such as pests, diseases, and droughts have a negative impact on crop yield. Take chemical fertilizer as an example (Figure 10): in 1980, the usage amounts of mineral fertilizer per hectare in Uzbekistan, Turkmenistan and Tajikistan were 263, 248 and 225 kg/ha, respectively; the usage amounts of mineral fertilizer per hectare were reduced to 163, 67, and 34 kg/ha, respectively. The change in the usage amount of mineral fertilizer was consistent with the changing trend of cotton yield and had no significant relationship with grain yield. This is directly related to the Soviet government’s policy of supporting cotton production. Soil salinization can partly explain the decline in cotton yield in Turkmenistan and Uzbekistan since 1990. The soil salinization proportion of cultivated land in the two countries of the lower reaches of the Amu Darya is as high as 68% and 51%, while those of upstream Tajikistan and Kyrgyzstan are only 3% and 5%, respectively.

4.3. Policy Implications

The results of this study indicate that crop water use efficiency in Central Asia is mainly affected by yield and crop water consumption, and crop yield plays a leading role. In this regard, this study proposed ways to improve crop water use efficiency through increased crop yields, including policies and regulations, technical perspective and virtual water.
After the collapse of the Soviet Union, the five countries in Central Asia moved towards independent development and advocated land reform. Kazakhstan’s agricultural sector is recovering, partly thanks to the introduction of policies and laws encouraging agricultural growth and rural development. Uzbekistan implemented agricultural reforms and institutional transformations, while the impact of administrative and command systems on agriculture remains a major constraint on sustainable agricultural production management. In Turkmenistan, the situation is similar, with the government acting as a buyer and a production supervisor. All aspects related to crop production are determined by the government. Tajikistan and Kyrgyzstan are highly agrarian countries. Following the acceleration of land reforms, Kyrgyzstan’s agricultural growth has been impressive [45]. However, land reform has not lived up to its potential in Tajikistan. For the five Central Asian countries, the government management departments should issue corresponding agricultural policies to protect farmers’ land use rights, provide a more free and open input–output market, provide subsidized loans to agricultural enterprises. These measures will incentive farmers to invest in long-term soil improvement, increase soil productivity, and implement resource efficiency measures.
Except Kazakhstan, the agriculture of the other four countries rely heavily on irrigation, and water resources are mainly supplied by a variety of irrigation canals and drainage network. However, due to low technological capacity, these irrigation systems waste large amounts of water during crop irrigation, leading to the loss or degradation of fertile land, river degradation and other environmental consequences [46]. The government should strengthen infrastructure construction and improve irrigation conditions. Drip irrigation can increase crop yield while saving irrigation water, thereby increasing crop water use efficiency [47]. Meanwhile, promoting drip irrigation in Uzbekistan and Turkmenistan are conducive to the relief of the Aral Sea crisis. Kazakhstan is dominated by spring wheat, and grain production is largely restricted by climatic conditions. Using remote sensing technology to monitor drought, pests, land productivity [48], etc., can provide technical support for crop production [49]. Studies have shown that proper rotation is conducive to maintaining soil fertility in the area [50]. For Tajikistan and Kyrgyzstan, water resources are abundant. Planting vegetables and fruits with high economic value can increase residents’ income.
Uzbekistan and Turkmenistan are cotton producing areas. Cotton exports causing local water resources to be transferred in virtual water. Recently, both Uzbekistan and Turkmenistan have greatly reduced cotton exports. Uzbekistan plans to stop cotton exports by 2025. At the same time, it will process cotton in the country and produce value-added products, increase employment opportunities and create higher economic value. This move is conducive to the development of the country.

5. Conclusions

This paper uses GIS technology to spatialize the crop planting structure and yield of 43 states in five Central Asian countries and generate spatiotemporal datasets from 1960 to 2016. Based on the datasets, the FAO crop coefficient method is used to estimate crop water consumption and then calculates crop water use efficiency. This research extended the time series of crop water use efficiency over nearly 60 years in Central Asia and analyzed its temporal and spatial variations. The conclusions of our study are as follows:
  • In the past 60 years, the sown area of the five Central Asian countries has experienced three periods: expansion (1960–1990), reduction (1990–2000), and restoration (2000–2016);
  • The grain yield in Central Asia increased from 0.9 t/ha in 1960 to 1.9 t/ha in 2016. The cotton yield increased from 1.9 to 2.6 t/ha from 1960 to 1990, and has declined significantly since the 1990s. However, water consumption per hectare has not changed significantly; the consumption rate of grain and cotton is 4326–5417 m3/ha and 8155–9157 m3/ha, respectively. Compared with grain, cotton is a high water-consuming crop. Under constant sown areas, reducing the proportion of cotton area can reduce the total water consumption of crops;
  • The grain water use efficiency increased from 0.22 to 0.39 kg/m3 during 1960–2016. Tajikistan and Uzbekistan have experienced significant growth since 1990. The cotton water use efficiency increased from 0.23 to 0.30 kg/m3 during 1960–1990, has decreased since 1990, and was only 0.22 kg/m3 in 2016.
The crop water use efficiency is related to the rational utilization of water resources. This study shows that the key to improving crop water use efficiency is to increase crop yield. Therefore, we propose that the government improve agricultural infrastructure and provide training for famers. In addition, excellent seed selection, drip irrigation, mulching, and rotation can significantly increase crop yield. This paper calculated crop water use efficiency based on crop water consumption, ignoring the uncertainty of irrigated farmland. We expect to improve this study in later work.

Author Contributions

Conceptualization, methodology, formal analysis, and writing—original draft preparation, S.L.; writing—review and editing, H.W.; supervision and project administration, G.L. All authors have read and agreed to the published version of the manuscript.

Funding

This research was funded by the Strategic Priority Research Program of Chinese Academy of Science (No. XDA20060302) and the National Natural Science Foundation of China (No. U1803243).

Conflicts of Interest

The authors declare no conflict of interest.

References

  1. Chen, Y.; Li, Z.; Fang, G.; Li, W. Large hydrological processes changes in the transboundary rivers of central Asia. J. Geophys. Res. Atmos. 2018, 123, 5059–5069. [Google Scholar] [CrossRef]
  2. Sorg, A.; Mosello, B.; Shalpykova, G.; Allan, A.; Hill Clarvis, M.; Stoffel, M. Coping with changing water resources: The case of the Syr Darya river basin in Central Asia. Environ. Sci. Policy 2014, 43, 68–77. [Google Scholar] [CrossRef]
  3. Yu, Y.; Pi, Y.Y.; Yu, X.; Ta, Z.J.; Sun, L.X.; Disse, M.; Zeng, F.J.; Li, Y.M.; Chen, X.; Yu, R.D. Climate change, water resources and sustainable development in the arid and semi-arid lands of Central Asia in the past 30 years. J. Arid Land 2019, 11, 1–14. [Google Scholar] [CrossRef] [Green Version]
  4. Immerzeel, W.W.; van Beek, L.P.; Bierkens, M.F. Climate change will affect the Asian water towers. Science 2010, 328, 1382–1385. [Google Scholar] [CrossRef]
  5. Kubo, H.; Tateno, K.; Watanabe, A.; Kato, Y. Human and environmental symbiosis in Central Asia: through the water management of the aral sea basin crisis. Transit. Stud. Rev. 2009, 16, 467–478. [Google Scholar] [CrossRef]
  6. Issanova, G.; Jilili, R.; Abuduwaili, J.; Kaldybayev, A.; Saparov, G.; Yongxiao, G. Water availability and state of water resources within water-economic basins in Kazakhstan. Paddy Water Environ. 2018, 16, 183–191. [Google Scholar] [CrossRef]
  7. Lerman, Z.; Sedik, D. Transition to smallholder agriculture in Central Asia. J. Agrar. Chang. 2018, 18, 904–912. [Google Scholar] [CrossRef]
  8. Zhou, Y.; Zhang, L.; Xiao, J.; Williams, C.A.; Vitkovskaya, I.; Bao, A. Spatiotemporal transition of institutional and socioeconomic impacts on vegetation productivity in Central Asia over last three decades. Sci. Total Environ. 2019, 658, 922–935. [Google Scholar] [CrossRef]
  9. Wei, W.; Zhu, Y.; Li, H.; Zhang, K.; Wang, B.; Yang, X.; Shi, Z. Spatio-temporal reorganization of cropland development in Central Asia during the post-soviet era: A sustainable implication in Kazakhstan. Sustainability 2018, 10, 4042. [Google Scholar] [CrossRef] [Green Version]
  10. Suleimenov, M. Trends in the agriculture of Central Asia and implications for rangelands and croplands. In Novel Measurement and Assessment Tools for Monitoring and Management of Land and Water Resources in Agricultural Landscapes of Central Asia; Springer International: Basel, Switzerland, 2014. [Google Scholar]
  11. Ibragimov, N.; Evett, S.R.; Esanbekov, Y.; Kamilov, B.S.; Mirzaev, L.; Lamers, J.P.A. Water use efficiency of irrigated cotton in Uzbekistan under drip and furrow irrigation. Agric. Water Manag. 2007, 90, 112–120. [Google Scholar] [CrossRef]
  12. Kulmatov, R.; Groll, M.; Rasulov, A.; Soliev, I.; Romic, M. Status quo and present challenges of the sustainable use and management of water and land resources in Central Asian irrigation zones-The example of the Navoi region (Uzbekistan). Quat. Int. 2018, 464, 396–410. [Google Scholar] [CrossRef]
  13. Djumaboev, K.; Hamidov, A.; Anarbekov, O.; Gafurov, Z.; Tussupova, K. Impact of institutional change on irrigation management: A case study from Southern Uzbekistan. Water 2017, 9, 419. [Google Scholar] [CrossRef] [Green Version]
  14. Porkka, M.; Kummu, M.; Siebert, S.; Flörke, M. The role of virtual water flows in physical water scarcity: The case of Central Asia. Int. J. Water Resour. Dev. 2012, 28, 453–474. [Google Scholar] [CrossRef]
  15. Rudenko, I.; Bekchanov, M.; Djanibekov, U.; Lamers, J.P.A. The added value of a water footprint approach: Micro-and macroeconomic analysis of cotton production, processing and export in water bound Uzbekistan. Glob. Planet. Chang. 2013, 110, 143–151. [Google Scholar] [CrossRef]
  16. Zhang, J.; Chen, Y.; Li, Z. Assessment of efficiency and potentiality of agricultural resources in Central Asia. J. Geogr. Sci. 2018, 28, 1329–1340. [Google Scholar] [CrossRef] [Green Version]
  17. Sun, J.; Li, Y.P.; Suo, C.; Liu, Y.R. Impacts of irrigation efficiency on agricultural water-land nexus system management under multiple uncertainties—A case study in Amu Darya River basin, Central Asia. Agric. Water Manag. 2019, 216, 76–88. [Google Scholar] [CrossRef]
  18. Gilbert, M.E.; Hernandez, M.I. How should crop water-use efficiency be analyzed? A warning about spurious correlations. Field Crop. Res. 2019, 235, 59–67. [Google Scholar] [CrossRef]
  19. Blum, A. Drought resistance, water-use efficiency, and yield potential—are they compatible, dissonant, or mutually exclusive? Aust. J. Agric. Res. 2005, 56, 1159–1168. [Google Scholar] [CrossRef]
  20. Mbava, N.; Mutema, M.; Zengeni, R.; Shimelis, H.; Chaplot, V. Factors affecting crop water use efficiency: A worldwide meta-analysis. Agric. Water Manag. 2020, 228, 105878. [Google Scholar] [CrossRef]
  21. Zhou, X.; Wang, R.; Gao, F.; Xiao, H.; Xu, H.; Wang, D. Apple and maize physiological characteristics and water-use efficiency in an alley cropping system under water and fertilizer coupling in Loess Plateau, China. Agric. Water Manag. 2019, 221, 1–12. [Google Scholar] [CrossRef]
  22. Reddy, J.M.; Muhammedjanov, S.; Jumaboev, K.; Eshmuratov, D. Analysis of cotton water productivity in Fergana Valley of Central Asia. Agric. Sci. 2012, 3, 822–834. [Google Scholar] [CrossRef] [Green Version]
  23. Dağdelen, N.; Yılmaz, E.; Sezgin, F.; Gürbüz, T. Water-yield relation and water use efficiency of cotton (Gossypium hirsutum L.) and second crop corn (Zea mays L.) in western Turkey. Agric. Water Manag. 2006, 82, 63–85. [Google Scholar] [CrossRef]
  24. Gao, Y.; Duan, A.; Sun, J.; Li, F.; Liu, Z.; Liu, H.; Liu, Z. Crop coefficient and water-use efficiency of winter wheat/spring maize strip intercropping. Field Crop. Res. 2009, 111, 65–73. [Google Scholar] [CrossRef]
  25. Zhang, J.; Chen, Y.; Li, Z.; Song, J.; Fang, G.; Li, Y.; Zhang, Q. Study on the utilization efficiency of land and water resources in the Aral Sea Basin, Central Asia. Sustain. Cities Soc. 2019, 51, 101693. [Google Scholar] [CrossRef]
  26. Gao, H.; Yan, C.; Liu, Q.; Li, Z.; Yang, X.; Qi, R. Exploring optimal soil mulching to enhance yield and water use efficiency in maize cropping in China: A meta-analysis. Agric. Water Manag. 2019, 225, 105741. [Google Scholar] [CrossRef]
  27. Foster, T.; Brozović, N. Simulating crop-water production functions using crop growth models to support water policy assessments. Ecol. Econ. 2018, 152, 9–21. [Google Scholar] [CrossRef] [Green Version]
  28. Mbangiwa, N.C.; Savage, M.J.; Mabhaudhi, T. Modelling and measurement of water productivity and total evaporation in a dryland soybean crop. Agric. For. Meteorol. 2019, 266, 65–72. [Google Scholar] [CrossRef]
  29. Tan, M.; Zheng, L. Increase in economic efficiency of water use caused by crop structure adjustment in arid areas. J. Environ. Manag. 2019, 230, 386–391. [Google Scholar] [CrossRef]
  30. Pohanková, E.; Hlavinka, P.; Orság, M.; Takáč, J.; Kersebaum, K.C.; Gobin, A.; Trnka, M. Estimating the water use efficiency of spring barley using crop models. J. Agric. Sci. 2018, 156, 628–644. [Google Scholar] [CrossRef]
  31. Li, F.; Zhan, C.; Xu, Z.; Jiang, S.; Xiong, J. Remote sensing monitoring on regional crop water productivity in the Haihe River Basin. J. Geogr. Sci. 2013, 23, 1080–1090. [Google Scholar] [CrossRef]
  32. Xu, Z.; Chen, X.; Wu, S.R.; Gong, M.; Du, Y.; Wang, J.; Li, Y.; Liu, J. Spatial-temporal assessment of water footprint, water scarcity and crop water productivity in a major crop production region. J. Clean. Prod. 2019, 224, 375–383. [Google Scholar] [CrossRef]
  33. Weiss, M.; Jacob, F.; Duveiller, G. Remote sensing for agricultural applications: A meta-review. Remote Sens. Environ. 2020, 236, 111402. [Google Scholar] [CrossRef]
  34. Blatchford, M.L.; Mannaerts, C.M.; Zeng, Y.; Nouri, H.; Karimi, P. Status of accuracy in remotely sensed and in-situ agricultural water productivity estimates: A review. Remote Sens. Environ. 2019, 234, 111413. [Google Scholar] [CrossRef]
  35. Platonov, A.; Thenkabail, P.S.; Biradar, C.M.; Cai, X.; Gumma, M.; Dheeravath, V.; Cohen, Y.; Alchanatis, V.; Goldshlager, N.; Ben-Dor, E.; et al. Water productivity mapping (WPM) using landsat etm + data for the irrigated croplands of the Syrdarya River Basin in Central Asia. Sensors 2008, 8, 8156–8180. [Google Scholar] [CrossRef] [PubMed] [Green Version]
  36. Campos, I.; Neale, C.M.U.; Arkebauer, T.J.; Suyker, A.E.; Gonçalves, I.Z. Water productivity and crop yield: A simplified remote sensing driven operational approach. Agric. For. Meteorol. 2018, 249, 501–511. [Google Scholar] [CrossRef]
  37. Chen, Y.N.; Li, W.H.; Deng, H.J.; Fang, G.H.; Li, Z. Changes in Central Asia’s water tower: Past, present and future. Sci. Rep.-UK 2016, 6, 35458. [Google Scholar] [CrossRef] [PubMed]
  38. Hamidov, A.; Helming, K.; Balla, D. Impact of agricultural land use in Central Asia: A review. Agron. Sustain. Dev. 2016, 36, 6. [Google Scholar] [CrossRef] [Green Version]
  39. Kjaersgaard, J.H.; Plauborg, F.; Mollerup, M.; Petersen, C.T.; Hansen, S. Crop coefficients for winter wheat in a sub-humid climate regime. Agric. Water Manag. 2008, 95, 918–924. [Google Scholar] [CrossRef]
  40. Sommer, R.; Glazirina, M.; Yuldashev, T.; Otarov, A.; Ibraeva, M.; Martynova, L.; Bekenov, M.; Kholov, B.; Ibragimov, N.; Kobilov, R.; et al. Impact of climate change on wheat productivity in Central Asia. Agric. Ecosyst. Environ. 2013, 178, 78–99. [Google Scholar] [CrossRef]
  41. Conrad, C.; Schorcht, G.; Tischbein, B.; Davletov, S.; Sultonov, M.; Lamers, J.P. Agro-meteorological trends of recent climate development in Khorezm and implications for crop production. In Cotton, Water, Salts and Soums; Springer: Dordrecht, the Netherlands, 2012. [Google Scholar]
  42. Smith, M.; Allen, R.; Monteith, J.; Perrier, A.; Segeren, A. Report. expert consultation on revision of FAO methodologies for crop water requirements. In Proceedings of the Expert Consultation on Revision of FAO Methodologies for Crop Water Requirements, Rome, Italy, 28–31 May 1990. [Google Scholar]
  43. Hoekstra, A.Y.; Hung, P.Q. Globalisation of water resources: International virtual water flows in relation to crop trade. Glob. Environ. Chang. 2005, 15, 45–56. [Google Scholar] [CrossRef]
  44. Abdullaev, I.; Molden, D. Spatial and temporal variability of water productivity in the Syr Darya Basin, central Asia. Water Resour. Res. 2004, 40. [Google Scholar] [CrossRef]
  45. Mogilevskii, R.; Abdrazakova, N.; Bolotbekova, A.; Chalbasova, S.; Dzhumaeva, S.; Tilekeyev, K. The Outcomes of 25 Years of Agricultural Reforms in KYRGYZSTAN; Discussion Paper, Leibniz Institute of Agricultural Development: Halle, Germany, 2017. [Google Scholar]
  46. Duan, W.; Chen, Y.; Zou, S.; Nover, D. Managing the water-climate- food nexus for sustainable development in Turkmenistan. J. Clean. Prod. 2019, 220, 212–224. [Google Scholar] [CrossRef]
  47. Bekchanov, M.; Ringler, C.; Bhaduri, A.; Jeuland, M. Optimizing irrigation efficiency improvements in the Aral Sea Basin. Water Resour. Econ. 2016, 13, 30–45. [Google Scholar] [CrossRef]
  48. Alipbeki, O.; Kabzhanova, G.; Alipbekova, C. Use of operational remote sensing in forecasting of wheat production in nothern kazakhstan. Int. Multidiscip. Sci. GeoConference SGEM Surv. Geol. Min. Ecol. Manag. 2016, 2, 1051–1057. [Google Scholar]
  49. Safarova, A.; Khasankhanova, G. Water and Land Management and Agricultural Policy in Support of Food Security: The Amu Darya Delta in Uzbekistan; Case Study, Cornell University: Ithaca, NY, USA, 2016. [Google Scholar]
  50. Suleimenov, M.; Kiyas, A.; Kaskarbayev, Z. Replacement of summer fallow with oats and food legumes on black soils of northern Kazakhstan. Asian Aust. J. Plant Sci. Biotechnol. 2010, 4, 81–86. [Google Scholar]
Figure 1. The (a) administrative divisions, (b) perennial rainfall isolines, and (c) perennial January isotherms of the five Central Asian countries.
Sustainability 12 00572 g001
Figure 2. Crop planting structure in five Central Asian countries in 2016.
Sustainability 12 00572 g002
Figure 3. Flow chart of the production of planting structure, planting area and output in the five Central Asian countries from 1960 to 2016.
Sustainability 12 00572 g003
Figure 4. Spatial distribution of the changing rates of the annual sown area in five Central Asian countries during (a) 1960–1990, (b) 1990–2000, (c) 2000–2016, and (d) 1960–2016 (▪ Significantly correlated at the 0.05 level).
Sustainability 12 00572 g004
Figure 5. Temporal changes in crops planting structure in five Central Asian countries from 1960–2016: (a) grain and (b) cotton.
Sustainability 12 00572 g005
Figure 6. Water consumption per hectare and yield of grain (af) and cotton (gl) in five Central Asian countries from 1960 to 2016.
Sustainability 12 00572 g006
Figure 7. Annual average virtual water of grain (a) and cotton (b) in five Central Asian countries from 1960 to 2016.
Sustainability 12 00572 g007
Figure 8. Spatial distribution of the changing rates of the annual grain water use efficiency in five Central Asian countries during (a) 1960–1990, (b) 1990–2000, and (c) 2000–2016. (d) Temporal changes in grain water use efficiency in five Central Asian countries during 1960–2016 (▪ Significantly correlated at the 0.05 level).
Sustainability 12 00572 g008
Figure 9. Spatial distribution of the changing rates of the annual cotton water use efficiency in five Central Asian countries during (a) 1960–1990, (b) 1990–2000, and (c) 2000–2016. (d) Temporal changes in cotton water use efficiency in the five Central Asian countries during 1960–2016 (▪ Significantly correlated at the 0.05 level).
Sustainability 12 00572 g009
Figure 10. Fertilizer per hectare of cultivated land in the five Central Asian countries from 1960 to 2016.
Sustainability 12 00572 g010
Table 1. Data used for the calculation of crop water use efficiency in the five Central Asian countries.
DataDescriptionSpatial ResolutionPeriodSource
MapMap before the collapse of the Soviet Unionstate1990Data from 《Atlas of the Soviet socialist republic》
Map of the five Central Asian countries2010《World country map》
Meteorological DataTemperature and potential evapotranspiration500 m1960–2016https://crudata.uea.ac.uk/cru/data
LULC DataSpatial distribution data of cultivated land300 m1975, 2005, 2015Visual interpretation from Landsat data
Agricultural Statistics DataSown area, grain area, and cotton areastate1960–2016Statistical yearbook 1
Grain yield and cotton yield state1960–2016
1 1960–1987 data from the Soviet Statistical Yearbook in Russian; 1988–1990 data from the Commonwealth of Independent States (CIS) Statistical Commission; 1991–2016 data from National Statistical Committee of the five Central Asian countries.
Table 2. Crop coefficients of major crops in the five Central Asian countries.
CropsGrowth Period and Crop Coefficient
Initial Growth PeriodKcRapid Growth PeriodKcMidterm Growth PeriodKcMaturity PeriodKc
Spring wheat/Barley/Oats4/15–4/300.355/1–5/250.755/26–7/101.157/10–8/30.45
Winter wheat10/1–3/200.353/21–4/200.754/21–6/141.156/15–7/150.45
Rice5/10–6/91.056/10–7/101.107/11–9/101.209/11–10/100.80
Maize6/1–6/200.406/21–7/250.807/26–9/41.159/5–10/50.70
Cotton4/10–5/100.455/11–6/300.757/1–8/251.158/26–10/100.75
Table 3. Comparison of the research results of crop water use efficiency in Central Asia and adjacent areas.
Study AreaMethodologyTimeCrop Crop Water Use Efficiency (kg/m3)Reference
Syr Darya BasinSite observation1999–2001Cotton0.40–0.75Abdullaev I [44]
Fergana BasinSite observation2009–2010Cotton0.38–0.89Reddy J M [22]
Syr Darya Basin 1Remote sensing and surface
energy balance model
2006Cotton0–0.54Platonov A [35]
Aral Sea BasinStatistics2000–2014Grain0.88Zhang J [25]
Cotton0.45
Heihe Basin in ChinaFarmer survey and CROPWAT model2013–2015Grain0.83Tan M [29]
Central AsiaRemote sensing and statistics2000–2016Grain0.24–0.39Our study
Cotton0.21–0.27
1 The crop water use efficiency for the study area demonstrated a wide variations (0–0.54 kg/m3) with overwhelming proportion (87%) of the area having crop water use efficiency less than 0.30 kg/m3, 11% of the area having crop water use efficiency in range of 0.30–0.36 kg/m3, and only 2% of the area with crop water use efficiency greater than 0.36 kg/m3.