Article

Evaluation of Climatic and Anthropogenic Impacts on Dust Erodibility: A Case Study in Xilingol Grassland, China

1
Arid Land Research Center, Tottori University, Tottori 680-0001, Japan
2
School of Economics and Management, Inner Mongolia Agricultural University, Hohhot 010010, China
*
Author to whom correspondence should be addressed.
Sustainability 2020, 12(2), 629; https://doi.org/10.3390/su12020629
Submission received: 11 December 2019 / Revised: 4 January 2020 / Accepted: 13 January 2020 / Published: 15 January 2020
(This article belongs to the Special Issue Soil Erosion and the Sustainable Management of the Landscape)

Abstract

:
Aeolian dust is dependent on erosivity (i.e., wind speed) and erodibility (i.e., land surface conditions). The effect of erodibility on dust occurrence remains poorly understood. In this study, we proposed a composite erodibility index (dust occurrence ratio, DOR) and examined its interannual variation at a typical steppe site (Abaga-Qi) in Xilingol Grassland, China, during spring of 1974–2018. Variation in DOR is mainly responsible for dust occurrence (R2 = 0.80, p-value < 0.001). During 2001–2018, DOR values were notably higher than those during 1974–2000. There was also a general declining trend with fluctuations. This indicates that the land surface conditions became vulnerable to wind erosion but was gradually reversed with the implementation of projects to combat desertification in recent years. To understand the relative climatic and anthropogenic impacts on erodibility, multiple regression was conducted between DOR and influencing factors for the period of 2001–2018. Precipitation (spring, summer, and winter) and temperature (summer, autumn, and winter), together with livestock population (June) explained 82% of the variation in DOR. Sheep and goat population made the greatest contribution. Therefore, reducing the number of sheep and goat could be an effective measure to prevent dust occurrence in Xilingol Grassland.

1. Introduction

Aeolian dust is one of the serious eco-environmental and social–economic problems in source regions and downwind regions (e.g., [1]). It has various damaging effects, such as through adversely affecting air pollution, causing harm to human health, directly and indirectly affecting the climate system (e.g., [2,3]). Clarifying the mechanism of dust occurrence is critical to preventing these damaging effects.
Aeolian dust, which results from wind erosion, is dependent on erosivity and erodibility. Erosivity is the direct force causing dust emission and is expressed as wind speed. Numerous studies have analyzed the relationship between erosivity and dust occurrence. Kurosaki and Mikami [4] suggest that frequent dust occurrence in 2000–2002 in East Asia was primarily caused by frequent strong winds. This positive correlation was described in Lee and Kim [5] by investigating dust occurrence and strong wind during the period from 1996 to 2007 over the source regions of Asia dust. For long-term spatiotemporal characteristics, a gradual reduction in wind speed was the main cause for the decreasing trend in dust occurrence in most regions of northern China during 1960–2007 [6]. However, the responsibility of erosivity for the interannual variation in dust occurrence mainly appears in desert regions, whereas erodibility plays a more important role in other regions [7].
Erodibility is the susceptibility of land surface to wind erosion and is influenced by various factors such as vegetation cover, soil moisture, and snow cover. The land surface conditions of temperate grasslands are more sensitive to both climate change and anthropogenic disturbance than those of deserts; thus, their erodibility is more complicated (e.g., [8]). Based on meteorological observation data of dust, the frequency of dust occurrence in the Mongolian and Inner Mongolian grasslands increased in the 2000s (e.g., [9,10]). Igarashi et al. [11] suggested that there would be a shift of source areas for Asian dust from the arid zone to the desert–steppe zone. Variations in erodibility, rather than erosivity, caused this change [7,11]. Due to a lack of continuous observation data of erodibility factors, there are still uncertainties in erodibility and its relationship with dust occurrence.
To analyze land surface conditions, remote sensing data of the normalized difference vegetation index (NDVI) have been widely used. For example, Lee and Sohn [12] examined dust occurrence and surface vegetation over China and Mongolia during the period of 1974–2007. They found that degraded surface vegetation (i.e., decrease in NDVI) led to an increasing trend in dust occurrence. However, erodibility affects dust occurrence through various factors (e.g., soil characteristics, snow cover), so that a composite erodibility index is expected. Kurosaki et al. [13] calculated threshold wind speed—which is the minimum wind speed required for dust emission—as an erodibility index. They demonstrated that lower values of threshold wind speed in the Mongolia grasslands during the 2000s resulted in a high frequency of dust occurrence. Shinoda et al. [8] suggested that dead leaves of grass in spring that remained from the preceding summer can play a role as a protective layer, thus increasing threshold wind speed and finally suppressing dust occurrence. This dead-leaf hypothesis has also been proposed by Kurosaki et al. [14] by using normalized dust occurrence frequency, which is the ratio of dust occurrence frequency to strong wind frequency. This erodibility index was the same as in Kimura et al. [15] and Wu et al. [7] except that a different value was used for the threshold wind speed. Although erodibility is the major factor effecting dust occurrence in the Mongolian and Xilingol grasslands, Wu et al. [7] demonstrated that the controlling erodibility factor for interannual variations in dust occurrence during the period of 1999–2013 differed from region to region. One possible reason is the different grazing patterns, i.e., settled grazing activities in Xilingol Grassland versus traditional nomadic grazing in Mongolian grasslands. Additionally, the dust occurrence process was influenced by grazing intensity, which is different in Xilingol and Mongolian Grasslands [16].
Since 2000, the Chinese government has implemented a series of nationwide policies and projects, including in Inner Mongolia, to combat aeolian desertification and/or dust occurrence. For instance, the Grazing Forbidden Project is intended to relieve grazing pressure in grasslands. Various measures have been suggested for grazing management, such as reducing the number of livestock to manage grazing activities [17]. Some researchers have suggested that the environmental policies and projects initiated by the government have successfully dealt with desertification and dust occurrence (e.g., [18,19]), but their success is debated (e.g., [20,21]). Objectively evaluating the effectiveness of restoration efforts is crucial so that appropriate measures can be implemented.
In this study, we investigated interannual variations in dust occurrence and its erosivity and erodibility at a typical steppe site (Abaga-Qi) in Xilingol Grassland during the period of 1974–2018. To understand the mechanism(s) underlying dust erodibility after the implementation of restoration projects aimed at combating desertification and dust, we conducted a multiple regression analysis of climatic variables (precipitation and temperature) and an anthropogenic variable (livestock number) on recent variations (2001–2018) in a proposed erodibility index. Through this analysis, we quantitatively evaluated their relative contributions to the interannual variation in erodibility and the potential of livestock reduction as a mitigation measure for depressing dust occurrence.

2. Materials and Methods

2.1. Study Region

Abaga-Qi is a county located in Xilingol Grassland, Inner Mongolia. It has a semi-arid temperate continental climate, with a mean annual temperature of 0.7 °C and mean annual precipitation of 244.7 mm. The area of Abaga-Qi is 27,474 km2, 95.9% of which is covered by typical steppe based on the classification map of vegetation type referred to in Li et al. [22]. There is a SYNOP meteorological observation site at Abaga-Qi (44.01 ° N, 114.57 ° E), as shown in Figure 1.

2.2. Meteorological Data and an Erodibility Index (DOR)

Data of dust occurrence and wind speed were derived from SYNOP 3-hourly weather reports during the period of 1974–2018 [23]. Dust occurrence is defined as blowing dust and dust storm, which was extracted from the present weather codes of ww = 07 and 08, and ww = 09, 30–35, and 98, respectively. We intended to analyze dust occurrences around the SYNOP observatory. Therefore, floating dust (ww = 06), which is considered as advected dust, was not taken into consideration. The frequency of dust occurrence (DOF) was calculated as the ratio of observation numbers of dust occurrence to the total number of observation records during a given period and was expressed as percentage. Strong wind was defined as a wind speed exceeding the threshold wind speed of 6.5 m s−1, which is an often used threshold value for dust emission in arid and semi-arid regions (e.g., [24]). Calculation of the frequency of strong wind (SWF) was similar with that of DOF. SWF is the erosivity index for dust occurrence. Seasonal data of DOF and SWF in spring (March to May) were examined since it is the main season for dust occurrence.
In the current study, we proposed a dust occurrence ratio as an aeolian erodibility index (dust occurrence ratio (DOR)), which was calculated as a ratio of DOF to SWF (DOR = DOF/SWF). DOR explains the probability of dust occurrence at a given wind condition. Normalized by SWF, a high value of DOR indicates a vulnerable soil and land surface to wind erosion, namely, a tendency for frequent dust occurrence.
Meteorological data of precipitation amount and temperature were obtained from the Chinese National Meteorological Center. Accumulated precipitation amount and mean temperature for spring (March to May), summer (June to August), autumn (September to November), and winter (December to January) were examined. Data of the spring season were in the same period as those of DOF (1974–2018), while those of other seasons were one year earlier than those of DOF (1973–2017).

2.3. Standardized Precipitation Evapotranspiration Index (SPEI)

The standardized precipitation evapotranspiration index (SPEI) is an index proposed by Vicente et al. [25] to analyze the trend of droughts at different time scales. It was calculated as the difference between precipitation and potential evapotranspiration (PET). For the calculation of PET, we used the Thornthwaite equation [26], which is based on temperature. The annual variations of drought at Abaga-Qi were investigated by the SPEI for a 12-month time scale.

2.4. Statistical Data of Livestock

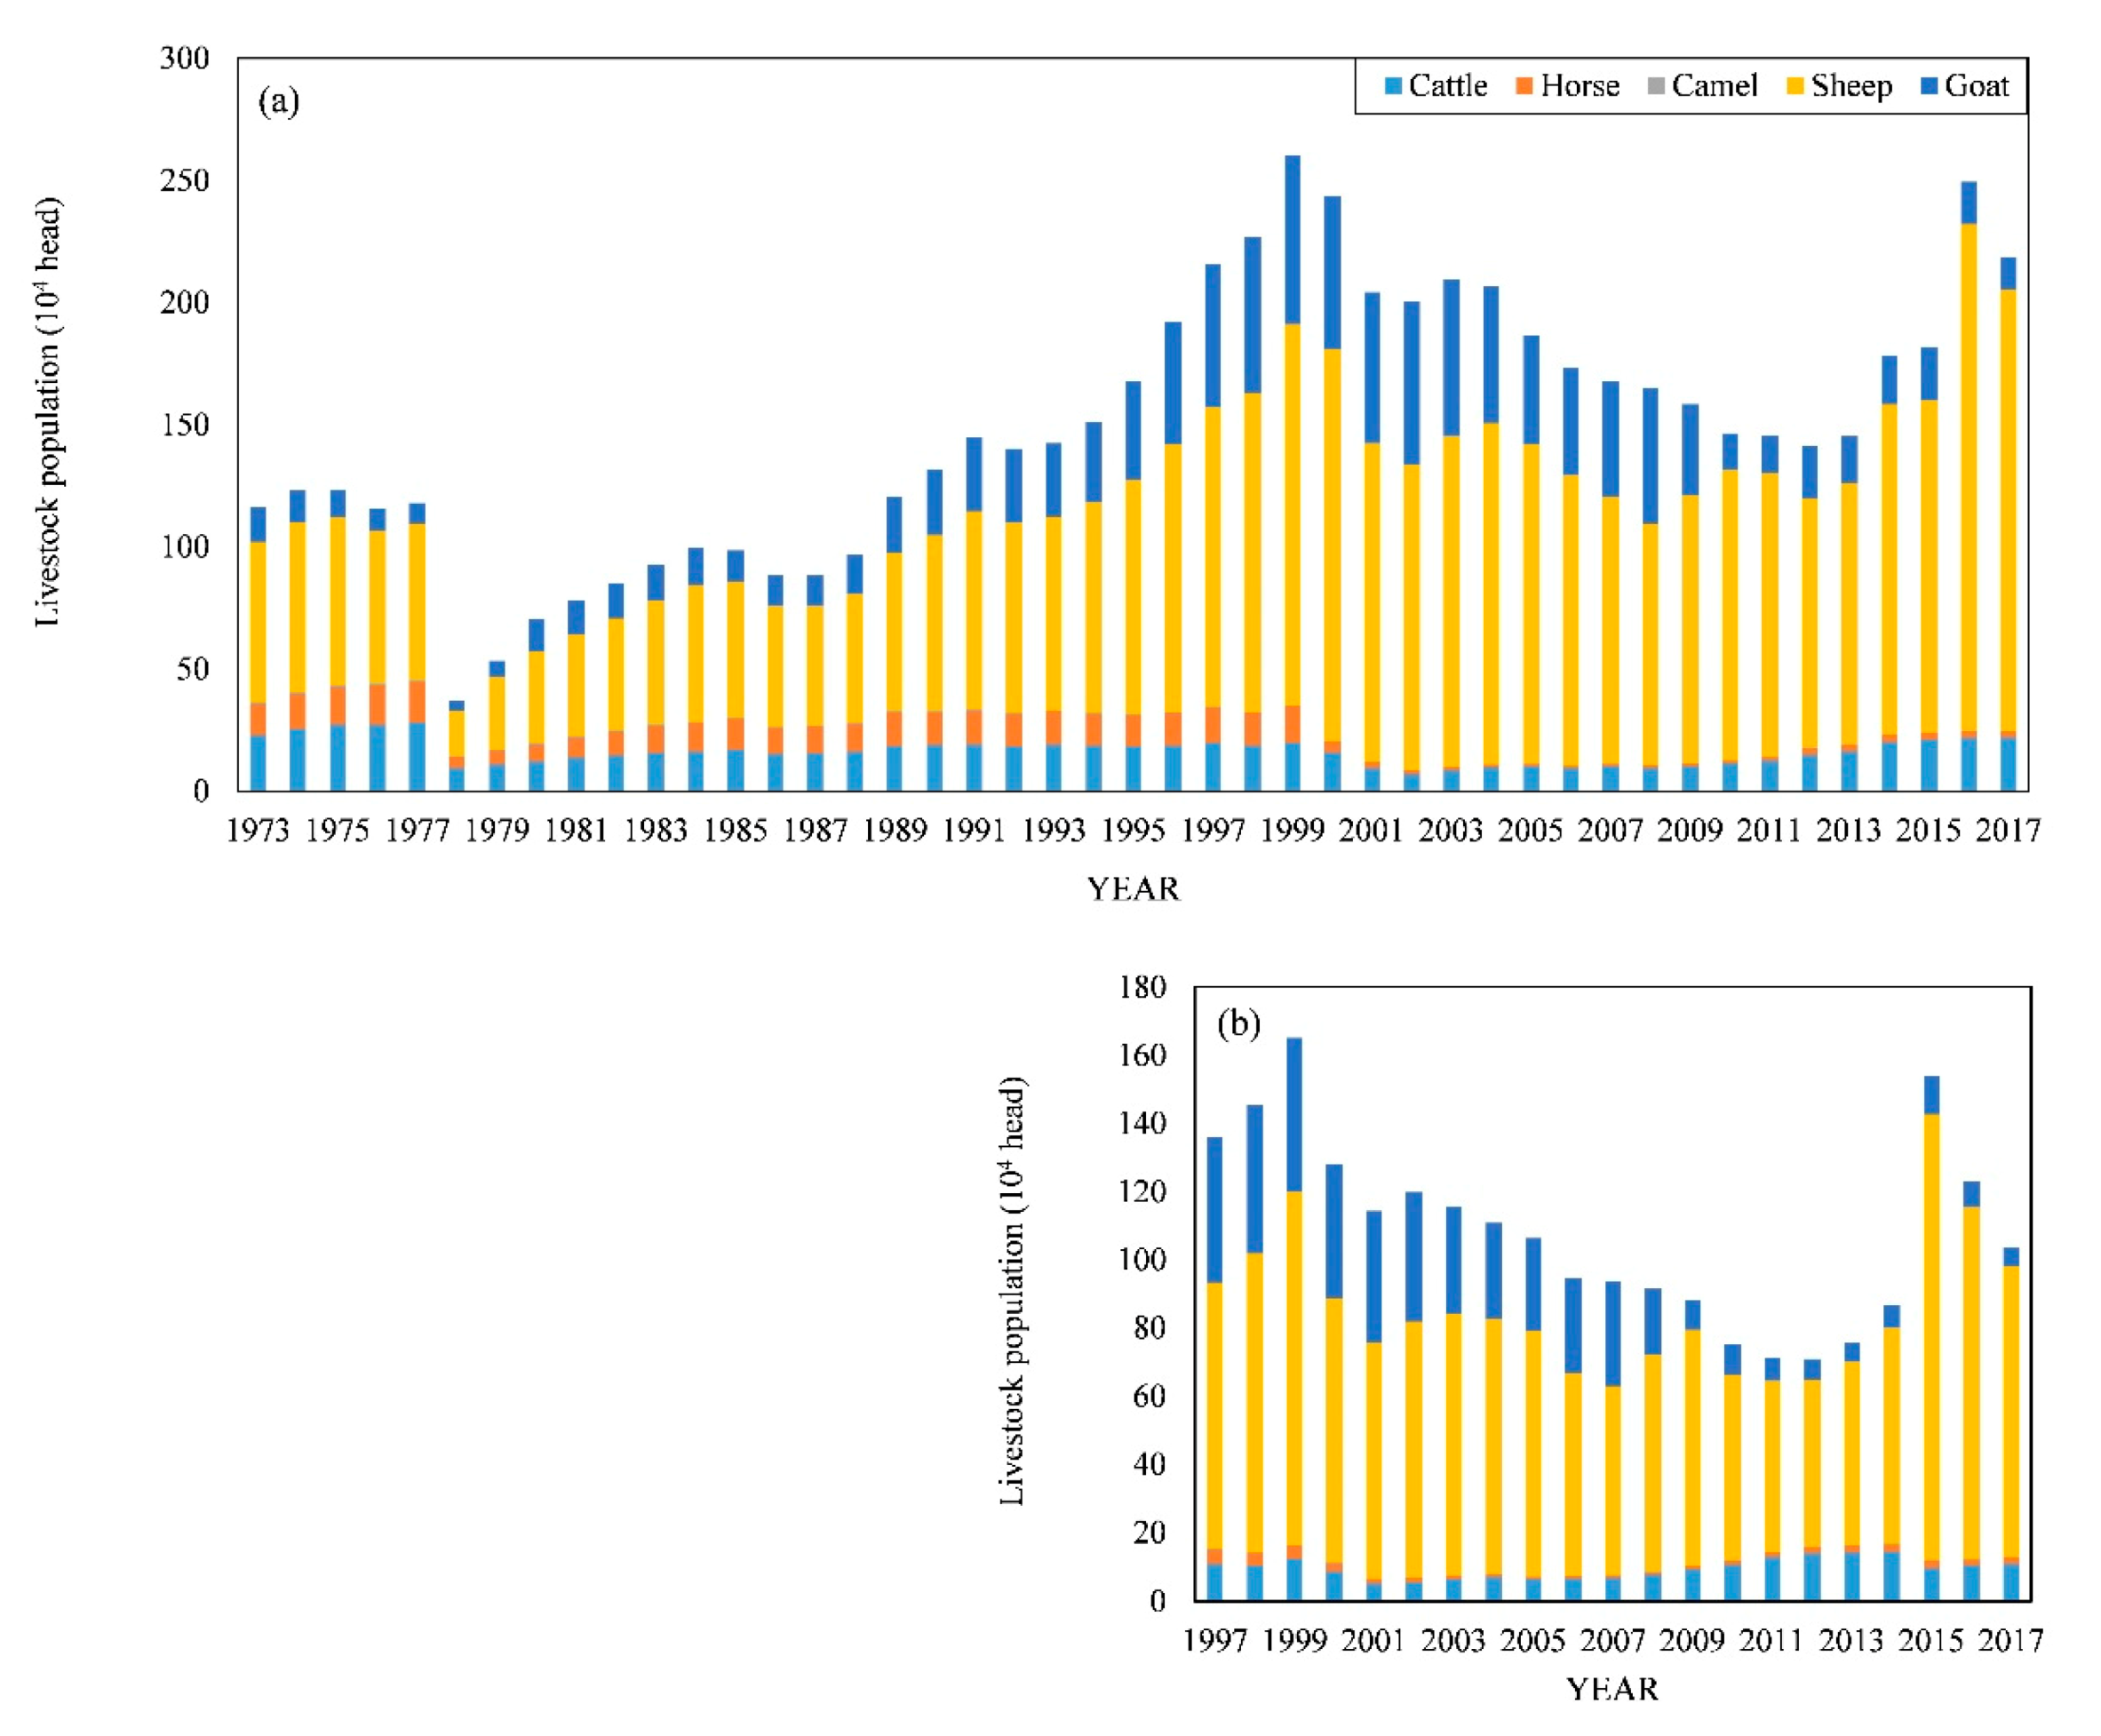
Livestock population during the period of 1973–2017 was obtained from the Statistic Yearbook of Abaga-Qi (partly available at [27]). Numbers of five species of livestock (cattle, horse, camel, sheep, and goat) at the end of June 1973–2017 and at the end of December 1997–2017 were examined.

3. Results

3.1. Variations in DOF, SWF, and DOR

As illustrated in Figure 2a, DOF showed a breaking point in 2000. During the period of 1974–2000, dust occurred less than 10 times, except for the years 1981, 1984, 1990, and 1993. The DOF values sharply increased and largely fluctuated since 2001. In 2001–2002 and 2006, dust occurred more than 20 times. There were six other years in which dust occurred more than 10 times (2005, 2008, 2012, and 2016–2018).
In terms of erosivity, the variation in SWF values showed a slight decreasing trend during the whole period with the exception of an abrupt increase in 2016–2017. In terms of erodibility, the DOR values fluctuated within a narrow range of values lower than 0.08 during the period of 1974–2000. In 2001, however, the DOR value sharply increased and reached a peak value of 0.21 in 2002, although the SWF value was low. The sudden change in DOR before and after 2000 indicates that the stable land surface condition shifted to vulnerable status for some reason. This led to an increasing tendency of dust occurrence since 2000. From 2002 to 2013, the DOR values showed a declining trend with dramatic fluctuations. This implies that the vulnerable lands at Abaga-Qi were gradually being reversed to some extent. However, an increasing trend in DOR was exhibited from 2013 to 2018. This may have increased the risk of desertification and dust occurrence during 2016–2018. Comparing the correlation between DOF and SWF (Figure 2b) and DOR (Figure 2c) suggests that the long-term trend in dust occurrence was not controlled by the erosivity factor (SWF, R2 = 0.13, p-value < 0.05), but depended on erodibility (DOR, R2 = 0.80, p-value < 0.001). Similar results were found for the period of 2001–2018 (figure not shown).

3.2. Variations in Climate Change and Human Activities

As shown in Figure 3a, precipitation is concentrated in the summer season and varies from 45.8 to 353.1 mm with significant interannual fluctuations. During the period of 1973–2017, summer precipitation showed a decreasing trend, whereas there was a slight increasing trend for the other seasons (spring, autumn, and winter). Dry and wet summers occurred periodically from 1973 to 1999, whereas dry summers were dominant from 2000 to 2017. A warming trend was evident based on interannual variations in the seasonal mean temperature (Figure 3b). High temperature increased evapotranspiration and, thus, the soil surface was dry. The 12-month scale of SPEI indicated that drought often occurred between 2000 and 2017, with longer duration and greater intensity (Figure 3c).
Variations in the size of the livestock population in Xilingol Grassland depend not only on climate, but also largely on the socioeconomics and government policies regarding grazing management. The total number of livestock dropped sharply at the end of June in the late 1970s (Figure 4a), probably due to severe drought disasters, as noted in the statistical yearbook reports of Abaga-Qi and negative values of 12-month SPEI (Figure 3c). Another possible reason for the sudden reduction in livestock was the heavy snow disaster in 1977, which was reported in Liu and Wang [28,29]. The severe winter in 1976/1977 also caused huge livestock losses in Mongolia [30]. The size of the livestock population then increased along with the rapid economic growth in China and peaked in 1998. The number of livestock at the end of December showed a peak in 1999 and a similar variation with that at the end of June. We suspect that at the peak point, the number of livestock finally exceeded the grazing capacity, which could be a leading cause of the observed high erodibility (i.e., high DOR) and the frequent dust occurrences (i.e., high DOF) in the early 2000s. One government mitigation measure that controls aeolian desertification and dust is reducing the livestock population, especially sheep and goats, to relieve the burden on grassland ecosystems [17]. The total number of the livestock population started to decrease in 2000 (Figure 4), which was likely a direct result of the implemented projects and policies. However, there was again an increase in the size of total livestock population during the period of 2013–2017. Since 2013, there was an increase in the number of cattle. According to the interviews with the local herders in our field survey conducted in August 2019 and the reports on the work of the local government, the government encouraged a shift from sheep and goat grazing to cattle grazing for grassland restoration. On the other hand, the period of the Grazing Forbidden Project was from 2002 to 2015 [31]. This may account for the increasing number of sheep in 2016 and 2017.

3.3. Contributive Factors for Recent Land Restoration

The characteristic of land surface conditions exhibited a stable and then vulnerable status before and after 2000 at Abaga-Qi, with average DOR values and standard deviations of 0.037 ± 0.02 and 0.074 ± 0.06, respectively. Therefore, we divided our analysis period into the two periods, and we focused only on the period of 2001–2018, during which land surface conditions were more vulnerable to wind erosion.
To quantify the relative contributions of climatic factors (precipitation and temperature) and human activities (livestock population) to the recent interannual variations in DOR (2001–2018), stepwise multiple regression was conducted in the R statistical computing environment. In terms of variables regarding human activities, we selected the number of sheep and goat and cattle since they are the main grazing livestock species at our study site. DOR was firstly regressed on only climatic parameters, including accumulated precipitation and mean temperature in summer, autumn, winter, and spring (hereafter, Psu/Tsu, Pau/Tau, Pwi/Twi, and Psp/Tsp, respectively); and then on both climatic factors and anthropogenic factor of the number of sheep and goat, and cattle at the end of June (SGJ/CJ) and December (SGD/CD), respectively. Regression models were obtained using a function, ln(y) = f(x1, x2, …, xn) to avoid a negative value of DOR that might have resulted from negative values of temperature in spring and winter. The fittest regression model was selected based on Akaike’s information criterion (AIC) [32]. The regression model with the best fit, which inputs only precipitation and temperature, is expressed as
ln(DOR) = −1.62 – 0.014 × Psp – 0.0095 × Psu – 0.0084 × Pau + 0.30 × Tau
The coefficient of the adjusted R square of the optimized equation is 0.50, and it is significant at a 5% confidence level. Summer precipitation showed the most significant influence on the variation in DOR.
Adding a variable of human activities (livestock population), the fittest regression model is expressed as
ln(DOR) = −12.99 + 0.011 × Psp – 0.003 × Psu + 0.0028 × Pwi + 0.20 × Tsu + 0.34 × Tau − 0 0.14 × Twi – 6.32 × 10⁻⁶ × CJ + 1.88 × 10⁻⁶ × SGJ
The selected climatic variables, together with livestock population, explained 82% (the adjusted R-squared as shown in Table 1) of the variation in DOR. The equation passed the 0.005 significant test. The t statistics and p-values between DOR and each variable are summarized in Table 1. The larger the absolute value of the t statistic, the smaller the p-value, and the more greatly significant effect the variable has. In Equation (2), the number of sheep and goat had the strongest effect on land surface condition (t > 4, p-value < 0.005). The significantly positive correlation between DOR and SGJ indicates that a reduction of sheep and goat population resulted in low values of DOR; in other words, such a land surface condition was not favorable for dust occurrence. The magnitude of significantly impact on DOR was followed by temperature in autumn and winter, and the number of cattle (Tau > CJ > Twi). Influences of precipitation in spring and summer, and temperature in summer were not significant. The results indicate that reduction of sheep and goat could effectively improve the land surface condition. Therefore, considering human activity as one of erodibility factors is of importance to understanding the mechanisms of the interannual variation in dust erodibility.

4. Discussion

The degraded grasslands have a potential risk to be dust source areas [8]. The ecosystem of grasslands is affected by climate change and climate variability as well as anthropogenic impacts. Wu et al. [7] suggested that erodibility has a stronger effect than erosivity on dust occurrence at most stations of the steppe regions in East Asia. They conducted a simple regression analysis on DOR and each of the variables (temperature, precipitation, and NDVI) and clarified the most important influencing erodibility factor at a station scale. However, erodibility is complicated, and might be difficult to explain by only one variable. Therefore, we conducted multiple regression to gain further understanding of the mechanism of dust erodibility. We performed a case study at a typical steppe site in Inner Mongolia where we obtained the data regarding human activities from the statistical yearbook. It is possible to objectively evaluate the effect of anthropogenic factors on the variation in erodibility.
Comparing the regression results in Section 3.3, the fitness of the model that included the input of the number of livestock was much higher than that without it. Psp, Psu, Pwi, Tsu, Tau, and Twi were explainable climatic variables in Equation (2), but only Tau and Twi showed significant effects on the variation in DOR. Erodibility, as represented by threshold wind speed and DOR in spring, is related to the amount of precipitation or vegetation in the previous year, or both, according to observations in Mongolian grassland [33] and statistical analyses using synoptic data [7,13,14]. However, Liu et al. [34] demonstrated that temperature has a greater impact on promoting vegetation growth than precipitation based on the one-year cycle; furthermore, temperature is the only determinative factor for a half-year changing in vegetation growth in Inner Mongolia. In accordance with their findings, our results suggested that temperature in autumn revealed a significant impact on erodibility. Lower temperature in autumn promoted abundant vegetation at our study site that can remain as dead leaves until the following spring. Those remaining dead leaves form a layer on the land surface and protect it against dust occurrence by trapping soil particles and decreasing the momentum of the air flow [35]. As a result, the erodibility declines and finally depresses dust occurrence. Besides its effect on vegetation, temperature in autumn also determines soil moisture and affects drought occurrence. High temperature leads to high evaporation and frequent and intense drought, suggesting a high value of DOR. The temperature in winter has a significantly negative influence on erodibility. If the temperature is low, the soil will be heavily frozen. After melting in spring, the soil surface more easily becomes desertified [36]. Above the effect of temperature, a change in the number of sheep and goat is the most determinative factor controlling the interannual variation in erodibility (DOR). The number of cattle also inhibited a significant effect on DOR, but not as great as that of sheep and goat.
During the period that the soil and land surface became vulnerable to wind erosion (2001–2018), a sudden increase of DOF also appeared in 2001, corresponding with an increase in DOR. The cause of this abrupt change is still not clear, but overgrazing may have played a role. This situation may have arisen due to the continually increasing livestock from the late 1970s until 1999 (Figure 4a). The increasing number of livestock, especially sheep and goat, results in an increase in the grazing intensity. Once the livestock number exceeds the pastureland’s grazing capacity, the vegetation cover and grassland production will be decreased [37,38]. The exposed land surface is favorable for emitting dust particles. From the peak DOF and DOR in 2002 to 2012, their values gradually decreased, in addition to a declining proportion of sheep and goat to the total livestock population and an increasing proportion of cattle (Figure 5), coinciding with the implementation of policies and programs to combat aeolian desertification and dust in Inner Mongolia. Our regression results indicated that the government policy that encouraged a shift from sheep and goat grazing to cattle grazing effectively improved the land surface conditions. Different impacts between sheep and goat and cattle on vegetation have been investigated in former studies. Tóth et al. [39] found that species richness and the cover of forbs were lower in the sheep-grazed steppes compared with those on the cattle-grazed steppes due to their different selectivity of plants and feeding strategy. Sheep and goat select single plants and bite them with their incisors close to the near surface [40]. This causes lower plant diversity and lower vegetation coverage, resulting in an exposed and erodible land surface. In contrast, cattle have a lower selectivity of plants and wrap them with their tongues [41]. Therefore, the reduction of sheep and goat population contributes to abundant vegetation. Under the scenario of the dead-leaves hypothesis, if the grazing pressure of sheep and goat is low, there would be more remaining dead leaves. Additionally, making grazing activities forbidden in spring preserves both dead leaves and the new vegetation that starts to grow.
Erodibility depends not only on the amount of roughness elements such as vegetation cover but also on soil surface conditions such as soil hardness. Soil crust is formed when soil water dries up after precipitation, snowmelt, or both [42]. Ishizuka et al. [43], who performed field observation at Tsogt-Ovoo, Mongolia, in a northern part of the Gobi Desert, reported that the threshold wind speed necessary for sand saltation and dust emission drops after the destruction of soil crust by a sandstorm. In Xilingol Grassland, dry lakes where soil crust formed after evaporation were identified as regions of major sources of dust [44,45]. A key process in the weakening and destruction of soil crust is livestock trampling [45], in addition to strong wind, sand-dust storm [39], and the soil freeze–thaw process [39,46], usually in spring at our study site. Munkhtsetseg et al. [47] measured dust emission fluxes by conducting a mini-wind tunnel experiment using a PI-SWERI device under three different intensity levels of livestock trampling in Mongolian grassland: they demonstrated an increase in dust occurrence in response to more intense livestock trampling. Forbidding grazing in spring reduces livestock trampling, thus reducing the destruction of soil crust and decreasing dust erodibility.
Above all, we expect that controlling the number of sheep and goat mitigates the effects of grazing pressure and livestock trampling on land surface conditions. According to our results, the shift from sheep and goat grazing to cattle grazing and grazing forbidding, as part of achievements of policies and projects against desertification and/or dust occurrence, effectively contribute to the reversal of land surface condition and suppress dust occurrence. However, there was a recurring increase in the sheep and goat population from 2015 to 2016. This may be related to the recent frequent dust occurrence in 2016–2018. Our findings can assist governments and other policymakers in choosing appropriate countermeasures to restore desertified land and prevent frequent dust occurrence in the future.

5. Conclusions

We examined dust occurrence (DOF) and its erosivity (SWF) and erodibility (DOR) in the spring (March–May) of 1974–2018 at a typical steppe site in Xilingol Grassland, China. The interannual variation in DOF was determined by DOR rather than SWF. DOF and DOR values appeared to be at breaking points around 2000. They showed higher and more fluctuated values during 2001–2018 than during 1974–2000. This characteristic of DOR indicates that land surface became more erodible, resulting in a stronger tendency for dust occurrence in recent years (2001–2018). For this period, there was also a decreasing trend in DOR with the implementation of the government projects to combat desertification and dust, indicating that the degraded land surface condition was controlled and gradually reversed. We found that the anthropogenic factor is indispensable for understanding the interannual variation in erodibility. The control of grazing activities and selection of livestock types by reducing the number of sheep and goat are effective ways to restore parts of Xilingol Grassland, thus suppressing dust occurrence.

Author Contributions

Conceptualization, J.W. and Y.K.; investigation and resources, J.W. and C.D.; writing—original draft preparation, J.W. All authors have read and agreed to the published version of the manuscript.

Funding

This research received no external funding.

Acknowledgments

This study was supported by the Arid Land Research Centers project, Impacts of Climate Change on Drylands: Assessment and Adaptation, funded by Japan’s Ministry of Education, Culture, Sports, Science, and Technology. We greatly appreciate two anonymous reviewers for their valuable comments.

Conflicts of Interest

The authors declare no conflict of interest.

References

  1. Middleton, N.J. Desert dust hazards: A global review. Aeolian Res. 2017, 24, 53–63. [Google Scholar] [CrossRef]
  2. Shao, Y. Physics and Modelling of Wind Erosion, 2nd Revised and Expanded ed.; Springer Science & Business Media: Dordrecht, The Netherlands, 2008; pp. 2–7. [Google Scholar]
  3. Otani, S.; Kurosaki, Y.; Kurozawa, Y.; Shinoda, M. Dust storms from degraded drylands of Asia: Dynamics and health impacts. Land 2017, 6, 83. [Google Scholar] [CrossRef] [Green Version]
  4. Kurosaki, Y.; Mikami, M. Effect of snow cover on threshold wind velocity of dust outbreak. Geophys. Res. Lett. 2004, 31. [Google Scholar] [CrossRef]
  5. Lee, J.J.; Kim, C.H. Roles of surface wind, NDVI and snow cover in the recent changes in Asian dust storm occurrence frequency. Atmos. Environ. 2012, 59, 366–375. [Google Scholar] [CrossRef]
  6. Guan, Q.; Sun, X.; Yang, J.; Pan, B.; Zhao, S.; Wang, L. Dust storms in northern China: Long-term spatiotemporal characteristics and climate controls. J. Clim. 2017, 30, 6683–6700. [Google Scholar] [CrossRef]
  7. Wu, J.; Kurosaki, Y.; Shinoda, M.; Kai, K. Regional characteristics of recent dust occurrence and its controlling factors in East Asia. SOLA 2016, 12, 187–191. [Google Scholar] [CrossRef] [Green Version]
  8. Shinoda, M.; Gillies, J.; Mikami, M.; Shao, Y. Temperate grasslands as a dust source: Knowledge, uncertainties, and challenges. Aeolian Res. 2011, 3, 271–293. [Google Scholar] [CrossRef]
  9. Kurosaki, Y.; Mikami, M. Recent frequent dust events and their relation to surface wind in East Asia. Geophys. Res. Lett. 2003, 30. [Google Scholar] [CrossRef]
  10. Wu, J.; Kai, K. Characteristics of dust outbreaks and their relation to strong wind and land surface conditions in the Gobi desert and northern China, 1999–2013. J. Arid Land Stud. 2016, 26, 51–57. [Google Scholar]
  11. Igarashi, Y.; Inomata, Y.; Aoyama, M.; Hirose, K.; Takahashi, H.; Shinoda, Y.; Chiba, M. Possible change in Asian dust source suggested by atmospheric anthropogenic radionuclides during the 2000s. Atmos. Environ. 2009, 43, 2971–2980. [Google Scholar] [CrossRef]
  12. Lee, E.H.; Sohn, B.J. Examining the impact of wind and surface vegetation on the Asian dust occurrence over three classified source regions. J. Geophys. Res. Atmos. 2009, 114. [Google Scholar] [CrossRef] [Green Version]
  13. Kurosaki, Y.; Shinoda, M.; Mikami, M. What caused a recent increase in dust outbreaks over East Asia? Geophys. Res. Lett. 2011, 38. [Google Scholar] [CrossRef]
  14. Kurosaki, Y.; Shinoda, M.; Mikami, M.; Nandintsetseg, B. Effects of soil and land surface conditions in summer on dust outbreaks in the following spring in a Mongolian grassland. SOLA 2011, 7, 69–72. [Google Scholar] [CrossRef] [Green Version]
  15. Kimura, R.; Shinoda, M. Spatial distribution of threshold wind speeds for dust outbreaks in northeast Asia. Geomorphology 2010, 114, 319–325. [Google Scholar] [CrossRef]
  16. Hoffmann, C.; Funk, R.; Wieland, R.; Li, Y.; Sommer, M. Effects of grazing and topography on dust flux and deposition in the Xilingele grassland, Inner Mongolia. J. Arid Land Stud. 2008, 72, 792–807. [Google Scholar] [CrossRef]
  17. Wang, T.; Han, P.; Wu, S.; Bu, X.; Guan, Y.; Yang, S. Deserts and Aeolian Desertification in China; Science Press: Beijing, China, 2011; pp. 699–706. [Google Scholar]
  18. Tan, M.; Li, X. Does the Green Great Wall effectively decrease dust storm intensity in China? A study based on NOAA NDVI and weather station data. Land Use Policy 2015, 43, 42–47. [Google Scholar] [CrossRef]
  19. Li, S.; Wang, T.; Yan, C. Assessing the role of policies on land-use/cover change from 1965 to 2015 in the Mu Us Sandy Land, northern China. Sustainability 2017, 9, 1164. [Google Scholar] [CrossRef] [Green Version]
  20. Wang, X.; Chen, F.; Hasi, E.; Li, J. Desertification in China: An assessment. Earth-Sci. Rev. 2008, 88, 188–206. [Google Scholar] [CrossRef]
  21. Middleton, N. Rangeland management and climate hazards in drylands: Dust storms, desertification and the overgrazing debate. Nat. Hazards 2018, 92, 57–70. [Google Scholar] [CrossRef] [Green Version]
  22. Li, A.; Wu, J.; Huang, J. Distinguishing between human-induced and climate-driven vegetation changes: A critical application of RESTREND in Inner Mongolia. Landsc. Ecol. 2012, 27, 969–982. [Google Scholar] [CrossRef]
  23. World Meteorological Organization. Manual on Codes, International Codes, Volume I.1 (Annex II to WMO Technical Regulations), Part A, Alphanumeric Codes; World Meteorological Organization: Geneva, Switzerland, 1995. [Google Scholar]
  24. Tegen, I.; Fung, I. Contribution to the atmospheric mineral aerosol load from land surface modification. J. Geophys. Res. Atmos. 1995, 100, 18707–18726. [Google Scholar] [CrossRef]
  25. Statistic Yearbook of Abaga-Qi. Available online: http://tjj.xlgl.gov.cn/ywlm/tjsj/ (accessed on 15 January 2020).
  26. Vicente-Serrano, S.M.; Beguería, S.; López, M.J.I. A Multi-scalar drought index sensitive to global warming: The Standardized Precipitation Evapotranspiration Index–SPEI. J. Clim. 2010, 23, 1696–1718. [Google Scholar] [CrossRef] [Green Version]
  27. Thornthwaite, C.W. An approach toward a rational classification of climate. Geogr. Rev. 1984, 38, 55–94. [Google Scholar] [CrossRef]
  28. Liu, S.; Wang, T. Aeolian desertification from the mid-1970s to 2005 in Otindag Sandy Land, Northern China. Environ. Geol. 2007, 51, 1057–1064. [Google Scholar] [CrossRef]
  29. Liu, S.; Wang, T. Climate change and local adaptation strategies in the middle Inner Mongolia, northern China. Environ. Earth Sci. 2012, 66, 1449–1458. [Google Scholar] [CrossRef]
  30. Middleton, N.; Rueff, H.; Sternberg, T.; Batbuyan, B.; Thomas, D. Explaining spatial variations in climate hazard impacts in western Mongolia. Landsc. Ecol. 2015, 30, 91–107. [Google Scholar] [CrossRef]
  31. Li, W. Contemporary Ecology Research in China; Springer: Beijing, China, 2015; pp. 382–386. [Google Scholar]
  32. Akaike, H. Information Theory and an Extension of the Maximum Likelihood Principle; Springer: New York, NY, USA, 1998; pp. 199–213. [Google Scholar]
  33. Nandintsetseg, B.; Shinoda, M.; Kimura, R.; Ibaraki, Y. Relationship between soil moisture and vegetation activity in the Mongolian steppe. SOLA 2010, 6, 29–32. [Google Scholar] [CrossRef] [Green Version]
  34. Liu, X.; Tian, Z.; Zhang, A.; Zhao, A.; Liu, H. Impacts of Climate on Spatiotemporal Variations in Vegetation NDVI from 1982–2015 in Inner Mongolia, China. Sustainability 2019, 11, 768. [Google Scholar] [CrossRef] [Green Version]
  35. Lancaster, N. Controls of eolian dune size and spacing. Geology 1988, 16, 972–975. [Google Scholar] [CrossRef]
  36. Qian, W.; Quan, L.; Shi, S. Variations of the dust storm in China and its climatic control. J. Clim. 2002, 15, 1216–1229. [Google Scholar] [CrossRef]
  37. Kawamura, K.; Akiyama, T. Simultaneous monitoring of livestock distribution and desertification. Glob. Environ. Res. 2010, 14, 29–36. [Google Scholar]
  38. Ci, L.; Yang, X. Desertification and Its Control in China; Higher Education Press: Beijing, China, 2010; pp. 323–324. [Google Scholar]
  39. Tóth, E.; Deák, B.; Valkó, O.; Kelemen, A.; Miglécz, T.; Tóthmérész, B.; Török, P. Livestock type is more crucial than grazing intensity: Traditional cattle and sheep grazing in short-grass steppes. Land Degrad. Dev. 2018, 29, 231–239. [Google Scholar] [CrossRef]
  40. Rook, A.J.; Dumont, B.; Isselstein, J.; Osoro, K.; WallisDeVries, M.F.; Parente, G.; Mills, J. Matching type of livestock to desired biodiversity outcomes in pastures—A review. Biol. Conserv. 2004, 119, 137–150. [Google Scholar] [CrossRef]
  41. Jerrentrup, J.S.; Seither, M.; Petersen, U.; Isselstein, J. Little grazer species effect on the vegetation in a rotational grazing system. Agric. Ecosyst. Environ. 2015, 202, 243–250. [Google Scholar] [CrossRef]
  42. Abulaiti, A.; Kimura, R.; Shinoda, M.; Kurosaki, Y.; Mikami, M.; Ishizuka, M.; Yamada, Y.; Nishihara, E.; Gantsetseg, B. An observational study of saltation and dust emission in a hotspot of Mongolia. Aeolian Res. 2014, 15, 169–176. [Google Scholar] [CrossRef]
  43. Ishizuka, M.; Mikami, M.; Yamada, Y.; Kimura, R.; Kurosaki, Y.; Jugder, D.; Gantsetseg, B.; Cheng, Y.; Shinoda, M. Does ground surface soil aggregation affect transition of the wind speed threshold for saltation and dust emission? SOLA 2012, 8, 129–132. [Google Scholar] [CrossRef] [Green Version]
  44. Zhang, B.; Tsunekawa, A.; Tsubo, M. Identification of dust hot spots from multi-resolution remotely sensed data in eastern China and Mongolia. Water Air Soil Pollut. 2015, 226, 117. [Google Scholar] [CrossRef]
  45. Chi, M.; Zhang, B.; Zhao, J.; Peng, J.; Guo, J. Identification of hydrological controls on dust emissions from Xilingol Grassland of Inner Mongolia, China. In Proceedings of the IOP Conference Series: Earth and Environmental Science, Sanya, China, 19–21 November 2018; IOP Publishing: Beijing, China, 2019; Volume 227, p. 052035. [Google Scholar]
  46. Han, L.; Tsunekawa, A.; Tsubo, M. Monitoring near-surface soil freeze—Thaw cycles in northern China and Mongolia from 1998 to 2007. Int. J. Appl. Earth Obs. Geoinf. 2010, 12, 375–384. [Google Scholar] [CrossRef]
  47. Munkhtsetseg, E.; Shinoda, M.; Ishizuka, M.; Mikami, M.; Kimura, R.; Nikolich, G. Anthropogenic dust emissions due to livestock trampling in a Mongolian temperate grassland. Atmos. Chem. Phys. 2017, 17, 11389–11401. [Google Scholar] [CrossRef] [Green Version]
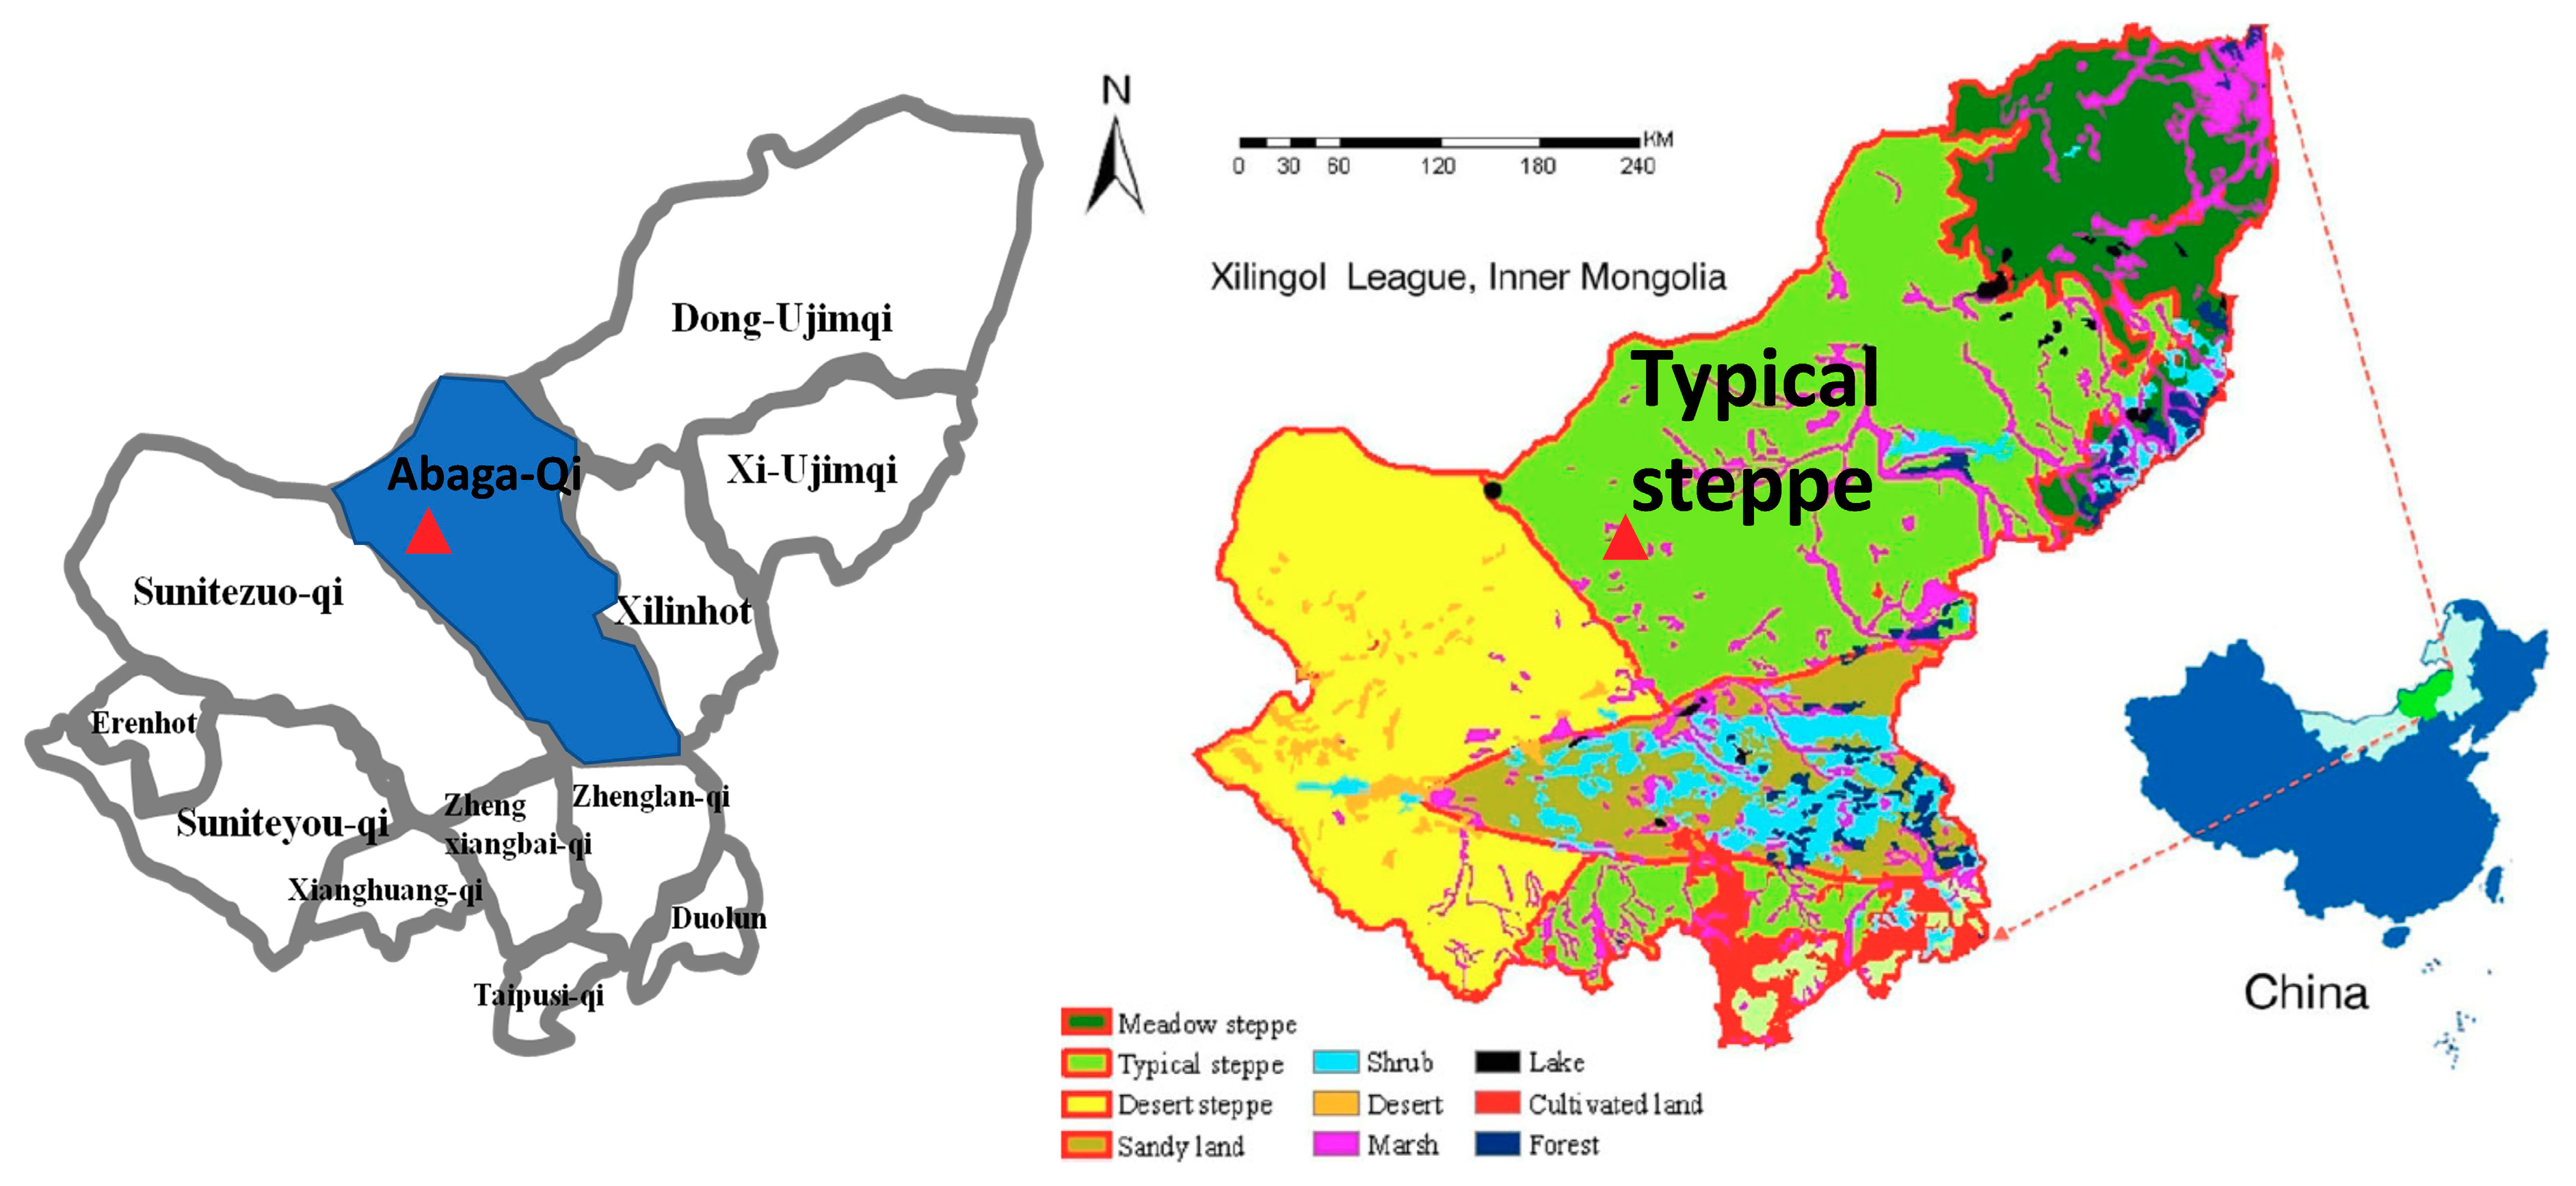
Figure 1. Administrative map and the type of vegetation cover of Xilingol League, Inner Mongolia (rearranged from the figure of Li et al. [22]). The triangle mark shows the location of SYNOP meteorological station at Abaga-Qi.
Sustainability 12 00629 g001
Figure 2. (a) Interannual variations in the frequency of dust occurrence (DOF) (histogram), frequency of strong wind (SWF) (dashed line), and dust occurrence ratio (DOR) (dotted line) in the spring (March–May) of 1974–2018 at Abaga-Qi, Inner Mongolia. Scatter plot of DOF and (b) SWF, (c) DOR.
Sustainability 12 00629 g002
Figure 3. Interannual variations in (a) seasonal precipitation and (b) temperature in the spring of 1974–2018 and in the summer, autumn, and winter of 1973–2017, and (c) annual change trend of the 12-month standardized precipitation evapotranspiration index (SPEI) during the period of 1973–2017 at Abaga-Qi, Inner Mongolia.
Sustainability 12 00629 g003
Figure 4. Livestock number of cattle, horse, camel, sheep, and goat at (a) the end of June 1973–2017 and (b) December 1997–2017, respectively, at Abaga-Qi, Inner Mongolia.
Sustainability 12 00629 g004
Figure 5. Interannual variations in the proportion of sheep and goat to the total livestock population (circle), and the proportion of cattle to the total livestock population (triangle) at the end of June 2000–2017 at Abaga-Qi, Inner Mongolia.
Sustainability 12 00629 g005
Table 1. Results of the fittest regression models.
Explanatory VariablesDependent Variables
Equation (1)Equation (2)
t Statisticp-Valuet Statisticp-Value
Psp−1.920.081.760.12
Psu−3.520.00 **−1.270.24
Pau−1.770.10
Pwi 1.690.13
Tsu 1.640.14
Tau1.93 2.890.02 *
Twi −2.570.03 *
SGJ −2.720.03 *
CJ 4.530.002 **
R-squared0.790.92
Adjusted R-squared0.500.83
Significance F0.02 *0.003 **
* significant at 5% level; ** significant at 0.5% level.