Article

Land-Use and Legislation-Based Methodology for the Implementation of Sustainable Drainage Systems in the Semi-Arid Region of Brazil

by
Priscila Barros Ramalho Alves
1,*,
Iana Alexandra Alves Rufino
2,
Patrícia Hermínio Cunha Feitosa
2,
Slobodan Djordjević
1 and
Akbar Javadi
1
1
Centre for Water Systems, University of Exeter, Exeter EX4 4QF, UK
2
PPGECA, Federal University of Campina Grande, Campina Grande, PB 58428-830, Brazil
*
Author to whom correspondence should be addressed.
Sustainability 2020, 12(2), 661; https://doi.org/10.3390/su12020661
Submission received: 16 December 2019 / Revised: 10 January 2020 / Accepted: 13 January 2020 / Published: 16 January 2020
(This article belongs to the Section Sustainable Urban and Rural Development)

Abstract

:
In developing countries, the urbanisation process occurs with empirical urban management, a high increase of impermeable areas, and a lack of connection between water resource management and planning. In Brazil, concentrated rainfall and ineffective urban drainage systems add to this context and may impact the population with flash floods. Although sustainable drainage systems (SuDS) are widely used for flood mitigation, it is still not very well known how those strategies behave in semi-arid regions, where most of the time the weather is very dry. In Brazil, flood mitigation still mostly involves structural measures such as larger pipes or channels, with limited guidance for SuDS use due to the great resistance to change by citizens and managers. This study sought to analyse the efficacy of SuDS in Campina Grande, a semi-arid region of Brazil. A land-use and legislation-based methodology was developed with physical, climate, hydrological and governance data for three catchments and 312 sub-catchments in 30 applications and simulations. Simulations suggest that these strategies would be appropriate for semi-arid regions, with reductions in the flooded area, flooding volume, and impacts. This study is of relevance for cities with a similar climate to reach a sustainable level of urban drainage services, supporting the integration of urban planning and water resources management.

1. Introduction

More than half of the world’s population live in urban areas [1]. Fast urban growth creates more impervious surfaces, high densification of neighbourhoods, and an inevitable reduction in the percentage of green areas. Currently, due to rapid changes in urbanisation patterns and major environmental concerns, there is increasing pressure on governments to provide improved and expanded urban water services in both developing and developed countries to face urbanisation challenges in environmental and socio-economic processes in a sustainable way [2].
Flooding is considered the most frequent among natural disasters, driven mainly by climate change and rapid urbanisation inducing changes in watershed hydrology [3,4]. The World Research Institute Report indicates the number of people affected by river flooding could triple to 50 million between 2015 to 2030, causing approximately US$500bn of damage [5]. For many years, the dominant approach in urban drainage was the use of canalised networks [6], also called “grey structure”. However, nowadays, flood risk management solutions promote the inclusion of sustainable concepts with different objectives, including the reduction of runoff volumes and flow rate [7,8], but also the achievement of long-term urban sustainability.
In the Australian context, the water sensitive urban design (WSUD) approach was an answer to improve the environment, create public spaces, and mitigate flood risk by considering the holistic management of the integrated water cycle. In other parts of the world, broadly speaking, similar solutions focusing on different scales and methods are acknowledged, such as “low impact development” (LID), “green infrastructure” (GI), “best management practices” (BMP), “nature-based solutions” (NBS), and “sustainable drainage systems” (SuDS), and well-known as sustainable alternatives for managing flood risk.
SuDS promotion via reports and guidelines has led to its rapid adoption in different regions and different countries [9]. Developed countries included SuDS in governance regulations, e.g., in the United States [10], Australia [11], United Kingdom [12], and across Europe [13]. The International Water Association (IWA) cited satisfactory implementations in Belfast (Northern Ireland), Vancouver (Canada), New York City and Portland (United States) in 2018 [5].
Despite the growing number of research and case studies, experiences of sustainable strategies application in management still face many challenges to enhance urban flood reduction. SuDS effectiveness is not only analysed with regard to the ability to restore the pre-development characteristics of the area [14], but should also respond successfully to climate variability analysis (e.g., adaptive capacity) with a reduction of impacts to specific populations (e.g., vulnerability assessment) [15]. Several variables can influence the SuDS performance on runoff control such as rainfall intensity [16], area and placement [17], selection of techniques, and construction [18]. Meanwhile, others [19,20] argue that, beyond technical choices, for successful management, it is necessary to strengthen the governance. Some studies have focused on finding the best strategies [4] and proposing different land uses [21,22], however, many of them have difficulties in application due to climate and legislation restrictions.
Another barrier is related to differences between research focuses and their implication for policymakers. The high incidence of research conducted on temperate regions makes the applicability more difficult in subtropical regions with different geoclimatic, sanitary, and social conditions [23]. Recent studies have simulated the efficiency of flood compensatory strategies—a well-known research expression in the Brazilian context (from Portuguese: “Medidas compensatórias de alagamentos”), which refers to every strategy to mitigate flooding impacts, in urban and rural contexts, and returning to the pre-development state (before flood)—in Brazilian cities [24], but mainly in highly developed urban watersheds [25] or regions with a high incidence of precipitation [26,27]. This can be a problem in countries with huge regional, climate, and socio-economic differences [24]. Despite the efficiency of the compensatory measures, those approaches are not well-suited for other regions with only dry and rainy seasons (e.g., tropical countries), where often there is a great need for flooding reduction. In those countries and cities, decision-makers are supplied with information and parameters that require additional adaptation efforts.
The research presented in this paper aims to contribute to addressing those gaps by evaluating the efficiency of SuDS on mixed land-use catchments in the semi-arid region of Brazil, with the analysis of runoff reduction of severe flood-prone areas and the capacity of restoring the pre-development state, even with the climate constraint. For this, an approach linking water resources modelling and urban planning with land-use and legislation barriers was developed according to various types of data (physical, climate, hydrological, and governance) with applications in three catchments and 312 sub-catchments in Campina Grande, Brazil.

2. Brazilian Context

In Brazil, approximately 24 million people (corresponding to 12% of the population) live in the semi-arid region, located in 1189 counties [28]. The region is considered as the most densely populated dry region in the world [29], with challenges in environmental and socio-economic processes affecting the population. Miguez et al. [30] emphasise that the most aggravating aspect of urbanisation is the rapid growth in a short period, without adequate infrastructure [31] and public policies. In Brazil, the lack of legal regulations causes further challenges and leads to a lack of synergy, resources, funding, and hope [5].
Since the late 1980s, with the Water Resources Federal Law—No. 9.433/1997, Brazil has been striving to implement aspects of integrated and participative water management into public policies [32]. The water law reaches the local level and gives the municipal authorities the responsibilities of urban development, environmental protection, and provision of water supply and sanitation (Table 1).
The Federal Law No. 11.455, approved in 2007, established guidelines for basic sanitation in Brazil. This law asks for the elaboration of the sanitation plan to each municipality that has more than 20,000 inhabitants. This plan involves four areas of sanitation, including water supply and urban drainage. The law opened up new institutional perspectives for the design and management of urban rainwater, however it does not contain all the specificities of a drainage plan [34]. At present (late 2019), the drainage master plan still is not mandatory to municipalities. Metropolitan cities mainly present some developments (e.g., São Paulo, Curitiba, Recife, Porto Alegre, and Guarulhos), but it is often a local action of the municipal government. Recently, Libanio [35] revealed aspects that consider Brazilian water policies very fragile, dysfunctional, and troublesome, especially concerning the participatory experience in legislation formulation and implementation. Water regulation has been basically restricted to the formalisation of entitlements, instead of reflecting priorities for water uses and policy goals [35], and coordination across different planning scales has led to some non-effectiveness in management [36].
The Federal Law No. 10.257, dated August 10, 2001, known as “the City Statute”, provides for every municipality, the master plan, programs, and sectoral projects, as well as other urban planning instruments with the potential to control the impacts of urbanisation on the hydrological cycle and the environment. According to this statute, the urban master plan is a set of principles and rules that guide the action of the construction agents in an urban space with the neighbourhood (e.g., a set of blocks and lots) as the central unit of management. This aspect of the law was previously considered as another difficulty for linking water and urban policies since the water management unit is the catchment (Water Law 9.233/1997). So, the institutional efforts in integrating planning and water resources management are still a controversial topic among scholars and policymakers in Brazil [37]. For most of the municipalities, the master plan presents a land-use approach disconnected from environmental, drainage, and sustainability issues, which increases, even more, the lack of suitable legal tools towards water sensitive planning.
In Brazil, there are only a few legislations to control and mitigate floods with SuDs strategies, and most of them are not found in the semi-arid region. The number of regulatory tools is extremely low in comparison to the number of Brazilian cities, but there are some legal guidelines available in different governmental levels. The city of Porto Alegre, the capital of Rio Grande do Sul state, made the first initiative for the use of green roofs in Brazilian territory. The complementary law No. 434/1999, promotes green roofs as a possibility to maintain green percentage on buildings. In 2013, the law No. 54.423 was approved in São Paulo state to allow the use of green roofs and rain gardens as a measure to compensate constructed areas. There are green roof initiatives sprawled out in some of the main Brazilian cities, but it is still considered as a paradigm of the predominant and usual concepts of urban drainage management [38].
An interesting fact emerged from the analysis of the approved laws No. 7.031 (2012) and No. 10.047 (2013) for the city of Guarulhos (São Paulo state) and Paraíba state, respectively. In summary, these regulations made green roofs mandatory in all built condominiums, with more than three buildings, after the date of legislative approval. Although it can be effective, those areas have urban and geographic differences. Data from the Brazilian Institute of Geography and Statistics (IBGE) shows that Paraíba state, in the semi-arid region, has more than 200 municipalities, of which more than 60% have less than 10,000 inhabitants. However, the law No. 10.047/2013 suggests the green roofs for all the cities. Guarulhos is part of the metropolitan area of São Paulo state, Southeast region, with more than 1.2 million residents. Cities from Paraiba are quite different from Guarulhos in too many aspects (weather, economy, size), which makes it hard to apply for the same urban permit in any way.
Other law projects are waiting to be evaluated by congress (e.g., Federal Law No. 1.704/2011 and No. 9.927/2018). However, the process of approval and implementation of legislation is slow and will possibly need many years to be finalised. Nevertheless, as the similarity between some policies is extremely high (in some cases, the laws are the same), and the areas of application (states and cities) are different, those laws are often developed without a previous study of local land use or downstream effects at the corresponding states and cities. Further, Miguez et al. [27] suggest that low monitoring, fail control, and no penalties in Brazil often nullifies the application of such measures. The regular monitoring and evaluation of water policy and management systems have not yet been implemented in Brazil [36]. Thus, there is still a need for a more comprehensive view of urban drainage sustainability.
In this paper, the efficiency of three sustainable compensatory strategies, green roofs, permeable pavements, and rain gardens is evaluated in multiple semi-arid catchments of Campina Grande municipality, Brazil. These practices cannot wholly substitute conventional structures to control storm runoff, but integration between new and old structures is suggested [8]. To understand all interactions in the catchments, we developed a land-use and legislation-based methodology to identify possible strategies for a strategic planning tool with the integration of different structures. This will involve spatial analysis to select and characterise the area and also aspects of hydrological modelling and the proposal of legislation-based scenarios to implement and evaluate the suggested SuDS techniques. The results will help to understand which SuDS configuration is suitable for similar areas and can support the integration of urban planning and water resources.

3. Methodology

This paper seeks to address the case of the semi-arid region of Brazil. This region is one of the most populated semi-arid regions in the world (Figure 1a). The Brazilian semi-arid region is characterised by extreme weather conditions, highly irregular rainfall, and long and exhaustive periods of drought [29]. These situations impose a significant increase in the vulnerability of human populations and social development. To investigate management issues that afflict Brazilian semi-arid cities, the city of Campina Grande (Paraíba state) was chosen as a study case. The city represents middle-sized municipalities with populated areas that experience a recurrence of drought and flooding hazards.

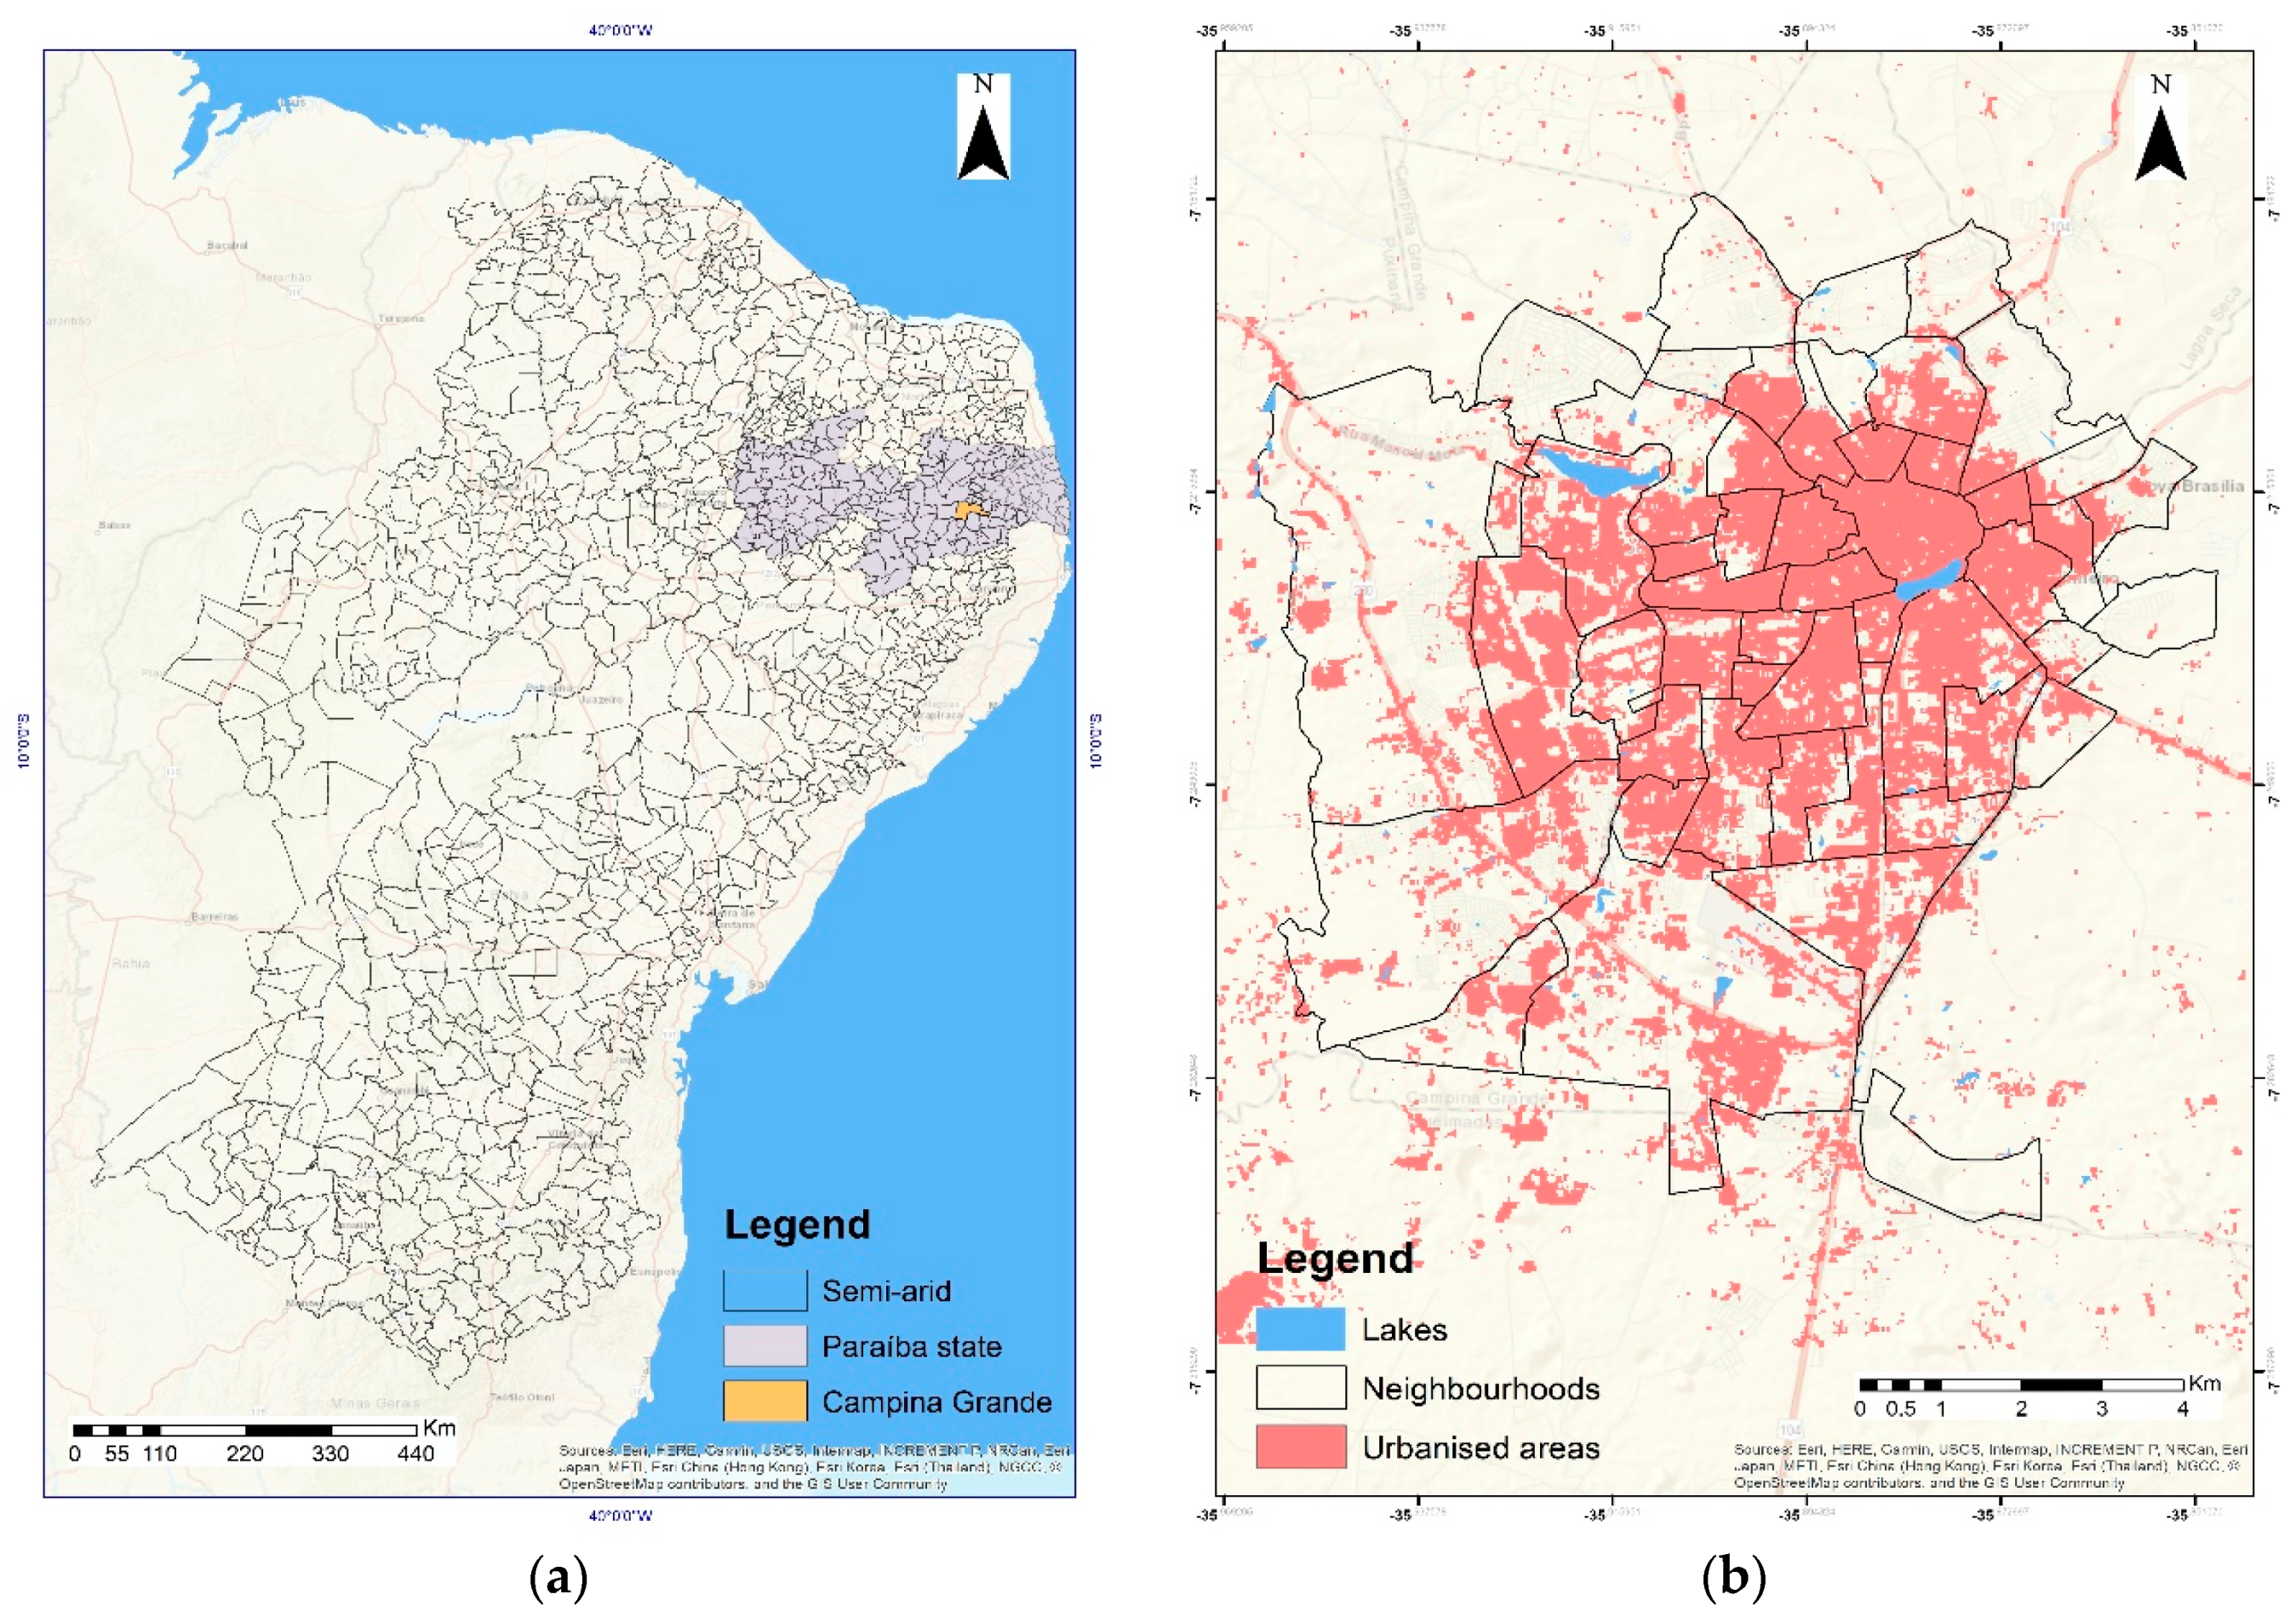
3.1. Study Case and Alternatives for SuDS Application

Located in Paraiba state, in the semi-arid region of Brazil (Figure 1a), Campina Grande is a city with 594 km2 of total area and approximately 110 km2 of the urbanised area. Data from IBGE, in 2016, estimated its population as 407,754 inhabitants, which had an increase of about 20% in the last two decades. This fact represents changes in the urban area, such as the number of buildings, paved streets, and impervious surfaces (Figure 1b).
In an attempt to find the best conditioning factors to represent the city, this work presents an analysis of legislation in different levels, available data, and previous literature. Data from the Campina Grande City Council (PMCG—Prefeitura Municipal de Campina Grande) classify the urban area according to different land uses (residential, commercial, institutional and non-used areas). Although the municipality has a mandatory permeability rate (minimum of 20%) by the master plan, the basic sanitation plan indicates a different reality in the blocks, with impervious rates higher than the allowed rate in many places. The basic sanitation plan was developed in 2015 and only in 2019 was approved as a law. The master plan of the city was supposed to be updated since 2016, but up to 2019, the revision is still in process. Since 2013, the city council asphalted more than five hundred streets in the city, and more than 900 streets are expected to receive an asphalt paving before 2020.
Figure 1. Geographic and urban features: (a) Location of Campina Grande in the Brazilian semi-arid area; (b) Urbanised areas of Campina Grande; Source: Rufino and Silva [39].
Sustainability 12 00661 g001
As mentioned previously, the municipal authority has the responsibility for urban development, environmental protection, and provision of water supply and sanitation. In the municipality sphere, Campina Grande does not have a drainage plan or specific legislation for SuDS (or similar). The basic sanitation plan of the city characterises the drainage system with design and maintenance issues. In the plan, sustainable solutions were suggested in local-scale [40] but, up to 2019, such plans were still not applied. As Campina Grande is located in Paraiba state, the State Law 10.047/2013 mentioned earlier is currently in force.
Despite the availability of these state and municipality policies, the city is exposed to flash floods during the rainy periods mainly due to concentrated and extreme rainfall events [41,42]. The ill-planned urban growth brings several impacts to the hydrological cycle in urban environments such as an increased surface runoff volume. Research studies [41,42,43,44] have described the current urban drainage situation of Campina Grande, which includes issues of design, cleaning, and maintenance of drainage elements such as channels and manholes, as well as high urbanisation rates and a lack of planning. These facts make some areas often susceptible to flooding and also corroborate the need for implementing measures to mitigate the flooding effects.
According to the National Water Agency (ANA) [45], the Northeast region is the only one in Brazil with arid desert and arid steppe (BWh and BSh from Köppen-Geiger Climate). During the last period of water scarcity faced by the region (2012 to 2017), the city experienced a severe water shortage with more than five days per week with no water supply [46]. Recently, the city received waters from São Francisco River (e.g., referred to as “transposição”: “a diversion of river waters to cities with water scarcity in the semi-arid region”). Some water researchers [46] agree that this diversion will not solve water scarcity issues permanently if there is no improvement in the management. Up to May 2019, the Campina Grande water reservoir (Boqueirão) still has less than 25% of full capacity. In this paper, dry climate data were used to model SuDS in the city. Meteorological data were obtained from the weather station of the Brazilian Agricultural Research Corporation (EMBRAPA) in Campina Grande. EMBRAPA monitors climatic parameters in many Brazilian cities, which are mainly used for climate studies [23]. Köppen–Geiger climate classification and brazilian bioclimatic zones (Table 2) were also applied to provide more detail for the climate input data in the modelling. Although the integrated analysis of floods and drought is largely supported by literature, this paper will only deal with mitigation of flooding episodes. Based on this analysis, three conditioning factors were chosen to locally represent the city and are considered crucial to urban and water resources planning (Table 2).

3.2. Sustainable Measures Modelling

As already mentioned, permeable pavement, green roofs, and rain gardens are promising measures to reduce flood cases with different rainfall rates [49,50,51]. On the other hand, merely increasing the number of measures is not enough. Recent papers [18,52] have shown the importance of finding the best position and size to insert measures in the catchment. Versini, et al. [53] showed that green roofs could reduce the frequency and magnitude of floods, but the efficiency depends on their covered roof surface. Elmqvist, et al. [54] relate aspects of sustainability and flood mitigation to the provision of various man-made and natural green infrastructure. From a climate perspective, it is also necessary to determine the vegetation type and distribution to achieve the best outcomes [10]. The effectiveness of each choice is influenced by the installation location [55], type, and the percentage of area occupied with one (or more) of these practices [53].
Considering the above factors, we opted to apply each type of strategy in different scales, with the measures alone and in a combination strategy [4] in which their performance can be evaluated by the capacity of restoring, totally or partially, the pre-development runoff regime (condition before growth). This research evaluated SuDS performance through SWMM (Storm Water Management Model) developed by the US Environmental Protection Agency (USEPA). SWMM enables the the assessment of urban drainage systems, which is widely applied and free of cost [3,8].

3.2.1. Scenarios

The scenarios were selected according to imperviousness rates allowed by the Master Plan. For the “baseline scenario” (S1), it is the current occupation of the city. The model uses land built-up data from 2010 (PMCG). Land-use was updated through on-site visits and Google Street View from 2015 and 2016. The “future occupation” or “legislation upper limit scenario” (S2) uses the maximum rate allowed by legislation for impermeable areas (80%), indicating “a limit situation”. SWMM used the Horton method and IDF equations for flow separation and rainfall intensities (Table 3). Two storm events representing two and five years of return periods were selected for model running, with values of 43.99 mm and 54.16 mm, over 2 h of accumulated rainfalls respectively. The simulation runs at a 6-min time step based on rainfall inputs.

3.2.2. Sensitivity Analysis

To address the gap of sustainable strategies in the semi-arid area, the model considers climate aspects according to the “Brazilian Guidelines for Buildings” 15.220 of 2003 (Thermal performance in buildings and Brazilian Bioclimatic Zones) combined with urban development and the threshold permeability rates and regulations (Table 2). Some parameter adjustments were needed with the basis on this regulation and values suggested by the SWMM user manual. Final values (Table 4) were those with more efficiency considering the threshold bioclimatic zone and intervals from the SWMM user manual.

3.2.3. Analysis

Since the analysis aims to provide findings at the local-scale, land-use and governance data are crucial to ensure the reliability of the model. As mentioned previously, scenarios 1 and 2 represent the current and future occupation of the city, respectively. In total, 30 cases were simulated (Table 5 and Figure 2).
Land-use mixed-catchments of Campina Grande were chosen as the application of the described methodology (Figure 2). This area was described as mostly urbanised and as highly susceptible to floods according to multi-criteria analysis in previous research [41]. The findings are described by flood volume and percentage of blocks that returned to the previous condition (before the rain event).

3.2.4. Calibration and Validation

Due to the unavailable discharge and water level data, the calibration of the parameters was not possible in this study. However, all input data were carefully chosen and allowed for the conclusion of this research. For this, previous research in the area, on-site field visits, and meetings with stakeholders allowed to obtain the input data. For the validation of flooding maps, known flooding events were used as the basis for comparison. Flooding historical data were delivered by the Civil Defence Agency, which is responsible for checking flooding cases and drainage systems assets in the municipality. The validation evaluated similarities of flooding locations between the model and historical data from 2005 to 2011.

4. Results

The results are divided into two analysis: Without SuDS strategies (cases 1 to 4) and with SuDS strategies (cases 5 to 30).

4.1. Without SuDS Strategies:

The first simulations were performed for the baseline scenario (S1) with no SuDS practices and using rainfall return periods of two and five years. All previous input data were loaded to each sub-catchment/block, totalling 312 blocks. Figure 3a,b shows the hydrologic behaviour of the area in S1. Maps generated by SWMM show 29 sub-catchments with a severe chance of floods (red colour) in both return periods. Future occupation scenario (S2) was modelled to complement the simulations with no SuDS practices (Figure 3c,d). In this scenario, 49 blocks (RT of two and five years) are in severe condition, which indicates that the drainage system supports neither the current nor the future rate of imperviousness.
In S2, the number of severe flood blocks increased by more than 70% in comparison with S1. This also indicates that the drainage system of the city is not sufficient for the current or future occupation. Since the legal instruments are not regularly reviewed, probably floods will keep occurring very often and increase disaster risk. These initial results also suggest that changes in S1 may probably prevent flood disasters occurring in this area in the future since all the severe blocks in S1 also are severe in S2, but with higher runoff volume. This is a significant result because it shows how urgent the adjustments to the current land-use regulation are. If managers keep attending the upper limit threshold, the city may have more severe problems in future than the current ones. It is therefore suggested that compensatory strategies in the present may help to mitigate or attenuate disasters in the future.
For validation, approximately 190 points in the city were reported as flooded. Those points do not necessarily represent all the flooding areas of Campina Grande but show areas that experienced flooding and people reported officially to civil defence (responsible for managing flooding disasters with citizens). Those reported cases are from 2005 to 2011 and were provided by the agency. This number of critical events allows questioning if the urban infrastructure is capable of minimising the negative effects on the citizens as well as their preparedness, awareness, and response.
In this paper, since we are only working in three catchments of the city, only points inside this area were considered. According to the data, 11 points are located inside the catchments and, in scenario 1, only two of those points do not match with the map (Figure 4a). Still, one of these points is considered as “yellow” in SWMM (Figure 3a,b), which represents the “critical flooding classification”. For scenario 2, only one point does not correspond with the threshold classification (Figure 4b), but, as before, it is considered as critical on SWMM (Figure 3c,d). This point can represent a rainfall with return period greater than five years in the area.
In addition, research in local newspapers, television websites, several web videos, and social media (mainly Facebook and Instagram accounts) allowed finding other locations with flooding within the area. Another seven points were added (Figure 4a,b) which also validate SWMM maps. This approach is suggested as a way to manage the lack of validation data in studies [62]. However, an in-depth study is suggested for further research in order to collect more information about flooding episodes in different return periods.
After the simulation of S1 and S2 without any compensatory measures, each SuDS strategy was implemented on the severe (more flooded) blocks inside the basins (29 in S1 and 49 in S2), according to SWMM classification.

4.2. With SuDS Strategies:

The application of SuDS structures presents effects concerning each strategy separately and with a combination of all of them. In each analysis, a set of maps show the corresponding runoff volume reductions. Each sustainable measure was included in the catchment considering the equivalent built-up area based on land-use and occupation data (Table 2 and Figure 2) as well as vacant areas (free areas), where in the future, legislation could enforce the use of SuDS in new buildings. The threshold area for this condition is also based on the minimum and maximum imperviousness rates established in the Master Plan of the city (Table 2). This aimed to analyse if the runoff would be reduced with the application of SuDS in vacant areas, with the threshold imperviousness rates.
First, the simulation implemented green roofs (GR) in different urban configurations. As previously mentioned, the land-use in the study catchments area is mixed, mainly residential, commercial and public, with the presence of buildings in its territory (Figure 2). This made the application of green roofs possible in many severe flooding blocks. This choice used guidelines of the Basic Sanitation Plan and on the Law 10.047/2013. Those regulations suggest GR but without any modelling results of how efficient these measures are or what placement configuration is more effective. So, GR was applied in: (1) condominiums with more than three buildings (cases 5 to 8); (2) institutional/public buildings (cases 9 to 12) and; (3) free spaces/no use (cases 13 to 16).
The results made clear the relation between the three options of green roof and the equivalent area of application, but also the interference of reductions of volume in downstream blocks (Table 6). This case can be seen for GR application in condominiums with more than three buildings, where rates of reductions are observed in 100% of the blocks (Figure 5 and Table 6), although only 12 blocks have this type of land use. This indicates that the reduction is not conditioned only by the presence of buildings on the blocks. Therefore, it is understood that when the flow of a block upstream is reduced then the flow downstream will be automatically reduced. This is evident by analysing the blocks where GR have more area of application (15, 16, 17, 23 and 28) with reductions between 79% and 100%, in cases 5 to 8, and also other blocks without GR directly implemented that have great runoff reduction (case of block 14 with 77.28% of reduction).
The implementation of the measures in scenario 2 also provided reductions in runoff volumes. However, these reductions are more evident in S1 than in S2. With the increase of paving imperviousness of the blocks, the percentage of areas with three buildings became low (considering the current availability) to compensate the values of the flow volumes. But, even in S2, the coverings brought the reduction of the flow. This may indicate advantages in the application of GR in the current land use scenario to generate risk reduction in the future. As in S1, Figure 6 indicates that blocks with greater areas of buildings changed their severe condition (blocks 44 and 49, in scenario 2). The highest rates of reduction occurred in blocks 9, 18, and 44, with values between 32% and 44% for cases 5 to 8. Although the application of GR on condominiums with three buildings appears to have good reduction of runoff volume in this case, the effectiveness cannot be generalised to other catchments where this type of land-use is not representative.
For GR in public buildings on S1 (Figure 5), the largest reductions occurred in blocks 8, 9, and 11 (respectively 74.23%, 90.91% and 100%). With the insertion, these blocks became non-critical. As before, Table 6 shows that, even without SuDS strategies, other blocks also had changes in volume values. In S2, greater flow differences can be seen because the critical blocks have institutional areas available for the implantation of the green roofs. Regarding GR on free areas, changes are seen in both S1 and S2. For example, in S1, block 21 had 100% of the flow reduced (best situation) after the implementation of GR in approximately 42.5 % of the total area.
The second simulation analyses the performance of permeable pavement in two configurations: (1) sidewalks of free spaces (cases 17 to 20) and (2) sidewalks of the severely flooded blocks (cases 21 to 24). Free spaces (or no use) blocks represent the involvement of public actors to support this practice in future legislations since they can use laws to encourage this paving use. The last simulation is the use of rain gardens in non-built spaces (cases 25 to 28), where compensatory strategies are suggested for non-built spaces and, depending on the results, construction is encouraged in future buildings. Since each analysis has a significant number of blocks and findings, a summary of effectiveness related to the reduction of severe blocks after the implementation of SuDS was produced (Figure 7). This graph intends to show the efficiency of each strategy in each case and each scenario. The research data supporting this publication are provided within this paper, and all graphs related to the other simulations can be found in Appendix A (Figure A1, Figure A2, Figure A3 and Figure A4).

5. Discussion

The results confirm that the efficiency or SuDS varies directly according to the size of the area [63] and the placement of SuDS [18]. The effectiveness of each choice of SuDS is more significant in the current scenario (S1) to almost all measures possibilities, except for GR on public buildings. Figure 7, shows that, for S1, applying green roofs to built-in public spaces is not the best choice (reduction of 13.8%), however, if the imperviousness achieves the suggested limits on master plan (scenario 2), this alternative provides a reduction of 24.5%. This happens because the percentage of these areas in S1 (Figure 2) is not enough for changing the “severe flooding susceptibility classification” of the analysed blocks. In agreement with other studies [53,64], our results confirm that SuDS effectiveness will depend on the basin land-use configuration and corresponding positioning choice. Regarding the future scenario (S2), the number of public spaces is more significant than in S1 which means that if green roofs will be applied in more areas, then, results will be better for this case. Andrés-Doménech et al. [65] modelled GR in Spain, and also found reductions in runoff volumes despite the dry climate conditions. As stated previously, for most of the Brazilian cities, using SuDS is still a changing paradigm. Their application in public buildings represents an option for a good government example of sustainable actions.
In all other cases, SuDS strategies have more reductions in S1, which indicates that actions by managers are better suggested now. The best reduction is with the application of permeable pavement in every sidewalk, which had 55.2% of reduction on S1 (Figure 7). Despite this, when the urbanisation achieves its higher rate (80% of imperviousness in each block), the reduction rate falls to only 10.2%. According to this analysis, applying measures on non-built areas (free spaces/no use) would produce reductions of 31%, 34.5%, and 48.3% for green roofs, permeable pavements, and rain gardens, respectively, with the current occupation of the area. This choice represents good possibilities to enhance current legislation and change guidelines for the future [26]. Developed countries, such as UK, use this strategy for SuDS installation [66]. This finding is even more important due to the lack of clear guidance in the city and the current master plan review in process in Campina Grande.
The use of rain gardens in free/no use areas enables 48.3% and 18.4% of blocks to change the “severe risk” of flooding in S1 and S2, respectively (Figure 7). Despite the quantity of fewer blocks in severe flooding condition on the catchment after RG, the runoff of others flooded blocks was also reduced, but not enough to change the “severe condition” classification in the model. Figure 8a,b show this land-use type made possible by the application on 15 blocks on S1 and 30 blocks on S2, but runoff reductions are distributed on almost all the other blocks (except for 1 on S1 and 9 on S2). This analysis suggests the reduction of flooding volumes is more related to imperviousness and location than with the respective area of SuDS application, which highlights the importance of determining an optimal location for SuDS. Also, there is a great similarity between values from return periods of two and five years, which justifies the same quantity of blocks that changed the severe state in Figure 7.
In order to assess what would be the reduction with the combination of different SuDS practices, the last situation evaluates all three compensatory techniques together in the S2 with both two- and five-year return periods (Figure 9). In this simulation, every strategy was applied to previously defined areas (Figure 2 and Table 2). The intention was to evaluate if the combination of compensatory strategies can provide better results than each one applied separately. Simulation referred to the worse condition, with the upper limit of occupancy allowed by legislation. This choice enabled the application of the three SuDS in 100% of blocks in the catchments.
A comparison between Figure 3c,d and Figure 9 shows a significant difference in the behaviour of the catchments. After the SuDS practices were combined, the basins reduced the number of “severe flooding susceptibility” blocks substantially. This corroborates with other studies, where the combination of different SuDS, in conjunction, demonstrated the best effectiveness in reducing the runoff volume [4]. The reduction of 85.72% confirms that the best approach for the study area is to apply the combination of the three proposed compensatory techniques [67]. Only seven blocks with severe flood risk kept showing high runoff rates, even after the implementation with climatic conditions of drought regions [23]. In those blocks, it is strongly recommended that a more in-depth study and the implementation of SuDS in lots located upstream of the basin should be carried out in order to bring greater benefits.
In this approach, land-use development and legislation (development, implementation, and monitoring) are drivers for flood mitigation and/or disaster risk attenuation. Good information related to legislation analysis and definition of land-use and catchment boundaries are ways to approximate the management of urban drainage to urban planning and sustainability. For this, a rank of effectiveness was produced in relation to each SuDS, threshold location and reductions (Table 7). This aims to encourage policymakers to invest in SuDS as a way to mitigate flooding episodes with different options.
Therefore, this analysis highlights the importance of the application of SuDS in the current scenario where the imperviousness of buildings is not yet the maximum allowed. Some examples in S1 include changes up to 55.2% of the number of “severe” flooding blocks with PP in every sidewalk and reductions in all the blocks (Table 6). Although GR in condominiums also generated reductions in 100% of the block, only 44.8% changed the severe classification. RG were applied in 15 blocks with vacant areas with reductions in 96.7% of the blocks, and 48.3% changed to a non-severe state.
Although reductions are still seen in most of the blocks (Table 6), rates reduced significantly with SuDS alone in the future scenario (Table 7), which was also the case in other studies [27]. The best results are with the application of GR in public buildings and RG in free areas, with 24.5% and 18.4% of reduction in severe blocks. In S2, the best reduction is with the combination of GR, PP and RG, with 85.7% in the severe flooding blocks. Both analyses emphasise the importance of implementing SuDS strategies in free areas, which is corroborated by other research [26]. This generates fewer investments with the retrofitting of structures and increase of their longevity [63]. These results show that linking urban planning with water resources in advance will generate less flooding produced with imperviousness [64]. It is shown that SuDS should be introduced in the city, as a way to compensate current and future imperviousness rates.
Since the area has dry weather (semi-arid), even though all three SuDS (green roofs, permeable pavements and rain gardens) are designed for flooding purposes, they are also alternatives for storing water, as well as quality improvement and pollution control [23]. This is very important due to climate change [25], mainly increasing flooding and water stress cases, which raises the necessity of promoting adaptation measures to make more resilient cities. This study corroborates the promotion of an innovative solution for stormwater management [16] as an alternative for drought adaptation [68] and integrated management across the entire water cycle [11] and with applications in developing countries [8,11,69].

6. Conclusions

The city of Campina Grande is a sample of middle size Brazilian cities with gaps between urban planning and water drainage planning. The current urban legal instruments (e.g., master plan, built-in codes) do not consider sustainable solutions for stormwater management and runoff problems. The city has initiatives of flooding reduction measures but still with no specificities of where or how to apply within the city. Although there has been a lot of research on integrated water resources management in Brazil [70,71], the effective actions remain fragmented in urban areas, showing a clear institutional frailty for handling the issue. The concepts are known but normally are not incorporated into practice by technicians, decision-makers, and local policymakers.
The methodology identified priority blocks with severe cases of floods for current and future legislation upper-limit scenarios, which emphasises the need for SuDS use to mitigate the impacts. However, the results revealed the inadequacy of imperviousness rates recommended by the law (land-use master plan), which works against the drainage infrastructure. Actually, this potentiates flood problems. This is further aggravated by the fact that there is no urban drainage plan for the municipality, meaning that the urbanisation expansion is not guided or supported by an urban water analysis including water supply and stormwater drainage. It is necessary to establish changes in local legislation and drainage systems to mitigate high rates of surface runoff.
The results can be used as guidelines for building new local legislation related to urban planning, which is extremely important since the master plan is being reviewed in 2019, and to guide decisions to implement such legislation as the basic sanitation plan of the city. There is a need to consider the development of city and drainage systems to maximise the effectiveness and efficiency in drainage systems [72]. A better planning of the drainage control measures, plus better monitoring of built channels and drainage structures and projects are vital for updating and revising legislation that deals with urban planning.
The proposed framework presents satisfactory and coherent results regarding the reduction of flow volumes, which can be a solution for flooding mitigation of study area and applied throughout the municipality. On the basis of results shown in this paper, each SuDS has reduced severe flooding in different percentages (Table 7), but the combination of all proved to be the most efficient mean of reducing flood impacts in the city. This research encourages the application of the present methodology to cities with similar problems, to produce pre-urban conditions and ensure the greater longevity of drainage systems. The benefits brought by the use of SuDS techniques are not only for the selected catchments but also for the neighbouring regions (Table 6).
The use of compensatory strategies is not capable of minimising all hydrological impacts of any mismanagement of land use. The efficiency of SuDS is substantially affected by their quantity, dimensions, properties, and adequate maintenance. These infrastructures are discussed as a method for flooding control, but this study highlights the importance of applying it along with land use management, governance, and climate considerations [66], acting as a long-term urban planning strategy. Further studies should take into consideration the optimal site location of measures, quantity, and dimensions along with runoff reductions in the total area to make a better decision. Further, as a management strategy, a “multi-hazards” approach, with drought and flooding considerations, with stakeholder participation and cost-effectiveness analysis will be added to the decision-making process.
The use of such an integrated approach as this, with water resources following environmental and sustainable objectives, helps to avoid conflicts related to urban management [73] and is essential for achieving sustainable development, including social and economic development, poverty reduction and equity, and sustainable environmental services [74].

Author Contributions

Conceptualization, P.B.R.A., I.A.A.R. and P.H.C.F.; Methodology, P.B.R.A., I.A.A.R. and P.H.C.F.; Software, P.B.R.A.; Validation, P.B.R.A.; Formal analysis, P.B.R.A., I.A.A.R., P.H.C.F., S.D. and A.J.; Investigation, P.B.R.A.; Writing—original draft preparation, P.B.R.A.; Writing—review and editing, P.B.R.A., I.A.A.R., S.D. and A.J. All authors have read and agreed to the published version of the manuscript.

Funding

During this study, authors were supported by the Coordenação de Aperfeiçoamento de Pessoal de Nível Superior—Brasil (Capes)—Finance Code 001 (Grant No 88881.129673/2016-01) and CNPq/PDE (Grant No 205565/2018-2).

Acknowledgments

This paper acknowledges Campina Grande City Council (PMCGPrefeitura Municipal de Campina Grande) and Civil Defence Agency for sharing the data for the development of the framework, model and validation.

Conflicts of Interest

The authors declare no conflict of interest.

Appendix A

Figure A1. Percentage of runoff volume reductions with PP application in scenario 1.
Sustainability 12 00661 g0a1
Figure A2. Percentage of runoff volume reductions with PP application in scenario 2.
Sustainability 12 00661 g0a2
Figure A3. Percentage of runoff volume reductions with RG application in scenario 1.
Sustainability 12 00661 g0a3
Figure A4. Percentage of runoff volume reductions with RG application in scenario 2.
Sustainability 12 00661 g0a4

References

  1. Nations, U. World Urbanization Prospects: The 2009 Revision. In United Nations Department of Economic and Social Affairs (Population Division); United Nations: New York, NY, USA, 2010. [Google Scholar]
  2. Poustie, M.S.; Deletic, A.; Brown, R.R.; Wong, T.; De Haan, F.J.; Skinner, R. Sustainable urban water futures in developing countries: The centralised, decentralised or hybrid dilemma. Urban Water J. 2014, 12, 543–558. [Google Scholar] [CrossRef]
  3. Ahiablame, L.; Shakya, R. Modeling flood reduction effects of low impact development at a watershed scale. J. Environ. Manag. 2016, 171, 81–91. [Google Scholar] [CrossRef] [PubMed]
  4. Xie, J.; Chen, H.; Liao, Z.; Gu, X.; Zhu, D.; Zhang, J. An integrated assessment of urban flooding mitigation strategies for robust decision making. Environ. Model. Softw. 2017, 95, 143–155. [Google Scholar] [CrossRef]
  5. ARUP. Cities Alive: Water for People; ARUP: London, UK, 2018. [Google Scholar]
  6. Baptista, M.B.; Nascimento, N.O.; Barraud, S. Técnicas Compensatórias em Drenagem Urbana (Compensatory Techniques for Urban Drainage); ABRH: Porto Alegre, Brazil, 2011. [Google Scholar]
  7. Qin, H.-P.; He, K.-M.; Fu, G. Modeling middle and final flush effects of urban runoff pollution in an urbanizing catchment. J. Hydrol. 2016, 534, 638–647. [Google Scholar] [CrossRef]
  8. Xu, P.; Gao, F.; He, J.; Ren, X.; Xi, W. Modelling and optimization of land use/land cover change in a developing urban catchment. Water Sci. Technol. 2017, 75, 2527–2537. [Google Scholar] [CrossRef]
  9. IPCC. Managing the Risks of Extreme Events and Disasters to Advance Climate Change Adaptation. In A Special Report of Working Groups I and II of the Intergovernmental Panel on Climate Change; Field, C.B., Barros, V., Stocker, T.F., Qin, D., Dokken, D.J., Ebi, K.L., Mastrandrea, M.D., Mach, K.J., Plattner, G.-K., Allen, S.K., et al., Eds.; Cambridge University Press: Cambridge, UK; New York, NY, USA, 2012; p. 582. [Google Scholar]
  10. Benton-Short, L.; Keeley, M.; Rowland, J. Green infrastructure, green space, and sustainable urbanism: Geography’s important role. Urban Geogr. 2017. [Google Scholar] [CrossRef]
  11. Roy, A.H.; Wenger, S.J.; Fletcher, T.D.; Walsh, C.J.; Ladson, A.R.; Shuster, W.D.; Thurston, H.W.; Brown, R.R. Impediments and solutions to sustainable, watershed-scale urban stormwater management: Lessons from Australia and the United States. Environ. Manag. 2008, 42, 344–359. [Google Scholar] [CrossRef]
  12. Melville-Shreeve, P.; Cotterill, S.; Grant, L.; Arahuetes, A.; Stovin, V.; Farmani, R.; Butler, D. State of SuDS delivery in the United Kingdom. Water Environ. J. 2018, 32, 9–16. [Google Scholar] [CrossRef]
  13. Eggermont, H.; Balian, E.; Azevedo, J.M.N.; Beumer, V.; Brodin, T.; Claudet, J.; Fady, B.; Grube, M.; Keune, H.; Lamarque, P.; et al. Nature-based Solutions: New Influence for Environmental Management and Research in Europe. GAIA Ecol. Perspect. Sci. Soc. 2015, 24, 243–248. [Google Scholar] [CrossRef]
  14. Liu, J.; Sample, D.J.; Bell, C.; Guan, Y. Review and Research Needs of Bioretention Used for the Treatment of Urban Stormwater. Water 2014, 6, 1069–1099. [Google Scholar] [CrossRef] [Green Version]
  15. Ahmed, K.; Chung, E.-S.; Song, J.-Y.; Shahid, S. Effective Design and Planning Specification of Low Impact Development Practices Using Water Management Analysis Module (WMAM): Case of Malaysia. Water 2017, 9, 173. [Google Scholar] [CrossRef]
  16. Qin, H.P.; Li, Z.X.; Fu, G. The effects of low impact development on urban flooding under different rainfall characteristics. J. Environ. Manag. 2013, 129, 577–585. [Google Scholar] [CrossRef] [PubMed] [Green Version]
  17. Passeport, E.; Vidon, P.; Forshay, K.J.; Harris, L.; Kaushal, S.S.; Kellog, D.Q.; Lazar, J.; Mayer, P.M.; Stander, E.K. Ecological Engineering Practices for the Reduction of Excess Nitrogen in Human-Influenced Landscapes: A Guide for Watershed Managers. Environ. Manag. 2013, 51, 392–413. [Google Scholar] [CrossRef] [PubMed]
  18. Martin-Mikle, C.J.; De Beurs, K.M.; Julian, J.P.; Mayer, P.M. Identifying priority sites for low impact development (LID) in a mixed-use watershed. Landsc. Urban Plan. 2015, 140, 29–41. [Google Scholar] [CrossRef] [Green Version]
  19. Leidel, M.; Niemann, S.; Hagemann, N. Capacity development as a key factor for integrated water resources management (IWRM): Improving water management in the Western Bug River Basin, Ukraine. Environ. Earth Sci. 2012, 65, 1415–1426. [Google Scholar] [CrossRef]
  20. Webb, J.A.; Watts, R.J.; Allan, C.; Conallin, J.C. Adaptive Management of Environmental Flows. Environ. Manag. 2018, 61, 339–346. [Google Scholar] [CrossRef]
  21. Norton, B.A.; Coutts, A.M.; Livesley, S.J.; Harris, R.J.; Hunter, A.M.; Williams, N.S.G. Planning for cooler cities: A framework to prioritise green infrastructure to mitigate high temperatures in urban landscapes. Landsc. Urban Plan. 2015, 134, 127–138. [Google Scholar] [CrossRef]
  22. Emmanuel, R.; Loconsole, A. Green infrastructure as an adaptation approach to tackling urban overheating in the Glasgow Clyde Valley Region, UK. Landsc. Urban Plan. 2015, 138, 71–86. [Google Scholar] [CrossRef] [Green Version]
  23. De Macedo, M.B.; Do Lago, C.A.F.; Mendiondo, E.M. Stormwater volume reduction and water quality improvement by bioretention: Potentials and challenges for water security in a subtropical catchment. Sci. Total Environ. 2019, 647, 923–931. [Google Scholar] [CrossRef]
  24. Goncalves, M.L.R.; Zischg, J.; Rau, S.; Sitzmann, M.; Rauch, W.; Kleidorfer, M. Modeling the Effects of Introducing Low Impact Development in a Tropical City: A Case Study from Joinville, Brazil. Sustainability 2018, 10, 728. [Google Scholar] [CrossRef] [Green Version]
  25. Da Silva, C.; Schardong, A.; Garcia, J.; Oliveira, C. Climate Change Impacts and Flood Control Measures for Highly Developed Urban Watersheds. Water 2018, 10, 829. [Google Scholar] [CrossRef] [Green Version]
  26. Moura, N.C.B.; Pellegrino, P.R.M.; Martins, J.R.S. Best management practices as an alternative for flood and urban storm water control in a changing climate. J. Flood Risk Manag. 2016, 9, 243–254. [Google Scholar] [CrossRef]
  27. Miguez, M.G.; Rezende, O.M.; Veról, A.P. City Growth and Urban Drainage Alternatives: Sustainability Challenge. J. Urban Plan. Dev. 2015, 141. [Google Scholar] [CrossRef]
  28. IBGE. Censo Demográfico—2010; Instituto Brasileiro de Geografia e estatística: Rio de Janeiro, Brazil, 2010. [Google Scholar]
  29. Alvala, R.C.S.; Cunha, A.; Brito, S.S.B.; Seluchi, M.E.; Marengo, J.A.; Moraes, O.L.L.; Carvalho, M.A. Drought monitoring in the Brazilian Semiarid region. An. Acad. Bras. Cienc. 2019, 91. [Google Scholar] [CrossRef] [PubMed] [Green Version]
  30. Miguez, M.G.; Mascarenhas, F.C.B.; Magalhães, L.P.C. Multifunctional landscapes for urban flood control in developing countries. Int. J. Sustain. Dev. Plan. 2007, 2, 153–166. [Google Scholar] [CrossRef] [Green Version]
  31. Tassi, R.; Tassinari, L.C.D.S.; Piccilli, D.G.A.; Persch, C.G. Telhado verde: Uma alternativa sustentável para a gestão das águas pluviais (Green roof: A sustainable alternative to rainwater management). Ambiente Construído 2014, 14, 139–154. [Google Scholar] [CrossRef] [Green Version]
  32. ANA. Os Efeitos das Mudanças Climáticas Sobre os Recursos Hídricos: Desafios Para A Gestão. Agência Nac. Águas Brasília 2010, 1, 18. [Google Scholar]
  33. Libanio, P.A.C. The use of goal-oriented strategies in the building of water governance in Brazil. Water Int. 2014, 39, 401–416. [Google Scholar] [CrossRef]
  34. Brasil. Estabelece Diretrizes Nacionais Para o Saneamento Básico (Establishes Brazilian National Guidelines for Basic Sanitation). In Diário Oficial da União; Secretaria-Geral da Presidência da República Imprensa Nacional: Brasília, Brazil, 2007; p. 3. [Google Scholar]
  35. Libanio, P.A.C. Two decades of Brazil’s participatory model for water resources management: From enthusiasm to frustration. Water Int. 2018, 43, 494–511. [Google Scholar] [CrossRef]
  36. Ribeiro, M.M.R. A Few Comments on the Brazilian Water Resource Policy. New Water Policy Pract. J. 2017, 3, 22–32. [Google Scholar]
  37. Miranda, L.I.B. A Crise Hidrica e a Gestão das Águas Urbanas na Bacia Hidrográfica do Rio Paraíba. In Proceedings of the XVII ENAPUR, São Paulo, Brazil, 20–21 May 2017. [Google Scholar]
  38. Da Rangel, A.C.L.; Aranha, K.C.; Da Silva, M.C.B.C. Os telhados verdes nas políticas ambientais como medida indutora para a sustentabilidade. Desenvolv. Meio Ambiente 2015, 35. [Google Scholar] [CrossRef] [Green Version]
  39. Rufino, I.A.A.; Da Silva, S.T. Análise das relações entre dinâmica populacional, clima e vetores de mudança no semiárido brasileiro: Uma abordagem metodológica. Bol. Ciênc. Geod. 2017, 23, 166–181. [Google Scholar] [CrossRef]
  40. Ramalho, P.B.; Rufino, I.A.A.; Feitosa, P.H.C. Estimativa de Potenciais Problemas na Microdrenagem Urbana a Partir de Uma Avaliação Multicriterial Espacial (Estimation of Potential Problems in Urban Micro-Drainage from a Multicriteria Spatial Assessment). In Proceedings of the 5a Reunião de Estudos Ambientais, Porto-Alegre, Brazil, 18–19 June 2015. [Google Scholar]
  41. Alves, P.B.R.; Filho, H.M.; Tsuyuguchi, B.B.; Rufino, I.A.A.; Feitosa, P.H.C. Mapping of flood susceptibility in Campina Grande County—PB: A spatial multicriteria approach. Bull. Geod. Sci. 2018, 24, 28–43. [Google Scholar] [CrossRef]
  42. Santos, K.A.; Rufino, I.A.A.; Filho, M.N.M.B. Impacts of the disordered land occupancy: A study about an urban consolidated area in Campina Grande—PB. Eng. Sanit. Ambient. 2017, 22, 934–952. [Google Scholar] [CrossRef] [Green Version]
  43. Tsuyuguchi, B.B. Macrodrenagem e Ocupação do Solo no Município de Campina Grande: Caracterização, Simulação e Análises Sistêmicas (Macrodrainage and Occupation of Campina Grande: Characterization, Simulations and Analysis). Master’s Thesis, Federal University of Campina Grande, Campina Grande, Brazil, 2015. [Google Scholar]
  44. Nobrega, P.V.M. Análise do Sistema de Drenagem de Campina Grande/PB Para Proteção de Áreas de Risco de Inundação (Analysis of Campina Grande’s Drainage System to Protection of Floods Risk Areas). Master’s Thesis, Federal University of Campina Grande, Campina Grande, Brazil, 2012. [Google Scholar]
  45. ANA. Conjuntura dos recursos hídricos no Brasil 2018: Informe anual. Agência Nac. Águas 2018, 1, 72. [Google Scholar]
  46. Rêgo, J.C.; Galvão, C.O.; Albuquerque, J.P.T.; Ribeiro, M.M.R.; Nunes, T.H.C. A Gestão de Recursos Hídricos e a Transposição de Águas do Rio São Francisco Para O Açude Epitácio Pessoa—Boqueirão. In Proceedings of the XXII Simpósio Brasileiro de Recursos Hídricos, Florianópolis, Brazil, 26 November–1 December 2017. [Google Scholar]
  47. Aragão, R.; Figueiredo, E.E.; Srinivasan, V.S. Chuvas Intensas no Estado da Paraíba (Intense Rainfall for Paraiba State). In Proceedings of the V Simpósio de Recursos Hídricos do Nordeste, Natal, RN, Brazil, 4–7 November 2014; pp. 74–85. [Google Scholar]
  48. Paixão, F.J.R.; Andrade, A.R.S.; Azevedo, C.A.V.; Costa, T.L.; Guerra, H.O.C. Ajuste da curva de infiltração por meio de diferentes modelos empíricos (Infiltration curve adjustment through different models). Pesqui. Apl. Agrotecnol. 2009, 2, 108–112. [Google Scholar]
  49. Lin, W.; Ry, S.; Park, D.G.; Lee, J.; Cho, Y. Performance Evaluation of the Runoff Reduction with Permeable Pavements using the SWMM Model. Int. J. Highw. Eng. 2015, 17, 11–18. [Google Scholar] [CrossRef]
  50. Matheus, C.; Caetano, F.D.N.; Morelli, D.D.D.O.; Labaki, L.C. Desempenho térmico de envoltórias vegetadas em edificações no sudeste brasileiro (Thermal performance of vegetated buildings in southeastern of Brazil). Ambiente Construído 2016, 16, 71–81. [Google Scholar] [CrossRef] [Green Version]
  51. Ishimatsu, K.; Ito, K.; Mitani, Y. Use of rain gardens for stormwater management in urban design and planning. Landsc. Ecol. Eng. 2017, 205. [Google Scholar] [CrossRef]
  52. Ahmadisharaf, E.; Tajrishy, M.; Alamdari, N. Integrating flood hazard into site selection of detention basins using spatial multi-criteria decision-making. J. Environ. Plan. Manag. 2015, 59, 1397–1417. [Google Scholar] [CrossRef]
  53. Versini, P.-A.; Jouve, P.; Ramier, D.; Berthier, B.; Gouvello, B. Use of green roofs to solve storm water issues at the basin scale—Study in the Hauts-de-Seine County (France). Urban Water J. 2016, 13, 372–381. [Google Scholar] [CrossRef] [Green Version]
  54. Elmqvist, T.; Setala, H.; Handel, S.; Ploeg, S.V.D.; Aronson, J.; Blignaut, J.; Gomez-Baggethun, E.; Nowak, D.; Kronenberg, J.; Groot, R. Benefits of restoring ecosystem services in urban areas. Environ. Sustain. 2015, 14, 101–108. [Google Scholar] [CrossRef] [Green Version]
  55. Song, J.Y.; Chung, E.-S. A Multi-Criteria Decision Analysis System for Prioritizing Sites and Types of Low Impact Development Practices: Case of Korea. Water 2017, 9, 291. [Google Scholar] [CrossRef] [Green Version]
  56. Leite, B.P.; Fujimira, J.M.; Fernandes, J.S. Avaliação dos impactos na drenagem com a implantação de telhados verdes na UFMT—Campus Cuiabá utilizando o software SWMM (Assessment of green roofs into UFMT campus using SWMM software). In Proceedings of the 6° Simpósio de Geotecnologias no Pantanal, Cuiabá—Embrapa Informática Agropecuária/INPE, Cuiaba, Brazil, 22–26 October 2016; pp. 354–363. [Google Scholar]
  57. Palla, A.; Gnecco, I.; Lanza, L.G. Compared performance of a conceptual and a mechanistic hydrologic model of a green roof. Hydrol. Process 2012, 26, 73–84. [Google Scholar] [CrossRef]
  58. Korkealaakso, J.; Kuosa, H.; Niemelainen, E.; Tikanmaki, M. Review of Pervious Pavement Dimensioning, Hydrological Models and Their Parameter Needs. State-of-the-Art; VTT: Espoo, Finland, 2014; p. 63. [Google Scholar]
  59. Silveira, A.L.L.; Goldenfum, J.A. Metodologia generalizada para pré-dimensionamento de dispositivos de controle pluvial na fonte (Methodology for pre-sizing of rain control devices at source). Rev. Bras. Recur. Hídr. 2007, 12, 157–168. [Google Scholar]
  60. Rosa, D.J.; Clausen, J.C.; Michael, D. Calibration and Verification of SWMM for Low Impact Development. J. Am. Water Resour. Assoc. 2015, 51, 746–757. [Google Scholar] [CrossRef]
  61. Matlock, M. Low Impact Development: A Design Manual for Urban Areas. Centre for Agricultural and Rural Sustainability; University of Arkansas Press: Fayetteville, AR, USA, 2010. [Google Scholar]
  62. Caldas, A.; Pissarra, T.; Costa, R.; Neto, F.; Zanata, M.; Parahyba, R.; Sanches Fernandes, L.; Pacheco, F. Flood Vulnerability, Environmental Land Use Conflicts, and Conservation of Soil and Water: A Study in the Batatais SP Municipality, Brazil. Water 2018, 10, 1357. [Google Scholar] [CrossRef] [Green Version]
  63. Eckart, K.; McPhee, Z.; Bolisetti, T. Performance and implementation oflow impact development—Areview. Sci. Total Environ. 2017, 413–432. [Google Scholar] [CrossRef]
  64. Ariza, S.L.J.; Martínez, J.A.; Muñoz, A.F.; Quijano, J.P.; Rodríguez, J.P.; Camacho, L.A.; Díaz-Granados, M. A Multicriteria Planning Framework to Locate and Select Sustainable Urban Drainage Systems (SUDS) in Consolidated Urban Areas. Sustainability 2019, 11, 2312. [Google Scholar] [CrossRef] [Green Version]
  65. Andrés-Doménech, I.; Perales-Momparler, S.; Morales-Torres, A.; Escuder-Bueno, I. Hydrological Performance of Green Roofs at Building and City Scales under Mediterranean Conditions. Sustainability 2018, 10, 3105. [Google Scholar] [CrossRef] [Green Version]
  66. Lashford, C.; Rubinato, M.; Cai, Y.; Hou, J.; Abolfathi, S.; Coupe, S.; Charlesworth, S.; Tait, S. SuDS & Sponge Cities: A Comparative Analysis of the Implementation of Pluvial Flood Management in the UK and China. Sustainability 2019, 11, 213. [Google Scholar] [CrossRef] [Green Version]
  67. Siekmann, T.; Siekmann, M. Resilient urban drainage—Options of an optimized area-management. Urban Water J. 2015, 12, 44–51. [Google Scholar] [CrossRef]
  68. Coutts, A.M.; Tapper, N.J.; Beringer, J.; Loughnan, M.; Demuzere, M. Watering our cities: The capacity for Water Sensitive Urban Design to support urban cooling and improve human thermal comfort in the Australian context. Progress Phys. Geogr. 2012, 37, 2–28. [Google Scholar] [CrossRef]
  69. Huang, J.J.; Li, Y.; Niu, S.; Zhou, S.H. Assessing the performances of low impact development alternatives by long-term simulation for a semi-arid area in Tianjin, northern China. Water Sci. Technol. 2014, 70, 1740–1745. [Google Scholar] [CrossRef]
  70. Bressiani, D.A.; Gassman, P.W.; Fernandes, J.G.; Garbossa, L.H.P.; Srinivasan, R.; Bonumá, N.B. Review of Soil and Water Assessment Tool (SWAT) applications in Brazil: Challenges and prospects. Int. J. Agric. Biol. Eng. 2015, 8, 9–35. [Google Scholar]
  71. Montenegro, A.; Ragab, R. Hydrological response of a Brazilian semi-arid catchment to different land use and climate change scenarios: A modelling study. Hydrol. Processes 2010, 24, 2705–2723. [Google Scholar] [CrossRef]
  72. Parkinson, J.; Tayler, K.; Mark, O. Planning and design of urban drainage systems in informal settlements in developing countries. Urban Water J. 2007, 4, 137–149. [Google Scholar] [CrossRef]
  73. Ako, A.A.; Eyong, G.E.T.; Nkeng, G.E. Water Resources Management and Integrated Water Resources Management (IWRM) in Cameroon. Water Resour. Manag. 2010, 24, 871–888. [Google Scholar] [CrossRef]
  74. Kalbus, E.; Kalbacher, T.; Kolditz, O.; Krüger, E.; Seegert, J.; Röstel, G.; Teutsch, G.; Borchardt, D.; Krebs, P. Integrated Water Resources Management under different hydrological, climatic and socio-economic conditions. Environ. Earth Sci. 2012, 65, 1363–1366. [Google Scholar] [CrossRef] [Green Version]
Figure 2. Land-use and legislation- based methodology: (a) Description of the modelling framework; (b) Land-use data for each catchment.
Sustainability 12 00661 g002
Figure 3. Flooding risk classification for each block in the catchments. (a) S1 for RT 2 years; (b) S1 for RT 5 years; (c) S2 for RT 2 years; (d) S2 for RT 5 years.
Sustainability 12 00661 g003
Figure 4. Validation points for: (a) S1 in RT 2 and 5 years and; (b) S2 in RT 2 and 5 years.
Sustainability 12 00661 g004aSustainability 12 00661 g004b
Figure 5. Percentage of runoff volume reductions with GR application in scenario 1 for the 29 severe sub-catchments.
Sustainability 12 00661 g005
Figure 6. Percentage of runoff volume reductions with GR application in scenario 2 for the 49 severe sub-catchments.
Sustainability 12 00661 g006
Figure 7. Reduction of severe flooding blocks after the implementation of green roofs (GR), permeable pavements (PP) and rain gardens (RG).
Sustainability 12 00661 g007
Figure 8. The relation between RG applied area and runoff reductions for RT 2 and 5 years, on: (a) scenario 1 and; (b) scenario 2.
Sustainability 12 00661 g008
Figure 9. Flooding blocks after SuDS combination implementation.
Sustainability 12 00661 g009
Table 1. Brazilian government levels and water legislation responsibilities.
Government LevelsEnvironmental ProtectionWater Resources ManagementWater Supply and Sanitation
FederalInter states impactsFederal waters
StatesInter municipalities impactsState watersInter municipalities services
MunicipalitiesLocal impacts Local services
Source: Libanio [33].
Table 2. Conditioning factors selected to the application of SuDS legislation in scenarios.
Conditioning FactorsDescriptionSources
Urban development (land-use input)Residential, commercial, institutional and no use areas.Obtained from PMCG (2010)
Physical specificities (hydrological and climate inputs)Rainfall 1, soil type and infiltration 2 Aragão, et al. [47]
Paixão, et al. [48]
Drainage system assetsObtained from PMCG (2019)
ClimateKöppen-Geiger Climate
Brazilian Guidelines for Buildings 15.220 of 2003 (Brazilian Bioclimatic Zones)
Alternatives for SuDS application (governance input)Suggests sustainable measures for flooding mitigation in the city Federal level: Basic Sanitation Plan (Federal Law 11.445/2007)
Mandatory use of green roofs in condominiums with more than three buildings.State level: Law 10.047/2013 (for Paraíba state)
Rate of imperviousness granted according to uses and areas. Max imperviousness: 80%/Min permeability: 20%Municipal level: Master Plan (Complementary Law 003/2006)
Sources: 1 Aragão, et al. [47] and 2 Paixão, et al. [48].
Table 3. Input in SWMM.
InputParametersDescriptionValues
Sub-catchments or blocks (312 blocks)AreaArea of the sub-catchment-
WidthThe maximum length that surface runoff will course inside the sub-catchment-
SlopeThe slope of the sub-catchment-
IAImpermeable area-
NISurface roughness (Manning’s n) for the overland flow of impervious portion in a sub-catchment0.011
NPSurface roughness (Manning’s n) for the overland flow of pervious portion in a sub-catchment0.04
DIDepression storage depth of impervious portion of the sub-catchment1.01 mm
DPDepression storage depth of pervious portion of the sub-catchment5.08 mm
AINCThe fraction of the impervious area without depression storage10%
Rain gauges from real events
(IDF—Intense, duration and frequency equation)
i = K . T r m ( b + t ) n
Source: [47]
KLocal parameter334
BLocal parameter5
nLocal parameter0.596
mLocal parameter0.227
tRainfall duration120 min
RTReturn period2 and 5 years
Infiltration (Horton equation)
f t = f c + ( f 0   f c ) e k t
Source: [48]
Initial infiltration capacity (f0)Maximum infiltration rate396.10 mm/h
Final infiltration capacity (fc)Minimum infiltration rate7.10 mm/h
Decay constant (k)Decay constant specific to the soil2.677 l/h
Table 4. Final SuDS parameters input in SWMM.
InputParametersValueSource
Green Roof (GR)Surface depth (mm)15Adapted from [56,57]
Surface vegetable cover0.11
Surface Roughness0.15
Surface slope (%)2.5
Drainage thickness (mm)3
Drainage voids index0.6
Drainage roughness0.1
Permeable pavement (PP)Surface depth (mm)10Adapted from [58,59]
Surface Roughness0.05
Surface slope (%)6
Pavement thickness (mm)100
Pavement voids index0.2
Pavement impermeable surface fraction0
Pavement permeability (mm/h)5.4
Pavement clogging180
Storage thickness (mm)350
Storage voids index0,6
Storage filtration index7
Storage clogging180
Rain garden (RG)Surface depth (mm)15Adapted from [60,61]
Surface vegetable cover0.11
Surface Roughness0.1
Surface slope (%)1.0
Table 5. SuDS alternatives modelled with SWMM.
SuDSCasesSuDS Location: Defined by Legislation in Charge and Land-Use DevelopmentScenarios: Defined by Legislation in ChargeReturn Period
No measures1–4-1 and 22 and 5 years
Green roofs (GR)5–8Condominiums, with more than three constructed buildings (Law 10.047/2013)1 and 22 and 5 years
9–12Institutional/public buildings 1 and 22 and 5 years
13–16Free spaces/no use1 and 22 and 5 years
Permeable paving (PP)17–20Sidewalks of free spaces1 and 22 and 5 years
21–24Every sidewalk1 and 22 and 5 years
Rain gardens (RG)25–28Free spaces/no use1 and 22 and 5 years
Combination of all29–30GR in institutional/public buildings22 and 5 years
PP in every sidewalk
RG in free spaces/no use
Table 6. Blocks with SuDS applied and blocks with reduced runoff after SuDS.
CasesNumber of Blocks with SuDS AppliedPercentage of Blocks with SuDS Applied (%)Number of Blocks with Reduced RunoffPercentage of Blocks with Reduced Runoff (%)
Scenario 1—Current occupation
GR on condominums1241.429100.0
GR on public buildings1551.72172.4
GR on free/no use areas1551.72896.6
PP on sidewalks of free/no use areas1758.62689.7
PP on every sidewalk29100.029100.0
RG on free/no use areas1551.72896.6
Scenario 2—Legislation upper limit scenario
GR on condominums2244.93367.3
GR on public buildings2551.03877.6
GR on free/no use areas3061.23979.6
PP on sidewalks of free/no use areas3265.34898.0
PP on every sidewalk49100.04898.0
RG on free/no use areas3061.24081.6
Table 7. Rank of SuDS alternatives in each scenario according to this methodology.
Scenario 1—Current Occupation
RankSuDS and LocationReduction of Severe Flooding Blocks (%)
1PP on every sidewalk55.2
2RG on free/no use areas48.3
3GR on condominiums44.8
4PP on sidewalks of free/no use areas34.5
5GR on free/no use areas31.0
6GR on public buildings13.8
Scenario 2—Legislation upper Limit Occupation Area
RankSuDS and LocationReduction of Severe Flooding Blocks (%)
1Combination of GR, PP and RG85.7
2GR on public buildings24.5
3RG on free/no use areas18.4
4PP on every sidewalk10.2
5GR on free/no use areas8.2
6GR on condominiums4.1
7PP on sidewalks of free/no use areas4.1

