Article

How to Engage with Sustainability Issues We Rarely Experience? A Gamification Model for Collective Awareness Platforms in Water-Related Sustainability

1
European Institute for Participatory Media, 10117 Berlin, Germany
2
IACS—Institute for Applied Computer Science, University of Applied Sciences Stralsund, 18435 Stralsund, Germany
*
Author to whom correspondence should be addressed.
Sustainability 2020, 12(2), 712; https://doi.org/10.3390/su12020712
Submission received: 30 November 2019 / Revised: 12 January 2020 / Accepted: 15 January 2020 / Published: 18 January 2020

Abstract

:
Collective awareness platforms offer innovative ways to engage citizens in becoming aware of and contributing solutions to sustainability challenges, such as climate change, water scarcity, or extreme weather events. Although such platforms have been successful in engaging citizens to contribute and self-organize during or directly after emergency situations, it has proven rather hard to motivate citizens to participate in preparing their local communities to address sustainability challenges whose effects are likely to be felt in the future and which they have not experienced yet. In this paper, we discuss the development, implementation, and assessment of a gamification model for a collective awareness platform for water-related sustainability challenges. The model is designed to address the motivational drivers of different user types and uses visualization elements to support gamified interaction in a way that relates otherwise intangible, abstract issues to more immediate (short-term), tangible objectives. The model was empirically validated with 507 users through a series of online experiments. The results confirmed a positive motivational effect in a large majority of participants and the suitability of the model to address different user types and various water-related sustainability issues. The findings will inform the design of gamification models for collective awareness platforms in sustainability-related domains.

1. Introduction

The adverse consequences of human activity on the planet, such as climate change, have been in the spotlight of the public debate recently. However, this area is also characterized by a strong attitude–behavior gap [1]: people tend to say that they are concerned about the environment, although they often fail to consistently integrate this concern into their daily behavior, especially when they are not able to immediately experience the effects of their behavior (or lack thereof). Partially, this occurs due to the fact that the consequences of many environmental issues, such as water shortages, are not immediately visible. In the past, extreme events, such as droughts or flooding, tended to occur rarely and distant in time. Although these challenges have been intensified by climate change, which has caused droughts and flooding to become more acute and frequent, extreme weather-related water challenges are typically not considered a real problem until they actively disturb the livelihood of those affected [2,3]. Consequently, citizens tend to have a low awareness of water-related sustainability issues and consider this problem of low personal relevance. This makes it difficult to appeal to citizens’ awareness of the problem and the need to prepare individually and as a community, particularly when there is no imminent danger or when memories of the last event have long faded away.
At the same time, this issue is exacerbated by the fact that increasing awareness of water shortages, changing behavior toward water conservation, and increasing preparedness for extreme weather events are beneficial when achieved collectively in a whole city or group of people and not only individually. Only when a city and its citizens as a whole know how to act when a flood occurs, or when they have undertaken protective measures in advance, can the adverse consequences of such events be effectively mitigated. Here, new models of collective awareness platforms can be used to promote behavioral change, not only top–down through the government, but also through the public involvement of citizens [4].
Collective awareness platforms (CAPs) can be broadly defined as internet-based platforms that harness the potential of state-of-the-art digital technologies and social networks to raise awareness and engage citizens in collaborative action for collective solutions to sustainability challenges and societal needs [5,6]. Different examples of such platforms range from collective responses to natural disasters and emergencies [7] to large-scale collaborative problem-solving for climate change solutions [8,9] to citizen engagement in participatory digital social innovation [10].
Such collective platforms have been successful in engaging citizens to contribute and self-organize during or directly after emergency situations (e.g., hurricanes). However, it has proven rather hard to motivate large numbers of citizens to participate in preparing their local communities in advance to address sustainability challenges whose effects are likely to be felt in the future and which they have not directly experienced yet. The latter is a particular challenge for local collective awareness platforms for sustainability that aim at engaging citizens in contributing to the preparedness of their communities and in mitigating and/or solving complex environmental challenges that affect multiple actors on a range of scales. In contrast to traditional top–down approaches, effectively addressing such challenges requires flexible solutions that can relate different individual and collective perspectives to the shared challenge by involving experts, policymakers, and the general public [11,12,13].
Furthermore, in order to design such collective awareness platforms, people from very different backgrounds and with very different levels of knowledge and motivational drivers need to be motivated to engage with individual actions and contributions to the collective awareness. As highlighted in Bagnoli et al. [14], effective realizations of such activities require effective engagement and contributions by a large number of participants with very different motivational attributes and cognitive strategies and with varying levels of awareness and exposure to the issues addressed, as well as with different perceptions and biases (psychological, cognitive, and social), which are often shaped by and contingent on a given social community.
In our work, we have explored how gamification approaches and techniques [15] could be effectively designed and applied to provide additional motivational drivers and incentives. We have also studied how gamification elements integrated into collective awareness platforms could help to increase user interaction and engagement among various types of users with different backgrounds. Gamification techniques have already been successfully applied in different domains to increase user motivation to interact with others and share knowledge on online platforms (see Böckle et al. [16] for an overview). However, most current gamification approaches, especially in the area of sustainability, are not specifically tailored to the motivational drivers of various users. Moreover, when attempting to motivate users to learn about and contribute to solving sustainability issues whose effects they have not immediately experienced and where the benefits do not only accrue to them individually but rather to the whole collective (e.g., the city or municipality), the motivational drivers of various users need to be uncovered and addressed with specific gamification elements tailored to them. This is especially critical in this context, where the “target users” are a very heterogeneous group by definition (e.g., a city population) with very different levels of awareness of the given sustainability issue and with a wide range of personality attributes, cognitive strategies, and biases [13].
In this paper, we present a theoretically grounded gamification model for a collective awareness platform that motivates users to gain knowledge and raise awareness about water-related sustainability issues in their cities and contribute to the capacity of their city to perform mitigation measures and/or collectively develop new solutions. The overall design of the collective awareness platform has been described in Becker et al. [4], whereas in this paper the focus is on the development and evaluation of the gamified incentive model. The main advantage of the model presented in this paper is that it was designed to effectively engage different types of users by recognizing their distinct motivational drivers and persuasive strategies [17] and offering them specifically tailored gamification elements. Addressing different motivational user types enables the minimization of biases (e.g., gender bias) that could result from relying on just one specific type of incentive as well as allows for an increase in engagement with the platform. The ability to motivate very different types of users in order to engage them with local sustainability issues and help their communities prepare for their mitigation is an original contribution to the design of collective awareness platforms. Moreover, the ability to support a variety of motivational drivers, while limiting the number of gamification elements used, is an original contribution to the field of gamification research and design.
This paper describes the design, implementation, and assessment of the developed gamified incentive model for a collective awareness platform for water-related sustainability challenges. It starts by reviewing the main gamification and persuasive models and theories relevant to the application context as well as validated empirical studies on the implementation of similar gamification models in sustainability-related domains. Next, a description of the developed gamification model design is presented, including key design features that help to address different user types. Subsequently, the results of an extensive assessment of the developed model in a series of online crowd tests are given. Finally, design guidelines are derived that can inform the design of similar collective awareness platforms in sustainability-related domains.

2. Design of the Gamified Incentive Model for Sustainability Challenges

2.1. Theoretical Background

A gamified application is a utilitarian application extended with “game-design elements in non-game contexts” [15]. In contrast to the concept of “serious games”, which are complete games in their own right, gamified applications are designed as enhancements of existing systems or applications that incorporate game-based mechanisms [18]. Extending a serious application with game-like elements allows for increasing the motivation and engagement of users in using the application, increasing participation in interacting and/or sharing information or knowledge, and enhancing experience and satisfaction with the application [19,20,21].
Typical examples for extending the functionalities of an application with gamified elements include rewarding specific actions in using the application with point-based systems (e.g., posting a comment, registering for a newsletter), providing symbolic achievements that are awarded upon reaching a certain point score (e.g., badges), progress feedback indicators that allow one to measure personal performance in using the system (e.g., qualification level in learning a skill), and functionalities to compare oneself to others (e.g., position on a ranked list of users by performance, the so-called leaderboard). Most existing applications in various areas use gamification techniques to achieve these goals (e.g., a Fitbit to monitor one’s exercising activity). Especially in the sustainability context, where the motivation of users is not that evident, gamified applications can help to achieve desirable outcomes or behavioral change without necessarily having to be playful or fun in the sense that a real game would be [22]. According to the theories of persuasive design, such as the Fogg model [20] and the persuasive system design model [21], incorporating gamification elements into the platform could provide persuasion triggers needed to motivate and engage users. For example, a gamified application can be a system to encourage people to save energy, where users can track their monthly consumption or learn how to save energy. The actions that users pursue in the system can be associated with a reward, for example when users achieve a certain number of points. Sometimes, a badge can be provided as a means of recognizing what has been achieved.
The use of gamification for furthering awareness and understanding of environmental issues has been investigated in the sustainability domain aimed at stimulating behavior changes in users with respect to their use of natural resources. It has been shown that gamified applications can help users change their behavior to be conscious of environmental issues [23]. This is especially the case for energy saving, where most efforts have been concentrated so far, and to a smaller extent for stimulating water saving (see References [24,25]). Existing gamified applications addressing water sustainability issues tend to either focus on the individual consumer perspective (e.g., stimulating individual water-saving behavior) or on improving urban water management (e.g., increasing water efficiency, balancing water demand and supply better). As can be derived from Albertarelli et al. [24] in the water domain, existing approaches have predominantly investigated the use of games rather than gamified applications.
Similarly, only a few approaches regarding gamification in water sustainability have been explicitly theoretically grounded with respect to the employed motivational mechanisms and the gamification design for persuasion [26], and only a few have been empirically validated (see References [24,26]). Accordingly, due to the scarce availability of evaluation data, little can be said about the effectiveness of existing strategies. Published findings from the SmartH2O project and a few similar approaches with a strong focus on gamified feedback of measured water consumption have provided encouraging results in terms of effects on water saving [26]. However, none of the water-related approaches reviewed so far [24,25] have explicitly considered theoretically founded and empirically validated models and their relationships to specific gamification elements and persuasive strategies for specific user types as a basis that informs their design.
Considering the context of the collective awareness platforms and their use by very distinct types of users, the aim of this paper is to develop a gamification model that can motivate a diverse group of users to engage in preparing for water issues that lie in the future and whose occurrence the users have never experienced. By tapping into the tacit motivations driving user behavior and the motivation to use a given system, such a gamification model can thus relate otherwise intangible, abstract issues to more immediate (short-term), tangible objectives that are the most understandable and motivating for the users. The motivations of users can be very different, and thus specific persuasion and gamification strategies are required in order to motivate them to use a collective awareness platform. Therefore, the aim of a gamification model is to recognize the types of users that will be using the system, infer their motivations, and provide specific gamification elements to motivate them. For example, a person with needs-based motivations who focuses on achieving success and avoiding failure would be more motivated by positive motivational messages as well as symbolic rewards in terms of badges, whereas someone with socially based motivation would be rather motivated by the ability to interact and share with others on the platform [27].
There have been some efforts in the literature to incorporate motivational aspects and consider the differences between users based, e.g., on their personality characteristics. For example, Orji et al. [17] introduced persuasion strategies, e.g., personalization, cooperation, simulation, self-monitoring, and feedback, and found that some are better suited to address users with specific personality traits than others [28]. For example, users who score high on conscientiousness would rather be motivated by elements that correspond with a goal-setting strategy, whereas those who score high on extraversion are motivated by a rewards strategy [28]. Thus, the authors confirmed that depending on which personality trait is more expressed in a person, they might perceive the various elements of a gamification model differently.
As the mapping of personality characteristics to the appropriate gamification elements has been recognized as difficult [29], authors have been trying to develop models that identify user types specifically in the context of games and gamified applications. In the gamification literature, there are several user type typologies, e.g., References [30,31]; however, the recently developed and empirically validated Hexad user typology applies specifically to gamified applications [32]. The Hexad typology [33] proposes six user types with distinct motivational profiles: socializers, free spirits, achievers, philanthropists, players, and disruptors. For example, socializers are motivated by interactions and social connections, whereas philanthropists search for meaning in the activities they perform on the platforms. The authors [32,33] then found empirical correlations between the Hexad user types and the design elements (summarized in Table 1), thus recognizing suitable motivational mechanisms to engage a diverse spectrum of users with a gamified application. In Table 1, we can see that, for example, a philanthropist user type who is searching for purpose and meaning and wants to help others could be motivated by gamification elements such as those that involve gifting, collecting certain items, or taking on “administrative” roles. Thus, the researchers provided guidance into the design of gamification models: once suitable user types are identified, one can design the appropriate gamification elements that are more likely to motivate them.
To our knowledge, however, the Hexad typology has not yet been applied to gamified applications in the sustainability domain. We believe that applying this model in a collective awareness platform can help to motivate a broad spectrum of users to engage in water-related sustainability challenges and help users prepare for water issues they have not directly experienced. For example, socializers might be motivated by the ability to share and engage with the community about their experiences with similar water issues, whereas players and achievers could be addressed through more “classical” types of elements, such as badges and points for reading articles and sharing them with their network. However, in order to identify the specific gamification elements for each user type in the context of a collective awareness platform, we need to first identify the persuasive strategies that will allow us to translate the intangible and abstract issues pertaining to more immediate (short-term), tangible objectives that can motivate various types of users.
Researchers have undertaken attempts to identify models and frameworks that explain the chosen persuasive gamification strategies [17,28,34,35], and others have focused on the gamified design elements that can support these strategies [28,29,32,33]. However, to our understanding, there is no unified gamification model that directly links the persuasive strategies to the gamified elements and maps them to appropriate user types. Using insights from the studies presented above, we derived a gamification model that links the gamified strategies that are appropriate to promote knowledge acquisition in water-related issues for different types of users. Accordingly, the approach pursued in the gamification of the collective awareness platform provides a significant contribution to the state-of-the art literature in this area, both in terms of the theoretically grounded gamification design as well as in the empirical evaluation of its validity.

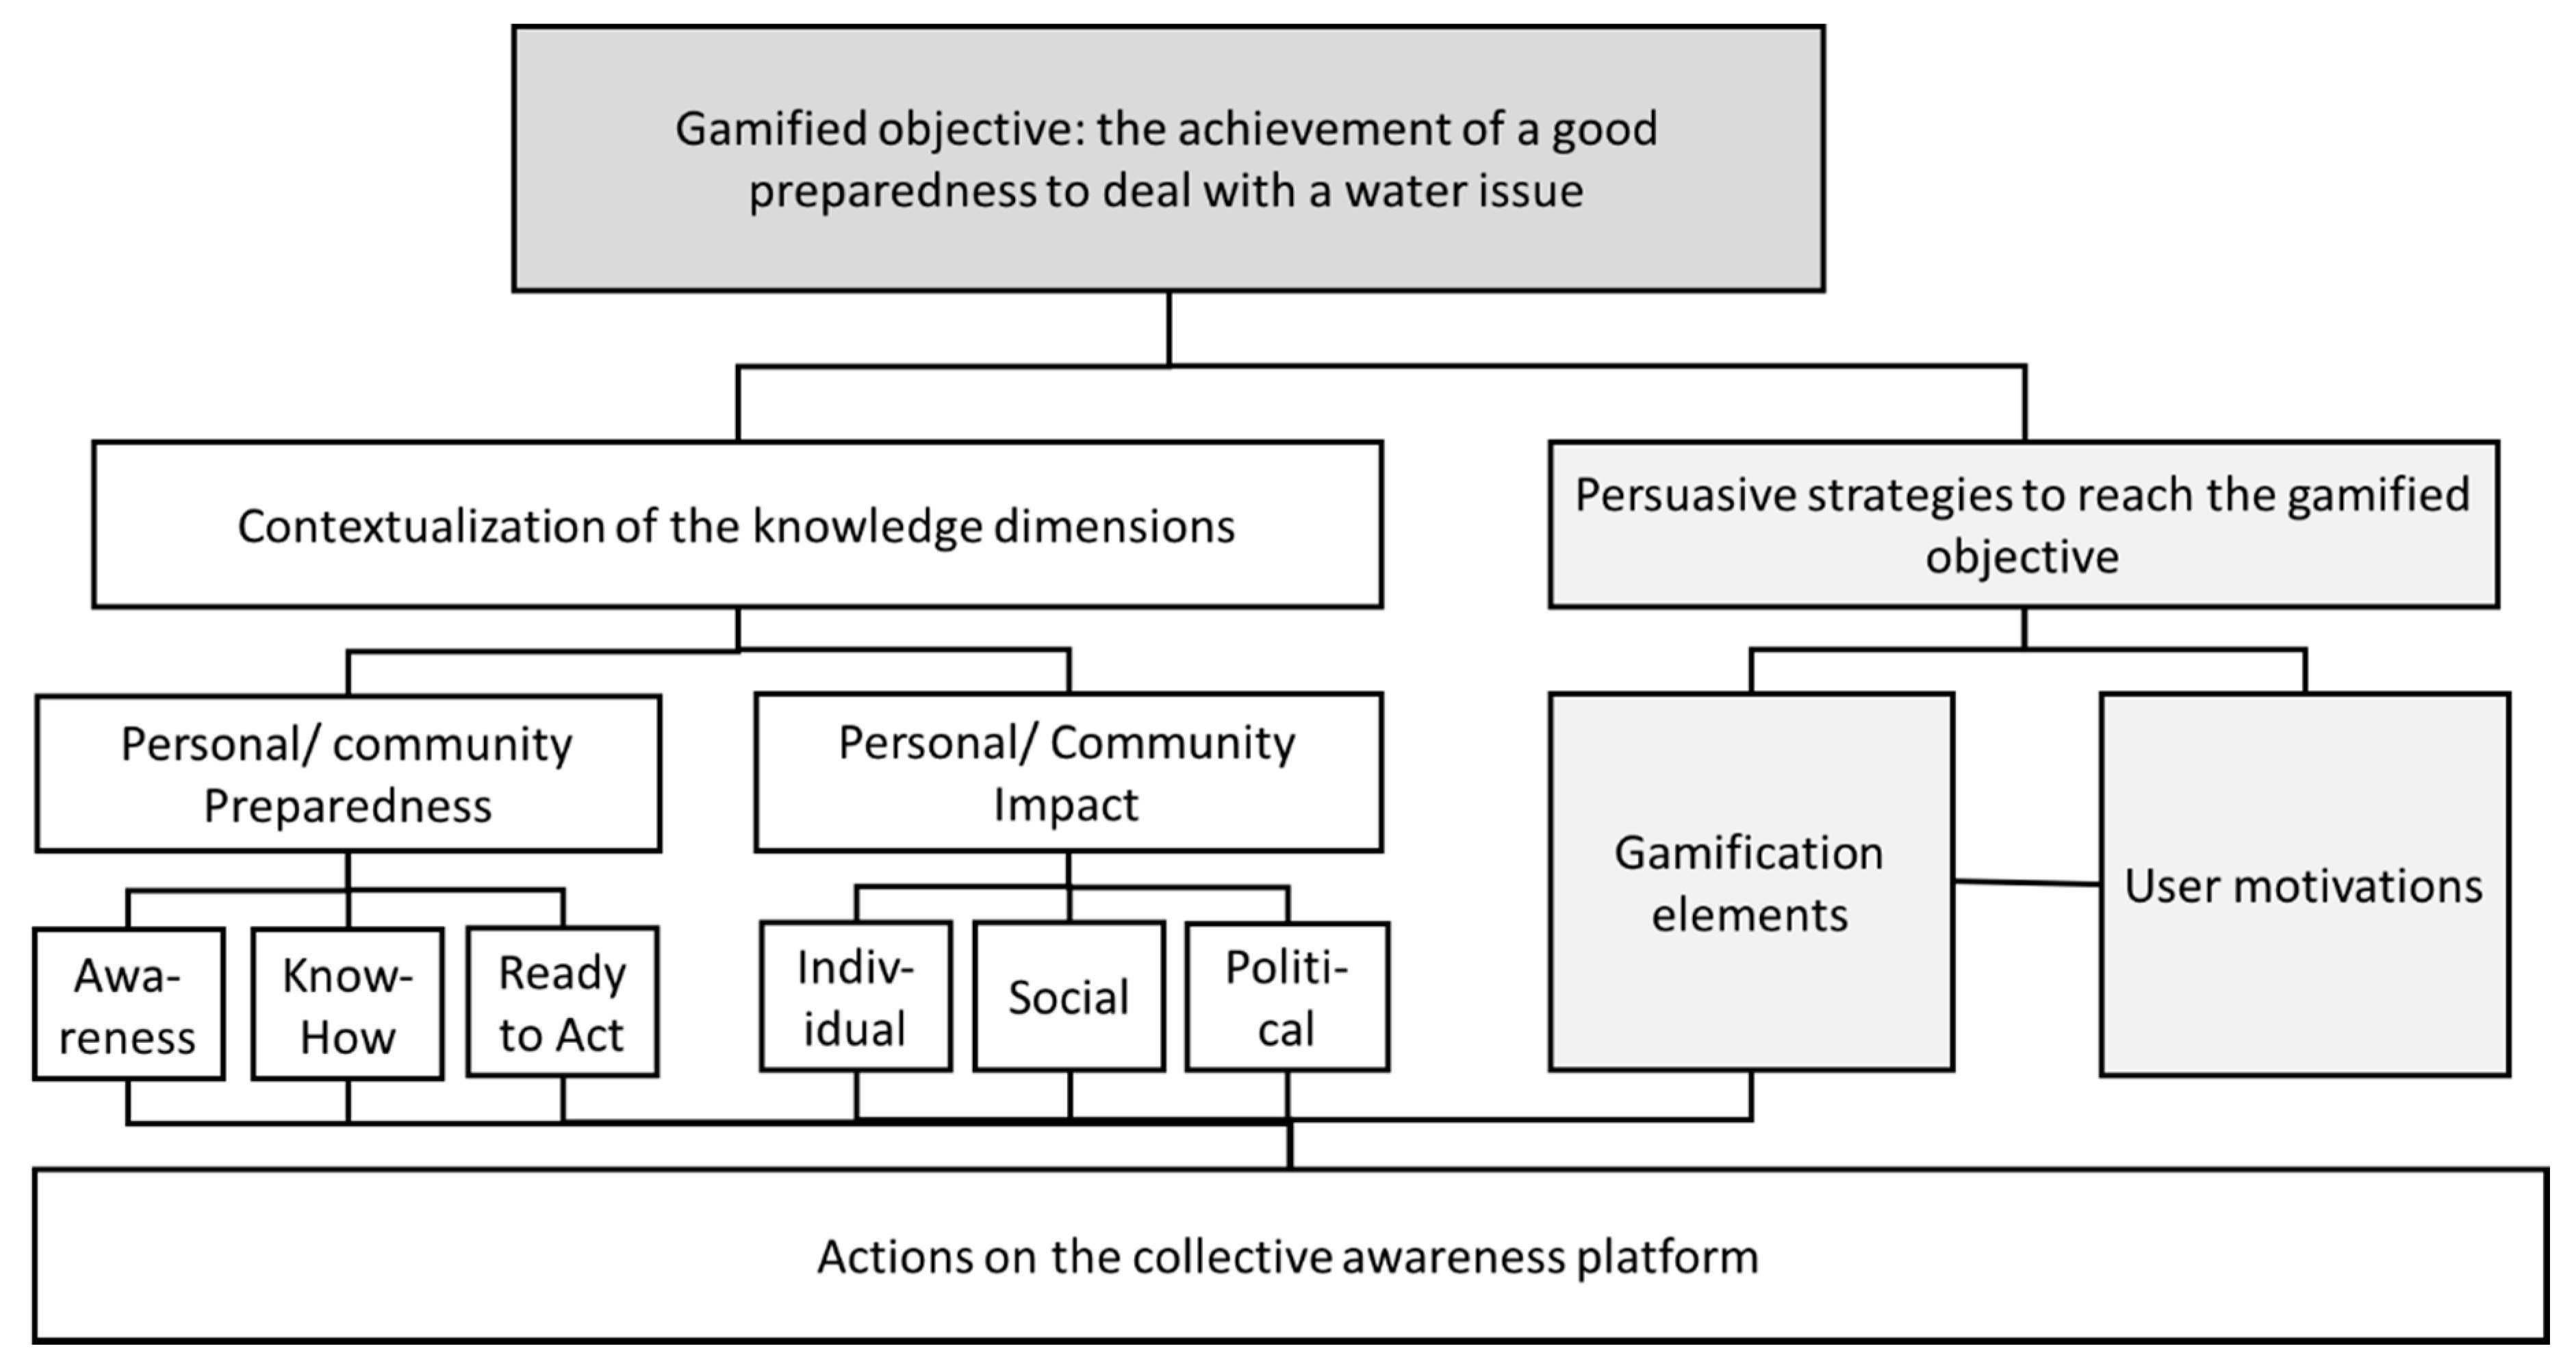
2.2. The Gamified Incentive Model for Collective Awareness Platforms in Water Sustainability

According to the literature presented in the previous section and insights into developing gamification models from other domains, a gamified incentive model for collective awareness platforms connects the actions people undertake on the platform to the gamified objective through two streams (as depicted in Figure 1): the contextualization of knowledge dimensions specific to the collective awareness platform in question and persuasive strategies that combine selected gamification elements that are motivating for specific user types. We will discuss each of these elements of the gamified incentive model in detail below.
The core objective of a collective awareness platform is to help persons and the community as a whole to gain knowledge and raise awareness about water-related issues affecting the community. It is a difficult challenge to motivate users to learn about and get engaged with issues that may not seem immediate or tangible in the short term. Water issues that tend to occur only sporadically, such as flooding or water scarcity, are typically not considered problems until they directly affect the livelihood of local communities. This makes it difficult to appeal to citizens about the need to become informed and prepare, especially when there is no imminent danger or when the memory of the last events has long faded away. The basic principle of the application of gamification to such issues is to relate the intangible or long-term effects of a given issue (or issues, depending on the focus of the collective awareness platform) to more immediate (short-term), tangible objectives that users can reach through interacting with the application. In this sense, as the starting point for the gamification model, a gamified objective for the collective awareness platform is defined as “the achievement of good preparedness in the given local water community in dealing with their specific water issue(s)”. The defined gamified objective relates to both the individual users and their community. Specifically, by participating in the collective awareness platform, the objective for the users is to become prepared for the given water issue(s) themselves and help their community in reaching the community objective.
The next fundamental pillar of the gamified incentive model is the contextualization of knowledge dimensions for the different types of interaction and engagement of the users with and through the collective awareness platform, which allows for achievement of the gamified objective. The contextualization of knowledge occurs along two dimensions: the personal/community preparedness dimension and the impact dimension. To reach the personal gamified objective of personal preparedness, users need to attain knowledge in three categories: problem awareness, know-how, and readiness to act. The problem awareness dimension reflects actions that contribute to raising awareness and knowledge about problems (e.g., learning about flood risk or about the need to save water). The know-how dimension reflects actions that contribute to learning about what users can do to contribute to better dealing with water issues (e.g., to help prevent flooding). The readiness to act dimension reflects actions that contribute to increasing the readiness of users to act upon specific water issues (e.g., filling out a checklist to verify their preparedness to act in protecting themselves and their family in the case of flooding).
The impact perspective has been broken down into the following three dimensions: individual, social, and political. The individual impact dimension corresponds to the impact of the user’s actions on overall personal preparedness. The social impact dimension reflects the individual’s contribution to improving awareness, spreading know-how, or being ready to act upon the water issues at hand within one’s social community (e.g., by sharing information from the platform with others). Similarly, the political impact dimension reflects the extent of contribution of a given action to raising the political preparedness of the community with respect to the individual knowledge dimensions (e.g., taking part in a local assembly with a policymaker). Thereby, depending on the nature of a given action (e.g., reading a post on the problem of local water scarcity and the need to save water, reading a water saving tip), the user is contributing to increasing personal and/or community preparedness (to a different extent for the different dimensions reflected in Figure 2). By relating user interactions on the platform to these dimensions, we can make otherwise abstract water issues that are not perceived in everyday life seem more tangible and immediate (e.g., by showing progression in different dimensions). In Figure 2, we show example scores assigned for a type of action and their distribution along the dimensions. It is important to note that for each action user receives a different number of points in several of these dimensions.
Once the different types of interaction and engagement of the users with and through the collective awareness platform are contextualized, we need to identify specific gamification elements, which allow for the achievement of persuasive strategies needed to reach the overall gamified objective (second pillar in Figure 1). The persuasive strategies that will allow us to achieve the gamified objective are based on Orji et al. [17] and include simulation, self-monitoring and feedback, rewards, goal-setting and suggestion, cooperation, and comparison. The strategies, in turn, can be achieved by selecting and applying to our specific context a set of gamified design elements (initial list based on Marczewski [32] and presented in Table 1). To map the design elements to their corresponding persuasive strategies, we use the goals defined for each of the persuasive strategies in the literature by Orji et al. [17] and then identify the design elements that can help reach these goals. Finally, recognizing that different users can be motivated by different factors [16], the gamification elements are chosen in such a way that they can trigger the motivation of the various user types identified in the literature. Specifically, we identify the user types that can be motivated by design elements, relying on a correlational analysis by Tondello et al. [29] and the motivations of the specific user types in the different study of the same authors [33]. Addressing different motivational types allows us to avoid biases (e.g., gender bias) that could otherwise be caused if relying on just one specific type of incentive (e.g., competition vs collaboration). Mapping of the gamified elements to their respective persuasive strategies and user types is presented in Table 2 and will be discussed in detail below.
The first persuasive strategy, simulation, allows users to observe the cause-and-effect linkage of their behavior [17] and is the main strategy within and backbone of the gamification design model. Increases in knowledge about water issues as a result of using the collective awareness platform are incremental and hard to track for users on their own. Therefore, by performing different actions (e.g., confirming reading a section of an issue, commenting on the article, liking a comment or a tip), users gain points in the different dimensions reflected in Figure 2 based on the extent to which a given action is effectively considered to contribute to a given dimension. The scores in each category show how well the users progress toward the achievement of the gamified objectives, i.e., increasing their personal and community preparedness with respect to a given water issue. Tracking the total points is especially motivating for achievers and players, as achievers are motivated by progress and points allow them to track their progress, whereas for players, points represent a form of extrinsic reward.
The second persuasive strategy is self-monitoring and feedback, which allows users “to track their own behaviors, providing information on both past and current states” [17]. As shown in Figure 2, users on the collective awareness platforms can track their progress in nine knowledge areas. In order to reduce complexity, we chose to aggregate this information as six scores distributed over two views, namely 1) knowledge areas (problem awareness, know-how, and readiness to act aggregated over their individual, social, and political impact) and 2) individual, social, and political impact aggregated over their problem awareness, know-how, and readiness to act scores. Then, we showed these scores to the users with specific progress indicators, as reflected in the gamified dashboard presented in Figure 3 (personal preparedness and personal impact). Monitoring how their preparedness increases with the aggregated progress indicators is especially motivating for achievers, as they seek to progress by completing tasks [30], as well as for players, as this reflects how they have performed within the system.
The third strategy is rewards: offering “virtual rewards to users for performing target behavior” [17]. As the total number of accrued points for each category grows, it allows the users to get closer to achieving the gamified objective of being prepared, and thus they are rewarded with achievement badges (see the “Flood Warden” achievement badge in Figure 3). In gamified visualization, there are three levels—beginner, intermediate, and advanced—and a progress bar indicates how far away the user is from achieving the next badge. This gamification element is most likely to motivate players, as they are looking out for external rewards for performing certain behaviors [33]. Additionally, achievers might be stimulated by the different levels, as they like to tackle difficult challenges.
The fourth strategy, goal setting and suggestion, is “to set a clear behavior goal and recommend certain actions to users” [17]. The ultimate goal of the collective awareness platforms is for the users to gain enough knowledge to become prepared to tackle the water issues. In order to prepare well, the user has to achieve an equal number of points in each of the nine categories (see Figure 2), which are displayed in the gamified visualization dashboard as the outer circle on the spider chart diagram (see Figure 3 and Figure 4). To help the users reach this goal, the gamified visualization elements described above contain several “levels” that can serve as in-between goals, specifically 1) the small colored items in the preparedness and impact sections of the progress bar visualizations and 2) the beginner, intermediate, and advanced levels of the achievement badges. Once the user has reached the first level, the feeling of accomplishment is attained, but at the same time, a new goal is set to reach the next level. In this way, users stay engaged on the platform, and by doing so gain more and more knowledge, finally becoming prepared for the water issues at hand. Reaching another level in the achievement badges will most likely motivate achievers, as they are looking to increase their competence and like to tackle difficult challenges. At the same time, each new level is another challenge that can motivate players to stay engaged with the platform.
The fifth strategy, cooperation, “requires users to work together to achieve a shared objective and rewards them for achieving their shared objective collectively” [17]. Apart from getting prepared personally, one of the goals that the collective awareness platforms have is to prepare the whole community for water issues. Therefore, the community perspective is integrated into the design of the gamification dashboard: apart from personal scores, the users are presented with the average score of the community in a spider chart diagram (see Figure 3 and Figure 4). The goal of the community is the same as the personal one: to reach the outer edges of the circle in all categories (equally). As each individual user on the collective awareness platform also belongs to the community, by increasing their personal score, the users also contribute to the increase of the score of the community. The bar on the bottom right reveals the relative size of the community so that the users can better estimate the reach of the preparedness of their community. This part of the gamification model is especially important to philanthropists because community preparedness serves a good purpose. At the same time, socializers might be motivated by community preparedness, as it directly reflects how their actions impact their social environment.
The final strategy, comparison, is implemented in our gamification design model through the ability to compare one’s personal scores to those of the average community members [17]. By toggling the option “show personal” (see Figure 4), the user is able to display his/her personal scores in all nine categories next to the community scores on the spider chart diagram. For example, if in one of the categories the user’s score is higher than that of the community, this means that that user is better prepared than an average community member, but it also means that that user contributed more to the preparedness of the community than others. Although comparison and competition are not the main goals of the collective awareness platforms, giving the users some indication as to how they are doing compared to others might be important to some user types. On the one hand, comparison elements are motivating for socializers who are motivated by relatedness. On the other hand, the ability to compare oneself to others might spur a feeling of competition and thus be motivating for the players as well.

2.3. Implementation of the Gamified Incentive Model in the Collective Awareness Platform

The gamified incentive model presented above was implemented in the collective awareness platform. The main part of the model was implemented in the gamified visualization dashboard presented in Figure 3, which is a combination of the identified gamification elements structured in four distinct sections, each allowing for the achievement of the gamified objectives of the platform. The visualization dashboard is a whole page on the platform that a user can access through various triggers integrated into the user experience of the platform. For example, as is shown in Figure 5a, the users see the dashboard widget when they are reading the articles, and Figure 5b shows the widget the users see on the front page that highlights one of the main results and invites the user to see the complete results on the gamification dashboard.
The dashboard and all other elements were developed using an iterative, user-centered design approach. This means that the model evolved over time according to user feedback, needs, and requirements. The design of the gamified visualization dashboard is not tied to a specific water issue, but can be used to monitor the development of preparedness on the individual and community levels for a variety of water issues. In our study, we applied the developed gamification model to four case studies of water-related sustainability issues: flooding in Leicester, UK; water saving in Milton Keynes, UK; water efficiency in Jerusalem, Israel; and water reuse in Sabadell, Spain. Only slight customizations were undertaken in order to apply the design to the specific water issues of the collective awareness platforms in which it was integrated and tested.
The gamified visualization dashboard (for reference, see Figure 3) is logically divided into four main sections corresponding to the main objectives of the collective awareness platforms: personal preparedness, personal impact, achievements, and community preparedness. Taken together, achieving these objectives can lead users to become prepared to tackle water issues that are pressing in their cities. Before moving on to evaluating the results of the gamification model (see Section 3), we describe each of the four main sections of the gamified visualization dashboard in the same way we have described the gamification elements (see Section 2.2). As in Table 2, we also make propositions as to which user types will be motivated by each of these sections (see Table 3).
The first section of the dashboard—personal preparedness—allows the users to monitor their progress in the three main categories (problem awareness, know-how, and readiness to act) with the help of progress radars and levels. As such, an implicit gamified objective of this section is to first fill the first radar to reach the first level and then to finally reach all three levels. We believe that the personal preparedness section is motivating for all types of users (and therefore it is the first section shown to the users). It is motivating for achievers and players, as they seek to track their progress and tackle difficult challenges; for free spirits, as it allows them to choose the category they would like to focus on; and for philanthropists and socializers, as they, believing in the purpose of the platform, can see how their preparedness increases.
The second section of the dashboard—personal impact—allows for monitoring the potential impact of user actions along the three categories—individual, social, and political—with the help of progress bars and levels (similarly to the personal preparedness section). The implicit gamified objective of this section is to reach all three levels to become fully prepared to tackle water issues. The personal impact section can be motivating for all user types, as it contains various types of impact. For example, individual impact will be the most important for achievers and players, as it reflects how they have performed. At the same time, the social impact can be quite motivating for socializers and philanthropists, as they like to see how their actions impact their social environment. Finally, disruptors and free spirits might be motivated by their influence on a political level.
The third section—achievement—is designed to reward users for the overall progress they have achieved with symbolic virtual rewards such as achievement badges and a feedback multiplier (not considered in this paper). The implicit objective of the achievement badges is to gather so much knowledge in water issues that it is consistent with becoming an advanced flood warden (or water guardian, depending on the context of the platform). The achievements section, because it focuses on the badges as a form of extrinsic reward, is likely to be the most motivating for players as well as achievers.
The fourth section—community preparedness—shows how the local community is prepared (see Figure 4). The gamified visualization dashboard is therefore conceived of not only for use by individual users, but also by the cities themselves to evaluate how well prepared the whole community is and in which areas it still needs to improve. The main gamification element used in this section to support the gamified objective is a spider chart diagram that enables the monitoring of how the knowledge of the entire community develops in the nine categories simultaneously. The chart can easily reveal to the users in which dimension the community has “gaps” and in which ones the community is close to the goal of being well prepared for water issues. At the same time, the user can also display his/her personal scores along those of the community and thus compare his/her performance to others. We believe that this section of the gamified visualization dashboard is motivating especially for philanthropists, as they are motivated intrinsically and are interested in reaching common goals. At the same time, this section can motivate socializers who are motivated by relatedness and want to interact with others. Because it presents a lot of information at the same time, this section of the gamified visualization is hardest to process; however, it can also be motivating for disruptors, who are seeking nonstandard challenges, as well as for free spirits, as it offers various ways to explore progress information.

3. Evaluation Results of the Gamification Model in Four Case Studies

3.1. Methodology and Materials

To evaluate and empirically validate the suitability of the developed gamification model and its design, a series of online user tests was performed. The aim of these tests was to assess the motivational ability of the developed gamification model across the various water issues, geographical locations, and user types. To perform this evaluation, a series of online crowd tests with a survey was designed and performed. To elicit user responses to the gamification model, its concrete instantiation in the form of an integrated gamification design was implemented and presented to the participants. In each test, the participants were presented with a functional simulation of the functioning of the implemented gamification design (a video of an example interaction with the gamified platform) and asked questions in the form of a survey. The questions aimed to test understandability and usability as well as the motivational ability of the collective awareness platform as a whole, the four distinct sections of the gamified visualization dashboard, and the individual gamification elements. In this paper, we focus mainly on the motivational ability of the dashboard and gamified elements, and the respective survey questions are presented in Appendix A. Additionally, the user type questionnaire reported by Tondello et al. [33] was used.
For testing purposes, the water issues were contextualized for each of the platforms to match the water issues they address. Four surveys were conducted for each of the collective awareness platforms: flooding was tested on the Leicester platform, water saving on the Milton Keynes platform, water efficiency on the Jerusalem platform, and water reuse on the Sabadell platform. The surveys had a similar structure, asked the same questions, and were slightly adapted to fit the four water issues addressed through their respective platforms. The survey was translated into both Spanish and Hebrew to make sure that language was not a barrier for users.

3.2. Participant Recruitment and Data Collection

Most of the participants were recruited through the crowdsourcing platform Amazon Mechanical Turk (AMT), which is commonly used for such evaluations (e.g., Orji et al. [17]) and has confirmed methodological validity, including the issue of sampling and participants’ representatives and potential biases (e.g., Bartneck et al. [36]), which are sometimes even comparable to nationally representative population-based samples [37,38]. The advantage of the platform is that it taps into quite a diverse population of potential participants that is more easily accessible than traditional recruitment methods.
For all of the tests we conducted, the requirements to participate in the test were that the user was from either the European Union or Israel (as the collective awareness platforms were developed for these locations) and that the approval rate for the tasks they had completed through the platform was higher than 95%. It was estimated that a participant would take 25 min to complete the task, for which they were rewarded with $1.50. Although this was not a high reward, it lies above the average rewards on the AMT platform.
Overall, through Amazon Mechanical Turk we collected 473 responses, of which 9 responses did not comply with the quality criteria. Additionally, 24 responses from Israel and 19 responses from Spain were collected via posting the link to the survey on Facebook groups in the representative geographical areas. The users that came through this channel were rewarded with Amazon gift vouchers of 3–5 EUR.
In total, 507 participants were considered in our sample, distributed roughly equally among the four water issue application scenarios (flooding: 122; water saving: 120; water efficiency: 126; and water reuse: 139). Almost 40% of respondents came from the UK. This was a desired result, as two of the platforms were to be implemented in the UK (Milton Keynes and Leicester) and we wanted to test the applicability of the developed gamification concept in these geographical communities especially. For a similar reason, 13.4% of respondents came from Spain and 5.4% of respondents from Israel. Apart from this, our sample contained a largely diverse population from other countries in the EU (in total 41.2%), which allowed us to test the transferability of the model to a broader spectrum of other countries in the EU. Regarding the age distribution, most of the respondents were users between 25 and 34 (44%) years of age, which corresponds to the main target users that can drive the uptake and scale-up of such digital platforms as AMT. They were followed by 18–24 year olds (27%), 35–44 year olds (19%), 45–54 year olds (7%), and older than 55 years (3%). Concerning the level of education, most of the respondents had a bachelor’s degree or higher (48%), therefore representing quite a highly educated sample. However, there was also a large enough portion of participants with high school (18%) and vocational education (9%), as well as those with a master’s degree (20%), which ensured enough diversity in our sample. Concerning gender, 265 participants provided this information. From those that responded, we could see that our sample contained 62% male and 38% female participants.

3.3. Evaluation Results

We first briefly look at the descriptive statistics for the main motivational variables of interest for the whole sample of users, and we also discuss robustness with respect to the water issues, the geographical area, and gender. In this paper, due to space limitations, we focus only on an analysis of motivations.
First, when we analyzed the overall motivation in the water community platforms, we saw that about three-fourths of the respondents in our sample (74%) were rather or very motivated to use the water community platforms. Another 16% were neither motivated nor demotivated, and just 10% were very or rather demotivated. The distribution was thus strongly positively skewed toward motivation rather than demotivation. This result was consistent across gender and water issues, whereas slight differences were observed based on geographical community. Specifically, slightly more users from Israel (93%) and slightly fewer from Spain (64%) were strongly or rather motivated by the water community platforms to prepare themselves for water issues.
Regarding the motivation of respondents by the distinct sections of the gamified visualization dashboard presented in Figure 6, we could see that participants were equally highly motivated by the distinct sections, such as personal preparedness (77% of respondents were rather or strongly motivated), personal impact (77%), and achievements (78%). At the same time, slightly fewer respondents (64%) were strongly or rather strongly motivated by the community preparedness section. This result was expected, as community progress might be more motivating for some types of users rather than for others. Overall, these results were quite consistent across water issue and gender, with slight differences with respect to geographical community. Specifically, users from Israel were the most motivated (93–97% were rather or highly motivated), whereas the least motivated were users from Spain (54–74% of users were highly or rather motivated). This may have been due to the cultural differences between these geographical communities.
Regarding the motivations of respondents by the various gamified elements that were used in the gamified visualization dashboard, the results are presented in Figure 7. We can see that the users were most highly motivated by “learning how to prepare for water issues” (87% of users strongly or rather agreed to be motivated by this item) and “increasing awareness of water issues” (85%), followed by the ability to see the community scores (79%) and the possibility of comparing oneself to others (74%). Slightly lower scores were obtained by such elements as receiving badges (69%) and getting points for participation (68%). Overall, these results were quite consistent across water issue and gender, with slight differences with respect to geographical community (a bit higher motivation across elements in Israel and a bit lower in Spain).
In the next step, we explore whether the motivation to use the platform or the motivational ability of any of the explored gamification elements differed by user type. This analysis allowed us to confirm the propositions we developed in Table 2 and Table 3 about the relationships between the user types and the motivational effect of the different elements and sections of the gamified visualization dashboard. To identify the user types, we used the scale developed by Tondello et al. [33], which, for each of the six user type dimensions (philanthropist, socializer, free spirit, achiever, player, and disruptor), consisted of four items that identified each dimension. Each question was asked on a 7-point Likert scale, so the maximum score that could be obtained for each user type dimension was 28. In Table 4, the average scores that the participants achieved in each user type dimension are presented. We can see that overall, the scores were quite high in five user type dimensions, with a considerably lower score in the disruptor dimension.
The distribution of the participants’ main Hexad user type, i.e., the user type dimension in which the participant achieved the highest score, is shown in Figure 8. From this graph, we can see that the users were quite evenly distributed among the five Hexad user types—philanthropist, socializer, free spirit, achiever, and player—whereas there was only a tiny fraction of disruptors. This distribution was quite similar to the one reported by the creators of the Hexad user type scale [33]. We note that by definition, there were not many disruptors in the user population, so we were unable to make conclusions about this user type. In the sections that follow, we provide the values for this user type for the sake of completeness.
First, to identify relationships between the user type dimensions in Table 4 and the elements of the gamified visualization dashboard, we conducted a correlation analysis, as was done by Tondello et al. [33]. As the scores of the participants in our sample were not normally distributed, we used Kendall’s τ with adjusted effect sizes (a small effect is τ = 0.20, a medium effect is τ = 0.34, and a large effect is τ = 0.5 [39]). In Table 5, we present the correlation coefficients and their significance levels between the user type dimensions and the elements of our visualization dashboard. We can see that all sections were positively and significantly correlated with all user type dimensions, except for disruptor. The correlation coefficients that showed an effect size (the ones in bold) were the ones between the user types socializer and philanthropist and the impact, achievement, and community preparedness sections of the gamified visualization dashboard. As opposed to the propositions developed in Table 3, we can see that the developed gamified visualization dashboard was motivating for all user types, with a specific accent on philanthropists and socializers, who were probably the users who were the most interested in the content of the water community platforms.
A more comprehensive analysis concerned correlations between the various gamification elements and the user type dimensions is presented in the second half of Table 5. We also noticed that all of the explored gamified elements were significantly correlated with most user type dimensions, albeit with a few exceptions. Focusing on those correlation coefficients with an effect size, we observed a relationship between every gamified element and the philanthropist and socializer dimensions. These results extend the propositions we made in Table 2 for these two user types: they seemed to encompass a much higher spectrum of motivations. At the same time, the free spirit, achiever, and player dimensions were correlated with a few gamified elements, which is generally in line with the propositions we made in Table 2.
In the second step, we explored whether the motivational effect of the different elements of the visualization dashboard differed between the main user types presented in Figure 8. This analysis allowed us to study the differences in motivation between the user types even more thoroughly and explore the propositions of our gamification model. As our data were non-normally distributed, we used a Kruskal–Wallis test, which is a nonparametric equivalent of the one-way independent ANOVA to determine whether there were any differences in motivation between the main user types. The reader should note that nonparametric tests use ranks as the basis for the comparison and not means. However, the order of magnitude of the ranks was similar to the means presented in Table 6. As we were dealing with six different user types, to determine which specific user types differed from each other, we needed to run a series of Mann–Whitney post hoc tests. As we had five user groups that we wanted to compare, we applied a Bonferroni correction in order to diminish the probability of type I error [40]. As testing all groups against each other would have resulted in a very harsh correction value and made it impossible to find any significant relationships, we limited ourselves to testing only those relationships that we hypothesized in Table 2 and Table 3. We needed to conduct six different tests for each gamification element, and therefore only the relationships where p < 0.01 were considered significant. At the same time, we also report the relationships where p < 0.05, which show some effect that needs to be verified in further tests.
We first studied the differences in the motivations by the different sections of the gamified visualization dashboard (hypotheses in Table 3), and the results are presented in Table 6. The mean values revealed that the preparedness and impact sections were slightly more motivating for achievers and socializers; the achievement section for philanthropists, achievers, and socializers; and the community section for philanthropists and socializers. We found that participants’ overall motivation to use the platform was not affected by their main user type (H(5) = 9.26, not significant (n.s.)). When testing for the significance of the differences in motivation by the different sections of the gamified visualization dashboard, we found one statistically significant relationship: participants’ motivations by the community section of the visualization dashboard were significantly affected by their main user type (H(5) = 15.338, p < 0.01). Mann–Whitney tests were used to identify which groups revealed statistically significant differences. As was hypothesized in Table 3, the community preparedness section was mostly motivating for philanthropists and socializers. It appeared that philanthropists were significantly more motivated by the community preparedness section than were the free spirits U = 4991.5, p < 0.01, r = −0.162, which represented a small effect size. At the same time, socializers were significantly more motivated by the community preparedness section than were the free spirits U = 4500.5, p < 0.01, r = −0.231, which represented a medium effect size.
The differences in motivation by the specific gamification elements between the user types are presented in Table 7 (hypotheses derived in Table 2). The mean values revealed that there were slight differences between the user types in the motivational effect of the various gamified elements. Overall, socializers seemed to be motivated by more gamified elements, whereas players were motivated by fewer elements than we originally proposed in Table 2. The Kruskal–Wallis tests conducted showed that there was a statistically significant difference in the motivational effect between the different user types for the following elements: motivations by badges (H(5) = 10.895, p < 0.05); monitoring preparedness (H(5) = 17.461, p < 0.01); learning how to prepare for a water issue (H(5) = 14.039, p < 0.05), and helping the community prepare (H(5) = 18.251, p < 0.01). Other elements did not reveal any statistically significant differences between the user types: motivation from getting points (H(5) = 6.031, n.s.), motivation from increasing awareness (H(5) = 8.626, n.s.), and motivation from comparison (H(5) = 7.753, n.s.). Mann–Whitney tests were used to follow up on the elements that showed significant results, and Bonferroni corrections regarding the necessary significance values were applied depending on the number of conducted tests.
For badges, we compared the differences between achievers and players and all other user types. It appeared that achievers were significantly more motivated by badges than were free spirits (U = 4900, p < 0.01, r = −0.165), which represents a small effect size. At the same time, players were not significantly more motivated by badges than by any of the other user types. Additionally, contrary to expectations, we found that socializers were more motivated by the badges than were players (U = 3605, p < 0.05, r = −0.144) (the significance of this effect was, however, lower than that which is required by the Bonferroni correction). This was an interesting finding that might need to be explored further and might be explained by the fact that badges for socializers can be a form of “social pride”.
To test the differences in motivation for monitoring preparedness between the main user types, we compared players and achievers against all other user types. We found that, as we proposed, achievers were more motivated by monitoring preparedness than were philanthropists (U = 3403.5, p < 0.05, r = −0.166). At the same time, contrary to our propositions, we found that socializers were more motivated by monitoring preparedness than were players (U = 3470, p < 0.05, r = −0.177) and that free spirits were more motivated by monitoring preparedness than were players (U = 5301, p < 0.05, r = −0.139). However, the significance of these results was lower than that which is required by the Bonferroni correction, so they would need to be followed up upon and could not be definitely confirmed for this study.
Concerning the differences in motivation for learning how to prepare for a water issue, we compared achievers and free sprits against all other user types. We found that, as hypothesized, achievers were significantly more motivated by this gamification element than were players (U = 3216, p < 0.01, r = −0.228), which represents a medium effect size. At the same time, free spirits were not significantly more motivated by learning how to prepare themselves for water issues than by any of the other user types. It might be necessary to conduct further tests to determine the differentiated motivational elements for this user type.
In order to find the differences in the motivational element “help community prepare for water issue”, we compared philanthropists and socializers against all other user types. We found that philanthropists were more motivated by helping the community than were players (U = 3563, p < 0.05, r = −0.161); however, the significance of this effect was lower than that which is required by the Bonferroni correction. Additionally, we found that socializers were significantly more motivated by helping the community prepare than were free spirits (U = 4923.5, p < 0.01, r = −0.169), which represents a small effect size: they were also more motivated than were players (U = 3239, p < 0.01, r = −0.226), which is a medium effect size. This effect was expected because community preparedness offers socializers the possibility of engaging with their community and comparing their scores to others.

4. Discussion

The developed gamified incentive model and the gamified visualization dashboard in which it was applied were evaluated with a broad sample of 507 users. The results showed that a large majority of users were motivated by the overall dashboard as well as by its individual design elements in preparing themselves for the water issues at hand. Mainly, the users were motivated by the elements that would allow them to relate the online interaction to their real-world problems, such as increasing awareness of water issues and learning how to prepare to address them. We found that users were equally motivated by the gamification dashboard, irrespective of the water issue it was applied to. We also found that in all the geographical communities in which the collective awareness platforms were implemented, the users were very motivated by the gamified visualization dashboard. Slight differences were apparent in the respondents from Israel: the users from this community were on average even more highly motivated by the gamification dashboard than were the others.
One of the underlying assumptions of our gamified incentive model is the ability of the gamified visualization dashboard to motivate users of various types. The results of testing the developed hypotheses regarding the motivation of users by the various sections of the gamification dashboard are summarized in Table 8. We observed that as expected, the personal preparedness and personal impact sections were motivating for all user types, except for disruptors. The personal impact section was especially motivating for philanthropists and socializers, most likely because it contains a social as well as political dimension that can be interesting for these user types. As opposed to our proposition that the achievements section would be motivating for achievers and players, we found that all users were motivated by this section, with a special focus on philanthropists and socializers. It was interesting that these types of users could also be motivated by achievement. The community preparedness section, as expected, was the most motivating for philanthropists and socializers. This can probably be explained by the fact that a collective awareness platform, by definition, should be more motivating for those users who score higher on philanthropist and social values, as solving societal challenges and contributing to the common good are at the heart of the motivation of these user types.
In our sample, the user types philanthropist, socializer, player, achiever, and free spirit were sufficiently represented, and we found slight differences as to how these user types perceived the various gamification elements used in the gamification dashboard. Some of the relationships proposed in Table 2 were confirmed, and some new relationships emerged, so a new map between user type and the motivational ability of the gamification elements is proposed in Table 9. We can see that the identified gamification elements were motivating for more user types than we originally proposed. For example, getting points for reading articles was not only motivating for players, but also for philanthropists, socializers, and free spirits. The same held for achievement badges: they were not only motivating for achievers and players, but also for philanthropists and socializers. Monitoring preparedness was not only motivating for achievers and players, but also for philanthropists and socializers. The same held for levels of learning and increasing awareness: these items additionally motivated socializers and philanthropists. We note that none of the elements was motivating for the disruptors, but that could have been due to the small sample size of this group in our population of users.
The findings of our study confirm the underlying theoretically founded conceptual approach to the design of our gamified incentive model and further support its suitability not only for collective awareness platforms but also for other structurally comparable application domains (e.g., environmental issues in general). They also provide an empirical contribution to current state-of-the-art gamification research in uncovering the relationships between specific types of gamified elements and the different motivational user types, which can inform both further research and the practical design and application of gamification.
To provide more concrete design recommendations for the development of gamified visualization dashboards for collective awareness platforms, we showed that the gamification elements do need to be adjusted to the various user types in order to be motivating to diverse user groups. For example, we showed that although socializers and philanthropists were motivated by all gamified elements they were presented with, players and achievers tended to be motivated only by a subset of the elements that were mainly related to rewards, goal levels, and monitoring capabilities. Our developed and verified gamification model can thus provide initial guidance as to how to design gamification dashboards for sustainability issues: we offer concrete gamification elements, including their specific design and integration into the platform, which are adjusted to the persuasive strategies and the motivation of the various user types.
A special focus should be directed toward the actual design of the elements. For example, for the sections on personal preparedness and personal impact, we used the same elements—progress bars—but with a different design and color scheme to enable users to distinguish between them and thus easily process and remember them. Moreover, the design of the whole dashboard follows the strategy of gradual goal setting and achievement by providing levels for reaching a specific goal for all main sections in the dashboard. In this way, the users feel more empowered when they see that they have achieved the first level and are more motivated to use the platform and to reach another one. Finally, special attention should be directed toward the community preparedness section, which allows for viewing not only the various scores in more detail but also for comparing one’s own preparedness to that of the community on a spider chart diagram. Although this section of the dashboard is a bit harder to understand, it can be motivating for such user types, who are eager to learn and tackle harder challenges and like to explore the system in their own ways. Overall, by following the logic of the design of the system described in this paper, which is theoretically grounded and has been empirically verified, other researchers can use this approach in designing similar systems for other domains.

5. Conclusions, Limitations, and Future Research

The gamified incentive model that we developed and presented in this paper was based on an extensive literature analysis of gamified systems and applications, as well as on theories of motivation and persuasion, and was successfully implemented on collective awareness platforms in four cities. The developed model explored the ability of the various gamified elements to motivate and enhance user interaction with the collective awareness platform. The underlying assumption of the model was that different users are motivated by different motivational drivers, and in order for the model to be successful in motivating users to engage with the platform, it had to include a variety of gamification elements conducive to a wide variety of user groups. As such, the model that we developed utilizes a combination of various gamification elements, such as points, progress indicators, goal levels, and comparison mechanisms, which have been shown to motivate diverse user types.
The developed gamification model was evaluated with a broad sample of 507 users through the crowdsourcing platform Amazon Mechanical Turk. The results showed that the model was well suited to addressing different types of users. A positive motivational effect was confirmed by a large majority of participants overall and for the different gamified elements of the model. We found that users were equally motivated, irrespective of the water issue the model was applied to. We also revealed differences in perceptions of the platform by distinct user type. Specifically, we could see that socializers and philanthropists were motivated by all the gamified elements they were presented with, with a specific accent on the ability to monitor community preparedness, something uniquely offered by the collective awareness platform. At the same time, achievers tended to be motivated only by a subset of the elements that were mainly related to rewards, goal levels, and monitoring capabilities. In this way, we confirmed the proposition that in order to be successful, a gamification design for sustainability challenges should try to address various user types with specific gamification elements.
The limitations of this paper include the low number of disruptors in our sample, and thus we were unable to identify appropriate gamification elements for this user type. Moreover, the Hexad framework that we applied to determine the user type delivered very similar scores in many user type categories, so possibly, a better way to delineate the user types could deliver more pronounced results.
Possible avenues for future research could focus on specifying and testing more gamification elements for the various identified strategies, developing novel methods to identify user types for the sustainability domain, and exploring in more detail which strategies and gamification elements could motivate free spirits and disruptors, the user types that were addressed in our model and design to a lesser extent.

Author Contributions

The authors contributed equally to the work in this article. All authors have read and agreed to the published version of the manuscript.

Funding

This research received funding from the European Union’s Horizon 2020 research and innovation program under grant agreement No. 687809.

Acknowledgments

We acknowledge Darien Miranda for help in implementing the gamified visualization dashboard and Eduardo Calvillo for contributing some initial ideas on gamification.

Conflicts of Interest

The authors declare no conflicts of interest.

Appendix A. Evaluation Survey

ItemScale
To what extent would you be motivated by the “personal preparedness” section to prepare yourself for flooding? 5 pts: very demotivated–very motivated
To what extent would you be motivated by the “personal impact” section to prepare yourself for flooding?5 pts: very demotivated–very motivated
To what extent would you be motivated by the “flood warden achievement” section to prepare yourself for flooding?5 pts: very demotivated–very motivated
To what extent would you be motivated by the “community preparedness” section to help you and your community to prepare for flooding? 5 pts: very demotivated–very motivated
How motivated would you be to use the “Leicester Water Community” platform?5 pts: very demotivated–very motivated
How motivated would you be by the following elements to prepare yourself for flooding?5 pts: very demotivated–very motivated
  • Receive “Flood Warden” badges for collecting points
  • Get points by reading articles
  • Monitor how my flood preparedness increases
  • Learn how to prepare myself for the case of flooding
  • Help my community become well prepared for flooding
  • Increase my awareness of flood issues
  • See how well prepared I am compared to an average community member
(user Hexad typology items from Tondello et al. [33])

References

  1. Hiramatsu, A.I.; Kiyo Kurisu, K.; Hanaki, K. Environmental consciousness in daily activities measured by negative prompts. Sustainability 2016, 8, 24. [Google Scholar] [CrossRef] [Green Version]
  2. Koop, S.; Monteiro Gomes, F.; Schoot, L.; Dieperink, C.; Driessen, P.; Van Leeuwen, K. Assessing the capacity to govern flood risk in cities and the role of contextual factors. Sustainability 2018, 10, 2869. [Google Scholar] [CrossRef] [Green Version]
  3. Šteflová, M.; Koop, S.; Elelman, R.; Vinyoles, J.; Van Leeuwen, C.J.K. Governing Non-Potable Water-Reuse to Alleviate Water Stress: The Case of Sabadell, Spain. Water 2018, 10, 739. [Google Scholar] [CrossRef] [Green Version]
  4. Becker, M.; Koroleva, K.; Drenska, K.; Vitorino, D.; Novak, J. Developing a Collective Awareness Platform for Urban Sustainability Challenges: Case Study of the POWER Project. Eur. J. Sustain. Dev. 2019, 8, 214–226. [Google Scholar]
  5. Sestini, F. Collective Awareness Platforms: Engines for Sustainability and Ethics. IEEE Technol. Soc. Mag. 2012, 31, 54–62. [Google Scholar] [CrossRef]
  6. European Commission. Collective Awareness Platforms for Sustainability and Social Innovation (CAPS) by the European Commission. Available online: https://ec.europa.eu/programmes/horizon2020/en/h2020-section/collective-awareness-platforms-sustainability-and-social-innovation-caps (accessed on 29 November 2019).
  7. Macdonell, C. Ushahidi: A crisis mapping system. ACM SIGCAS Comput. Soc. 2015, 45, 38. [Google Scholar] [CrossRef]
  8. Introne, J.; Laubacher, R.; Olson, G.; Malone, T. The Climate CoLab: Large scale model-based collaborative planning. In CCI Working Paper 2011-001, Proceedings of the International Conference on Collaboration Technologies and Systems (CTS 2011), Philadelphia, PA, USA, 23–27 May 2011; IEEE: Piscataway, NJ, USA, 2011; pp. 40–47. [Google Scholar]
  9. Malone, T.W.; Nickerson, J.V.; Laubacher, R.J.; Fisher, L.H.; de Boer, P.; Han, Y.; Towne, W.B. Putting the Pieces Back Together Again: Contest Webs for Large-Scale Problem Solving. In Proceedings of the 2017 ACM Conference on Computer Supported Cooperative Work and Social Computing (CSCW ‘17), New York, NY, USA, 25 February–1 March 2017; pp. 1661–1674. [Google Scholar]
  10. Novak, J.; Becker, M.; Grey, F.; Mondardini, R. Citizen engagement and collective intelligence for participatory Digital Social Innovation. In Citizen Science–Innovation in Open Science, Society and Policy; Bonn, A., Haklay, M., Hecker, Bowser, A., Makuch, Z., Vogel, J., Eds.; UCL Press: London, UK, 2018. [Google Scholar]
  11. Webler, T.; Kastenholz, H.; Renn, O. Public participation in impact assessment: A social learning perspective. Environ. Impact Assess. Rev. 1995, 15, 443–463. [Google Scholar] [CrossRef]
  12. Krueger, R.; Tuler, S.; Webler, T. What Is a Good Public Participation Process? Five Perspectives from the Public. Environ. Manag. 2001, 27, 435–450. [Google Scholar] [CrossRef]
  13. Petts, J.; Brooks, C. Expert Conceptualisations of the Role of Lay Knowledge in Environmental Decision making: Challenges for Deliberative Democracy. Environ. Plan. 2006, 38, 1045–1059. [Google Scholar] [CrossRef]
  14. Bagnoli, F.; Guazzini, A.; Pacini, G.; Stavrakakis, I.; Kokolaki, E.; Theodorakopoulos, G. Cognitive structure of collective awareness platforms. In Proceedings of the IEEE Eighth International Conference on Self-Adaptive and Self-Organizing Systems Workshops, London, UK, 8–12 September 2014; IEEE: Piscataway, NJ, USA, 2014; pp. 96–101. [Google Scholar]
  15. Deterding, S.; Khaled, R.; Nacke, L.E.; Dixon, D. Gamification: Toward a definition. In Proceedings of the CHI 2011 Gamification Workshop Proceedings, Vancouver, BC, Canada, 7–12 May 2011; Volume 12. [Google Scholar]
  16. Böckle, M.; Novak, J.; Bick, M. Towards Adaptive Gamification: A Synthesis of Current Developments. In Proceedings of the Twenty-Fifth European Conference on Information Systems (ECIS), Guimaraes, Portugal, 5–10 June 2017. [Google Scholar]
  17. Orji, R.; Nacke, L.E.; Di Marco, C. Towards personality-driven persuasive health games and gamified systems. In Proceedings of the 2017 CHI Conference on Human Factors in Computing Systems, Denver, CO, USA, 6–11 May 2017; pp. 1015–1027. [Google Scholar]
  18. Groh, F. Gamification: State of the Art Definition and Utilization; Institute of Media Informatics Ulm University: Ulm, Germany, 2012; Volume 39, p. 31. [Google Scholar]
  19. Hamari, J.; Koivisto, J.; Sarsa, H. Does gamification work?–A literature review of empirical studies on gamification. In Proceedings of the 47th Hawaii International Conference on System Sciences (HICSS), Waikoloa, HI, USA, 6–9 January 2014; IEEE: Piscataway, NJ, USA, 2014; pp. 3025–3034. [Google Scholar]
  20. Fogg, B.J. A behavior model for persuasive design. In Proceedings of the 4th International Conference on Persuasive Technology, Claremont, CA, USA, 26–29 April 2009; Volume 40. [Google Scholar]
  21. Oinas-Kukkonen, H. A foundation for the study of behavior change support systems. Pers. Ubiquitous Comput. 2013, 17, 1223–1235. [Google Scholar] [CrossRef]
  22. Landers, R.N.; Auer, E.M.; Collmus, A.B.; Armstrong, M.B. Gamification science, its history and future: Definitions and a research agenda. Simul. Gaming 2018, 49, 315–337. [Google Scholar] [CrossRef]
  23. Johnson, D.; Horton, E.; Mulcahy, R.; Foth, M. Gamification and serious games within the domain of domestic energy consumption: A systematic review. Renew. Sustain. Energy Rev. 2017, 73, 249–264. [Google Scholar] [CrossRef] [Green Version]
  24. Albertarelli, S.; Fraternali, P.; Herrera, S.; Melenhorst, M.; Novak, J.; Pasini, C.; Rizzoli, A.-E. A Survey on the Design of Gamified Systems for Energy and Water Sustainability. Games 2018, 9, 38. [Google Scholar] [CrossRef] [Green Version]
  25. Castelletti, A.; Cominola, A.; Facchini, A.; Giuliani, M.; Fraternali, P.; Herrera, S.; Melenhorst, M. Gamified approaches for Water Management Systems: An Overview. 2017. Available online: https://re.public.polimi.it/retrieve/handle/11311/1058518/297884/full_v8-1.pdf (accessed on 30 November 2019).
  26. Novak, J.; Melenhorst, M.; Micheel, I.; Pasini, C.; Fraternali, P.; Rizzoli, A.E. Integrating behavioural change and gamified incentive modelling for stimulating water saving. Environ. Model. Softw. 2018, 102, 120–137. [Google Scholar] [CrossRef]
  27. Vassileva, J. Motivating participation in social computing applications: A user modeling perspective. User Modeling User Adapt. Interact. 2012, 22, 177–201. [Google Scholar] [CrossRef] [Green Version]
  28. Orji, R. Design for Behaviour Change: A Model-Driven Approach for Tailoring Persuasive Technologies. Ph.D. Thesis, University of Saskatchewan, Saskatoon, SK, Canada, 2014. [Google Scholar]
  29. Tondello, G.F.; Mora, A.; Nacke, L.E. Elements of gameful design emerging from user preferences. In Proceedings of the Annual Symposium on Computer-Human Interaction in Play, Amsterdam, The Netherlands, 15–18 October 2017; pp. 129–142. [Google Scholar]
  30. Bartle, R. Hearts, clubs, diamonds, spades: Players who suit MUDs. J. MUD Res. 1996, 1, 19. [Google Scholar]
  31. Lazzaro, N. Why We Play Games Together: The People Factor. XEODesign Inc. In Proceedings of the Game Developers Conference, San Francisco, CA, USA, 7–11 March 2005. [Google Scholar]
  32. Marczewski, A. Even Ninja Monkeys Like to Play; Blurb Inc.: London, UK, 2015. [Google Scholar]
  33. Tondello, G.F.; Wehbe, R.R.; Diamond, L.; Busch, M.; Marczewski, A.; Nacke, L.E. The gamification user types hexad scale. In Proceedings of the 2016 Annual Symposium on Computer-Human Interaction in Play, Austin, TX, USA, 22–25 October 2016; pp. 229–243. [Google Scholar]
  34. Fogg, B.J. Persuasive technology: Using computers to change what we think and do. Ubiquity 2002, 2002, 5. [Google Scholar] [CrossRef] [Green Version]
  35. Oinas-Kukkonen, H.; Harjumaa, M. Persuasive systems design: Key issues, process model and system features. In Routledge Handbook of Policy Design; Routledge: Abingdon, UK, 2018; pp. 105–123. [Google Scholar]
  36. Bartneck, C.; Duenser, A.; Moltchanova, E.; Zawieska, K. Comparing the similarity of responses received from studies in Amazon’s Mechanical Turk to studies conducted online and with direct recruitment. PLoS ONE 2015, 10, e0121595. [Google Scholar] [CrossRef]
  37. Clifford, E.; Coakley, D.; Curry, E.; Degeler, V.; Costa, A.; Messervey, T.; Van Andel, S.-J. Interactive water services: The WATERNOMICS approach. Procedia Eng. 2014, 89, 1058–1065. [Google Scholar] [CrossRef]
  38. Heen, M.S.; Lieberman, J.D.; Miethe, T.D. A comparison of different online sampling approaches for generating national samples. Cent. Crime Justice Policy CCJP 2014, 1, 1–8. [Google Scholar]
  39. Gilpin, A.R. Table for conversion of Kendall’s Tau to Spearman’s Rho within the context of measures of magnitude of effect for meta-analysis. Educ. Psychol. Meas. 1993, 53, 87–92. [Google Scholar] [CrossRef]
  40. Field, A.; Hole, G. How to Design and Report Experiments; Sage: Newcastle upon Tyne, UK, 2002. [Google Scholar]
Figure 1. The gamified incentive model for collective awareness platforms.
Sustainability 12 00712 g001
Figure 2. Nine knowledge dimensions in the collective awareness platforms and example scores.
Sustainability 12 00712 g002
Figure 3. Gamified visualization dashboard for the collective awareness platform.
Sustainability 12 00712 g003
Figure 4. Selection from the gamified dashboard: a comparison of personal and community scores.
Sustainability 12 00712 g004
Figure 5. Gamification elements integrated into the collective awareness platform: (a) the widget on the side bar of each page; (b) the widget on the front page.
Sustainability 12 00712 g005
Figure 6. Motivation of all respondents by the four main sections of the gamified visualization dashboard.
Sustainability 12 00712 g006
Figure 7. Motivation of all respondents by the distinct gamification elements.
Sustainability 12 00712 g007
Figure 8. Distribution of participants’ main Hexad user types.
Sustainability 12 00712 g008
Table 1. Gamification user types and related gamification design elements in the Hexad model [32,33].
User TypeMotivation Gamification Design Elements
Philanthropist Search for purpose and meaning in the activities, helpingCollection and trading; gifting; knowledge sharing; administrative roles
SocializerInteraction and social connectionsGuilds or teams; social networks; social comparison; social competition; social discovery
Free spiritCreation, autonomy, and explorationExploratory tasks; nonlinear gameplay; Easter eggs; unlockable content; creativity tools; customization; challenges; anonymity; anarchic gameplay
AchieverSearch for challenges, self-improvement, and skill masteryChallenges; certificates; learning; quests; levels or progression; epic challenges; anonymity; badges or achievements
DisruptorAim at disrupting the system in positive or negative waysInnovation platforms; voting mechanisms; development tools; anonymity; anarchic gameplay; creativity tools; social competition challenges
PlayerSeeking to collect rewards and to competePoints; rewards or prizes; leaderboards; badges or achievements; virtual economy; lotteries or chance; levels or progression; collection and trading; social comparison; social competition; social discovery; anonymity; challenges; certificates; quests
Table 2. Mapping of the gamified elements to the persuasive strategies and user types. 1
Persuasive StrategyDesign ElementsUser Types
AchieverPhilan-thropistSocia-lizerFree SpiritPlayerDisrup-tor
SimulationGetting points for actionsx x
Self-monitoring and feedbackMonitoring preparedness with aggregated progress indicatorsx x
RewardsAchievement badgesx x
Goal-setting and suggestionLevels for learning and increasing awarenessx x
CooperationCommunity perspective and community goals xx
ComparisonComparison of personal scores and community scores x xx
1 In this paper, we selected only the design elements we were able to test, whereas in the project report that is the basis for this paper, the list also included the elements we did not explicitly test.
Table 3. Hypothesized motivation of the various user types by distinct section of the gamified visualization dashboard.
Sections of the Gamified Visualization Dashboard User Types
Achie-verPhilan-thropistSocia-lizerFree SpiritPlayerDisrup-tor
Personal preparedness xxxxxx
Personal impact xxxxxx
Achievement x x
Community preparedness xxx x
Table 4. Average scores and standard deviation for each Hexad user type dimension.
PhilanthropistSocializerFree SpiritAchieverDisruptorPlayer
Mean24.021.023.523.216.222.5
Standard deviation3.174.773.273.405.154.12
N507507507507507507
Table 5. Bivariate correlation coefficients (Kendall’s τ) and significance (** p < 0.01, * p < 0.05) between the Hexad user type dimensions and the elements of the gamified visualization dashboard 2
PhilanthropistSocializerFree SpiritAchieverDisruptorPlayer
Sections of the Dashboard
Preparedness section0.136 **0.172 **0.155 **0.151 **0.0290.192 **
Impact section0.247 **0.249 **0.159 **0.182 **0.0430.188 **
Achievements section0.316 **0.238 **0.139 **0.165 **0.0250.137 **
Community section0.247 **0.289 **0.130 **0.175 **−0.0190.039
Overall motivation0.257 **0.268 **0.158 **0.160 **−0.0280.140 **
Gamification Elements
Badges for collecting points0.347 **0.297 **0.167 **0.228 **0.0540.220 **
Points for reading articles0.296 **0.294 **0.209 **0.184 **0.0260.203 **
Monitoring preparedness0.319 **0.257 **0.250 **0.277 **−0.0640.149 **
Learning how to prepare0.313 **0.217 **0.231 **0.235 **−0.0510.127 **
Increasing awareness0.319 **0.245 **0.211 **0.165 **−0.0710.088 *
Helping community prepare0.319 **0.325 **0.133 **0.180 **−0.0770.058
Compared to community0.297 **0.281 **0.150 **0.184 **−0.0360.190 **
N507507507507507507
2 We marked with a bold font style those coefficients that showed an effect size.
Table 6. Motivational evaluations of the main sections of the gamification dashboard by the main Hexad user types: means (standard deviations).
Evaluation Responses of the Main User TypesAll Users
How Motivated Are You by…? AchieverFree SpiritPhilanthropistPlayerSocializerDisruptor
Overall motivation3.92 (0.85)3.71 (0.89)3.82 (0.98)3.63 (0.97)3.91
(0.87)
3.43 (1.13)3.78 (0.92)
Preparedness section3.89
(0.73)
3.86 (0.72)3.76 (0.80)3.74 (0.67)3.88
(0.89)
4.00 (0.58)3.83 (0.76)
Impact section3.99
(0.87)
3.93 (0.74)3.93 (0.71)3.86 (0.82)3.99
(0.86)
3.57 (0.79)3.93 (0.80)
Achievement section4.03
(0.89)
3.90 (0.82)4.09 (0.82)3.87 (0.75)4.05
(0.79)
3.86 (0.38)3.98 (0.82)
Community section3.79
(0.92)
3.52 (0.93)3.82 (0.94)3.55 (1.08)3.93
(0.83)
3.57 (0.79)3.70 (0.95)
N901339294917507
Table 7. Motivational evaluations of the gamification elements by the main Hexad user types: means and standard deviations.
Evaluation Responses of the Main User TypesAll Users
Gamification ElementAchie-versFree SpiritsPhilanthropistsPlayersSocia-lizersDisrup-tors
Badges for collecting points3.89 (0.95)3.49 (1.19)3.76
(1.01)
3.51 (1.12)3.81 (1.02)3.43 (1.27)3.67 (1.08)
Points for reading articles3.8
(0.93)
3.7
(1.05)
3.74
(0.99)
3.59 (1.02)3.9 (0.98)3.57 (1.13)3.74 (1.00)
Monitoring preparedness4.32 (0.73)4.1
(0.90)
3.98
(1.01)
3.82 (1.03)4.16 (0.82)3.43 (1.13)4.07 (0.92)
Learning how to prepare4.47 (0.72)4.29 (0.82)4.26
(0.86)
4.1 (0.92)4.26 (0.84)3.43 (1.27)4.26 (0.85)
Increasing awareness of issues4.23 (0.88)4.16 (0.85)4.22
(0.86)
4.06 (0.81)4.18 (0.93)3.43 (1.13)4.16 (0.87)
Helping the community prepare4.21 (0.84)3.92 (0.96)4.1
(1.01)
3.85 (0.94)4.24 (0.79)3.43 (1.13)4.04 (0.93)
Comparing my preparedness to the community4.04 (0.96)3.78 (1.06)3.91
(1.05)
4.03 (1.03)4.02 (1.12)3.57 (1.27)3.94 (1.05)
N901339294917507
Table 8. Verified motivation of the various user types by the distinct sections of the gamified visualization dashboard.3
Sections of the Gamified Visualization DashboardUser Type
AchieverPhilan-thropistSocia-lizerFree SpiritPlayerDisrup-tor
Personal preparednessOOOOO
Personal impactOOOOO
AchievementOOOOO
Community preparednessOOXOXOO
3 O indicates significant correlations, O means significant correlations with an effect size, and X means confirmed relationships based on pairwise comparisons.
Table 9. Verified gamification design model for collective awareness platform.4
Persuasive StrategyGamification Design Elements Adapted to Our ContextUser Types
Achie-verPhilan-thropistSocializerFree SpiritPlayerDisruptor
SimulationGetting points for actionsOOOOO
Self-monitoring and feedbackMonitoring preparedness with aggregated progress indicatorsX OOOOO
RewardsAchievement badgesX OOOOO
Goal-setting and suggestionLevels for learningX OOOOO
Levels for increasing awarenessOOOOO
CooperationCommunity perspective and community goalsOX OX OO
ComparisonComparison of personal scores and community scoresOOOOO
4 O indicates significant correlations, bold O means significant correlations with an effect size, and X means confirmed relationships based on pairwise comparisons.

