Article

Assessing the Impact of Physical and Anthropogenic Environmental Factors in Determining the Habitat Suitability of Seagrass Ecosystems

1
Department of Geography, University College Cork, Cork T12 K8AF, Ireland
2
School of Biological, Earth and Environmental Sciences, University College Cork, Cork T23 AX58, Ireland
3
Centre for Marine & Renewable Energy Institute, University College Cork, Cork P43 C573, Ireland
4
Environmental Research Institute, University College Cork, Cork T23 XE10, Ireland
*
Author to whom correspondence should be addressed.
Sustainability 2020, 12(20), 8302; https://doi.org/10.3390/su12208302
Submission received: 7 August 2020 / Revised: 28 September 2020 / Accepted: 1 October 2020 / Published: 9 October 2020

Abstract

:
Blue Carbon ecosystems such as mangroves, saltmarshes and seagrasses have been shown to sequester large amounts of carbon, and subsequently are receiving renewed interest from policy experts in light of climate change. Globally, seagrasses remain the most understudied of these ecosystems, with their total geographic extent largely unknown due to challenges in mapping dynamic coastal environments. As such, species distribution models (SDMs) have been used to identify areas of high suitability, in order to inform our understanding of where unmapped meadows may be located or to identify suitable sites for restoration and/or enhancement efforts. However, many SDMs parameterized to project seagrass distributions focus on physical and not anthropogenic variables (i.e., dredging, aquaculture), which can have negative impacts on seagrass meadows. Here we used verified datasets to identify the potential distribution of Zostera marina and Zostera noltei at a national level for the Republic of Ireland, using 19 environmental variables including both physical and anthropogenic. Using the Maximum Entropy method for developing the SDM, we estimated approximately 95 km2 of suitable habitat for Z. marina and 70 km2 for Z. noltei nationally with high accuracy metrics, including Area Under the Curve (AUC) values of 0.939 and 0.931, respectively for the two species. We found that bathymetry, maximum sea-surface temperature (SST) and minimum salinity were the most important environmental variables that explained the distribution of Z. marina and that high standard deviation of SST, mean SST and maximum salinity were the most important variables in explaining the distribution of Z. noltei. At a national level, we noted that it was primarily physical variables that determined the geographic distribution of seagrass, not anthropogenic variables. We unexpectedly modelled areas of high suitability in locations of anthropogenic disturbance (i.e., dredging, high pollution risk), although this may be due to the binary nature of SDMs capturing presence-absence and not the size and condition of the meadows, suggesting a need for future research to explore the finer scale impacts of anthropogenic activity. Subsequently, this research should foster discussion for researchers and practitioners working on sustainability projects related to Blue Carbon.

1. Introduction

Climate change and anthropogenic pressures have degraded and restricted the productivity of many marine and coastal ecosystems, with ocean warming, acidification, increased coastal erosion, and loss of biodiversity now prominent issues facing society [1,2,3,4,5,6,7]. With at least a billion people expected to live within the lower-elevation coastal zone by 2060 [8] and with limited funding to tackle such environmental challenges [9], there persists a need to explore opportunities for marine and coastal ecosystem services. Blue Carbon ecosystems, including mangroves, saltmarshes and seagrasses are natural carbon sinks capturing and storing up to 55% of biological carbon, despite constituting less than 0.5% of the seabed [10]. Subsequently, the value of these ecosystems to sequester carbon is increasingly being recognised by policy experts [11].
While debate exists in the literature [10,11,12,13,14], seagrasses are generally considered the only Blue Carbon ecosystem that satisfies all of Lovelock and Duarte’s [11] criteria for actionable policy implementations, including long-term carbon storage, lack of negative social impacts (e.g., displacement), and alignment with other carbon mitigation and adaptation policies. Further, seagrass meadows provide several ecosystem services, that include coastal protection against erosion, sediment stabilization, improved water quality, and the provision of key habitats and nurseries for economically important fish species [15,16,17,18,19,20]. However, recent research by Ruiz-Frau et al. [21] has highlighted that seagrass ecosystems research suffers from three main biases; geographical (i.e., limited knowledge on mapped areas of seagrass species), service type (i.e., cultural services remain understudied), and discipline (i.e., lack of research into economic and social aspects). The overall extent of global seagrass coverage is still largely unknown [22], and comparative analysis of carbon capture rates is problematic due to the assumptions and uncertainties within the distribution estimates [23]. Subsequently, identifying methods to reduce the uncertainty in understanding where seagrass species are currently found or could survive given enhancement or restoration efforts is imperative for accurate and reliable implementation of Blue Carbon policy.
Species distribution models (SDMs) are a powerful spatial ecological tool for studying the geographic distribution of a variety of taxa [24,25]. The framework provides a methodology for researchers and practitioners to quantitatively assess the relationship between species distributions and environmental factors, as well as the ability to project these relationships in both environmental and geographic space [26,27], having been widely used for various applications including projecting seagrass distributions [28,29,30,31,32,33,34,35,36,37,38,39]. Studies have identified a range of variables that are important in determining the geographic distributions of seagrass species. For example, Boscutti et al. [33] identified that seagrass presence was mainly explained by the sea-inner shoreline salinity gradient and differences between channels and tidal flats for three seagrass species in northern Italy. Similarly, Zellmer et al. [38] identified that mud content and light availability were the most important variables for determining restoration sites of reefs, which included multiple seagrass species in southern California, USA. Other studies have found that exposure, substrate, temperature, salinity, nutrient availability and bathymetry as a proxy for available light are important variables in determining the geographic distribution of seagrass species [29,30,31,32,34,40,41,42,43,44]. While the consensus is that physical factors are an important determinant of seagrass distributions, they may not be the sole driver.
The role of anthropogenic factors has also been suggested to be equally important in determining geographic distributions by limiting resources through eutrophication, smothering of sediment, and physical disturbance and mortality [15,45,46]; however, many SDM studies often exclude or neglect these variables during model parameterisation, or recommend their inclusion in future research [47,48]. For example, agricultural run-off into river catchments causes eutrophication in the form of Ulva blooms [49], which then subsequently decompose releasing hydrogen sulfide into the water, negatively impacting intertidal seagrasses [50]. Subsequently, distribution models could be improved by explicitly incorporating such anthropogenic drivers; however, to-date anthropogenic factors have seldom been incorporated in parameterizing seagrass distributions, meaning there remains a need to investigate the importance of these factors on determining the geographic distribution of seagrass species.
With recent research suggesting that the global seagrass biome may occupy twice the area as previous estimates [35], and with a lack of consensus among the aforementioned studies as to the importance of both physical and anthropogenic drivers of seagrass distributions, there persists a need to quantify both the species-environment relationships and the geographic distribution of seagrass species at a national extent. Subsequently, the aim of this research is to explore the environmental (both physical and anthropogenic) drivers of seagrass distributions at a national scale for important seagrass species in the Republic of Ireland. This study will explore two main questions: (1) What is the spatial distribution of suitable seagrass habitat in the Republic of Ireland at a national scale? (2) What are the most important species-environment relationships determining these seagrass distributions?

2. Materials and Methods

2.1. Study Area and Species

Ireland is situated in the North Atlantic in north-west Europe (Figure 1) hosting a temperate maritime climate [51]. The south-western, western, and northern regions of Ireland are dominated by rock coastlines with large bays and estuaries, while the eastern and south-eastern regions are predominantly low-lying and soft sedimentary areas [2,52]. The western and northern coasts are dominated by larger swells from an increased fetch, while the east coast has lower wave energy, and the southern coasts are impacted by high wave energy, but contain multiple bays and islands that attenuate the swell energy and offer shelter from direct wave impact [53]. Overall, approximately 2900 km of Ireland’s coastline is deemed exposed, while the other 3700 km are considered sheltered [2].
The Irish coastline hosts one subtidal seagrass species, Zostera marina and two intertidal species, Zostera noltei and Ruppia maritima [15,20]. Debate in the literature has centred on whether R. maritima is a true seagrass species [45], and subsequently Z. noltei and Z. marina are the sole focus of this research. Verified documentation suggests that Z. marina covers approximately 25.77 km2 (Department of Culture, Heritage and the Gaeltacht) while Z. noltei covers approximately 22 km2 [20]. Recent research by Beca-Carretero et al. [39] estimated a potential 31.67 km2 of Z. marina in northern Galway Bay alone, locating 16 undocumented meadows through parameterising an SDM and verifying an increase in area of 44.74% through earth observation and snorkelling. Such research highlights the potential underestimation of seagrass habitat, specifically in Ireland. Verified datasets suggest Z. marina is relatively ubiquitous around the coastline, while Z. noltei appears to be absent along much of the southern and western coastlines.

2.2. Data Collection

2.2.1. Species Data

Expert verified in situ datasets for Z. marina were obtained from the National Parks and Wildlife Service via the Department of Culture, Heritage and the Gaeltacht and for Z. noltei from Wilkes et al. [20] via the Environmental Protection Agency (EPA). Data were obtained in the form of polygons covering seagrass meadow extent and were converted into points at the centroid of the polygons for compatibility with the SDM framework. Alternative methods of conversion were explored (e.g., fishnet coverage), but the centroid method provided the most realistic representation of seagrass habitat. This resulted in 449 and 132 observations for Z. marina and Z. noltei, respectively to be used within the SDM.

2.2.2. Environmental Data

Several environmental variables were identified as important based on previous research [28,29,30,31,32,33,34,35,36,37,38,39], including both physical and anthropogenic layers. All layers were resampled to a 1 km resolution using nearest neighbour interpolation for raster layers and grid overlay for vector layers prior to raster conversion. All layers were then projected into Irish Transverse Mercator (ITM). These are presented in Table 1, along with a justification for their inclusion and the methodology behind their pre-processing.

2.3. Data Analysis

Maximum entropy (MaxEnt) was the chosen statistical method to model the species-environment relationships for both seagrass species. This approach is most suitable for presence-only data (i.e., where you only have information on presence of a species and not confirmed absence), and uses information theory to choose the split in value of explanatory variables that accounts for the cleanest distribution of presence and randomly generated pseudo-absence points [54]. MaxEnt has developed into a robust tool for SDM research to accurately predict the distribution of a species when only a small number of observations are available [55], which is useful for inaccessible locations and understudied species, and has been used effectively to model global seagrass distributions [35]. All environmental variables outlined in Table 1 were incorporated in the analysis to estimate the extent of seagrass distributions within Ireland, as well as to assess the importance of physical and anthropogenic variables. The maximum number of iterations was set to 5000 to allow for model convergence, the number of pseudo-absences was set to 10,000 following Barbet-Massin et al. [56], and the model incorporated only linear and quadratic features to avoid overfitting during model parameterization. To account for uncertainty in model parameterization, we implemented a 10-fold cross-validation using random seed approach of response variable selection. The mean of the ten outputs was used as the final projection.
To evaluate the SDMs performance, we split each iteration of the 10-fold cross-validation into 80% training and 20% testing data as is common practice when independent test data are lacking [24]. We then averaged the resulting habitat suitability values and accuracy metrics across the 10 iterations. We used the Area Under the Curve (AUC) of the Receiver Operating Characteristic (ROC) which is a widely used method in SDM evaluation [24]. It has a value range between 0 and 1 with a value below 0.5 deemed no better than a random selection and a value of 1 representing a highly accurate model. MaxEnt provides evaluation of both the training and testing data used in each iteration of the cross-validation, and we used the test data (i.e., the proportion of data points, in this case 20%, withheld from each iteration of model parameterisation) to evaluate our models [75].
We also used percent contribution, permutation importance, and jackknifing to evaluate the importance of each variable. Percent contribution measures which variables contribute the most when fitting the model. Each step of the modelling algorithm increases the model gain by modifying the coefficient for a single feature, before assigning the contribution to the environmental variable responsible for the gain. While routinely used in SDM research, this metric is dependent on the path the algorithm takes to create the final output, meaning a different algorithm could take a different path and achieve the same solution, resulting in different values [75]. To overcome this stochasticity in evaluation, we also used permutation importance, which calculates the contribution to the final model determined by randomly permuting the values of each environmental variable among the response data (presence and pseudo-absence), and then normalising the subsequent drop in AUC to a percentage, with a large value indicating the model depends heavily on that variable [75]. The jackknife test involves multiple models being fit, with each variable iteratively excluded, as well as models being fit with each variable in isolation. A model is then fit with all variables, and the testing, training, and AUC gain between the full model and jackknifed models recorded, which indicate the importance of the variables to the overall distribution projections.

3. Results

Species Distribution Modelling

We projected Zostera spp. distributions to high accuracy within the coastal zone of Ireland, recording mean AUC values across the 10 iterations of cross validation as 0.939 and 0.931 for Z. marina and Z. noltei, respectively. We identified a clear east-west divide between low and moderately suitable habitat for Z. marina (Figure 2a), with highly (>0.50) and very highly (>0.75) suitable habitat found throughout the west coast, extending along the southern and northern parts of Ireland. The spatial distribution of suitable habitat for Z. noltei is more varied, with pockets of highly (>0.5) and very highly (>0.75) suitable habitat found near Dublin, Tralee, Sligo, and in the north near Londonderry, with locations often found in sheltered bays. The east-west divide for Z. marina appears to follow the sharp change in bathymetry, with the lower lying east coast subsequently less suitable. This is congruent with our analysis of the environmental variables that suggests bathymetry is the most important variable when considering Z. marina (Table 2).
The permutation importance of the environmental variables (Table 2) identified bathymetry, salinity (min), and SST (max) as the top three variables determining Z. marina distributions at a national level. Anthropogenic factors only accounted for 1.2% permutation importance for all variables combined, indicating that physical variables are the primary drivers of its distribution at a national level in Ireland. Response curves for Z. marina (Figure 3) identified optimal conditions at a depth of 5 m, with a positive response with bathymetry primarily found between 3 and 10 m. SST (max) was positively related with seagrass presence between 15.5 °C and 16.5 °C, and an optimal minimum salinity for the taxa was found between 27 and 33 psu. Similarly, we also identified three physical variables as the most important variables in determining Z. noltei, with SST (sd), salinity (mean) and SST (max). Response curves for Z. noltei (Figure 4) identified the optimal SST (sd) conditions between 3.9 and 4.8 °C, with a negative response identified for areas which had a smaller range of temperature variables. An optimal mean salinity between 17 and 32 psu was identified, with optimal conditions at 27 psu. Anthropogenic factors were deemed more important for Z. noltei, accounting for 6.8% permutation importance across all variables combined. Of note were the variables eco status (3.3%) and risk status (2.8%), which both reported higher probabilities of occurrence for areas which had lower water quality and higher risk. Similar results were observed when the model gain was explored through the jackknife tests (Supplementary Information S1).
We split the habitat suitability data into two binary classes (suitable and unsuitable) using the mean threshold value of maximum test sensitivity plus specificity. This resulted in 3014 km2 and 2157 km2 of suitable habitat for Z. marina and Z. noltei, respectively. This is substantially higher than the total area currently occupied by Z. marina (25.77 km2) and Z. noltei (22 km2) reported by verified studies. To control for areal coverage within the 1 km resolution of the SDM output, we standardized these projections by the overall percentage cover of the verified sightings within the same 1 km grid, and used the 25th, 50th, and 75th percentiles of this empirical data to create more realistic coverages (Table 3). We also standardised this based on the 11-fold overestimation based on SDM projections identified by Beca-Carretero et al. [39] in Galway, with results still suggesting over 250 km2 of Z. marina. This equates to a standardisation using our approach at the 68th percentile, indicating the reliability of our models to conservatively estimate the national distribution.

4. Discussion

The overarching aim of this research was to assess the potential geographic distribution of seagrass species in Ireland, and identify key physical and anthropogenic environmental drivers. Results indicated a large area of suitable habitat for both species exists in Ireland (Figure 2), with Z. marina observing an east-west split, while Z. noltei had a more restricted distribution within inlets and bays. The distribution of both species appeared to be primarily driven by physical variables, with the role of anthropogenic drivers less important. Using a conservative standardisation of the 50th percentile of areal coverage, we project there to be 94.34 km2 and 69.67 km2 of potentially suitable seagrass habitat at a national level for Z. marina and Z. noltei, respectively. It is important to note here that this represents suitable habitat, and not necessarily undiscovered or unmapped habitat; however, with recent research suggesting that seagrass distributions may be double the size of existing records at both an Irish [39] and global [35] level, our results suggest that there are potentially large areas of unmapped seagrass at a national extent. At the very least, we have identified locations of high suitability where more targeted research such as snorkelling and drone surveys can be undertaken to validate the presence of meadows or future research into the potential for sites to be used for enhancement or restoration efforts.
These results are important when considering the ecosystem services of seagrass species, and any potential enhancement or restoration efforts as part of Blue Carbon policy. Large conservation efforts in recent years have highlighted the successes and potential challenges associated with seagrass restoration. For example, Greiner et al. [76] illustrate an increase in over 1700 ha (or 17 km2) of seagrass restoration in Virginia, USA, with areas over 10 years old sequestering 36.68 g C m−2 yr−1. Similarly, a recent study in the UK estimated the monetary value of sedimentary carbon stock within the total 4887 ha (or 48.7 km2) of mapped Z. marina in the region at between GBP 2.6–5.3 million, or GBP 3360/ha [23]. Despite this potential, the restoration of seagrass efforts globally has been deemed as low success, labour intensive, and expensive [69,77,78]. However, recent research [79] has highlighted a major reason for such failings of past seagrass restoration efforts as incorrect site selection and a subsequent increase in project costs. Therefore, the use of SDM to identify areas of high suitability for seagrass is important, and here we suggest that SDMs are a useful framework for narrowing down potential sites. Moreover, given the short growth period to maturity (approximately 10 years), seagrasses are seen as a much more viable short-term option for carbon sequestration, with restored saltmarshes in the UK estimated to take approximately 100 years before they rivalled the sequestration potential of natural marshes [80].
It is important to note the caveats surrounding the application of this model in determining the current distribution and the targeting of sites for enhancement and/or restoration. The models (Figure 2) created identify suitable habitat, and subsequently identify locations that could contain unmapped seagrass sites or potential locations for enhancement or restoration. Independent validation of seagrass meadows is difficult, due to their remote locations and the resources needed to survey properly. As part of this study, we explored options of validating our models, including walking surveys of exposed beaches and the use of high resolution imagery, as has been used in previous research [20,39]. However, walking surveys failed to identify any exposed Z. marina due to the tidal regime in southern Ireland not exposing the meadows, and visual remote sensing did not provide us with a clear pattern of seagrass such that it was distinguishable from other macroalgae. Unfortunately, we did not have the resources to undertake canoeing or snorkelling expeditions, and as such our models could not be validated with independent data. Despite this, we still record high AUC accuracy metrics for our models using 10-fold cross validation, allowing confidence in the discussion of the importance of the environmental drivers of seagrass distributions at a national level.
Our results identified the optimal depth for Z. marina distribution in Ireland occurred between 3 and 10 m (Figure 3). This is congruent with other European studies [15,29,30,39,45], and is primarily due to the availability of light decreasing beyond that depth, which is needed for photosynthesis, but also importantly for carbon fixation rates [22,81,82,83]. When coupled with the fact that higher mud content has also been attributed to the storage of higher amounts of carbon [15], the need to consider not just the distribution but also the growth rate of the species related to the environmental variables becomes an imperative aspect of future research on the Blue Carbon potential of seagrasses. This is particularly pertinent given the importance of SST in our results (Table 2) and the associated response curves (Figure 3 and Figure 4).
SST was a key variable for both species (Table 2), with Z. marina and Z. noltei reporting an optimal mean temperature of 10.4 °C and 11.75 °C, respectively. Again, these results align with previous research, that identifies the influence of temperature on seagrass photosynthesis, respiration, growth, flowering, and seed germination [80], with temperature considered the overall driver of seagrass distribution in Europe [45]. Interestingly, we found that a large standard deviation in SST resulted in high suitability for Z. noltei, and a similar pattern for Z. marina, albeit with a bimodal distribution (Figure 3 and Figure 4). SST is increasing in Ireland [84], with warmer conditions potentially increasing the range of temperatures that seagrasses are exposed to. This change might provide an increased opportunity for optimal conditions for successful recruitment events at locations previous considered unsuitable, and future research should continue to explore the patterns of temperature as possible mechanisms for seagrass distributions.
Furthermore, the range of temperatures that affect the physiological tolerances of seagrass are found between −1 °C and 25 °C, meaning regional or national studies tend to omit temperature as a parameter due to the wide range of tolerable values [30,31]. In Ireland, SST ranges are within these limits, meaning we could have successfully justified omitting this variable, yet we identified SST as one of the most important determinants of both seagrass species (Table 2). Recent research by Beca-Carreteroa et al. [39] in Galway Ireland also identified temperature as a key variable for Z. marina, corroborating the finding that such variables are important at defining the fine-scale patterns of seagrass species. We also found similar patterns with small changes in salinity resulting in variations of habitat suitability (Figure 3 and Figure 4), and a similar trend within literature to omit this variable at local to regional scales if low fluctuations are present [35]. However, given recent trends and future projections of increased temperature extremes [85], coupled with the fine-scale response of seagrass distributions to SST and salinity measurements, we suggest that these variables are included as factors in future research, particularly when assessing suitable sites for restoration or enhancement projects.
Our results identified the overarching importance of physical variables in determining the distribution of seagrass species at a national level in the Republic of Ireland compared to anthropogenic factors. We found the distribution of seagrass species to overlap with dredge fishing and shellfish activities (Figure 3 and Figure 4); however, it is important to note here that SDM parameterization only takes into account presence or absence of a species, not its condition. With the potential impact of dredge fishing through vehicle tracks a concern for the sustainability of seagrass meadows [20], we would advise future research to identify the condition of such meadows within proximate locations, as a meadow can be present but in a poor condition, limiting its ability to perform intended ecosystem services.
We did identify that Z. marina favoured lower risk areas, while Z. noltei was more varied in its environmental suitability (Figure 3 and Figure 4), supporting the claim that risk of pollutants and subsequent eutrophication can limit its distribution [20,86,87]. Despite that, we still identified suitable habitat within higher risk locations, suggesting that either anthropogenic factors are not a limiting factor at a national scale, or our models are missing potentially important variables. For example, we have used bathymetry as a proxy for light availability following previous research [57], where a variable such as diffuse attenuation might be more appropriate; however the availability of such data at an appropriate spatial scale is not available in the study region. Again, the discrepancy between presence of seagrass and the condition of seagrass in model parameterization should be noted, but so to the issue of scale. We generated our models at a 1 km resolution due to constraints with the original resolution of environmental variables, which could potentially mask the fine-scale anthropogenic processes operating in the area. During preliminary fieldwork we observed several accumulations of wrack at beaches, including an approximate 1.5 m high and 4 m wide stack of algae at Youghall that ran from over 2 km, presence of bioturbators which graze on seagrass, and high boat traffic at locations (See Supplementary Information S2). Such beach-scale processes may not be captured in a coarse homogenous representation of anthropogenic factors at a national level, with certain processes not captured through existing proxies of run-off and exposure. Subsequently, more research is needed into the impact of fine-scale anthropogenic drivers of seagrass distributions, and any sites that are deemed suitable given environmental conditions should be critically evaluated to determine what is preventing natural seagrass recruitment before any potential restoration or establishment projects begin.

5. Conclusions

Blue Carbon ecosystems offer the potential to sequester large amounts of carbon, providing a unique opportunity to mitigate against the impact of climate change. Globally, seagrasses remain the most understudied of these ecosystems, with their total geographic extent largely unknown due to challenges in mapping dynamic coastal environments. Here we used SDM to identify areas of high suitability, in order to inform our understanding of where unmapped meadows may be located or to inform suitable sites for enhancement and/or restoration efforts (Figure 2). We also focused on the importance of physical and anthropogenic factors in determining the distribution. Using a conservative (50th percentile) filter from our SDM projections, we estimate approximately 95 km2 of suitable habitat for Z. marina and 70 km2 for Z. noltei nationally. This is almost a four-fold increase in the amount of verified seagrass extent currently mapped nationally. We found our results were largely congruent with other research that highlights the importance of bathymetry, SST and salinity, but we found small variations in such variables resulted in large differences of habitat suitability (Table 2, Figure 3 and Figure 4). Subsequently, we suggest future research ensures such physical variables are accounted for when projecting seagrass distributions. We identified that anthropogenic factors were less important in determining the national distribution of seagrass, but these findings could be a result of important anthropogenic processes masked at a national extent and/or the fact that distribution models account for presence of species, not its condition. Subsequently, we suggest that future research investigate the condition of such meadows, in order to inform further enhancement and restoration events. This research should foster discussion for researchers and practitioners working on sustainability projects related to Blue Carbon.

Supplementary Materials

The following are available online at https://www.mdpi.com/2071-1050/12/20/8302/s1. Supplementary Information S1: Results of the jackknife test. Supplementary Information S2: Photos to provide context to beach level processes.

Author Contributions

Conceptualization, R.H., V.C. and P.H.; methodology, R.H., V.C., and P.H.; data collection, R.H.; formal analysis, R.H.; writing—original draft preparation, R.H., P.H.; writing–review and editing, R.H., V.C., and P.H. All authors have read and agreed to the published version of the manuscript.

Funding

R.H. was funded by the Quercus College Scholarship, University College Cork. The APC was funded by the Research Publication Fund in the College of Arts, Celtic Studies and Social Science, University College Cork.

Acknowledgments

We would like to thank the reviewers, editors, and Robert Wilkes for their comments and suggestions. We would also like to thank the College of Arts, Celtic Studies and Social Science at University College Cork for providing funding for the publication of this research. We would also like to thank the National Parks and Wildlife Service, the Department of Culture, Heritage and the Gaeltacht, and Robert Wilkes for access to species and habitat data. Data used in this research was made available by the EMODnet Human activities project, https://www.emodnet-humanactivities.edu, and EMODnet Geology project, https://www.emodnet-geology.eu funded by the European Commission Directorate General for Maritime Affairs and Fisheries. These data were collected by INSS, INFOMAR, OSPAR, the Environmental Protection Agency, and the Department of Agriculture, Food and the Marine. This study has also been conducted using E.U. Copernicus Marine Service Information.

Conflicts of Interest

The authors declare no conflict of interest.

References

  1. Lees, F.; Baillie, M.; Gettinby, G.; Revie, C.W. The Efficacy of Emamectin Benzoate against infestations of Lepeoptheirus salmonis on Farmed Atlantic Salmon (Salmo salar L.) in Scotland, 2002–2006. PLoS ONE 2008, 3, e1549. [Google Scholar] [CrossRef]
  2. Devoy, R.J.N. Coastal Vulnerability and the implications of Sea-Level Rise for Ireland. J. Coast. Res. 2008, 24, 325–341. [Google Scholar] [CrossRef]
  3. Spencer, M.; Birchenough, S.N.R.; Mieszkowska, N.; Robinson, L.A.; Simpson, S.D.; Burrows, M.T.; Capasso, E.; Cleall-Harding, P.; Crummy, J.; Duck, C.; et al. Temporal change in UK marine communities: Trends or regime shifts? Mar. Ecol. 2011, 32, 10–24. [Google Scholar] [CrossRef]
  4. Obst, M.; Vicario, S.; Lundin, K.; Berggren, M.; Karlsson, A.; Haines, R.; Williams, A.; Goble, C.; Mathew, C. Marine long-term biodiversity assessment suggests loss of rare species in the Skagerrak and Kattegat region. Mar. Biodivers. 2018, 48, 2165–2176. [Google Scholar] [CrossRef]
  5. Hillebrand, H.; Brey, T.; Gutt, J.; Hagen, W.; Metflies, K.; Meyer, B.; Lewandowska, A. Climate change: Warming impacts on marine biodiversity. In Handbook on Marine Environment Protection; Salomon, M., Markus, T., Eds.; Springer: Cham, Switzerland, 2018; pp. 353–373. [Google Scholar]
  6. Smale, D.A.; Wernberg, T.; Oliver, E.C.; Thomsen, M.; Harvey, B.P.; Straub, S.C.; Burrows, M.T.; Alexander, L.V.; Benthuysen, J.A.; Donat, M.G.; et al. Marine heatwaves threaten global biodiversity and the provision of ecosystem services. Nat. Clim. Chang. 2019, 9, 306–312. [Google Scholar] [CrossRef] [Green Version]
  7. Holloway, P.; Field, R. Can rock-rubble groynes support similar intertidal ecological communities to natural rocky shores? Land 2020, 9, 131. [Google Scholar] [CrossRef]
  8. Neumann, B.; Vafeidis, A.T.; Zimmermann, J.; Nicholls, R.J. Future coastal population growth and exposure to sea-level rise and coastal flooding-a global assessment. PLoS ONE 2015, 10, e0131375. [Google Scholar] [CrossRef]
  9. Worm, B. Marine conservation: How to heal an ocean. Nature 2017, 543, 630–631. [Google Scholar] [CrossRef]
  10. Nellemann, C.; Corcoran, E.; Duarte, C.M.; De Young, C.; Fonseca, L.E.; Grimsdith, G. Blue Carbon: The Role of Healthy Oceans in Binding Carbon; Center for Coastal and Ocean Mapping: Durham, NH, USA, 2010; p. 13. [Google Scholar]
  11. Lovelock, C.E.; Duarte, C.M. Dimensions of blue carbon and emerging perspectives. Biol. Lett. 2019, 15, 20180781. [Google Scholar] [CrossRef]
  12. Laffoley, D.; Grimsditch, G. The Management of Natural Coastal Carbon Sinks; IUCN: Gland, Switzerland, 2009. [Google Scholar]
  13. Herr, D.; Landis, E. Coastal Blue Carbon Ecosystems. Opportunities for Nationally Determined Contributions. Policy Brief; IUCN: Gland, Switzerland, 2016. [Google Scholar]
  14. Macreadie, P.I.; Hughes, A.R.; Kimbro, D.L. Loss of ‘blue carbon’ from coastal salt marshes following habitat disturbance. PLoS ONE 2013, 8, e69244. [Google Scholar] [CrossRef]
  15. Dale, A.L.; McAllen, R.; Whelan, P. Management considerations for subtidal Zostera marina beds in Ireland. In Irish Wildlife Manuals; NPWS: Sydney, Australia, 2007; Volume 28. [Google Scholar]
  16. Lilley, R.J.; Unsworth, R.K. Atlantic Cod (Gadus morhua) benefits from the availability of seagrass (Zostera marina) nursery habitat. Glob. Ecol. Conserv. 2014, 2, 367–377. [Google Scholar] [CrossRef] [Green Version]
  17. Jackson, E.L.; Rees, S.E.; Wilding, C.; Attrill, M.J. Use of a seagrass residency index to apportion commercial fishery landing values and recreation fisheries expenditure to seagrass habitat service. Conserv. Biol. 2015, 29, 899–909. [Google Scholar] [CrossRef] [PubMed] [Green Version]
  18. Nordlund, L.M.; Koch, E.W.; Barbier, E.B.; Creed, J.C. Seagrass Ecosystem services and their variability across genera and geographical regions. PLoS ONE 2016, 11, e0163091. [Google Scholar] [CrossRef] [PubMed] [Green Version]
  19. Walls, A.M.; Kennedy, R.; Edwards, M.D.; Johnson, M.P. Impact of kelp cultivation on the Ecological Status of benthic habitats and Zostera marina seagrass biomass. Mar. Pollut. Bull. 2017, 123, 19–27. [Google Scholar] [CrossRef] [PubMed] [Green Version]
  20. Wilkes, R.; Bennion, M.; McQuaid, N.; Beer, C.; McCullough-Annett, G.; Colhoun, K.; Inger, R.; Morrison, L. Intertidal seagrass in Ireland: Pressures, WFD status and an assessment of trace element contamination in intertidal habitats using Zostera noltei. Ecol. Indic. 2017, 82, 117–130. [Google Scholar] [CrossRef]
  21. Ruiz-Frau, A.; Gelcich, S.; Hendriks, I.E.; Duarte, C.M.; Marbà, N. Current state of seagrass ecosystem services: Research and policy integration. Ocean Coast. Manag. 2017, 149, 107–115. [Google Scholar] [CrossRef]
  22. Röhr, M.E.; Holmer, M.; Baum, J.K.; Björk, M.; Boyer, K.; Chin, D.; Chalifour, L.; Cimon, S.; Cusson, M.; Dahl, M.; et al. Blue Carbon Storage Capacity of Temperate Eelgrass (Zostera marina) Meadows. Glob. Biogeochem. Cycles 2018, 32, 1457–1475. [Google Scholar] [CrossRef] [Green Version]
  23. Green, A.; Chadwick, M.A.; Jones, P.J.S. Variability of UK seagrass sediment carbon: Implications for blue carbon estimates and marine conservation management. PLoS ONE 2018, 19, e0204431. [Google Scholar] [CrossRef] [Green Version]
  24. Franklin, J. Mapping Species Distributions: Spatial Inference and Prediction, 1st ed.; Cambridge Univeristy Press: Cambridge, UK, 2010. [Google Scholar]
  25. Peterson, A.T.; Soberón, J.; Pearson, R.G.; Anderson, R.P.; Martínez-Meyer, E.; Nakamura, E.; Araújo, M.B. Ecological Niches and Geographic Distributions (MPB-49); Princeton University Press: Princeton, NJ, USA, 2011. [Google Scholar]
  26. Elith, J.; Leathwick, J.R. Species distribution models: Ecological explanation and prediction across space and time. Annu. Rev. Ecol. Evol. Syst. 2009, 40, 677–697. [Google Scholar] [CrossRef]
  27. Miller, J.A.; Holloway, P. Niche theory and models. In International Encyclopedia of Geography: People, the Earth, Environment and Technology; John Wiley & Sons: Hoboken, NJ, USA, 2017; pp. 1–10. [Google Scholar]
  28. Van der Heide, T.; Peeters, E.T.H.M.; Hermus, D.C.R.; Van Katwijk, M.M.; Roelofs, J.G.M.; Smolders, A.J.P. Predicting habitat suitability in temperate seagrass ecosystems. Limnol. Oceanogr. 2009, 54, 2018–2024. [Google Scholar] [CrossRef] [Green Version]
  29. Downie, A.L.; von Numers, M.; Boström, C. Influence of model selection on the predicted distribution of the segrass Zostera marina. Estuar. Coast. Shelf Sci. 2013, 121–122, 8–19. [Google Scholar] [CrossRef]
  30. Thomson, M.; Jackson, E.; Kakkonen, J. Seagrass (Zostera) Beds in Orkney; Scottish Natural Heritage Commissioned Report No. 765; Scottish Natural Heritage Commission: Edinburgh, UK, 2014. [Google Scholar]
  31. Brown, G.D. Modelling the Potential Distribution of Zostera Marina in Wales; Swansea; Swansea University: Swansea, UK, 2015. [Google Scholar]
  32. Adams, M.P.; Saunders, M.I.; Maxwell, P.S.; Tuazon, D.; Roelfsema, C.M.; Callaghan, D.P.; Leon, J.; Grinham, A.R.; O’Brien, K.R. Prioritizing localized mana gement actions for seagrass conservation and restoration using a species distribution model. Aquat. Conserv. Mar. Freshw. Ecosyst. 2016, 26, 639–659. [Google Scholar] [CrossRef]
  33. Boscutti, F.; Marcorin, I.; Sigura, M.; Bressan, E.; Tamberlich, F.; Vianello, A.; Casolo, V. Distribution modeling of seagrasses in brackish waters of Grado-Marano lagoon (Northern Adriatic Sea). Estuar. Coast. Shelf Sci. 2015, 164, 183–193. [Google Scholar] [CrossRef]
  34. Folmer, E.O.; van Beusekom, J.E.; Dolch, T.; Gräwe, U.; van Katwijk, M.M.; Kolbe, K.; Philippart, C.J. Consensus forecasting of intertidal seagrass habitat in the Wadden Sea. J. Appl. Ecol. 2016, 53, 800–1813. [Google Scholar] [CrossRef]
  35. Jayathilake, D.R.M.; Costello, M.J. A modelled global distribution of the seagrass biome. Biol. Conserv. 2018, 226, 120–126. [Google Scholar] [CrossRef]
  36. Traganosa, D.; Reinartz, P. Mapping Mediterranean seagrasses with Sentinel-2 imagery. Mar. Pollut. Bull. 2018, 134, 197–209. [Google Scholar] [CrossRef] [PubMed] [Green Version]
  37. Duffy, J.P.; Pratt, L.; Anderson, K.; Land, P.E.; Shutler, J.D. Spatial assessment of intertidal seagrass meadows using optical imaging systems and a lightweight drone. Estuar. Coast. Shelf Sci. 2018, 200, 169–180. [Google Scholar] [CrossRef]
  38. Zellmer, A.J.; Claisse, J.T.; Williams, C.M.; Schwab, S.; Pondella, D.J. Predicting optimal sites for ecosystem restoration using stacked-species distribution modeling. Front. Mar. Sci. 2019, 6, 3. [Google Scholar] [CrossRef] [Green Version]
  39. Beca-Carreteroa, P.; Varela, S.; Stengel, D.B. A novel method combining species distribution models, remote sensing, and field surveys for detecting and mapping subtidal seagrass meadows. Aquat. Conserv. 2020, 30, 1098–1110. [Google Scholar] [CrossRef]
  40. Fernández-Torquemada, Y.; Sánchez-Lizaso, J.L. Effects of salinity on leaf growth and survival of the Mediterranean seagrass Posidonia oceanica (L.) Delile. J. Exp. Mar. Biol. Ecol. 2005, 320, 57–63. [Google Scholar]
  41. Duarte, C.M.; Marbà, N.; Krause-Jensen, D.; Sánchez-Camacho, M. Testing the predictive power of seagrass depth limit models. Estuar. Coast. 2007, 30, 652. [Google Scholar] [CrossRef]
  42. Nejrup, L.B.; Pedersen, M.F. Effects of salinity and water temperature on the ecological performance of Zostera marina. Aquat. Bot. 2008, 88, 239–246. [Google Scholar] [CrossRef]
  43. Pagès, J.F.; Pérez, M.; Romero, J. Sensitivity of the seagrass Cymodocea nodosa to hypersaline conditions: A microcosm approach. J. Exp. Mar. Biol. Ecol. 2010, 386, 34–38. [Google Scholar] [CrossRef]
  44. Beca-Carreteroa, P.; Stanschewski, C.S.; Julia-Miralles, M.; Sanchez-Gallego, A.; Stengel, D.B. Temporal and depth-associated changes in the structure, morphometry and production of near-pristine Zostera marina meadows in western Ireland. Aquat. Bot. 2019, 155, 5–17. [Google Scholar] [CrossRef]
  45. Borum, J.; Duarte, C.M.; Krause-Jensen, D.; Greve, T.M. European Seagrasses: An Introduction to Monitoring and Management; The M&MS Project; European Commission: Brussels, Belgium, 2004. [Google Scholar]
  46. Maslo, B.; Lockwood, J.L. Coastal Conservation; Cambridge University Press: Cambridge, UK, 2014; Volume 19. [Google Scholar]
  47. Mangiacotti, M.; Scali, S.; Sacchi, R.; Bassu, L.; Nulchis, V.; Corti, C. Assessing the spatial scale effect of anthropogenic factors on species distribution. PLoS ONE 2013, 8, e67573. [Google Scholar] [CrossRef] [PubMed] [Green Version]
  48. Holloway, P. Simulating movement-related resource dynamics to improve species distribution models: A case study with oilbirds in Northern South America. Prof. Geogr. 2018, 70, 528–540. [Google Scholar] [CrossRef]
  49. McGovern, J.V.; Nash, S.; Hartnett, M. Interannual improvement in sea lettuce blooms in an agricultural catchment. Front. Mar. Sci. 2019, 6, 1–18. [Google Scholar] [CrossRef] [Green Version]
  50. Jessopp, M.; McAllen, R.; O’Halloran, J.; Kelly, T. Nutrient and Ecosystem Dynamics in Ireland’s Only Marine Nature Reserve (NEIDIN); Final Report for the STRIVE-Funded Project: 2007-FS-B-4-M5, 66; Environmental Protection Agency: Wexford, Ireland, 2011. [Google Scholar]
  51. McCarthy, G.D.; Gleeson, E.; Walsh, S. The influence of ocean variations on the climate of Ireland. Weather 2015, 70, 242–245. [Google Scholar] [CrossRef] [Green Version]
  52. Cronin, K.M.; Devoy, R.J.N.; Gault, J. Modelling Estuarine Morphodynamics on the South Coast of Ireland. J. Coast. Res. 2007, 50, 474–479. [Google Scholar]
  53. Gallagher, S.; Tiron, R.; Dias, F. A long-term nearshore wave hindcast for Ireland: Atlantic and Irish Sea coasts (1979–2012). Present wave climate and energy resource assessment. Ocean Dyn. 2014, 64, 1163–1180. [Google Scholar] [CrossRef]
  54. Phillips, S.J.; Anderson, R.P.; Schapire, R.E. Maximum entropy modeling of species geographic distributions. Ecol. Model. 2006, 190, 231–259. [Google Scholar] [CrossRef] [Green Version]
  55. Elith, J.; Graham, C.H. Do they? How do they? WHY do they differ? On finding reasons for differing performances of species distribution models. Ecography 2009, 32, 66–77. [Google Scholar] [CrossRef]
  56. Barbet-Massin, M.; Jiguet, F.; Albert, C.H.; Thuiller, W. Selecting pseudo-absences for species distribution models: How, where and how many? Methods Ecol. Evol. 2012, 3, 327–338. [Google Scholar] [CrossRef]
  57. Schubert, P.R.; Hukriede, W.; Karez, R.; Reusch, T.B.H. Mapping and modeling eelgrass Zostera marina distribution in the western Baltic Sea. Mar. Ecol. Prog. Ser. 2015, 522, 79–95. [Google Scholar] [CrossRef] [Green Version]
  58. GEBCO Compilation Group. GEBCO 2020 Grid (doi:10.5285/836f016a-33be-6ddc-e053- 6c86abc0788e); GEBCO Compilation Group: White Marsh, MD, USA, 2020. [Google Scholar]
  59. Amo, A.; Reffray, G.; Sotillo, M.G.; Aznar, R.; Guihou, K. Atlantic-Iberian Biscay Irish-Ocean Physics Analysis and Forecast Product: IBI_Analysis_Forecast_PHYS_005_001. 6.3; VDOKUMENTS: Mexico City, Mexico, 2020. [Google Scholar]
  60. Marine Institute. Predominant Habitat Type. 2017. Available online: https://data.gov.ie/dataset/predominant-habitat-type (accessed on 1 August 2019).
  61. Marine Institute. Collated Seabed Structure. 2017. Available online: https://data.gov.ie/dataset/collated-seabed-substrate (accessed on 1 August 2019).
  62. National Parks and Wildlife Services. Site Specific Conservation Objectives. 2019. Available online: https://www.npws.ie/maps-and-data/habitat-and-species-data (accessed on 1 August 2019).
  63. EMODnet-Geology. Seabed Substrate 1:250k. Available online: https://www.emodnet-geology.eu/data-products/seabed-substrates/ (accessed on 1 August 2019).
  64. Environmental Protection Agency (EPA). WFD Transitional Waterbody Status 2010–2015. Available online: https://data.gov.ie/dataset/wfd-transitional-waterbody-status-2010-2015 (accessed on 1 August 2019).
  65. Environmental Protection Agency (EPA). WFD Coastal Waterbody Status 2010–2015. Available online: https://data.gov.ie/dataset/wfd-coastal-waterbody-status-2010-2015 (accessed on 1 August 2019).
  66. Environmental Protection Agency (EPA). WFD Coastal Waterbody Approved Risk. Available online: https://data.gov.ie/dataset/wfd-coastal-waterbody-approved-risk (accessed on 1 August 2019).
  67. Environmental Protection Agency (EPA). WFD Transitional Waterbody Approved Risk. Available online: https://data.gov.ie/dataset/wfd-transitional-waterbody-approved-risk (accessed on 1 August 2019).
  68. Marine Institute. Inshore Dredge Fishing Activity. Available online: https://data.gov.ie/dataset/inshore-dredge-fishing-activity (accessed on 1 August 2019).
  69. Green, E.P.; Short, F.T. World Atlas of Seagrasses; University of California Press: Berkeley, CA, USA, 2003. [Google Scholar]
  70. EMODnet Human Activities. Dredging. 2017. Available online: https://www.emodnet-humanactivities.eu/search-results.php?dataname=Dredging (accessed on 1 August 2019).
  71. EMODnet Human Activities. Dredged Dumping Sites. 2005. Available online: https://www.emodnet-humanactivities.eu/search-results.php?dataname=Dredge+Spoil+Dumping+%28Polygons%29 (accessed on 1 August 2019).
  72. EMODnet Human Activities. Finfish Production. 2019. Available online: https://www.emodnet-humanactivities.eu/search-results.php?dataname=Finfish+Production (accessed on 1 August 2019).
  73. Ferris, B.E.; Conway-Cranos, L.L.; Sanderson, B.L.; Hoberecht, L. Bivalve aquaculture and seagrass: A global meta-analysis. Aquaculture 2019, 498, 254–262. [Google Scholar] [CrossRef]
  74. EMODnet Human Activities. Shellfish Production. 2014. Available online: https://www.emodnet-humanactivities.eu/search-results.php?dataname=Shellfish+Production (accessed on 1 August 2019).
  75. Phillips, S.J.; Anderson, R.P.; Dudík, M.; Schapire, R.E.; Blair, M.E. Opening the black box: An open-source release of MaxEnt. Ecography 2017, 40, 887–893. [Google Scholar] [CrossRef]
  76. Greiner, J.T.; McGlathery, K.J.; Gunnell, J.; McKee, B.A. Seagrass restoration enhances “blue carbon” sequestration in coastal waters. PLoS ONE 2013, 8, e72469. [Google Scholar] [CrossRef] [Green Version]
  77. Cunha, A.H.; Marbá, N.N.; van Katwijk, M.M.; Pickerell, C.; Henriques, M.; Bernard, G.; Ferreira, M.A.; Garcia, S.; Garmendia, J.M.; Manent, P. Changing paradigms in seagrass restoration. Restor. Ecol. 2012, 20, 427–430. [Google Scholar] [CrossRef]
  78. Paulo, D.; Cunha, A.H.; Boavida, J.; Serrão, E.A.; Gonçalves, E.J.; Fonseca, M. Open coast seagrass restoration. Can we do it? Large scale seagrass transplants. Front. Mar. Sci. 2019, 6, 52. [Google Scholar] [CrossRef] [Green Version]
  79. Van Katwijk, M.M.; Thorhaug, A.; Marbà, N.; Orth, R.J.; Duarte, C.M.; Kendrick, G.A.; Althuizen, I.H.; Balestri, E.; Bernard, G.; Cambridge, M.L.; et al. Global analysis of seagrass restoration: The importance of large-scale planting. J. Appl. Ecol. 2016, 53, 567–578. [Google Scholar] [CrossRef] [Green Version]
  80. Burden, A.; Garbutt, A.; Evans, C.D. Effect of restoration on saltmarsh carbon accumulation in Eastern England. Biol. Lett. 2019, 15, 1–4. [Google Scholar] [CrossRef] [PubMed] [Green Version]
  81. Serrano, O.; Lavery, P.S.; Rozaimi, M.; Mateo, M.Á. Influence of water depth on the carbon sequestration capacity of seagrasses. Glob. Biogeochem. Cycles 2014, 28, 950–961. [Google Scholar] [CrossRef]
  82. Postlethwaite, V.R.; McGowan, A.E.; Kohfeld, K.E.; Robinson, C.L.; Pellatt, M.G. Low blue carbon storage in eelgrass (Zostera marina) meadows on the Pacific Coast of Canada. PLoS ONE 2018, 13, e0198348. [Google Scholar] [CrossRef]
  83. Short, F.; Carruthers, T.; Dennison, W.; Waycott, M. Global seagrass distribution and diversity: A bioregional model. J. Exp. Mar. Biol. Ecol. 2007, 350, 3–20. [Google Scholar] [CrossRef]
  84. Olbert, A.I.; Dabrowski, T.; Nash, S.; Hartnett, M. Regional modelling of the 21st century climate changes in the Irish Sea. Cont. Shelf Res. 2012, 41, 48–60. [Google Scholar] [CrossRef] [Green Version]
  85. Masson-Delmotte, V. Global Warming of 1.5 °C: An IPCC Special Report on the Impacts of Global Warming of 1.5 °C Above Pre-industrial Levels and Related Global Greenhouse Gas Emission Pathways, in the Context of Strengthening the Global Response to the Threat of Climate Change, Sustainable Development, and Efforts to Eradicate Poverty; Masson-Delmotte, V., Ed.; World Meteorological Organization: Geneva, Switzerland, 2018; p. 32. [Google Scholar]
  86. Wan, A.H.L.; Wilkes, R.J.; Heesch, S.; Bermejo, R.; Johnson, M.P.; Morrison, L. Assessment and characterisation of Ireland’s Green Tides (Ulva Species). PLoS ONE 2017, 12, e0169049. [Google Scholar] [CrossRef]
  87. Bermejo, R.; Heesch, S.; Mac Mongail, M.; O’Donnell, M.; Daly, E.; Wilkes, R.J.; Morrison, L. Spatial and temporal variability of biomass and composition of green tides in Ireland. Harmful Algae 2019, 81, 94–105. [Google Scholar] [CrossRef]
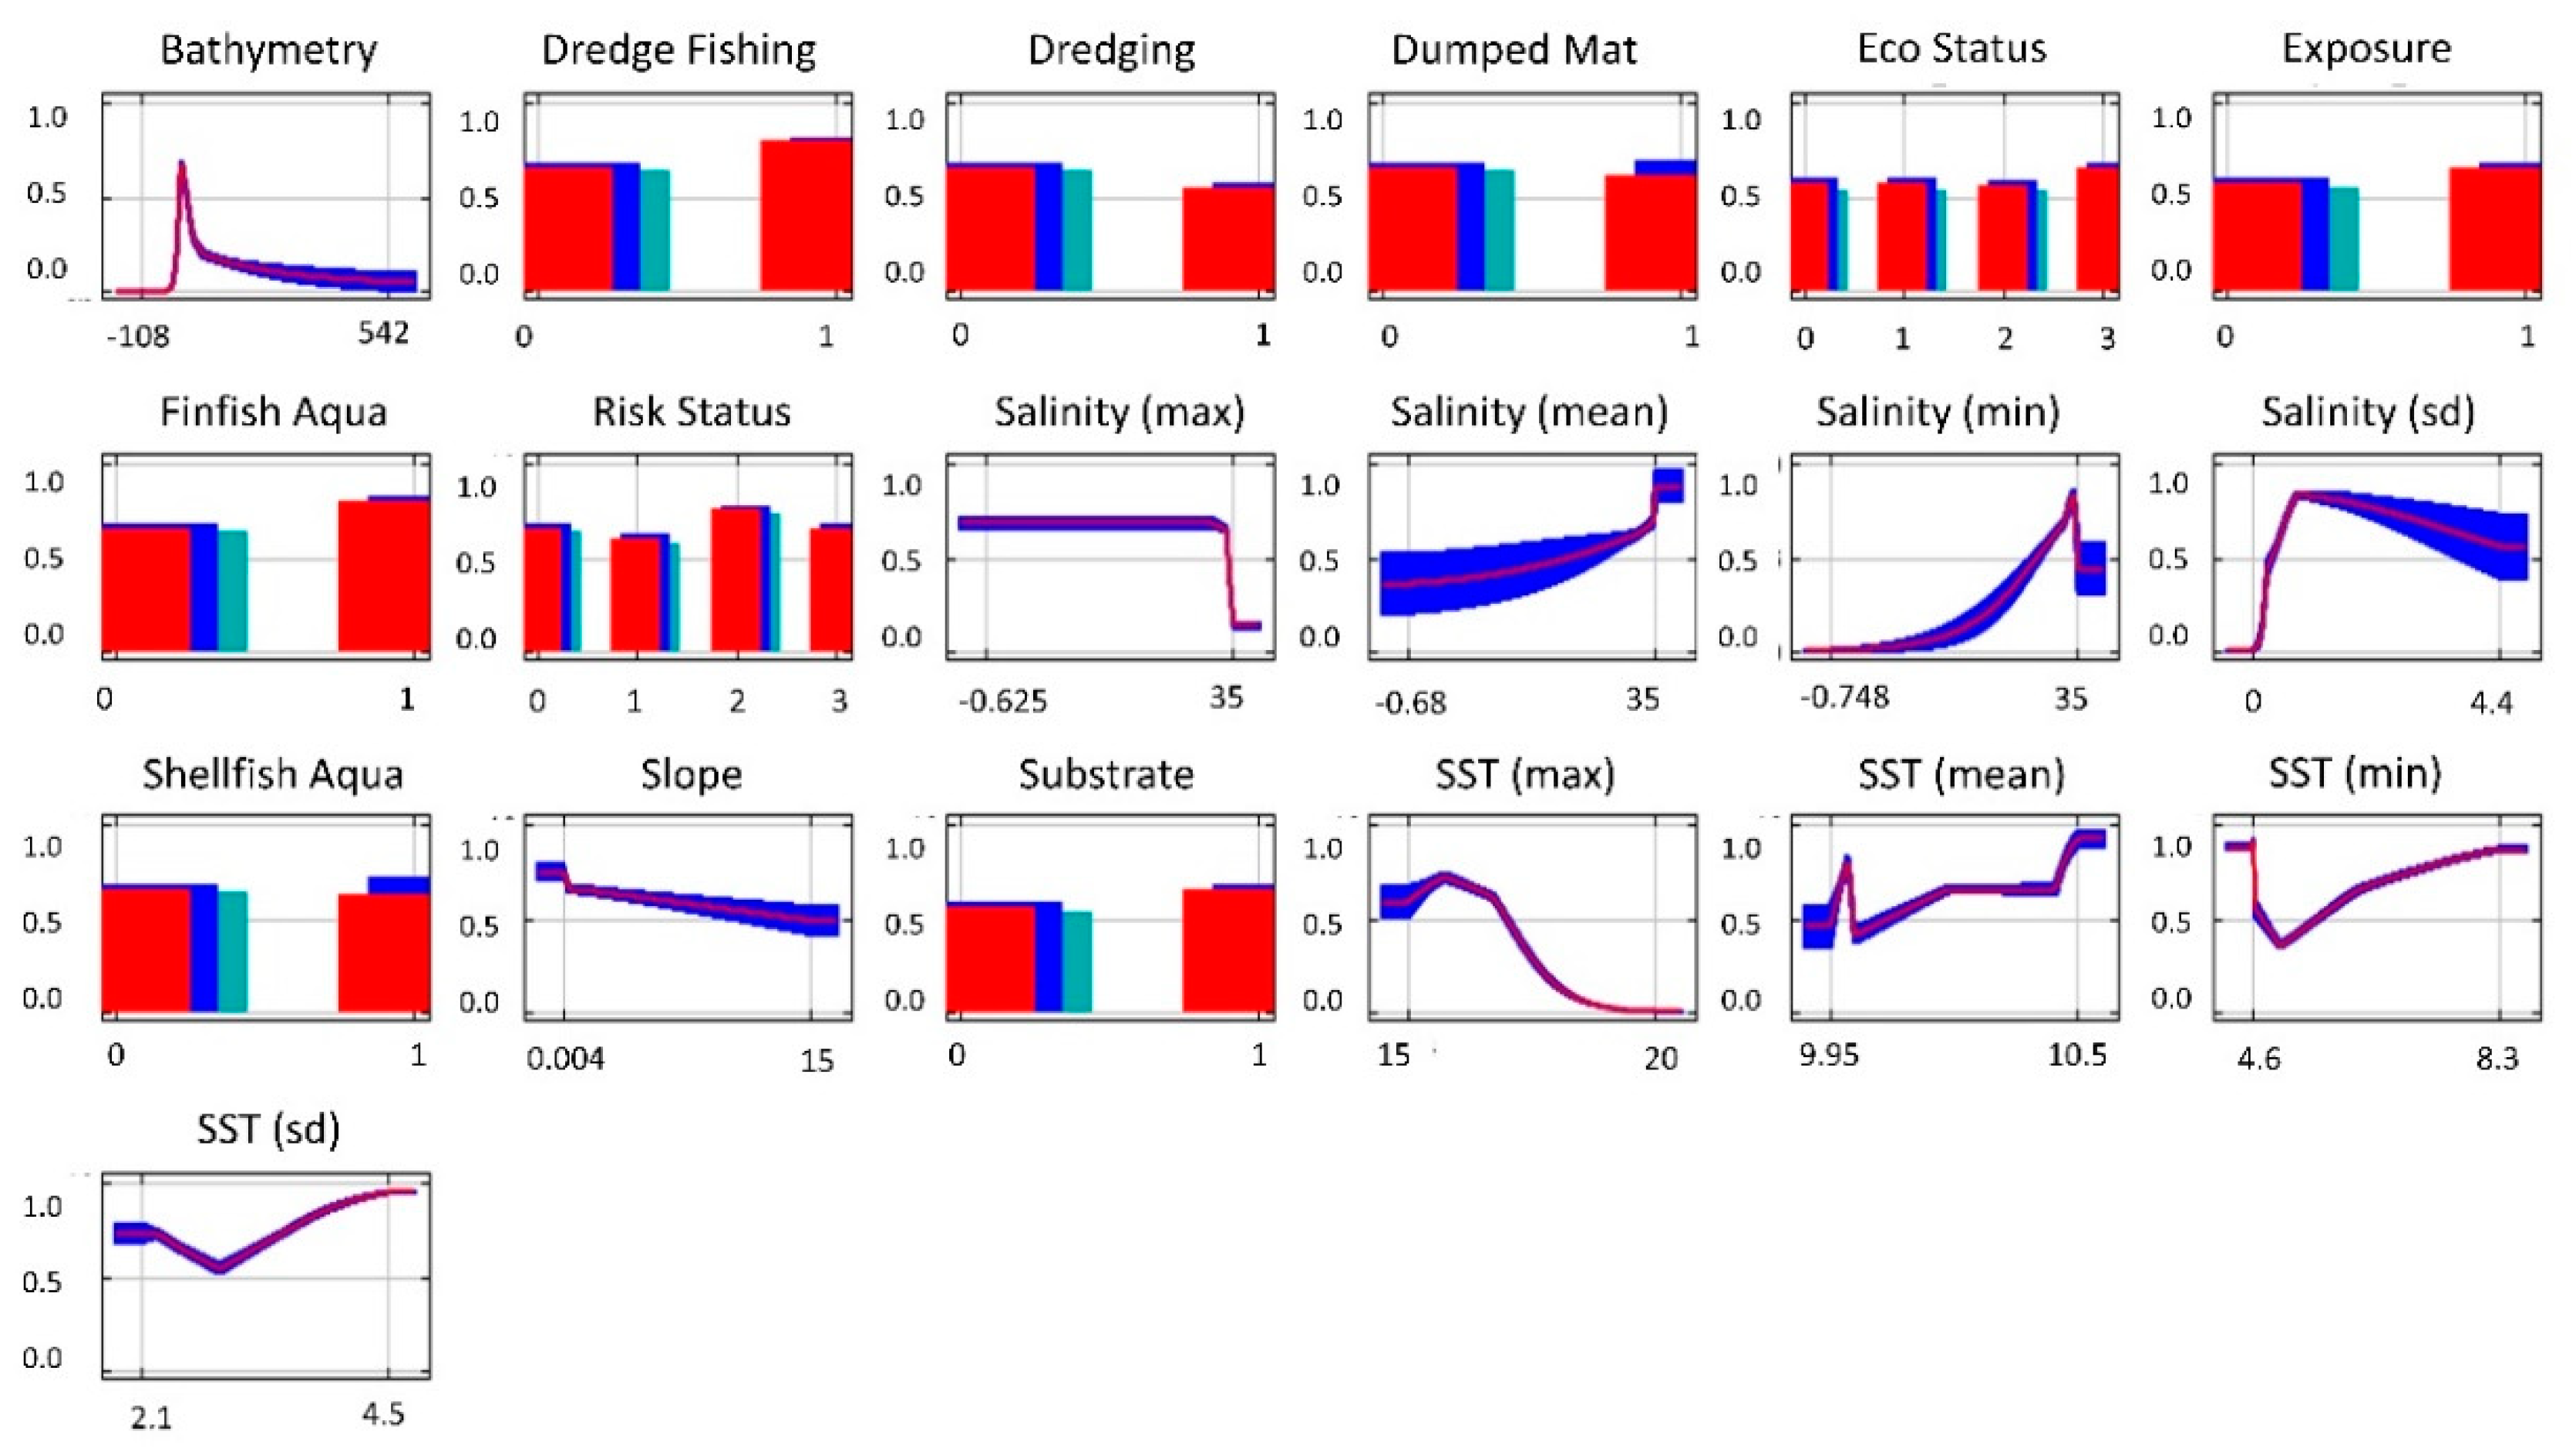
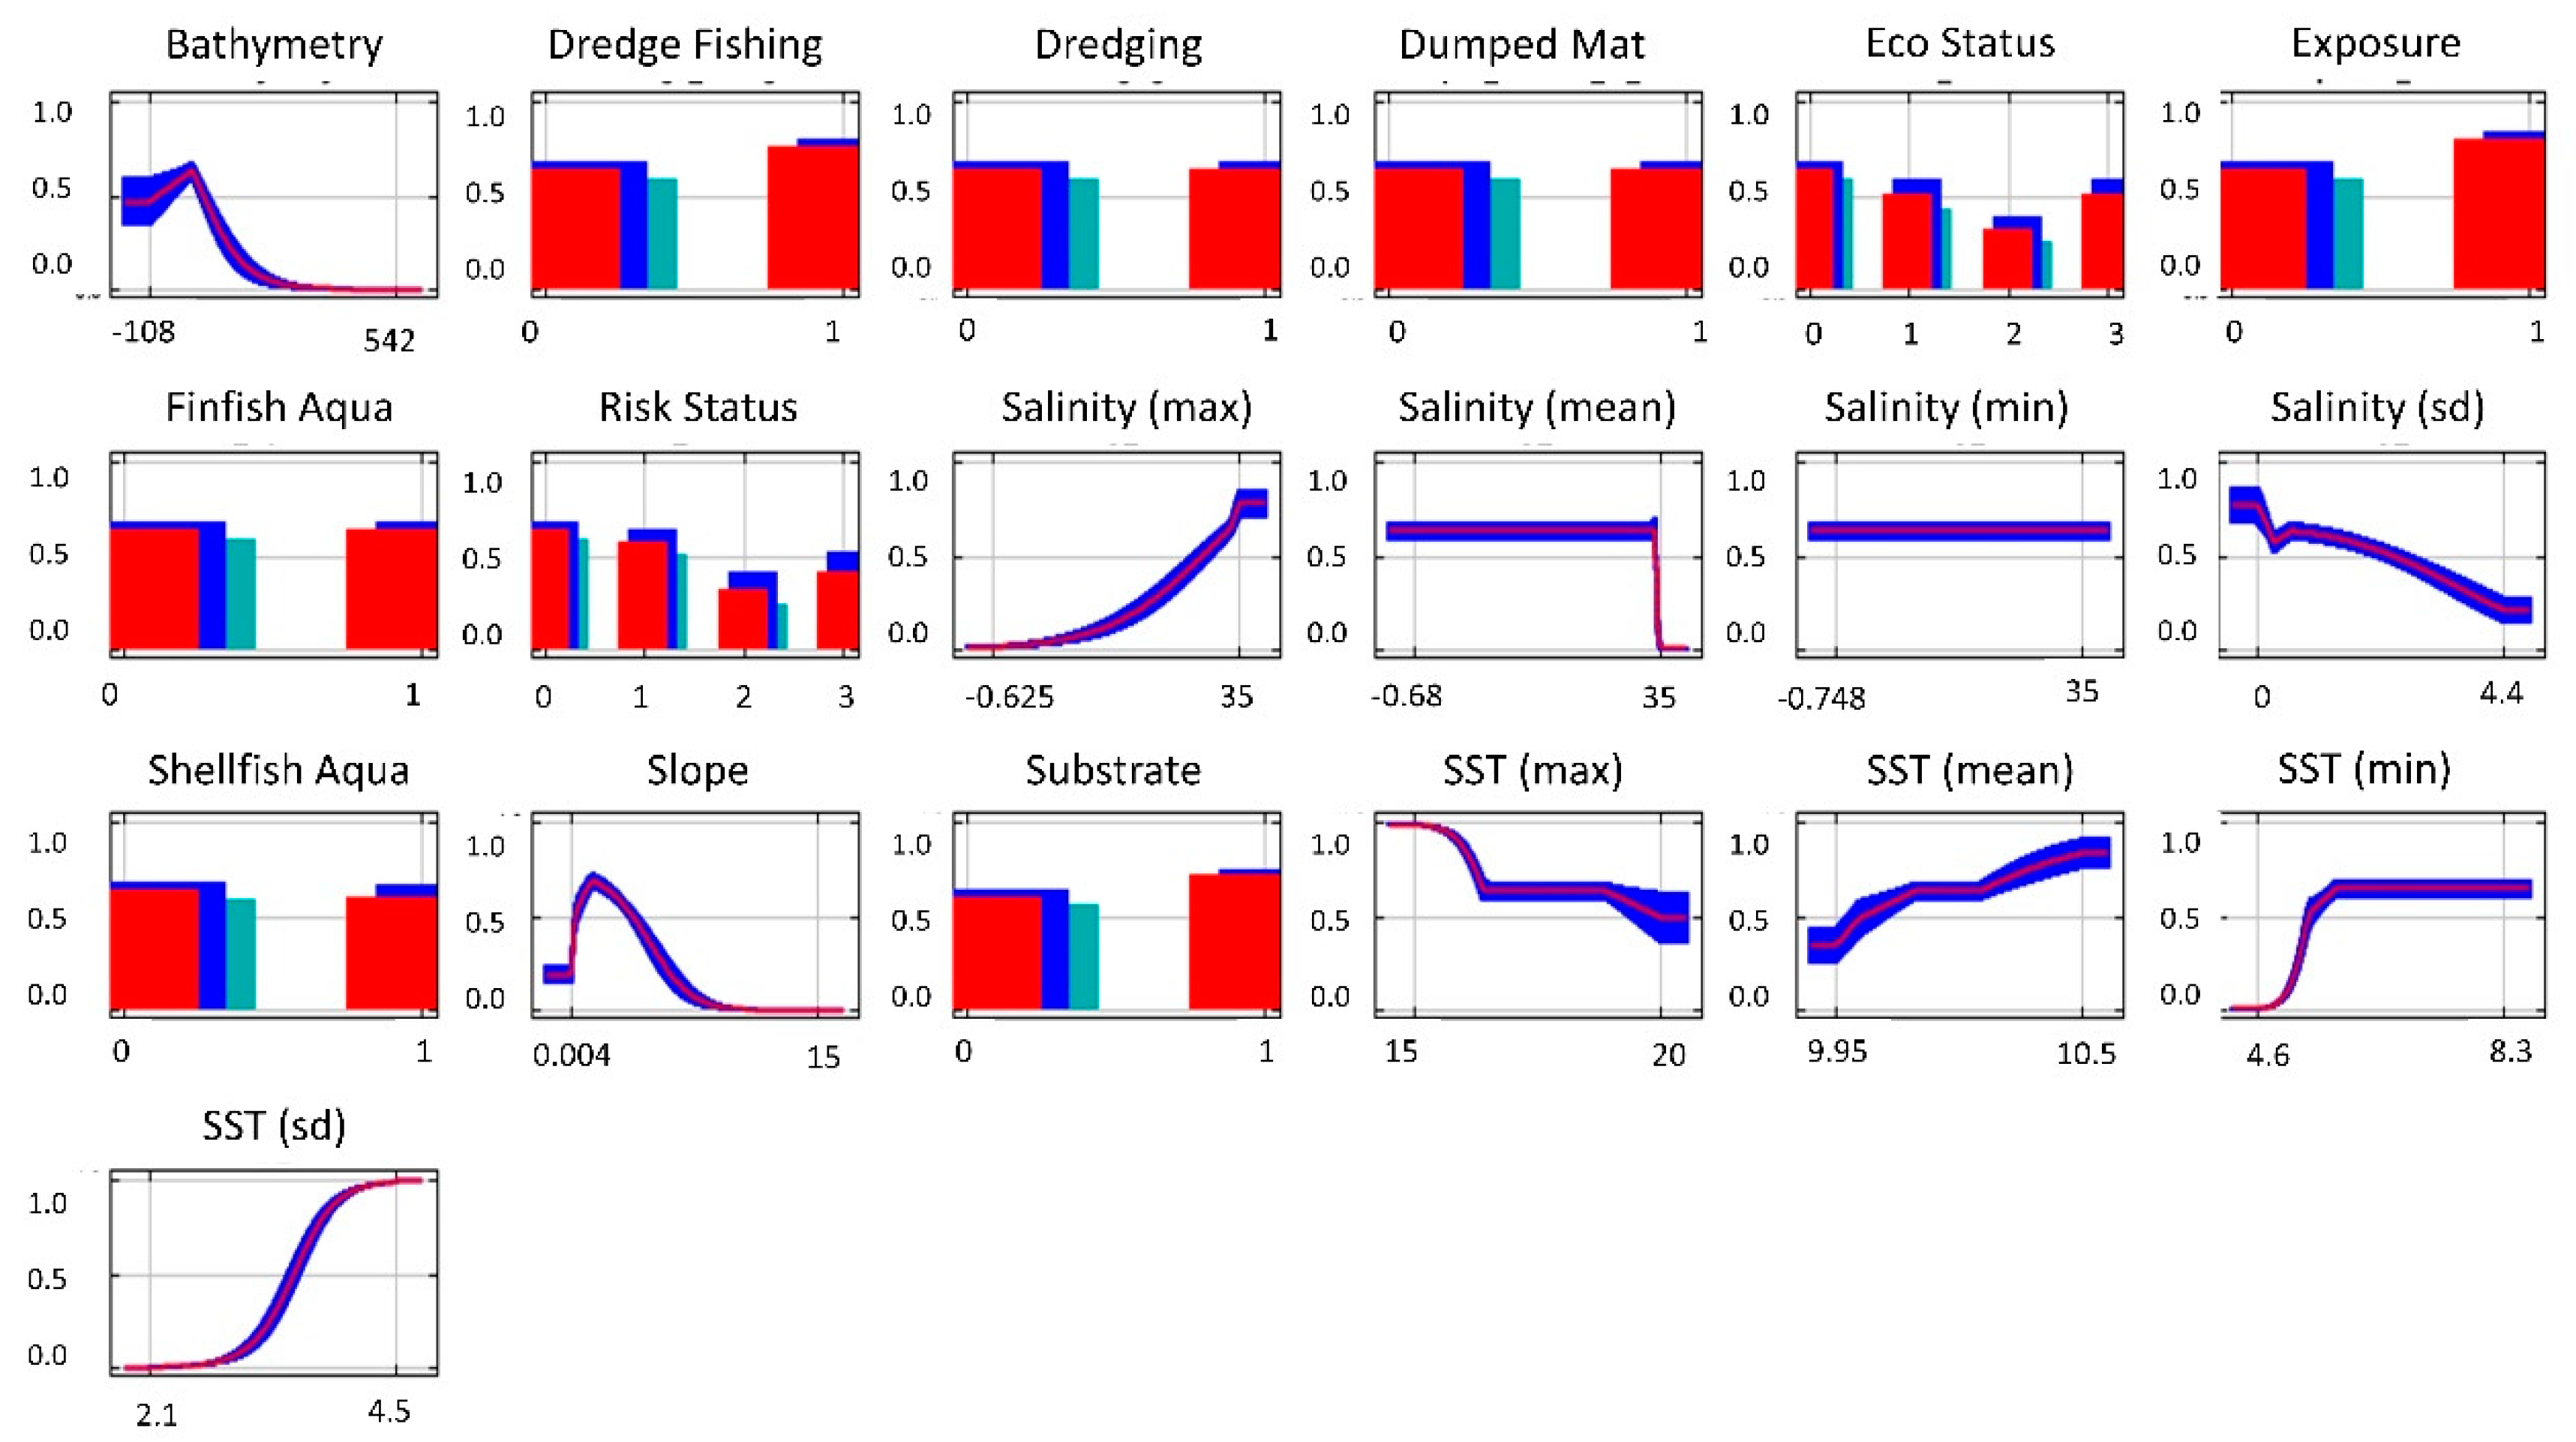
Figure 1. Map of study sites (a) the Republic of Ireland situated within Europe, (b) The Republic of Ireland with locations mentioned in the text documented.
Sustainability 12 08302 g001
Figure 2. Habitat suitability based on physical and anthropogenic variables parameterized using the Maximum Entropy method in the Republic of Ireland for (a) Zostera marina. Threshold values for low suitability are the mean maximum test sensitivity plus specificity of 0.2202. Upper threshold values for Moderate (0.5), High (0.75) and Very High (1). (b) Zostera noltei. Threshold values for low suitability are the mean maximum test sensitivity plus specificity of 0.2624. Upper threshold values for Moderate (0.5), High (0.75) and Very High (1).
Sustainability 12 08302 g002aSustainability 12 08302 g002b
Figure 3. Response curves for Zostera marina from the 10-fold cross-validated model parameterized using the Maximum Entropy method. SST = Sea Surface Temperature.
Sustainability 12 08302 g003
Figure 4. Response curves for Zostera noltei from the 10-fold cross-validated model parameterized using the Maximum Entropy method. SST = Sea Surface Temperature.
Sustainability 12 08302 g004
Table 1. Information on the geospatial environmental layers used in the modelling framework, along with justification for their inclusion and the methodology behind their pre-processing. Acronyms used in the table: Sea Surface Temperature (SST); Water Framework Directive (WFD).
LayerJustificationSpatial Data Pre-ProcessingSource(s)
Bathymetry (Physical)Often implemented as a proxy for light availability [57], which impacts photosynthesisImplemented in downloaded gridded format. Original resolution 15 arc seconds.[58]
SST—Mean, Max, Min, SD (Physical)SST influences phytoplankton and algae growth, which reduces light availability [35]Monthly mean data from 2013 to 2018 combined into a single time-series. Summary statistics then generated. Original gridded resolution, 0.028°[59]
Salinity—Mean, Max, Min, SD (physical)Needed for seagrass, influencing growth and reproduction [46]Monthly mean data from 2013 to 2018 combined into a single time-series. Summary statistics then generated Original gridded resolution, 0.028°[59]
Slope (physical)Slope affects both subtidal currents and the degree of beach aspect influencing substrate and wave forces [34,45]Created from bathymetry layer[58]
Substrate (physical)Sand and mud are preferred substrates for seagrass attachment [15,45]Categorical representation of unfavourable (rock), and favourable (mud, sand, estuaries, sandbanks, inlets, bays, and lagoons).[60,61,62,63]
Exposure (physical)Seagrass requires sheltered locations to prevent disturbance and dislodgement [45]Sheltered and moderately exposed were recorded as ‘sheltered’ and exposed areas were recorded as ‘exposed’. Converted to raster[64,65,66,67]
Dredge Fishing (anthropogenic)Negatively affects seagrass meadows through scaring and smothering [20]Polygons of dredge fishing locations converted into raster[68]
Dredging (anthropogenic)Negatively affects seagrass meadows through scaring and smothering [69]Polygons of European dredging activities converted into raster[70]
Dumped Mat (anthropogenic)Negatively affects seagrass meadows through smothering [69]Polygons of dumping of dredge spoil material at sea converted into raster[71]
Eco Status (anthropogenic)Historical condition of water. Eutrophication can negatively affect seagrass distribution [49]WFD Coastal and Transitional Waterbody Status 2010–2015 for ecological and chemical status of waterbodies. NoData (0), Poor or Bad (1), Moderate (2), Good (3)[64,65,66,67]
Finfish Aqua (anthropogenic)Negatively affects seagrass through increased nutrients [69]Point data of European finfish aquaculture locations converted into raster[72]
Risk Status (anthropogenic)Risk status relating to condition of water. Eutrophication negatively affects seagrass [49]WFD Coastal and Transitional Waterbody Approved Risk 2016–present. NoData (0), Poor or Bad (1), Moderate (2), Good (3)[64,65,66,67]
Shellfish Aqua (anthropogenic)Negatively effects seagrass through increased nutrients [73]Point data of European shellfish aquaculture locations converted into raster[74]
Table 2. Percent contribution and permutation importance (both units %) across the 10-fold cross validated species distribution model for the seagrass species.
Zostera marinaZostera noltei
VariablePercent ContributionPermutation ImportancePercent ContributionPermutation Importance
Bathymetry (physical)39.257.11.61.1
Dredge Fishing (anthropogenic)10.30.62.20.7
Dredging (anthropogenic)0.00.00.00.0
Dumped Mat (anthropogenic)0.00.00.00.0
Eco Status (anthropogenic)10.10.36.23.3
Exposure (physical)8.00.00.90.9
Finfish Aqua (anthropogenic)0.50.10.00.0
Risk Status (anthropogenic)0.70.23.12.8
Salinity (Max) (physical)0.43.90.74.6
Salinity (Mean) (physical)0.31.76.815.8
Salinity (Min) (physical)4.78.41.80.0
Salinity (SD) (physical)2.57.90.80.7
Shellfish Aqua (anthropogenic)0.00.00.00.0
Slope (physical)1.50.07.12.3
SST (Max) (physical)8.18.16.410.5
SST (Mean) (physical)4.12.82.12.0
SST (Min) (physical)3.65.621.28.9
SST (SD) (physical)3.33.038.346.4
Substrate (physical)2.60.20.90.1
Table 3. Estimated distribution of Zostera marina and Zostera noltei projected from the Species Distribution Model (SDM), with areal coverage standardised by the 25th, 50th, and 75th percentiles of the cover on verified data.
Species25th Percentile50th Percentile75th PercentileBeca-Carretero et al. [39]
Zostera marina25.54 km294.34 km2345.33 km2255.21 km2
Zostera noltei14.45 km269.67 km2177.52 km2182.65 km2

