Article

A New Solution for City Distribution to Achieve Environmental Benefits within the Trend of Green Logistics: A Case Study in China

1
School of Modern Post, Beijing University of Posts and Telecommunications, Beijing 100876, China
2
Department of Business Administration, Gomal University, DIKhan 29050, Pakistan
*
Author to whom correspondence should be addressed.
These authors contributed to the work equally and should be regarded as co-first authors.
Sustainability 2020, 12(20), 8312; https://doi.org/10.3390/su12208312
Submission received: 8 September 2020 / Revised: 23 September 2020 / Accepted: 30 September 2020 / Published: 9 October 2020
(This article belongs to the Section Environmental Sustainability and Applications)

Abstract

:
Green logistics has become a consensus and an important method to achieve sustainable development in industrial activities. However, the traditional direct distribution mode has high carbon emissions, an uncertain delivery time, and a low delivery efficiency. Uncoordinated resource allocations and unreasonable network layouts of terminal distributions have shackled green development within the express delivery industry. Considering the trend of green logistics, this study innovatively proposes a comprehensive and environmentally friendly mode for city distribution based on end crowdsourcing service stations (ECSSs). This study also adopts node centrality indices of complex network theory to evaluate the node importance of existing terminal distribution outlets. The comprehensive weights of the indices are obtained via the three-scale AHP (Analytic Hierarchy Process) and TOPSIS (Technology for Order Preference by Similarity to an Ideal Solution) methods to identify the candidate nodes for ECSSs. Finally, a location model is built to determine the optimal location to establish the ECSSs. A real-world case study was conducted to provide the location scheme of ECSSs in Beijing, China. Environmental benefits as well as economic and social benefits can be substantially achieved through the implementation of the new mode. The results show that carbon emissions can be reduced by 23.79–28.49% for the end of the distribution, 16.27–16.35% for the front-end, and approximately 17% for the entire distribution. Additionally, the loading rate of vans for the front-end of the distribution can be improved by 15.77%.

1. Introduction

The express delivery industry has entered a period of high-speed development in China because of the booming development of e-commerce. By March 2020, the number of online shopping users in China reached 710 million, accounting for 78.6% of the total Internet users in China [1]. More than 60% of residents’ logistical demand is produced by transactions from e-commerce [2], and e-commerce cannot work without the support of logistics [3]. The volume of the express delivery business continues to break new records, having exceeded 63.5 billion pieces by 2019 [4], and thereby becoming an important growth point of domestic economic development. Facing the huge volume of express delivery business, the sustainable development of the logistics industry has become a key issue for the government and enterprises.
“Green logistics” refers to carrying out logistical activities in an environmentally friendly manner, which saves resources and protects the environment while the development of logistics and economy can also be realized [5]; the history of this concept dates back to 1990 [6]. Green logistics involves green processes such as transportation, distribution, warehousing, packaging, and resource management [5,7]. Green developments in the logistics industry have been widely driven by the government and express enterprises, and they have been regarded as the new trend of logistics. New and recent trends in green logistics have led to many initiatives on environmental protection and social responsibility [8]. However, there has also been an increase in carbon emissions due to the upgrading of the logistics industry, especially in terminal distribution.
Terminal distribution is critical, owing to its responsibility for the final delivery of logistics activities, but it is the least efficient stage and accounts for 28% of the total delivery cost [9,10,11]. It is well known that “last-mile” distribution is the most polluting, most costly, and least efficient part of city logistics [8,12]. In the logistics industry, carbon emissions caused by logistics mainly focus on road transport [13]. In the process of terminal distribution, carbon emissions caused by logistics mainly focus on the fuel consumption (e.g., gasoline, diesel, and oil) or power consumption of distribution vehicles [14,15,16,17,18,19]. The waste of vehicle resources will greatly affect the green sustainable development within the logistics industry. There are three main factors for this situation: a lack of collaboration among express enterprises [20,21], unreasonable allocation of resources and serious repeated waste caused by small and scattered end outlets [17], and “secondary delivery” caused by the high uncertainty of terminal distribution time [22]. With the rapid development of the express delivery industry in China, competition among express enterprises is fierce, and the terminal distribution problems of express enterprises running their own businesses have become increasingly prominent in the traditional distribution mode. They can have high emissions, serious resource wastes, low delivery efficiency, and an uncertain delivery time [18,23]; these disadvantages have shackled the development of the express logistics industry. Conversely, green logistics has turned into a mainstream trend in industrial development, as it can optimize industrial structures, change the mode of economic development, and promote regional sustainable development [17]. The main modes of domestic terminal distribution are shown in Table 1. Several scholars have noted that the collaborative distribution mode and third-party mode are more conducive to the greener development of city logistics compared with the traditional mode [24,25]. However, because of their own limitations, the other modes of single operation shown in Table 1 cannot meet the actual demand for distribution or citizens’ higher service quality requirements. Therefore, it is urgent to explore a comprehensive new terminal distribution mode.
In this case, new solutions of terminal distribution to improve the overall efficiency, sustainability, and green development of city logistics must be considered, and the enterprises should seek to integrate new distribution modes into existing distribution systems. As an alternative to the traditional mode, crowdsourcing distribution has helped to reduce emissions and transport costs by promoting a better use of currently unused transport capacity and to effectively integrate terminal distribution resources, such as distribution vehicle resources, which represents an opportunity to improve “last-mile” delivery efficiency [26,27]. Crowdsourcing distribution is increasingly popular among enterprises. In China, many crowdsourcing platforms have recently been created, such as Fengniao, Meituan, and so on.
The benefits obtained from crowdsourcing distribution are embodied in three terms: environmental, social, and economic [28]. In environmental terms, cyclists and pedestrians are considered as couriers (the crowd) [29]; thus, the deliveries are made with minimal detours [30]; this approach may also reduce the negative environmental impacts stemming from the use of dedicated express delivery vehicles, such as carbon emissions and congestion [31,32]. In social terms, the crowdsourcing platform will automatically and reasonably push the order to the appropriate nearby couriers; thus, the express packages can be delivered accurately and efficiently, and “secondary delivery” will be effectively reduced. In economic terms, as one of the collaborative modes [33], crowdsourcing exploits a new spirit of collaboration and outsources delivery services to citizens (the crowd) so economic benefits for all parties involved can be achieved [10,34]. In summary, the crowdsourcing distribution mode can achieve green resource management, and it is conducive to the green development of city logistics.
To address the problems of uncoordinated resource allocation and unreasonable network layouts of terminal distribution within the new trend of green logistics, this study proposes a new environmentally friendly mode after analyzing the characteristics of the main existing modes. It also proposes a new concept of the end crowdsourcing service station (ECSS), which provides end delivery services for enterprises. Then, based on the theory of complex networks, this study evaluates the node importance of the existing terminal distribution outlets of express enterprises using node centrality indices to identify the candidate nodes for the establishment of ECSSs. We use the three-scale AHP (Analytic Hierarchy Process) and TOPSIS (Technology for Order Preference by Similarity to an Ideal Solution) methods to obtain comprehensive and objective weights of the indices. Next, we build a location model to determine the optimal locations of ECSSs. This study has certain reference value for governmental officials, express enterprises, and third-party agents to formulate policies and develop greener city terminal distribution.
The remainder of this paper is organized as follows. In Section 2, we conduct a comprehensive literature review on green logistics and the previous location method for distribution centers. Next, we describe the advantages and limitations of the main modes of domestic terminal distribution and propose a new terminal distribution mode in Section 3. In Section 4, we describe the methods adopted in this study to evaluate node importance in the end network and the location model of ECSSs. The empirical study and results of the new mode are discussed in Section 5. Finally, in Section 6, we conclude with a discussion, describe the limitations of this study, and suggest the directions of future study.

2. Literature Review

Green logistics has become a mainstream trend of the logistics industry and affect the sustainable development China. Achieving green logistics and reducing greenhouse gas emissions have become important current issues confronting the current government and others [35]. Green development is the trend in the future; the objective of green logistics matches the development direction of logistics enterprises and is essential to long-term survival of enterprises [5]. In the planning and decision of logistics distribution systems and activity, the scheme with as little environmental pollution as possible should be adopted by modern Chinese enterprises, such as collaborative distribution and cooperation with a third-party logistics enterprise [36]. As environmental problems have become a focal point worldwide, it is necessary to perform specific studies on green logistics activities. Enterprises in China are currently engaged in these activities, including final distribution logistics [36,37]. Green logistics activities include measuring the impact of different delivery strategies on the environment [38], as they have an important impact on the environment and logistics decisions in the value chain. Considering the current trend of green logistics, this study aims to explore a new mode by drawing on the previous experience of different modes to achieve a more sustainable development for terminal distribution. There is an extensive number of studies considering factors of green logistics to achieve sustainable terminal distribution.
As has been described in the introduction, crowdsourcing distribution is in accordance with the development trend of green logistics. Many scholars have proposed that the terminal distribution can be optimized by crowdsourcing, which is one of the collaborative distribution modes. First, based on a crowdsourcing trial for library deliveries, Paloheimo et al. [30] found that each delivery reduced an average of 1.6 kilometers driven by cars. Wang et al. [39] proposed a large-scale mobile crowd-tasking model that is effective and eco-friendly and uses citizen workers to perform the terminal distribution to ensure that few vehicles are needed, thereby contributing to lower carbon emissions. Considering Just-In-Time delivery, Lee et al. [40] developed an integrated decision-making framework for green crowdsourced parcel services, and their results showed that fuel and emission costs could be reduced by 2.5%. Devari et al. [10] innovatively exploited a new mode of crowdsourcing last-mile delivery that relies on friendship/acquaintance networks and that can ensure less polluting, less costly, and more punctual delivery. Kafle et al. [29] proposed a crowdsource-enabled system for city express package relays and deliveries in which cyclists and pedestrians are regarded as crowdsources who undertake jobs for the last-mile delivery, and total emissions and costs could be reduced compared to pure truck delivery.
In addition to the crowdsourcing distribution mode, other modes, such as the express cabinet, can also be conducive to green and efficient developments in city terminal distribution. Compared with the traditional distribution mode, the intelligent express cabinet has been gradually advocated for city terminal distribution, owing to the improvement of delivery flexibility as well as reductions in delivery failures and operation costs [12]; the authors focused on a green multi-objective express cabinet assignment considering energy consumption and total costs. Deutsch and Golany [22] stated that pickup points may importantly reduce greenhouse gas emissions and designed an express cabinet network as a solution to the terminal distribution.
Prior studies have primarily demonstrated that collaborations between express enterprises and crowdsourcing distribution have important effects on achieving development of green logistics and improving efficiency. However, prior scholars mainly optimized the network from the perspectives of personnel scheduling and route optimization of crowdsourcing distribution, with few scholars focusing on the perspective of express enterprise alliances. Additionally, few scholars have combined crowdsourcing with other modes, such as the express cabinet, to promote the sustainable development of terminal distribution. This study proposes a new comprehensive mode for terminal distribution after analyzing the characteristics of the main existing modes and then optimizing the end network based on the new mode to achieve a more green, punctual, and efficient development of city logistics.
Varieties of methods have been used to determine the locations of city logistics facilities, and many scholars have built mathematical models to determine the optimal locations. In this study, we adopt the theory of complex networks and mathematical models to make our location decision.
Many scholars have applied the theory of complex networks to study logistics distribution networks. Yang et al. [41] innovatively applied the theory of complex networks to the research of express transportation networks, analyzed the topological properties of express delivery networks, and clarified that these networks had “small-world” characteristics. Conde et al. [42] presented mathematical models for express package deliveries in logistic networks based on a spectral analysis of complex network theory. According to Wu and Ma [43], the logistics system can be abstracted as a complex network that is composed of logistics nodes and transportation routes. They applied the theory of complex networks to analyze a province’s logistics network, and the results showed that the theory has small-world and scale-free properties; this indicated that it is feasible to adopt the theory of complex networks as a research method to establish logistics models and analyze the important logistics nodes. Zhao et al. [44] constructed a metro-integrated logistics system and evaluated the importance of each station using the theory of complex networks, AHP method, and TOPSIS method to determine the candidate metro distribution hubs. Following a crowdsourcing approach, Giret et al. [28] proposed that the citizens can become temporary deliverers based on their own needs and optimized a sustainable last mile delivery route to the crowd based on the complex network theory.
Prior scholars have mainly focused on the analysis and evaluation of the characteristics of the current logistics networks by the complex network theory, and most have focused on the network of a single logistics enterprise or supply chain. However, few scholars have adopted the complex network theory in an end logistics network to determine the optimal locations of logistics facilities, and there is a lack of research on networks of multiple enterprises. In this study, we use node centrality indices from the complex network theory and build mathematical models to determine the optimal locations of ECSSs, which are then established by an express enterprise alliance or a third-party agent in our proposed end network.

3. Proposal of New Distribution Mode

Considering the trend of green logistics, we propose a new collaborative mode for areas with serious waste of resources to address the problems of terminal distribution, promote the collaborative and sustainable development, and amalgamate the delivery demands of several express enterprises. Referring to the characteristics, advantages, and limitations of the four main modes listed in Table 1, we propose a new collaborative mode based on end crowdsourcing service stations (ECSSs). In the new mode, we set to be ECSSs operated by express enterprises or an alliance between these enterprises and a third-party agent; this provides unified terminal distribution for enterprises, and intelligent express cabinets are set to relieve the pressure of terminal distribution. We believe that most of the existing distribution outlets (DOs) will be replaced by ECSSs. There is no need for the enterprises to deliver their express packages to their own DOs, but to the ECSSs. Some of the express packages will be delivered to the end points (EPs), and some will be delivered to intelligent express cabinets (IECs) by crowdsourcing couriers who are part-timers, professional couriers grouped by the third-party agent, or couriers from the express enterprises. The end customers can then pick up the express deliveries in the IECs according to their own schedules. The workflow change for the express distribution under a crowdsourcing distribution can be seen in Figure 1. The terminal distribution network can obviously be simplified, and workflows of the distribution can be reduced.

4. Model Development

4.1. Node Importance Evaluation within the Trend of Green Logistics

4.1.1. Node Importance Indices

The city express distribution network is a scale-free complex network because of its complexity, growth, and priority connectivity. Green logistics puts forward new requirements for distribution planning and process optimization of complex logistics networks [45]. The choice of distribution mode and vehicle types can substantially affect carbon emissions. Thus, it is urgent to improve the traditional mode of planning logistics operations. Under the new mode of city terminal distribution proposed in this study, the entities of the end network are outlets such as ECSSs, IECs, EPs, and the routes generated by the connections of these outlets. Since the end IECs and EPs rely on ECSSs to provide services, the locations of ECSSs determine the delivery efficiency and total carbon emissions of the entire network.
This study evaluates the node importance of the existing end DOs of express enterprises using node centrality indices from the complex network theory to identify the candidate nodes for establishing ECSSs. In this study, we choose degree centrality, closeness centrality, betweenness centrality, and improved K-shell centrality to evaluate the node importance of end DOs. The end DOs, end IECs, and EPs are all considered the nodes of the network, and the number of nodes is assumed to be N.
(1) Degree centrality (DC)
Degree centrality describes the relationship between a node and other nodes in the network. The larger the value is, the more important the node is. The degree centrality is defined as the ratio of the actual degree of node i ( T i , which represents the number of edges connected to node i in the terminal distribution network) to the possible maximum degree in the entire terminal distribution network; then:
D C i = T i N 1
(2) Closeness centrality (CC)
Closeness centrality describes how close the node is to the center of the network. In the terminal distribution network, end DOs can provide self-service for end customers through IECs to meet their contactless distribution needs and relieve the distribution pressure of DOs. Therefore, the shorter the sum of the distance between a node and other IECs and EPs is in the end network, the shorter the route that the distribution vehicles pass through is, the lower the carbon emissions generated by vehicles are, and the more important the node is. The closeness centrality of node i ( C C i ) is defined as the reciprocal of the total distance along the shortest paths from node i to all the other nodes of IECs and EPs.   d i j shows the shortest distance from node i (which represents DOs) to node j (which represents IECs and EPs); then:
C C i = N 1 j = 1 N d i j
(3) Betweenness centrality (BC)
Betweenness centrality describes the frequency of node i as an intermediate node between two other nodes [46]. In the end network, the higher the frequency of a node as an intermediate node in the connection of other nodes, the more likely the distribution will pass through the node, and the more suitable the node is to serve as the hub of terminal distribution for green delivery, i.e., the ECSS. If n j m ( i ) is the total number of shortest paths from node j to node m (j and m represent IECs and EPs), in which n j m ( i ) is the number of shortest paths that pass through node i (which represents DOs), then:
B C i = i j m N n j m ( i ) n j m × 2 ( N 1 ) ( N 2 )
(4) Improved K-shell centrality (IKC)
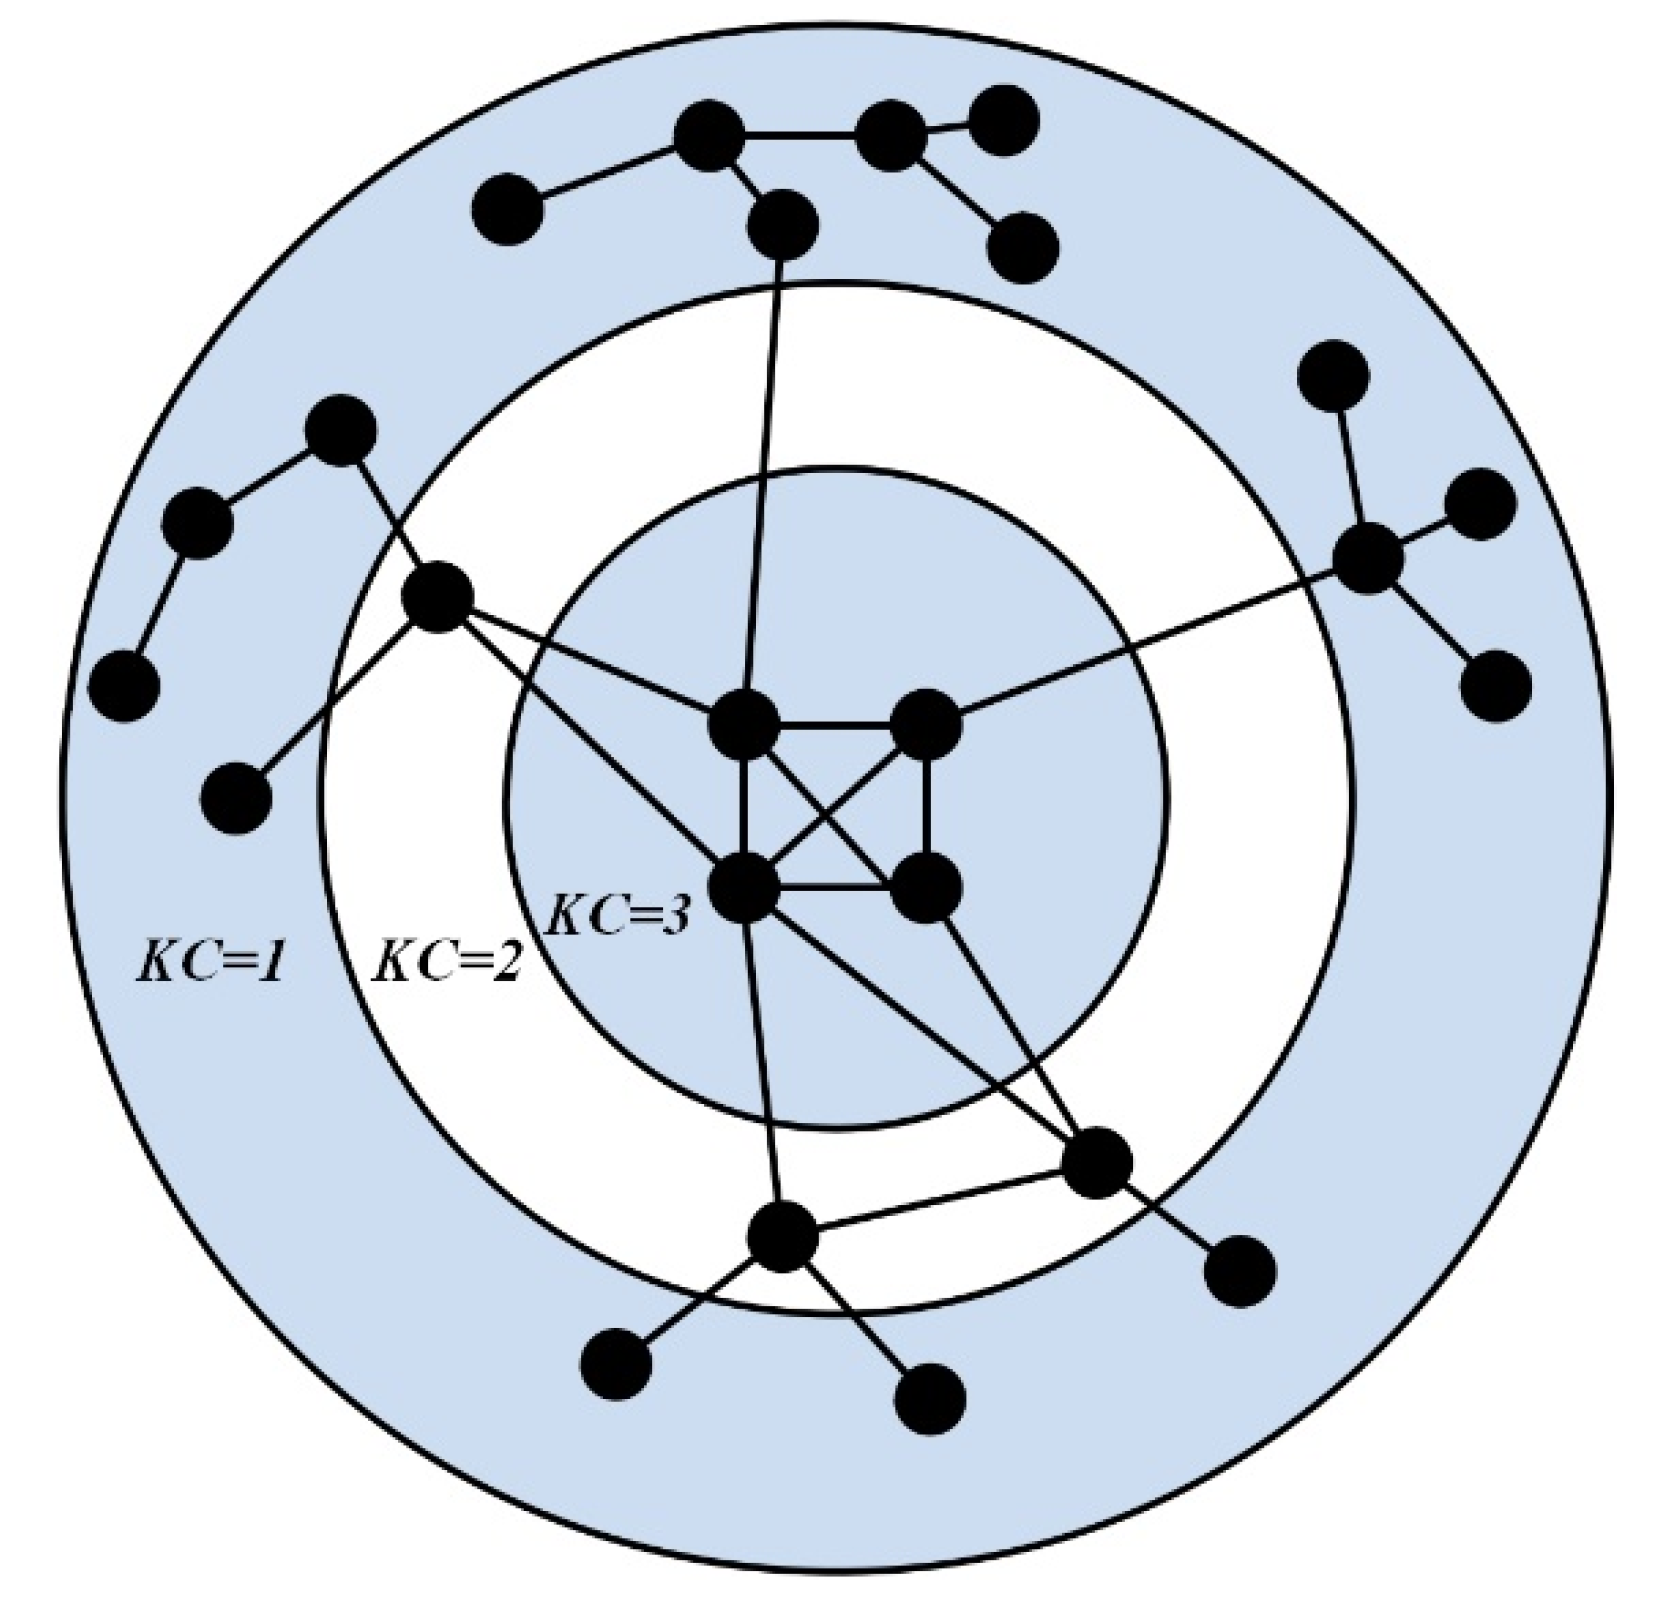
K-shell centrality finds core nodes with a greater influence in the network through a similar process of stripping. K-shell decomposition removes the nodes with degrees less than or equal to k recursively, and the removed nodes obtain their K-shell centrality (KC) values concurrently [47,48,49]. As shown in Figure 2, the process of decomposition is to first delete the nodes with a degree of 1 and their connections in the network W 0 . Then, the degree of some remaining nodes may become 1, and these nodes should be removed until there are no nodes with a degree of 1 in the network. The KC values of these deleted nodes are defined as KC = 1, and then a sub-network W 1 is obtained. Next, we delete the nodes with degree 2 and define the KC value as 2. The above steps are repeated until all nodes in the network are deleted.
However, according to Liu et al. [49], an improved K-shell decomposition contributes to distinguishing the local characteristic differences between nodes more accurately. As shown in Figure 3, the process of decomposition is to first delete the nodes with the minimum degree and their connections in the network W 0 , the value of these removed nodes is defined as I K C 1 = 1, and then a sub-network W 1 is obtained. Then, similarly, we delete the nodes with the minimum degree in W 1 and define their value as I K C 2  =  I K C 1 +1. The above steps are repeated until all nodes are deleted. The larger the value of I K C i is, the more suitable it is to establish the ECSS at node i.

4.1.2. Weights for the Indices

After the importance node indices have been determined as above, each index must be weighted to reflect the importance of different indices. When assessing the improvement areas for implementing green logistics, it is crucial to identify how important one index is over another [50]. In the process of evaluating the importance of the four indices (DC, CC, BC, and IKC), this study focuses on the contribution of each index to the green development of the distribution network. According to the theory of complex networks, CC and BC both reflect the relationships among the nodes. The ECSS provides distribution services for all EPs within the distribution range. The shorter the total distribution distance is, the higher the value of CC is, and the lower the carbon emissions are. Therefore, CC is the most important index. BC reflects the transfer convenience of the node. The higher the value of BC is, the more convenient it is for green delivery. Therefore, BC is the second most important element. In the local centrality measurement, DC and IKC both reflect local information characteristics of nodes and the relationship between a node and other nodes. Thus, DC and IKC are equally important.
The AHP (Analytic Hierarchy Process) is widely used in evaluating index weights, and the nine-scale method was originally adopted with the advantages of simplicity and audio-visual capabilities [51]. However, it is occasionally difficult for experts to maintain a standard scale when it is used for expert consultations, and their judgments often cannot meet consistency checks [52]. The three-scale method omits the consistency test, and it is easy to make judgments in evaluating the importance of indices, as the accuracy can meet the calculation requirements [53]. Therefore, this study adopts the three-scale AHP method to subjectively evaluate the four indices of DC, CC, BC, and IKC. The steps are as follows:
(1) Construct the initial judgment matrix K of the indices and calculate the importance ranking index r i [54]. k i j is defined as the comparison value of importance between index i and index j. To verify the comparison results of the importance of the four indices, we invited 10 experts in the area of logistics to evaluate the indices, and the results as shown in Table 2.
K = [ k 11 k 14 k 41 k 44 ]
K = ( k i j ) = {   2           index   i   is   more   important   than   index   j 1                               index   i   is   as   important   as   index   j   0           index   j   is   more   important   than   index   i
r i = j = 1 4 k i j
(2) Construct the judgment matrix A. Here, A = ( a i j ) 4 × 4 is a consistent judgment matrix. a i j is defined as the ratio of the importance of index i to the importance of index j. According to Zhao et al. [44], we use the extreme method to suppose the transformation criterion in Equation (8), and a r denotes the given relative importance of range element pairs, which is given in advance as a value of a r = 9 in terms of the corresponding criterion based on a certain standard [44,49,52]. R = r m a x r m i n represents the extreme range, where r m a x = max ( r 1 , r 2 , r 3 , r 4 ) = 7 and r m i n = min ( r 1 , r 2 , r 3 , r 4 ) = 2 ; thus, R = 5. Then, we get the judgment matrix A, shown in Equation (12), by operating the basic steps of the AHP method from Equations (9) to (11).
A = [ a 11 a 14 a 41 a 44 ]
a i j = a r r i r j R   ( i ,   j   =   1 ,   2 ,   3 ,   4 )
M i = j = 1 4 a i j
w i = M i 4
w i ¯ = w i i = 1 4 w i
The judgment matrix A is:
A = ( a i j ) = D C                   C C                   B C               I K C D C C C B C I K C [ 1                 0.1111 9 1 0.2676 1 2.4082 9 3.7372 0.4152   1             0.1111 1 3.7372     0.2676 1 ]
M i = ( M 1 ,   M 2 , M 3 , M 4 ) T = ( 0.0297 ,   195.0662 , 5.7995 , 0.0297 ) T
w i = ( w 1 ,   w 2 , w 3 , w 4 ) T = ( 0.4152 ,   3 , 7372 , 1.5518 ,   0.4152 ) T
The subjective weight vector of the four indices is:
W ¯ T = w i ¯ T = ( w 1 ¯ ,   w 2 ¯ , w 3 ¯ , w 4 ¯ ) T = ( w D C ¯ ,   w C C ¯ , w B C ¯ , w I K C ¯ ) T =   ( 0.0679 ,   0.6107 ,   0.2536 ,   0.0679 ) T
(3) Consistency test
P represents a partial matrix of A that contains the four columns of A; then:
P = ( p i ) 4 × 1 = A × w i ¯ = ( 0.2715 ,   2.4436 ,   1.0147 ,   0.2715 )
The largest eigenvalue is:
λ m a x = i = 1 4 p i 4 w i ¯ = 4
P C . I . = λ m a x 4 4 1 = 0 ε ( ε = 0.001 )
Equation (18) reflects that the weight coefficients of the indices satisfy the constraints of the consistency test, which are W ¯ T =   ( 0.0679 ,   0.6107 ,   0.2536 ,   0.0679 ) T .
Because the three-scale AHP method is based on a subjective evaluation to determine the weights of indices, this study combines it with TOPSIS (Technology for Order Preference by Similarity to an Ideal Solution) to obtain more comprehensive and objective weights of node importance indices [55]. The TOPSIS method is typically used to support decision-making in multi-decision projects. TOPSIS’s basic idea is to judge the candidates by the distance from their value to the positive ideal solution and the negative ideal solution. The candidate that is geometrically closest to the positive ideal solution and farthest from the negative ideal solution is regarded as the optimal solution, and in the converse situation, the candidate is regarded as the worst solution. In this study, the relevant steps are as follows:
(1) Construct the initial judgment matrix Q. There are S nodes in the end network that must be evaluated, and their set is defined as X = { x 1 , x 2 , x 3 , , x S } . M indices are adopted to evaluate the node importance of S nodes, and their set is defined as R = { r 1 , r 2 , r 3 , , r m } . Thus x s ( r m ) represents the m-th importance index for s-th node (s = 1, 2, …, S; m = 1, 2, …, M).
Q = [ x 1 ( r 1 ) x 1 ( r m ) x S ( r 1 ) x S ( r m ) ]
(2) Standardize the judgment matrix. y s m represents the m-th element of the s-th row; then:
y s m = x s ( r m ) max { x s ( r m ) | 1 s S }
(3) Construct the standardized weighting judgment matrix H. We use the three-scale AHP method to obtain the subjective weights, i.e., W ¯ T = ( w 1 ¯ ,   w 2 ¯ , w 3 ¯ , w 4 ¯ ) T =   ( 0.0679 ,   0.6107 ,   0.2536 ,   0.0679 ) T . W m ¯   is the m-th weighting factor for the node importance (m =1, 2, 3, 4; m = 1 4 W m ¯ = 1 ), and the weighting standardized judgment matrix H is defined as follows:
H = h s m = [ y 11 ( W 1 ¯ ) y 12 ( W 2 ¯ ) y 21 ( W 1 ¯ ) y 21 ( W 2 ¯ ) y 1 m ( W m ¯ ) y 2 m ( W m ¯ ) y s 1 ( W 1 ¯ ) y s 1 ( W 1 ¯ ) y s m ( W m ¯ ) ]
(4) The positive ideal solution F + and the negative solution F re defined based on matrix H as follows:
F + = { max { h s 1 } , , max { h s m } } = { h 1 + , h 2 + , , h m + }
F = { min { h s 1 } , , min { h s m } } = { h 1 , h 2 , , h m }
We calculate the distance between the positive ideal solution F +   and the negative solution F based on the Euclidean Distance [56,57]; then:
D s + = m = 1 4 ( h s m h m + ) 2
D s = m = 1 4 ( h s m h m ) 2
(5) The importance of node s is defined as C s * ; then:
C s * = D s D s + + D s , s = 1 , 2 , 3 , 4
The higher the C s *   is, the farther away the node s is from the negative ideal solution. Conversely, the lower the C s * is, the farther away the node s is from the positive ideal solution. If C s * = 0, then F s = F , thus, the node is the least important. If C s * = 1, then F s = F + , thus, the node is the most important. In summary, C s * can be used to comprehensively evaluate the importance of nodes for terminal distribution in the end network, and we can use C s * to obtain the candidate nodes of the ECSSs.

4.2. Location Model for ECSSs

The location problem of city logistics facilities is the basis of network planning; the important nodes and the basic topology of the entire logistics network can be determined [58]. Road traffic contributes the most to carbon emissions of the transport sector, and has become one of the main targets of sustainable development policy [19]. Thus, this study builds the location model for ECSSs based on the minimum distance of distribution. We assume that n nodes are identified as candidate nodes after evaluating the node importance of the existing end DOs of express enterprises using node centrality indices from the theory of complex networks. Then, we build a location model to determine the first r optimal locations from n nodes to establish the ECSSs.
(1)
Assumptions
Based on the distribution process of the new mode of city terminal distribution in this study, we make the following several assumptions in order to simplify the complexity of problem analysis.
i.
The capacity of each candidate DO can serve the delivery demands of EPs.
ii.
Each IEC will be fully occupied, and there is no extra space for more express deliveries.
iii.
All the express deliveries in each IEC will be picked up by the end customers on the same day.
iv.
The delivery demand of each EP is evenly satisfied by each express enterprise.
v.
If an IEC serves w EPs, the IEC provides 1/w of the capacity for each EP.
vi.
The delivery efficiency of all the couriers in the end network is the same.
vii.
Each EP and IEC should be served by only one ECSS in the end crowdsourcing distribution network.
(2)
Indices and parameters
  • i is the index for end DOs, i I
  • j is the index for end EPs, j J
  • k is the index for end IECs, k K
  • n is the number of DOs
  • m is the number of EPs
  • p is the number of IECs
  • q j is the average daily delivery demand of EP j
  • t j is the number of IECs serving EP j
  • g k is the number EPs served by IEC k
  • d i j is the distance from DO i to EP j
  • d i k is the distance from DO i to IEC k
  • h k j is the distribution relationship between IEC k and EP j
  • Q is the capacity of IECs
  • D is the maximum delivery quantity the courier can handle from DOs to EPs in a batch
  • z is the number of DOs selected to be ECSSs by decision maker
(3)
Decisions variables
  • x i : 1 if DO i is selected to be ECSS; 0 otherwise
  • y i j : 1 if EP j is served by DO i; 0 otherwise
  • z i k : 1 if IEC k is served by DO i; 0 otherwise
(4)
Objective function
The objective function of the location model for ECSSs is based on the minimum distance of distribution, given as follows:
m i n i = 1 N j = 1 M k = 1 P x i { d i j y i j [ q j t j g k h k j Q D ] + d i k z i k [ Q D ] }
Objective function (27) is designed to minimize the total distance of the entire terminal distribution network, including the distance from DOs to EPs and distance from DOs to IECs. The distance from EPs to IECs is not considered because there is no need for the couriers to deliver, as the customers will pick up the packages themselves.
(5)
Constraints
i = 1 N x i = z
i = 1 N y i j = 1 , j
y i j x i ,   i , j
i = 1 N z i k = 1 , k
z i k x i ,   i , k
x i { 0 , 1 }   , i
y i j { 0 , 1 }   , i , j
z i k { 0 , 1 }   , i , k
Constraint (28) indicates that r DOs will be selected as ECSSs. Constraints (29) and (30) indicate that each EP and IEC must be served by only one ECSS. Constraints (31) and (32) guarantee that if EP j or IEC k are served by DO i, then DO i must be selected as an ECSS. Constraints (33), (34), and (35) define the binary decision variable.

5. Empirical Study

5.1. Background and Data

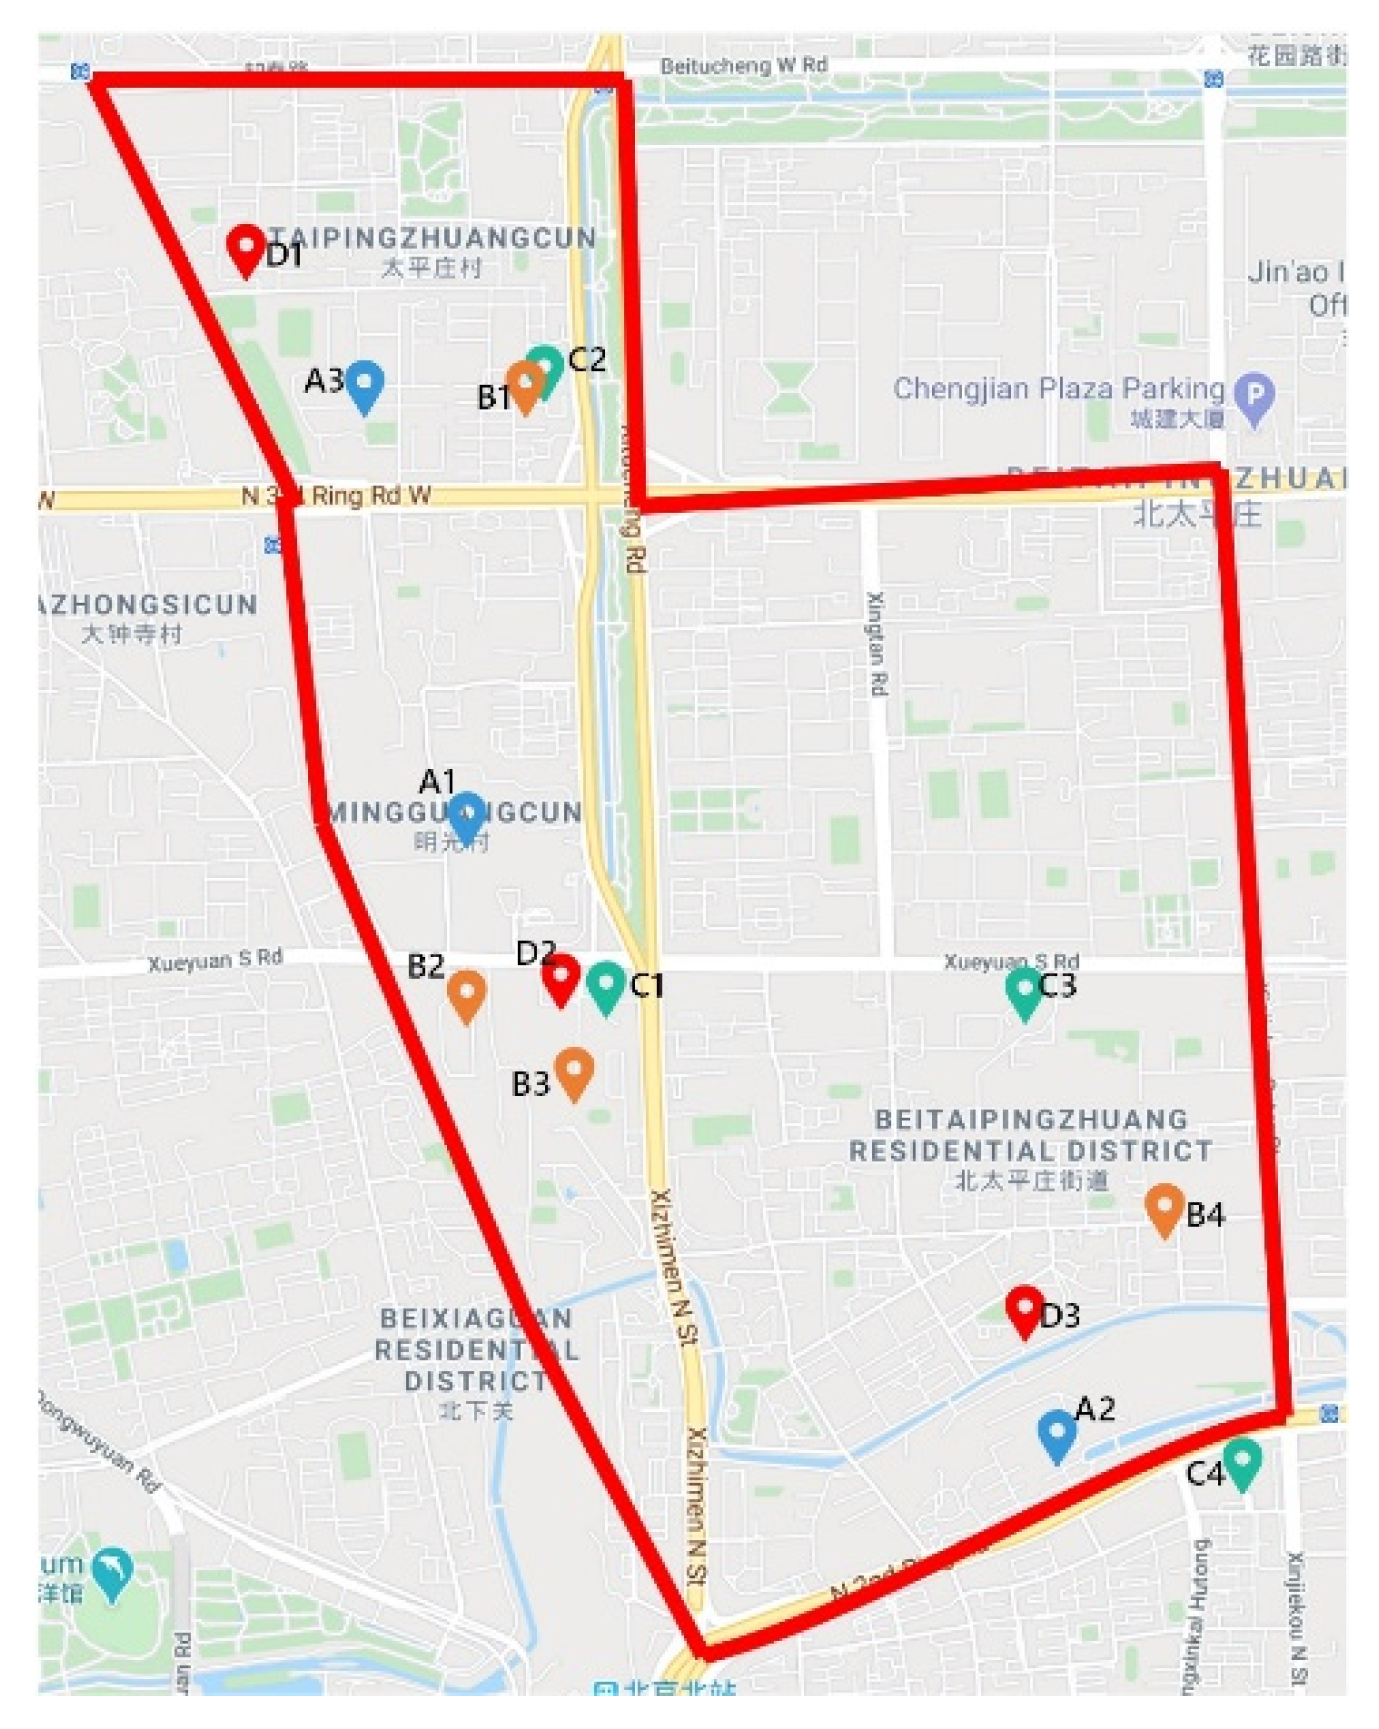
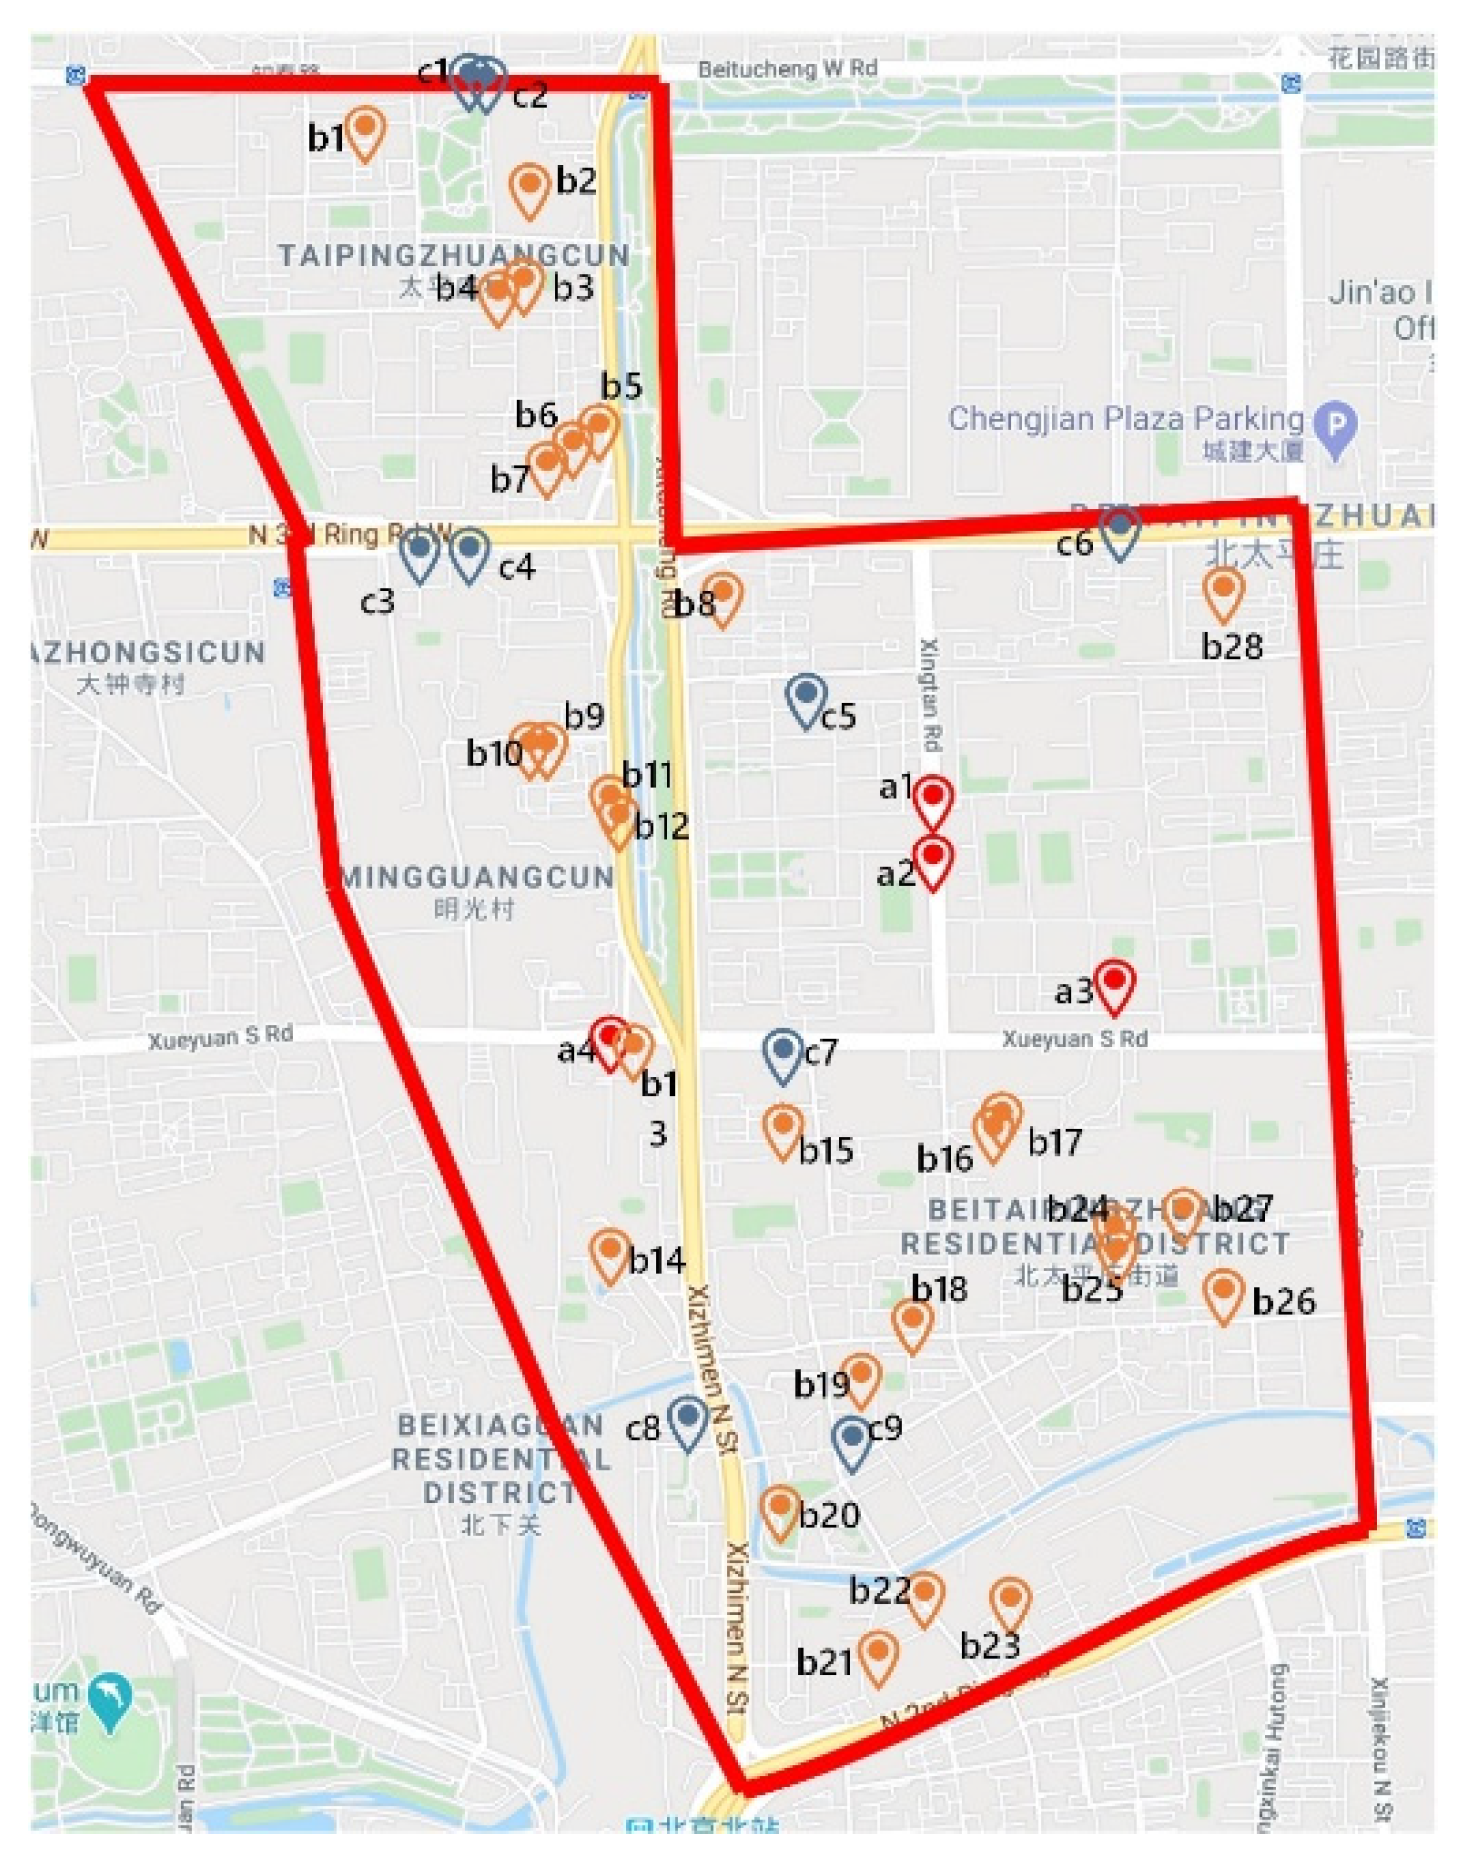
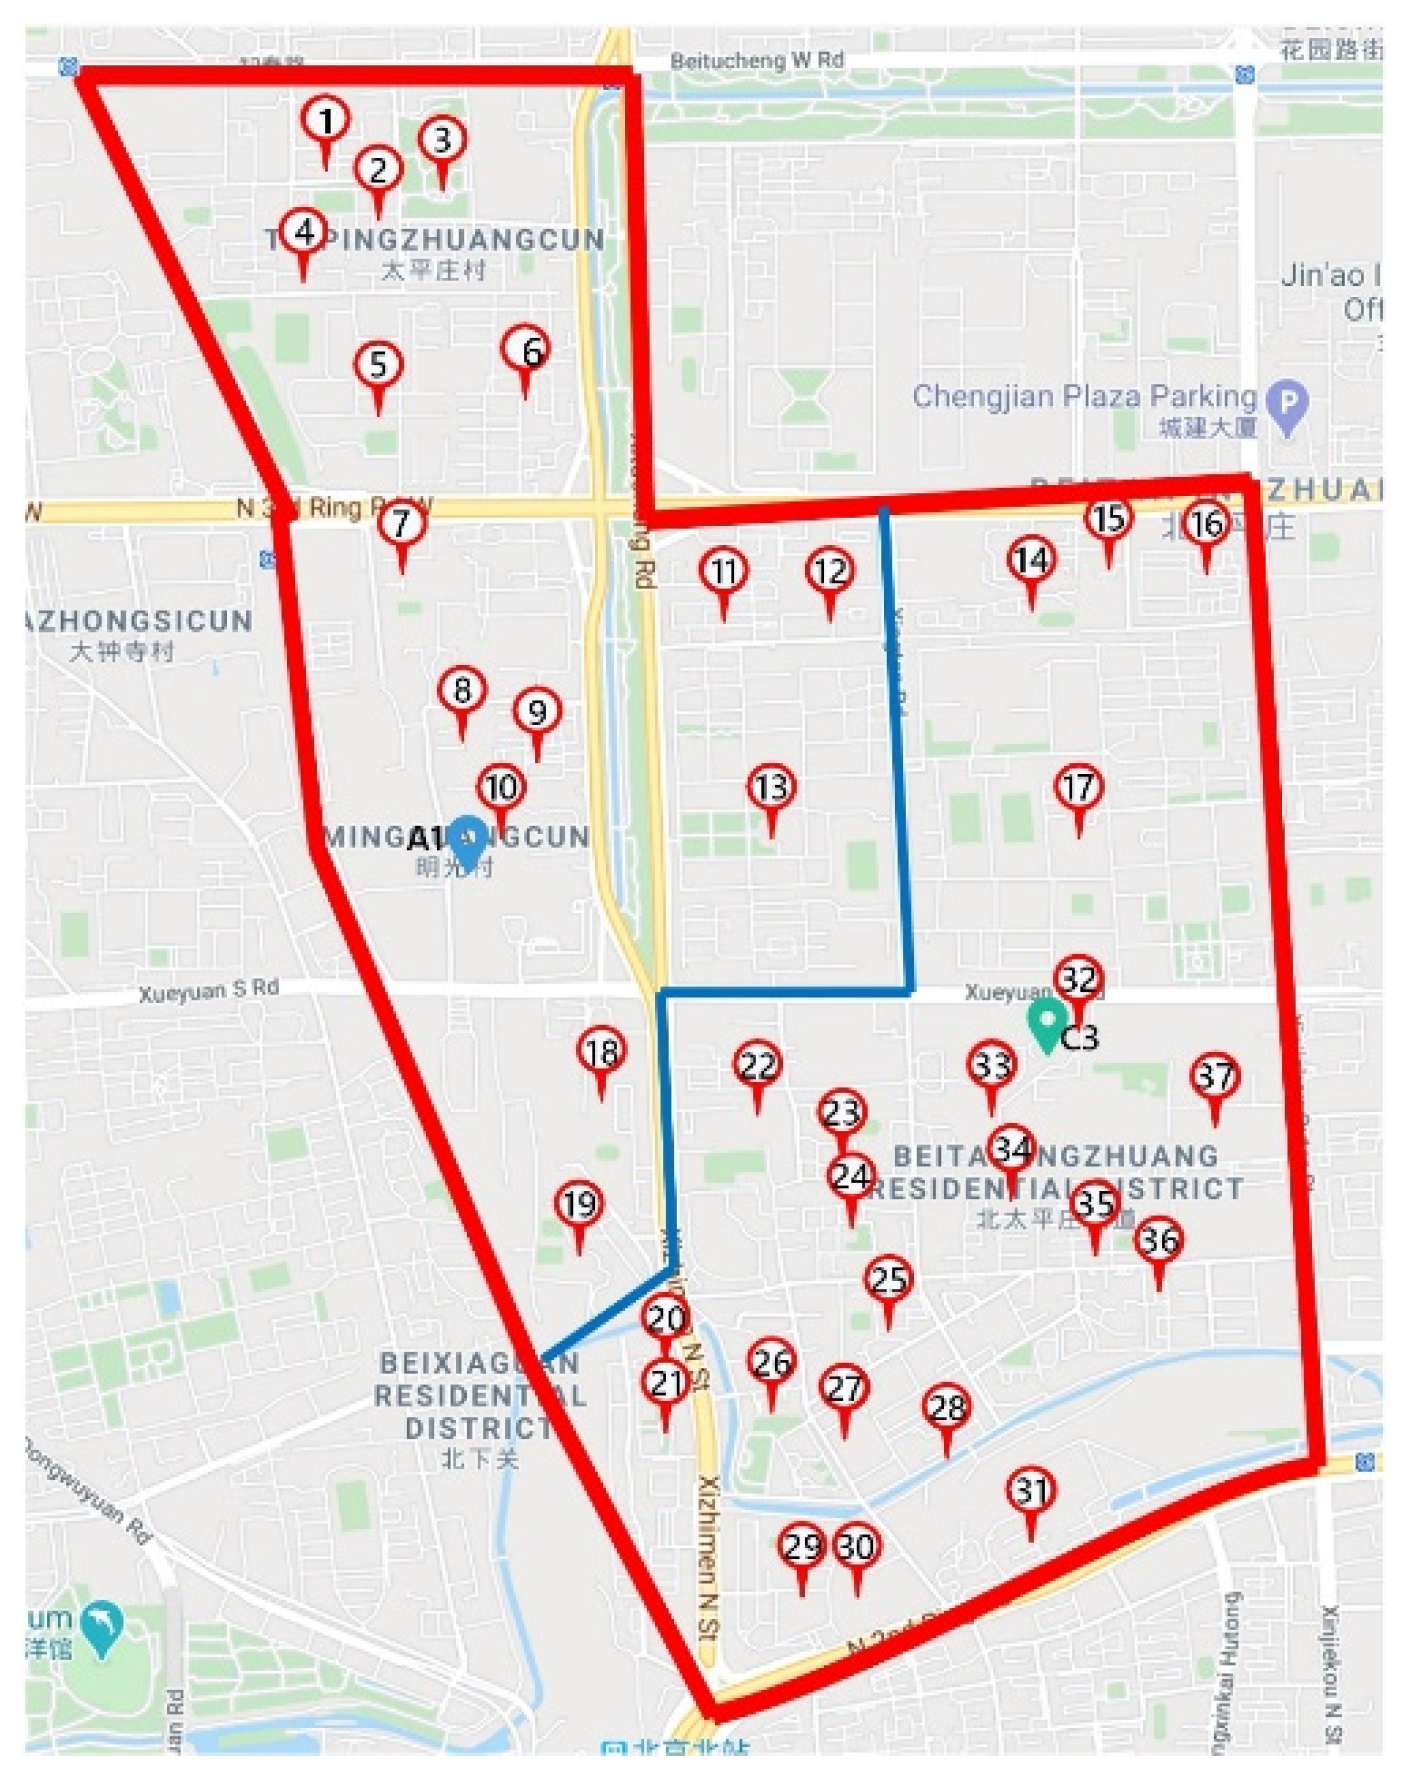
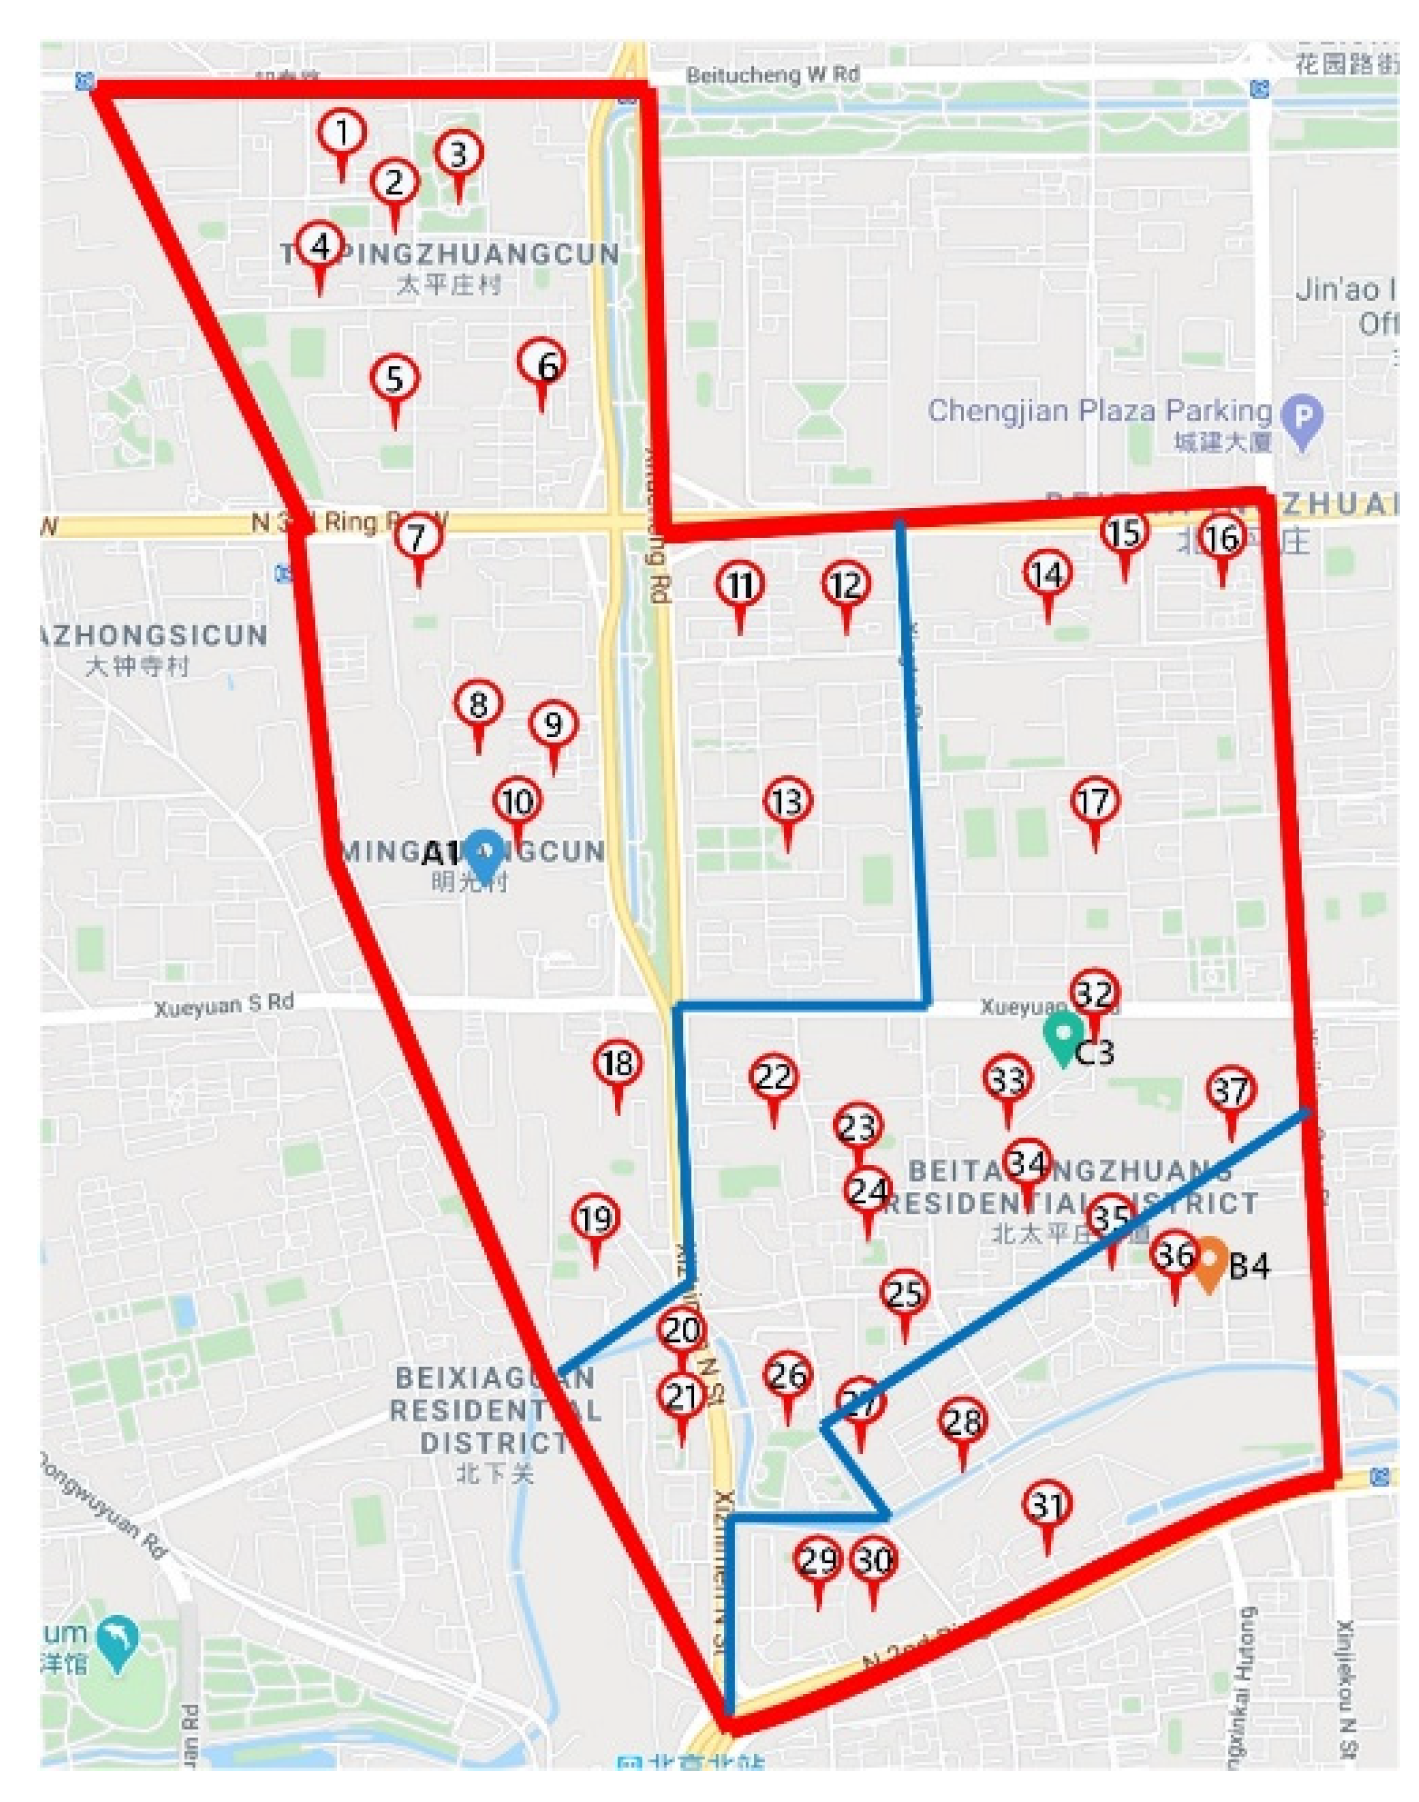
In this study, we investigate a real-world case of ECSS locations by assessing the crowdsourcing distribution mode on Bei Tai Ping Zhuang Street in Haidian District, Beijing, which covers an area of 5.17 square kilometers. Residential communities are regarded as EPs in this study. According to our investigation, there are 37 EPs, as shown in Figure 4. We collected the geographical locations and distribution range of DOs and IECs in this area from the official websites of the enterprises. There are 14 DOs of four express enterprises (A, B, C, and D), as shown in Figure 5, and 41 IECs of three enterprises (a, b, and c) as shown in Figure 6. The longitude and latitude of each point were obtained using the Baidu coordinate picking system. The distribution relationship between DOs and EPs is shown in Table 3. The distribution relationship between DOs and IECs is shown in Table 4. The distribution relationship between IECs and EPs is shown in Table 5. In this case, the ECSSs will be established by an alliance of the four express enterprises or a third-party agent.
The average daily delivery demand of the EPs was estimated according to the populations of the 37 residential communities extracted from the Guide to Administrative Divisions of Beijing (http://www.tcmap.com.cn/beijing/haidianqu_beitaipingzhuangjiedao.html). The express delivery business volume reached 2.287 billion pieces in Beijing in 2019 [59]. By the end of 2019, the permanent resident population of Beijing was 21.536 million [60]. Thus, we determined that the per capita daily express delivery demand in Beijing was 0.291 pieces in 2019. Then, we determined the average daily delivery demand of each EP on Bei Tai Ping Zhuang Street in Haidian District, Beijing, as shown in Table 6, at 40,681 pieces per day in total.

5.2. Results and Discussion

5.2.1. Location of ECSSs

In the end network on Bei Tai Ping Zhuang Street in Haidian District, Beijing, we adopt four node centrality indices (DC, CC, BC, and IKC) to evaluate the node importance of the 14 DOs shown in Figure 5. We construct the node importance evaluation index set R = { r 1 , r 2 , r 3 , r 4 } , The results of the node centrality indices are shown in Table 7.
Then, we adopt the three-scale AHP method to subjectively evaluate the four indices (DC, CC, BC, and IKC). In Section 4.1.1, we obtained the subjective weight vectors ( w D C ¯ ,   w C C ¯ , w B C ¯ , w I K C ¯ ) T =   ( 0.0679 ,   0.6107 ,   0.2536 ,   0.0679 ) T . Then, we use the TOPSIS method to evaluate the node importance of the indices, as described in Section 4.1.2. We thus obtain the positive ideal solution F + and the negative solution F as follows:
F + = { h 1 + , h 2 + , h 3 + , h 4 + } = ( 0.0679 , 0.6107 , 0.2536 , 0.0679 )
F = { h 1 , h 2 , h 3 + , h 4 } = ( 0.0121 , 0.2538 , 0.0019 , 0.0170 )
We evaluated the closeness of each DO, and the results are shown in Table 8. The 14 DOs are ranked by the score C s * . DOs with a value of C s *   greater than 0.55 were considered as candidate nodes for ECSSs, i.e., D2, A1, B4, C1, and C3.
Then, we determined the final location plan of ECSSs that were selected from the candidate nodes D2, A1, B4, C1, and C3. We set the maximum delivery quantity that a crowdsourcing courier could handle per batch at 10 and set the capacity of each IEC at 100. We selected two or three ECSSs in the end network, i.e., z = 2 or z = 3. Taking the data of daily delivery demand of each EP, the capacity of each IEC, and the distance and distribution relationships among EPs, DOs, and IECs as the inputs of the location model, we solved the model and obtained the optimal location plan of ECSSs.
Figure 7 and Figure 8 show the results of the distribution range of ECSSs under the conditions of z = 2 and z = 3, respectively. When the decision-maker set was z = 2, the express delivery DOs “A1” and “D3” were selected as ECSSs, and the objective function achieved a minimum value of 3346.46 km. When the decision-maker set was z = 3, the express delivery DOs “A1”, “D3”, and “B4” were selected as ECSSs, and the objective function achieved a minimum value of 3140.07 km. Table 9 shows which EPs each ECSS provides delivery services for under the conditions of z = 2 and z = 3.

5.2.2. Environmental Benefits of the New Mode

To highlight the benefits of the implementation of the crowdsourcing distribution mode, we compared the environmental benefits before and after the implementation of the new mode by measuring carbon emissions.

For the End of the Distribution

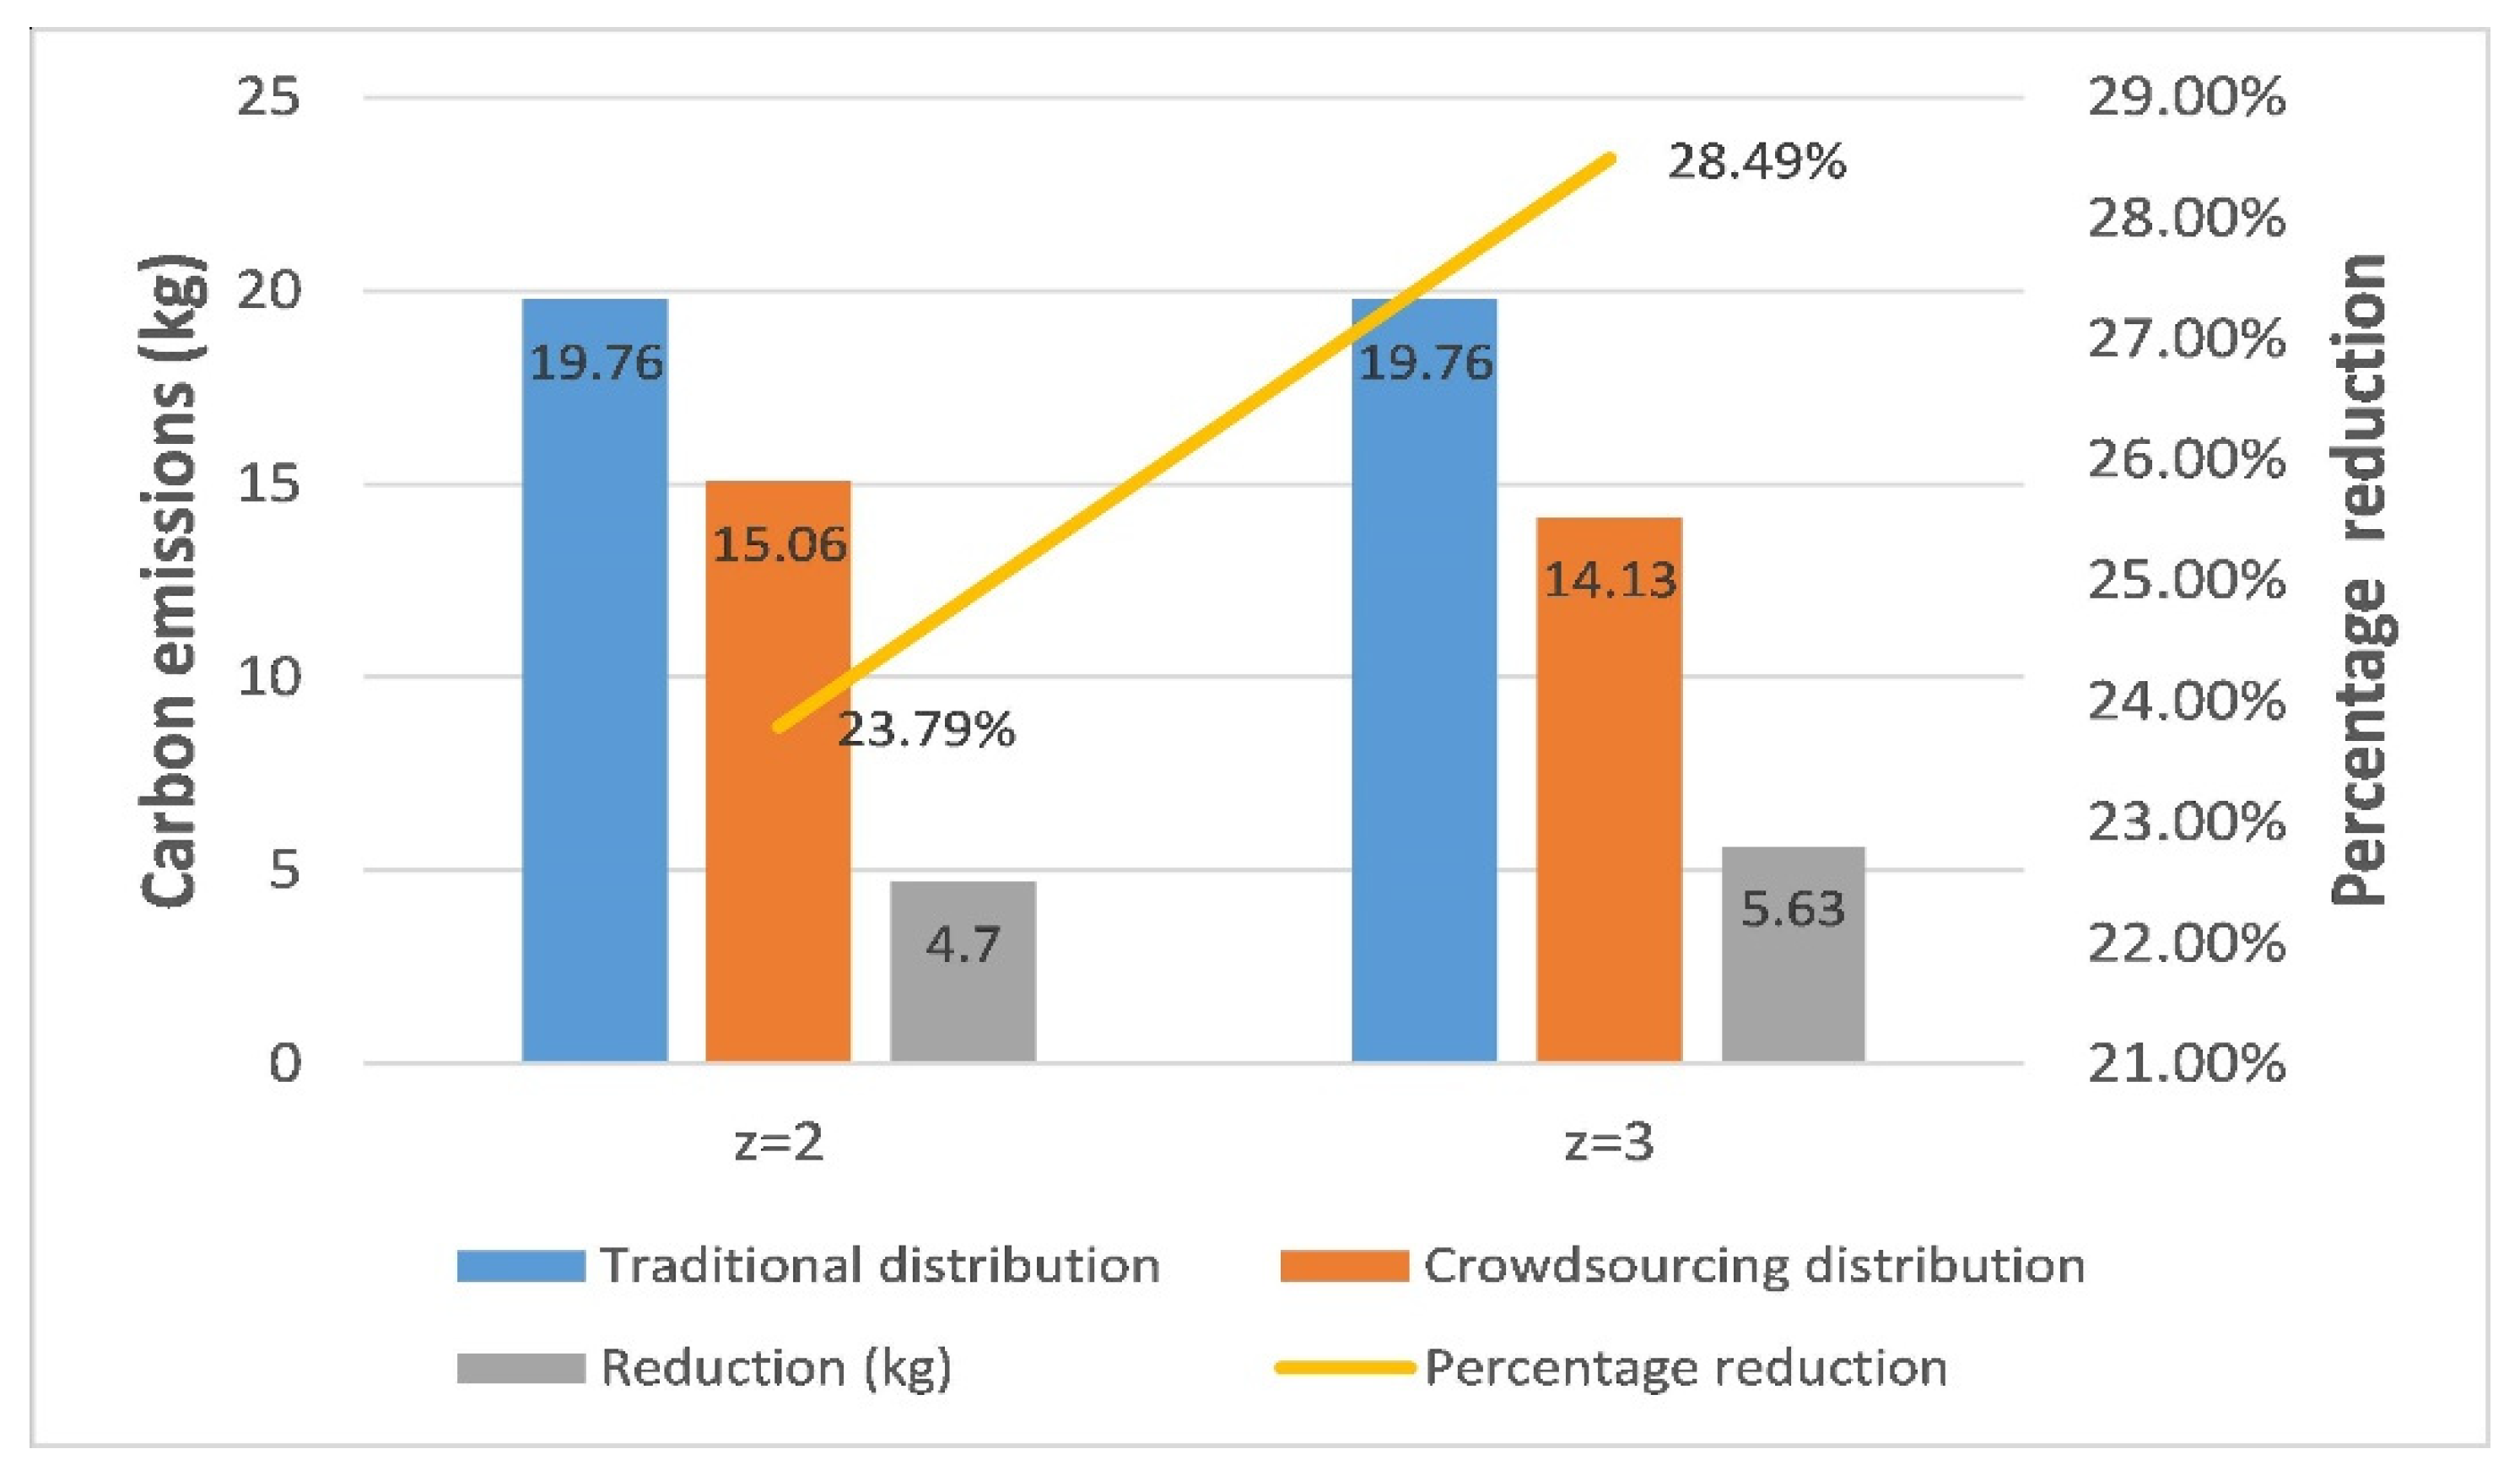
In general, electric tricycles, whose average power consumption over 100 km is 5 kW·h, are frequently used in the traditional mode. Producing 1 kW·h of electricity will generate 0.9 kg of carbon emissions [61]; the emission coefficient for power-consuming vehicles was set to 0.90 in this study. The formula for measuring carbon emissions is as follows:
CO2 from power-consuming vehicles (kg) = Power consumption degree × 0.90
We assume that the four express enterprises (A, B, C, and D) will divide the business volume of the EPs equally. We set the maximum delivery quantity that an electric tricycle can handle in one batch at 150 [17]. The total estimated distance travelled is approximately 439.05 km. Therefore, the daily carbon emissions are estimated as approximately 19.76 kg. As cyclists and pedestrians are considered as crowdsourcing couriers [29], we assumed that the couriers would deliver the packages mainly by bicycles (no power consumption) and electric bicycles (of which the average power consumption of 100 km is 0.5 kW·h). The results of daily carbon emissions of the new mode are shown in Table 10 and Figure 9. The environmental benefits generated by the establishment of ECSSs are considerable, and establishing two or three ECSSs can both contribute to emission reductions and improve environmental benefits. However, higher benefits can be achieved by establishing three ECSSs rather than two, with a difference of 0.93 kg per day.

For the Front-End of the Distribution

For the front-end of the distribution, fuel-consuming 4.2 m vans (of which the average fuel consumption over 100 km is 11 L) are usually used to deliver express parcels from logistics centers to the end outlets, with an approximate capacity of 1600 pieces. We assume that four express enterprises (A, B, C, and D) divide the business volume of the EPs equally, with 40,681 pieces in total. According to Ubeda et al. [62], carbon emissions produced by fuel-consuming vehicles total 3.11 kg/km. Then, knowing that the density of fuel is 0.84 kg/L [17], the emission coefficient is set to 3.11 × 0.84 = 2.61. The formula for measuring carbon emissions is as follows:
CO2 from fuel-consuming vehicles (kg) = Fuel consumption (liter) × 2.61
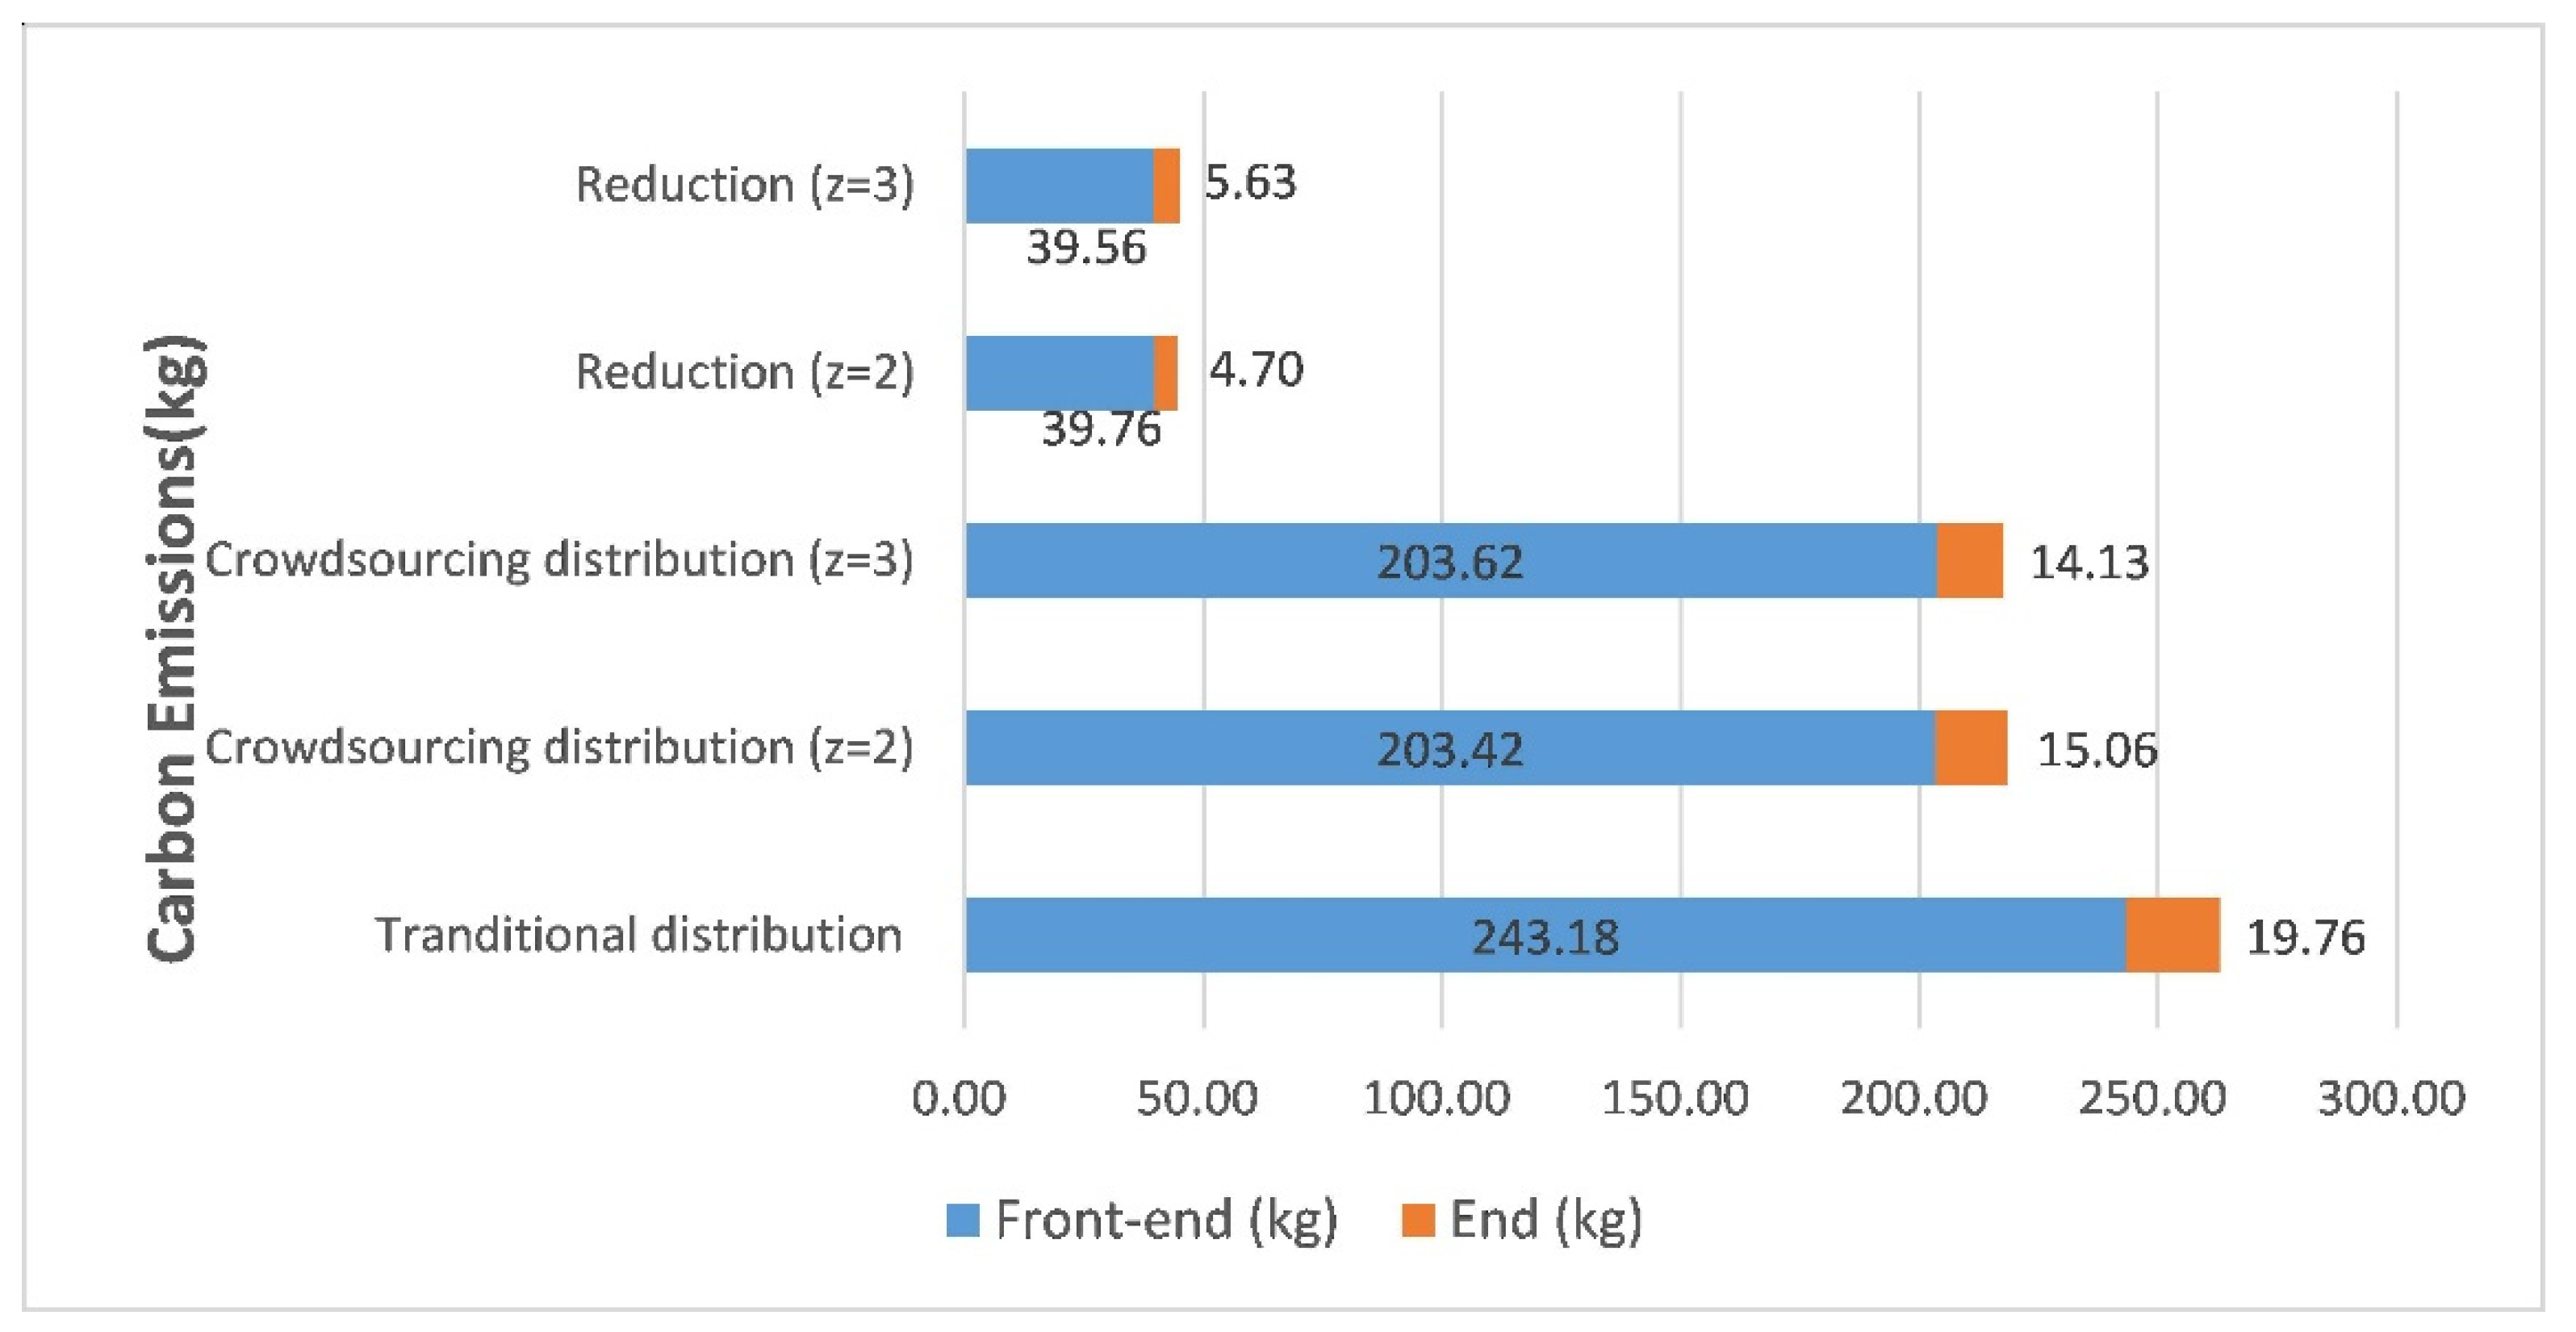
Before the new mode was implemented, there were four express enterprises using their own vans to deliver their express packages from the logistics park (Beijing Shunyi Airport Logistics Park) to their own end DOs, as shown in Figure 5. However, taking advantage of the new mode, the four express enterprises collaboratively used vans to deliver the express packages to ECSSs. The results are shown in Table 11 and Figure 10; for the front-end process, the environmental benefits generated by the establishment of ECSSs are substantial, and the configurations of two or three ECSSs contributed nearly equally to the area’s emissions reduction, with a difference of 0.20 kg per day.
Considering the number of vehicles needed, there were no differences when z = 2 and z = 3 (26 vans needed). However, compared with the traditional mode (31 vans needed), the demand for 4.2 m vans would be reduced by five. Furthermore, the overall loading rate of vans can be improved to a certain extent. As shown in Table 12, the overall loading rate will be improved from 82.02% to 97.79%, with an increase of 15.77%. Through the implementation of crowdsourcing distribution, fuel consumption costs and fixed vehicle costs can also be saved.

For the Entire Distribution

For the entire distribution, carbon emissions are estimated to be reduced by 44.46 kg when z = 2 or 45.19 kg when z = 3 in total on Bei Tai Ping Zhuang Street, Beijing, with an annual reduction of 16.22 to 16.49 t. In Table 13 and Figure 11, the implementation of the new mode of crowdsourcing distribution clearly achieves considerable environmental benefits, with more benefits generated from the end than from the front-end. In addition, establishing three ECSSs increased environmental benefits, with a difference of 0.73 kg per day compared with two ECSSs.

5.2.3. Suggestions

In addition to the environmental benefits of the new mode, it can also achieve economic and social benefits. From the perspective of express enterprises, rental costs of distribution outlets, fuel consumption costs, and fixed vehicle costs can be saved. Enterprises deliver their express packages directly from the logistics park to ECSSs instead of their own outlets, so the rental costs of distribution outlets will be reduced. Since crowdsourcing couriers use their own vehicles for terminal distribution, enterprises no longer need to equip themselves with lots of electric tricycles, and fixed vehicle costs and fuel consumption costs can be reduced. Meanwhile, they can easily and efficiently use and mobilize social resources, and the cost of employing couriers will be reduced. From the perspective of crowdsourcing couriers, they can earn extra income from express deliveries because of the large volume of part-time jobs provided by implementing the crowdsourcing distribution. They can make full use of their spare time and accept orders according to their own delivery willingness so that the time arrangement is more flexible, and they can earn extra income through work in their spare time. Moreover, both the instant and non-instant delivery needs of customers can be met through the distribution service. In the long run, the development trend of terminal distribution is to reduce or eliminate secondary deliveries. Terminal distribution mainly meets the non-instant delivery to the intelligent cabinets and the crowdsourced instant delivery to the stations. The proposed crowdsourcing distribution mode for city express delivery will help integrate logistics resources, reduce costs, improve efficiency, and facilitate the green development of city logistics.
Our findings of benefits of the proposed new mode are very significant and useful for city agencies and governments to introduce and implement policies and regulations within the express delivery industry. (1) It is suggested that vicious competition should be avoided among the express delivery enterprises and it is encouraged to form a consensus on sharing distribution vehicles, distribution personnel, distribution information, and other resources so as to realize the coordinated development of express delivery through cooperation and communication within the industry. (2) It is suggested that the government plans the land uniformly to establish ECSSs or encourages and supports the third-party enterprises with strong strength and standardized service to establish the ECSSs. In order to encourage and guide express delivery enterprises to settle in, it is suggested that the government gives some preferential policies to enterprises in terms of planning land, rent and tax, etc., and to simplify the approval procedures. (3) Actively encourage more IECs to be laid in the end network to relieve the pressure of express delivery and effectively reduce “secondary delivery”. (4) The establishment of a perfect certification access mechanism for crowdsourcing couriers is crucial. It is suggested that a strict application process for crowdsourcing couriers needs to be set up to carry out a more comprehensive authentication, and that job training is provided regularly for those registered and approved couriers on the platform. (5) It is suggested to establish a comprehensive service quality evaluation system to evaluate the service quality of crowdsourcing couriers through the assessment of the distribution time, user evaluation, and other data on the platform so as to ensure the brand reputation of the settled express delivery enterprises.

6. Conclusions

Following the new trend of green logistics and considering the urgent need for solving problems of logistical activities, including uncoordinated resource allocation and unreasonable network layout of terminal express distribution, the main contribution of this study is the proposal of a new environmentally friendly mode for city distribution and the introduction of a new concept of end crowdsourcing service stations (ECSS), which provide end delivery service for several enterprises and achieve enormous environmental benefits. The traditional problems such as high emissions, serious resource wastes, and low delivery efficiency, which restrict sustainable improvements of logistics activities, can be solved by the new mode and location scheme.
To prove the environmental benefits of the proposed mode, this study investigates a real-world case in Beijing, China. The environmental benefits generated by ECSSs are considerable, and it is estimated that carbon emissions can be reduced by 16.91% to 17.19% for an entire distribution process. In addition, it is not necessary for express enterprises to build excessive distribution outlets in the end network or purchase unnecessary electric tricycles and vans, and the overall loading rate of vans can be improved by 15.77%. As the new mode can meet both the instant and non-instant delivery needs of end customers, secondary distributions will be reduced, and the delivery efficiency of the end network will be substantially improved. Our findings can encourage local governments to implement more effective regulations and policies to support the greener and more efficient development of express enterprises in the future.
However, there are still some limitations in this study. First, we calculated the distance between nodes through the longitude and latitude, but there was a small amount of error for the distance of the actual distribution path. Second, we did not consider the difference in power consumption of electric tricycles under different loads. The next steps of our study in the future include the following. (1) In order to study the behavior of the model for larger areas, the research area will be expanded to the whole Beijing area in the next step. (2) The system for evaluating the node importance of the existing end DOs to identify the candidate nodes for establishing ECSSs will be improved by considering other metrics, such as connectivity and spatial allometry. (3) The location model of ECSSs will be improved by considering traffic state effects, e.g., jams and the ratio of instant and non-instant delivery demands of end customers. Additionally, the results in a real test with real consumptions of the vehicles will be further investigated, and real data validations on the basis of real fuel consumptions, vehicle weights, and energy sources will be further studied by using the SUMO (Simulation of Urban Mobility) simulation software to simulate road traffic. (4) The impacts of the use of new energy vehicles on promoting the development of green transportation in logistics activities will be further studied.

Author Contributions

Conceptualization, K.B. and M.Y.; methodology, K.B. and M.Y.; software, K.B. and M.Y.; validation, K.B. and M.Y.; formal analysis, K.B. and M.Y.; investigation, K.B. and M.Y.; resources, K.B., M.Y., and X.Z.; data curation, K.B. and M.Y.; writing—original draft preparation, K.B.; writing—review and editing, K.B., M.Y., and L.Z.; visualization, K.B. and L.Z.; supervision, L.Z. and X.Z.; project administration, X.Z.; funding acquisition, X.Z. All authors have read and agreed to the published version of the manuscript.

Funding

This research was funded by the Fundamental Research Funds for the Central Universities, BUPT, grant number 2018XKJC07.

Conflicts of Interest

The authors declare no conflict of interest.

References

  1. China Internet Network Information Center. The 45th Statistical Report on Internet Development in China. 2020. Available online: http://www.cnnic.net.cn/hlwfzyj/hlwxzbg/hlwtjbg/202004/t20200428_70974.html (accessed on 28 April 2020).
  2. Gan, M.; Yang, S.; Li, D.D.; Wang, M.; Chen, S.; Xie, R.; Liu, J. A novel intensive distribution logistics network design and profit allocation problem considering sharing economy. Complexity 2018. [Google Scholar] [CrossRef] [Green Version]
  3. Wang, X.P.; Zhan, L.M.; Ruan, J.H.; Zhang, J. How to choose “last mile” delivery modes for e-fulfillment. Math. Probl. 2014. [Google Scholar] [CrossRef]
  4. State Post of Bureau of The People’s Republic of China. State Post of Bureau Announced the Operation of Postal Industry in 2019. 2020. Available online: http://www.spb.gov.cn/xw/dtxx_15079/202001/t20200114_2005598.html (accessed on 14 January 2020).
  5. Zhang, W.; Zhang, M.Y.; Zhang, W.Y.; Zhou, Q.; Zhang, X. What influences the effectiveness of green logistics policies? A grounded theory analysis. Sci. Total. Environ. 2020. [Google Scholar] [CrossRef]
  6. Srivastava, S.K. Green supply-chain management: A state-of-the-art literature review. Int. J. Manag. Rev. 2007, 9, 53–80. [Google Scholar] [CrossRef]
  7. Khan, S.A.R.; Dong, Q.L. Does national scale economic and environmental indicators spur logistics performance? Evidence from UK. Environ. Sci. Pollut. Res. 2017, 24, 26692–26705. [Google Scholar] [CrossRef]
  8. Brown, J.R.; Guiffrida, A.L. Carbon emissions comparison of last mile delivery versus customer pickup. Int. J. Logist-Res. App. 2014, 17, 503–521. [Google Scholar] [CrossRef]
  9. Aized, T.; Srai, J.S. Hierarchical modelling of last mile logistic distribution system. Int. J. Adv. Manuf. 2014, 70, 1053–1061. [Google Scholar] [CrossRef]
  10. Devari, A.; Nikolaev, A.G.; He, Q. Crowdsourcing the last mile delivery of online orders by exploiting the social networks of retail store customers. Transport. Res. E-Log. 2017, 105, 105–122. [Google Scholar] [CrossRef]
  11. Ranieri, L.; Digiesi, S.; Silvestri, B.; Roccotelli, M. A review of last mile logistics innovations in an externalities cost reduction vision. Sustainability. 2018, 10, 782. [Google Scholar] [CrossRef] [Green Version]
  12. Ji, S.F.; Luo, R.J.; Peng, X.S. A probability guided evolutionary algorithm for multi-objective green express cabinet assignment in urban last-mile logistics. Int. J. Prod. Res. 2019, 57, 3382–3404. [Google Scholar] [CrossRef]
  13. Shouket, B.; Zaman, K.; Nassani, A.A.; Aldakhil, A.M.; Abro, M.M.Q. Management of green transportation: An evidence-based approach. Environ. Sci. Pollut. Res. 2019, 26, 12574–12589. [Google Scholar] [CrossRef] [PubMed]
  14. Talbi, B. CO2 emissions reduction in road transport sector in Tunisia. Renew. Sust. Energ. Rev. 2017, 69, 232–238. [Google Scholar] [CrossRef]
  15. Alshehry, A.S.; Belloumi, M. Study of the environmental Kuznets curve for transport carbon dioxide emissions in Saudi Arabia. Renew. Sust. Energ. Rev. 2017, 75, 1339–1347. [Google Scholar] [CrossRef]
  16. Khan, S.A.R. The nexus between carbon emissions, poverty, economic growth, and logistics operations-empirical evidence from southeast Asian countries. Environ. Sci. Pollut. Res. 2019, 26, 13210–13220. [Google Scholar] [CrossRef] [PubMed]
  17. Bi, K.X.; Yang, M.K.; Zhou, X.G.; Zahid, L.; Zhu, Y.; Sun, Z. Reducing carbon emissions from collaborative distribution: A case study of urban express in China. Environ. Sci. Pollut. R. 2020, 27, 16215–16230. [Google Scholar] [CrossRef] [PubMed]
  18. Guo, X.P.; Ren, D.F.; Shi, J.X. Carbon emissions, logistics volume and GDP in China: Empirical analysis based on panel data model. Environ. Sci. Pollut. Res. 2016, 23, 24758–24767. [Google Scholar] [CrossRef] [PubMed]
  19. Baloch, M.A.; Suad, S. Modeling the impact of transport energy consumption on CO2 emission in Pakistan: Evidence from ARDL approach. Environ. Sci. Pollut. Res. 2018, 25, 9461–9473. [Google Scholar] [CrossRef]
  20. Zhang, Z.; Figliozzi, M.A. A survey of China’s logistics industry and the impacts of transport delays on importers and exporters. Transp. Rev. 2010, 30, 179–194. [Google Scholar] [CrossRef]
  21. Leitner, R.; Meizer, F.; Prochazka, M.; Shin, W. Structural concepts for horizontal cooperation to increase efficiency in logistics. CIRP. J. Manuf. Sci. Tec. 2014, 4, 332–337. [Google Scholar] [CrossRef]
  22. Deutsch, Y.; Golany, B. A parcel locker network as a solution to the logistics last mile problem. Int. J. Prod. Res. 2018, 56, 251–261. [Google Scholar] [CrossRef]
  23. Fan, W.; Xu, M.; Dong, X.; Wei, H. Considerable environmental impact of the rapid development of China’s express delivery industry. Resour. Conserv. Recycl. 2017, 126, 174–176. [Google Scholar] [CrossRef]
  24. Montoya-Torres, J.R.; Munoz-Villamizar, A.; Vega-Mejia, C.A. On the impact of collaborative strategies for goods delivery in city logistics. Prod. Plan. & Control 2016, 27, 443–455. [Google Scholar]
  25. Guo, J.; Ma, S. Environmental impact assessment for city logistics distribution systems. Environ. Eng. Res. 2017, 22, 363–368. [Google Scholar] [CrossRef] [Green Version]
  26. Rai, H.B.; Verlinde, S.; Macharis, C. Shipping outside the box. Environmental impact and stakeholder analysis of a crowd logistics platform in Belgium. J. Clean. Prod. 2018, 202, 806–816. [Google Scholar]
  27. Serafini, S.; Nigro, M.; Gatta, V.; Marcucci, E. Sustainable crowdshipping using public transport: A case study evaluation in Rome. Transp. Res. Procedia. 2018, 30, 101–110. [Google Scholar] [CrossRef]
  28. Giret, A.; Carrascosa, C.; Julian, V.; Rebollo, M.; Botti, V. A crowdsourcing approach for sustainable last mile delivery. Sustainability. 2018, 10, 4563. [Google Scholar] [CrossRef] [Green Version]
  29. Kafle, N.; Zou, B.; Lin, J. Design and modeling of a crowdsource-enabled system for urban parcel relay and delivery. Transport. Res. B-Meth. 2017, 99, 62–82. [Google Scholar] [CrossRef]
  30. Paloheimo, H.; Lettenmeier, M.; Waris, H. Transport reduction by crowdsourced deliveries - a library case in Finland. J. Clean. Prod. 2016, 132, 240–251. [Google Scholar] [CrossRef]
  31. Binetti, M.; Caggiani, L.; Camporeale, R.; Ottomanelli, M. A sustainable crowdsourced delivery system to foster free-floating bike-sharing. Sustainability. 2019, 11, 2772. [Google Scholar] [CrossRef] [Green Version]
  32. Arslan, A.M.; Agatz, N.; Kroon, L.; Zuidwijk, R. Crowdsourced delivery—A dynamic pickup and delivery problem with ad hoc drivers. Transp. Sci. 2019, 53, 222–235. [Google Scholar] [CrossRef] [Green Version]
  33. Rai, H.B.; Verlinde, S.; Merckx, J.; Macharis, C. Crowd logistics: An opportunity for more sustainable urban freight transport. Eur. Transp. Res. Rev. 2017, 9, 39. [Google Scholar]
  34. Mehmann, J.; Frehe, V.; Teuteberg, F. Crowd logistics-a literature review and maturity model. In Proceedings of the Hamburg International Conference of Logistics (HICL), Hamburg, Germany, September 2015. [Google Scholar]
  35. Wang, J.X.; Lim, M.K.; Tseng, M.L.; Yang, Y. Promoting low carbon agenda in the urban logistics network distribution system. J. Clean. Prod. 2019, 211, 146–160. [Google Scholar] [CrossRef]
  36. Wang, X. Study on relationship between green logistics activity and logistics performance. Cluster. Comput. 2019, 22, S6579–S6588. [Google Scholar] [CrossRef]
  37. Sun, Q. Empirical research on coordination evaluation and sustainable development mechanism of regional logistics and new-type urbanization: A panel data analysis from 2000 to 2015 for Liaoning Province in China. Environ. Sci. Pollut. Res. 2017, 24, 14163–14175. [Google Scholar] [CrossRef] [PubMed]
  38. Kucukoglu, I.; Ene, S.; Aksoy, A.; Öztürk, N. A memory structure adapted simulated annealing algorithm for a green vehicle routing problem. Environ. Sci. Pollut. Res. 2015, 22, 3279–3297. [Google Scholar] [CrossRef]
  39. Wang, Y.; Zhang, D.X.; Liu, Q.; Shen, F.; Lee, L.H. Towards enhancing the last-mile delivery: An effective crowd-tasking model with scalable solutions. Transport. Res. E-Log. 2016, 93, 279–293. [Google Scholar] [CrossRef]
  40. Lee, S.; Kang, Y.; Prabhu, V.V. Smart logistics: Distributed control of green crowdsourced parcel services. Int. J. Prod. Res. 2016, 54, 6956–6968. [Google Scholar] [CrossRef]
  41. Yang, H.; Nie, Y.C.; Zhang, H.B.; Di, Z.R.; Fan, Y. Insight to the express transport network. Comput. Phys. Commun. 2009, 180, 1511–1515. [Google Scholar] [CrossRef]
  42. Conde, L.E.S.; Used, J.; Romance, M. Optimal distributions for multiplex logistic networks. Chaos. 2016, 26, 065312. [Google Scholar] [CrossRef]
  43. Wu, Y.N.; Ma, H. Logistics network nodes importance analysis based on the complex network theory. In Proceedings of the 2nd International Conference on Measurement, Instrumentation and Automation (ICMIA 2013), Guilin, China, 23–24 April 2013. [Google Scholar]
  44. Zhao, L.J.; Li, H.Y.; Li, M.C.; Sun, Y.; Hu, Q.; Mao, S.; Li, J.; Xue, J. Location selection of intra-city distribution hubs in the metro-integrated logistics system. Tunn. Uudergr. Sp. Tech. 2018, 80, 246–256. [Google Scholar] [CrossRef]
  45. Zhou, M.R.; Duan, Y.T.; Yang, W.; Pan, Y.C.; Zhou, M. Capacitated multi-modal network flow models for minimizing total operational cost and CO2e emission. Comput. Ind. Eng. 2018, 126, 361–377. [Google Scholar] [CrossRef]
  46. Bader, D.A.; Kintali, S.; Madduri, K.; Mihail, M. Approximating betweenness centrality. In Lecture Notes in Computer Science (including Subseries Lecture Notes in Artificial Intelligence and Lecture Notes in Bioinformatics); Springer: Berlin/Heidelberg, Germany, 2007. [Google Scholar]
  47. Carmi, S.; Havlin, S.; Kirkpatrick, S.; Shavitt, Y.; Shir, E. A model of Internet topology using k-shell decomposition. Proc. Natl. Acad. Sci. USA 2007, 104, 11150–11154. [Google Scholar] [CrossRef] [PubMed] [Green Version]
  48. Kitsak, M.; Gallos, L.K.; Havlin, S.; Liljeros, F.; Muchnik, L.; Stanley, H.E.; Makse, H.A. Identification of influential spreaders in complex networks. Nat. Phys. 2010, 6, 888–893. [Google Scholar] [CrossRef] [Green Version]
  49. Liu, Z.; Jiang, C.; Wang, J.; Yu, H. The node importance in actual complex networks based on a multi-attribute ranking method. Knowl-Based. Syst. 2015, 84, 56–66. [Google Scholar] [CrossRef]
  50. Wang, X.J.; Chan, H.K. A hierarchical fuzzy TOPSIS approach to assess improvement areas when implementing green supply chain initiatives. Int. J. Prod. Res. 2013, 51, 3117–3130. [Google Scholar] [CrossRef]
  51. Skibniewski, M.J.; Chao, L.C. Evaluation of Advanced Construction Technology with AHP Method. J. Constr. Eng. M. 1992, 118, 577–593. [Google Scholar] [CrossRef]
  52. Wang, L.C.; Song, Y.P.; Feng, S. Lectotype optimization of offshore platforms by use of three-scale fuzzy analytical hierarchy process. China. Ocean. Eng. 2001, 15, 153–164. [Google Scholar]
  53. Vaidya, O.S.; Kumar, S. Analytic hierarchy process: An overview of applications. Eur. J. Oper. Res. 2006, 169, 1–29. [Google Scholar] [CrossRef]
  54. Dong, Y.C.; Jiang, A.M.; Zou, P.Z.; Ni, J. Application of three-scale AHP-TOPSIS evaluation model in green degree comparison of construction scheme. J. Water. Res. Plan. & Archit. Eng. 2019, 17, 194–199. [Google Scholar]
  55. Yoon, K.; Hwang, C.L. Multiple attribute decision making: An introduction. Eur. J. Oper. Res. 1995, 4, 287–288. [Google Scholar]
  56. Hsueh, J.T.; Lin, C.Y. Integrating the AHP and TOPSIS decision processes for evaluating the optimal collection strategy in reverse logistic for the TPI. Int. J. Green. Energy. 2017, 14, 1209–1220. [Google Scholar] [CrossRef]
  57. Jovcic, S.; Prusa, P.; Dobrodolac, M.; Svadlenka, L. A proposal for a decision-making tool in third-party logistics (3PL) provider selection based on multi-criteria analysis and the fuzzy approach. Sustainability 2019, 11, 4236. [Google Scholar] [CrossRef] [Green Version]
  58. Xu, Y.J.; Jia, H.F.; Zhang, Y.K.; Tian, G.D. Analysis on the location of green logistics park based on heuristic algorithm. Adv. Mech. Eng. 2018. [Google Scholar] [CrossRef]
  59. Beijing Municipal Postal Administration. Beijing Municipal Postal Administration Announced the Operation of the Whole City’s Postal Industry in December 2019. 2020. Available online: http://bj.spb.gov.cn/xytj_14733/tjxx_14735/202001/t20200115_2006141.html (accessed on 15 January 2020).
  60. Beijing Municipal Bureau of Statistics. Bulletin of National Economic and Social Development Statistics of Beijing in 2019. 2020. Available online: http://tjj.beijing.gov.cn/zxfbu/202003/t20200302_1673397.html (accessed on 2 March 2020).
  61. Zhang, K.Y.; Liu, X.M.; Yao, J.M. Identifying the driving forces of CO2 emissions of China’s transport sector from temporal and spatial decomposition perspectives. Environ. Sci. Pollut. Res. 2019, 26, 17383–17406. [Google Scholar] [CrossRef] [PubMed]
  62. Ubeda, S.; Arcelus, F.J.; Faulin, J. Green logistics at Eroski: A case study. Int. J. Prod. Econ. 2011, 131, 44–51. [Google Scholar] [CrossRef]
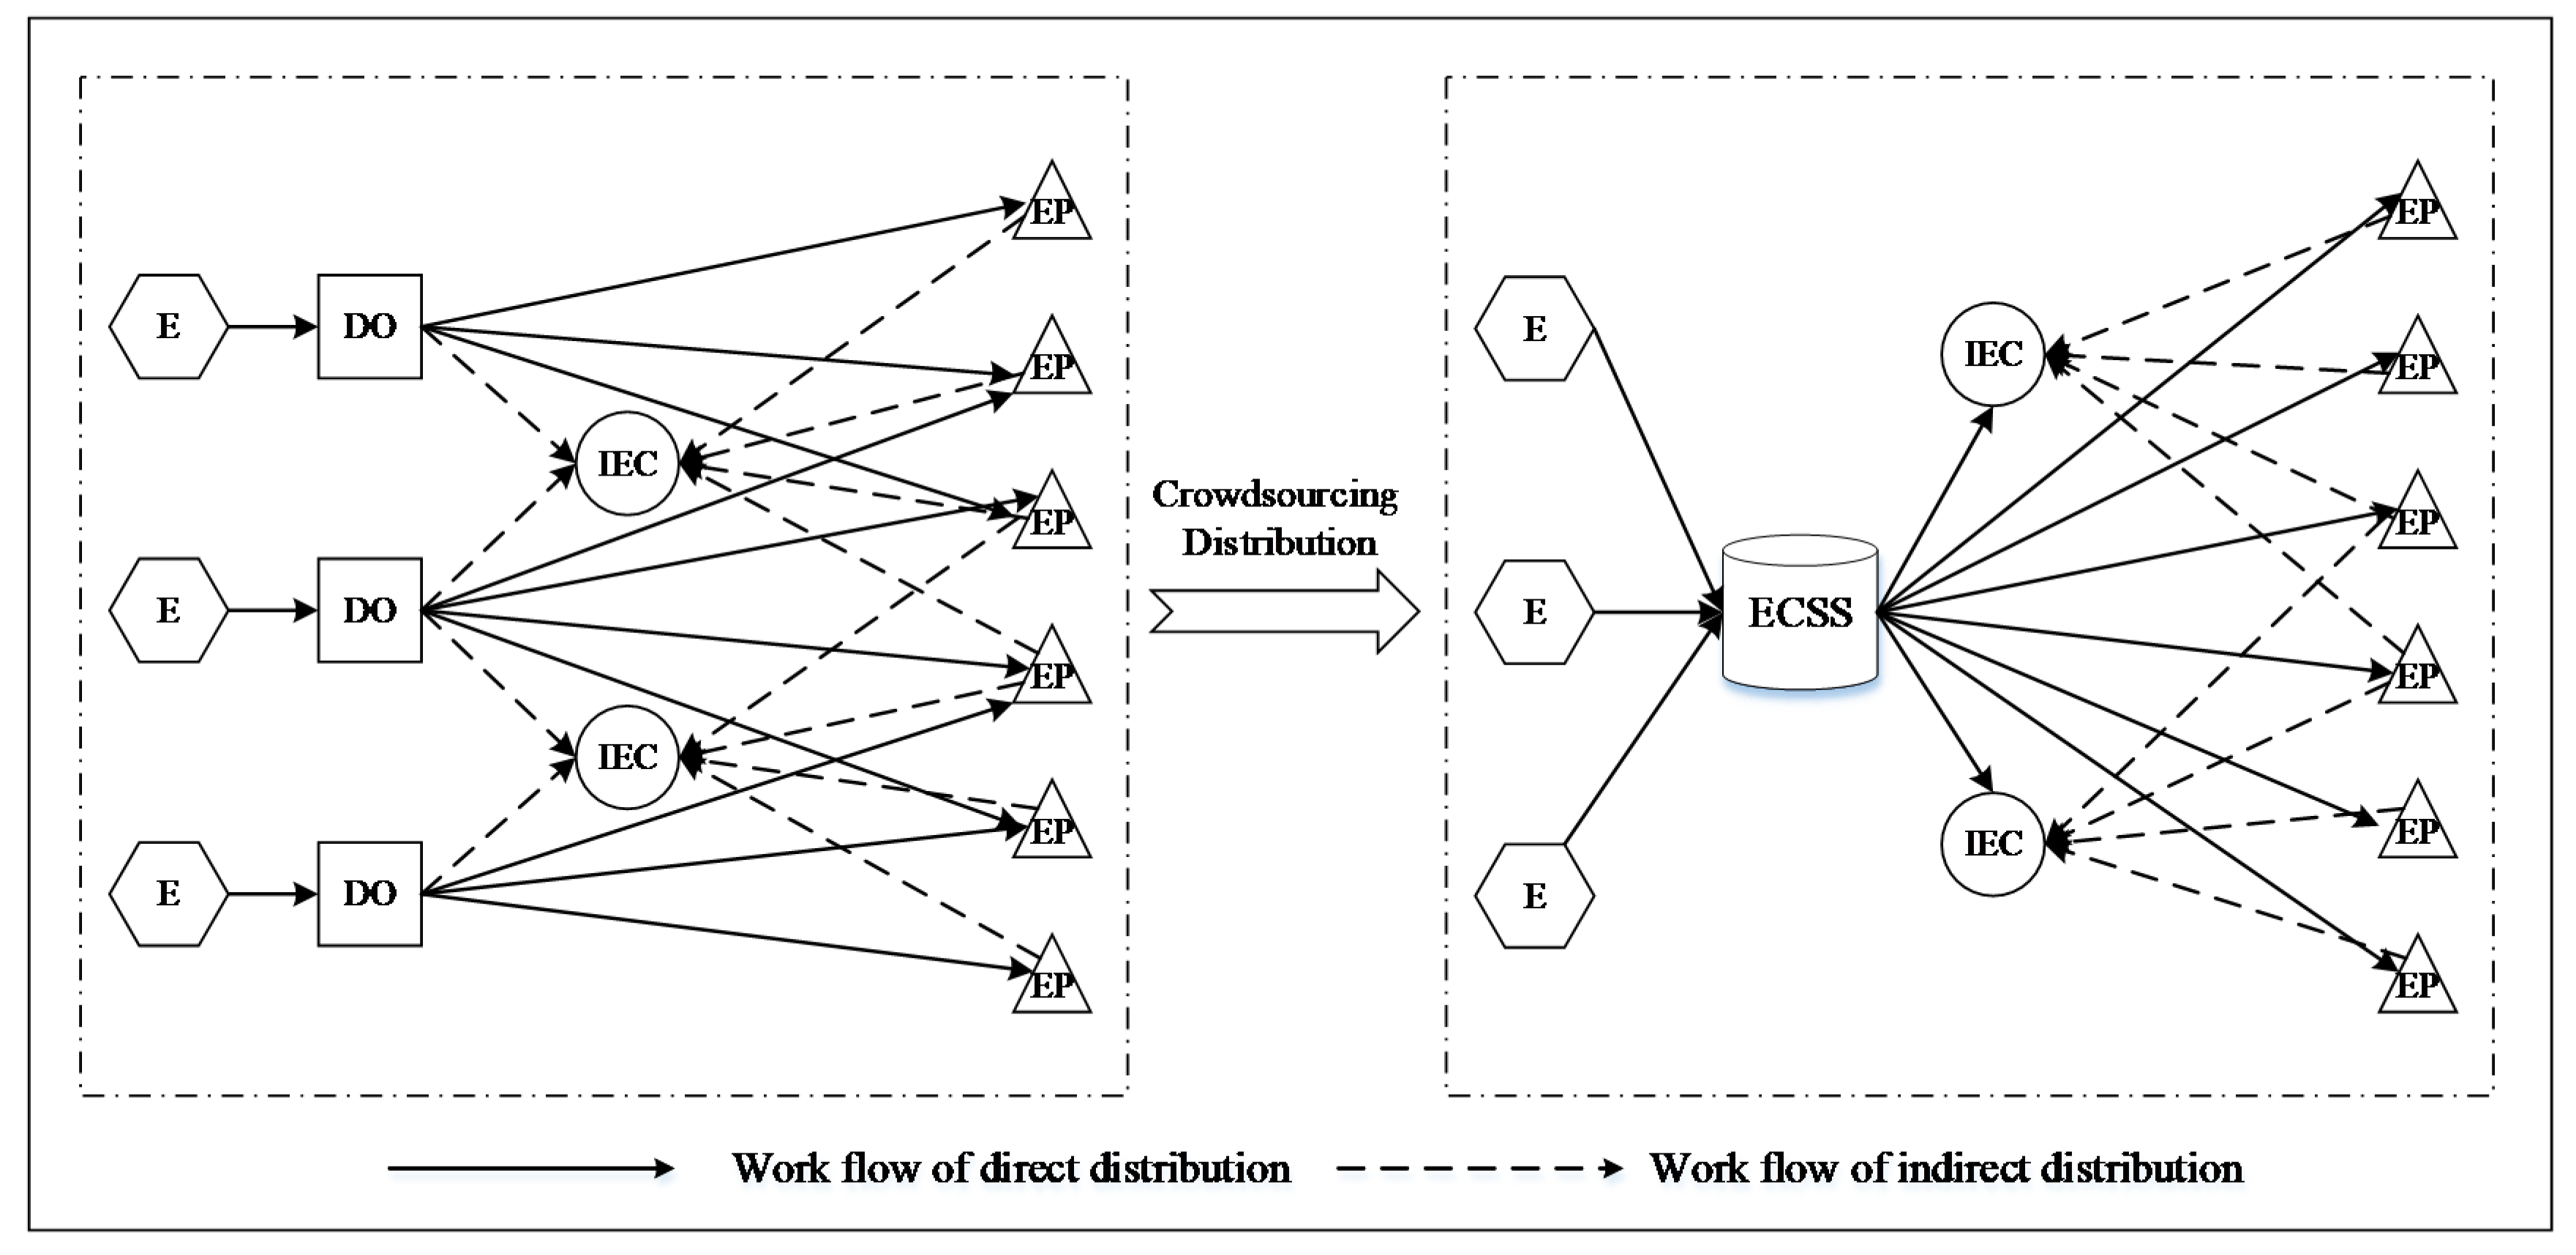
Figure 1. Workflow change under crowdsourcing distribution.
Sustainability 12 08312 g001
Figure 2. Example diagram of K-shell decomposition.
Sustainability 12 08312 g002
Figure 3. Example diagram of improved K-shell decomposition.
Sustainability 12 08312 g003
Figure 4. Addresses of end points (EPs) on Bei Tai Ping Zhuang Street in Haidian District, Beijing.
Sustainability 12 08312 g004
Figure 5. Addresses of distribution outlets (DOs) of the four express enterprises (A–D).
Sustainability 12 08312 g005
Figure 6. Addresses of intelligent express cabinets (IECs) of the three enterprises (a–c).
Sustainability 12 08312 g006
Figure 7. Distribution range of end crowdsourcing service stations (ECSSs) A1/C3.
Sustainability 12 08312 g007
Figure 8. Distribution range of ECSSs A1/C3/B4.
Sustainability 12 08312 g008
Figure 9. Comparison of carbon emissions before and after crowdsourcing for the end of the distribution.
Sustainability 12 08312 g009
Figure 10. Comparison of carbon emissions before and after crowdsourcing for the front-end of the distribution.
Sustainability 12 08312 g010
Figure 11. Comparison of carbon emissions before and after crowdsourcing distribution.
Sustainability 12 08312 g011
Table 1. Comparison of main distribution modes.
Distribution ModeMode IntroductionAdvantagesLimitations
Traditional modeCouriers deliver the expresses to the customers within the agreed time.(1) Conveniently defines the responsibility of damage and shortage.
(2) Meets specific needs such as payment collection.
(1) Delivery time is uncertain.
(2) Secondary delivery occurs.
(3) Setting up stalls outside colleges and communities.
Intelligent express cabinetCouriers temporarily store the express delivery in a cabinet, providing a 24-hour self-pickup service for customers.(1) 24-hour self-service, no time constraints.
(2) Secondary delivery reduced.
(3) The responsibility for damages and shortages can be defined through monitoring equipment.
(1) High cost of construction.
(2) Limited container capacity limits the size and quantity of expresses.
(3) Still not close to some customers, and pickup can be inconvenient.
CrowdsourcingEnterprises do not need to recruit their own express delivery teams, nor do they need to build outlets and purchase vehicles; instead, they utilize idle social manpower as couriers.(1) Integrate idle social manpower and reduce operation costs.
(2) Instant delivery can be achieved.
(3) Low inventory costs from occupying minimal enterprise warehouse space.
(1) Low professional degree of couriers.
(2) Difficult to ensure the personal safety and information security of customers.
(3) Possible lack of manpower.
(4) Difficult to determine the responsibility for package damage.
Third-party collectionCouriers deliver the expresses to the third-party collection point (community convenience store, property, courier station), and the customers pick up the packages themselves.(1) No construction and operation cost.
(2) Secondary delivery reduced.
(3) No limit on the size and quantity of expresses because of sufficient space.
(1) Difficult to define the responsibility of damage and shortage.
(2) High cost of construction.
(3) Still not close to some customers, and pickup may be inconvenient.
Table 2. Comparative results of the indices.
jDCCCBCIKC r i
i
DC10012
CC21227
BC20125
IKC10012
Table 3. Distribution relationship between DOs and EPs.
Express EnterpriseDOsEPs
AA17,8,9,10,11,12,13,14,15,16,17
A218,19,20,21,22,23,24,25,26,27,28,29,30,31,32,33,34,35,36,37
A31,2,3,4,5,6
BB11,2,3,4,5,6
B27,8,9,10
B318,19,20,21
B411,12,13,14,15,16,17,22,23,24,25,26,27,28,29,30,31,32,33,34,35,36,37
CC17,8,9,10,18,19,20,21
C21,2,3,4,5,6
C311,12,13,14,15,16,17
C422,23,24,25,26,27,28,29,30,31,32,33,34,35,36,37
DD11,2,3,4,5,6
D27,8,9,10,11,12,14,15,16,18,19,20,21
D313,17,22,23,24,25,26,27,28,29,30,31,32,33,34,35,36,37
Table 4. Distribution relationship between DOs and IECs.
Express EnterpriseDOsIECs
AA1a1, a2, a3, b8, b9, b10, b11, b12, b28, c3, c4, c5, c6
A2a4, b13, b14, b15, b16, b17, b18, b19, b20, b21, b22, b23, b24, b25, b26, b27, c7, c8, c9
A3b1, b2, b3, b4, b5, b6, b7, c1, c2
BB1b1, b2, b3, b4, b5, b6, b7, c1, c2
B2c3, c4, b9, b10, b11, b12
B3a4, b13, b14, c8
B4a1, a2, a3, b8, b15, b16, b17, b18, b19, b20, b21, b22, b23, b24, b25, b26, b27, b28, c5, c6, c7, c9
CC1a4, b9, b10, b11, b12, b13, b14, c3, c4, c8
C2b1, b2, b3, b4, b5, b6, b7, c1, c2
C3a1, a2, a3, b8, b28, c5, c6
C4b15, b16, b17, b18, b19, b20, b21, b22, b23, b24, b25, b26, b27, c7, c9
DD1b1, b2, b3, b4, b5, b6, b7, c1, c2
D2a4, b8, b9, b10, b11, b12, b13, b14, b28, c3, c4, c6, c8
D3a1, a2, a3, b15, b16, b17, b18, b19, b20, b21, b22, b23, b24, b25, b26, b27, c5, c7, c9
Table 5. Distribution relationship between IECs and EPs.
EnterpriseIECsEPsIECsEPs
aa113,17
a213,17
a317,32
a418
bb11,2b1522
b23b1633
b36b1733
b46b1825
b56b1925
b66b2026
b76b2129,30
b811b2230
b98,9b2331
b108,9b2434,35
b119,10b2535
b129,10b2636
b1318b2735
b1419b2816
cc13c615
c23c722
c37c820,21
c47c925,26,27
c511,12,13
Table 6. Number of inhabitants and average daily delivery demand of each EP.
No.Number of InhabitantsAverage Daily Delivery Demand
(Pieces)
No.Number of InhabitantsAverage Daily Delivery Demand
(Pieces)
12219646202569747
248441409212632766
327968132251201490
411,2003259232453714
514504222472022095
612,8003724251775516
72469718262633766
822006402747171372
924547142864751884
10894260291358395
112249654301253365
123277953313355976
1349291434323028881
141175342332389695
152412702342986869
1621946383570002037
17729021213653131546
18480013973739911161
191923559
Table 7. Index values of node centrality indices of DOs in the end network.
No.DOsDCCCBCIKC
1A10.263736260.000829400.1762805812
2A21.083333330.000599560.302720027
3A30.416666670.000625080.011257634
4B10.416666670.000673240.011257634
5B20.277777780.000801100.0039886012
6B30.222222220.000857810.002759463
7B41.250000000.000673000.359181949
8C10.500000000.000916100.0661311512
9C20.416666670.000674790.011257634
10C30.388888890.000861440.013558189
11C40.861111110.000380740.054090357
12D10.416666670.000514720.011257634
13D20.722222220.000890980.1777013612
14D31.027777780.000715630.138415519
Table 8. Node importance of DOs in the end network.
No.DOs D s + D s C s *
1D20.132365870.366446180.73463779
2A10.151284510.327205410.68382927
3B40.162946580.324893090.66598333
4C10.210880870.363581060.63290714
5C30.251700970.322456200.56161660
6A20.216795050.262357840.54754515
7D30.206372820.249158450.54696235
8B30.265610090.318029000.54490696
9B20.267504020.284833150.51568709
10C20.300533490.196479310.39532042
11B10.301088250.195447670.39362242
12A30.319501340.163431240.33841420
13D10.368830850.090317110.19670589
14C40.418349280.055046860.11628076
Table 9. EPs that each ECSS provides delivery services for.
zECSSEPs
z = 2A11,2,3,4,5,6,7,8,9,10,11,12,13,18,19
C314,15,16,17,20,21,22,23,24,25,26,27,28,29,30,31,32,33,34,35,36,37
z = 3A11,2,3,4,5,6,7,8,9,10,11,12,13,18,19
C314,15,16,17,20,21,22,23,24,25,26,32,33,34,37
B427,28,29,30,31,35,36
Table 10. Comparison of carbon emissions before and after crowdsourcing for the end of the distribution.
CO2 (kg)Reduction (kg)Percentage
Reduction
Traditional distribution19.76
Crowdsourcing distribution (z = 2)15.064.723.79%
Crowdsourcing distribution (z = 3)14.135.6328.49%
Table 11. Comparison of carbon emissions before and after crowdsourcing for the front-end of the distribution.
VansCO2 (kg)Reduction (kg)Percentage Reduction
Traditional distribution31243.18
Crowdsourcing distribution (z = 2)26203.4239.7616.35%
Crowdsourcing distribution (z = 3)26203.6239.5616.27%
Table 12. Carbon emissions before and after crowdsourcing distribution.
Number of VansLoading Rate
Traditional distribution3182.02%
Crowdsourcing distribution2697.79%
Reduction515.77%
Table 13. Carbon emissions before and after crowdsourcing distribution.
Front-End (kg)End (kg)Total (kg)
Traditional distribution243.1819.76262.94
Crowdsourcing distributionz = 2203.4215.06218.48
z = 3203.6214.13217.75
Reductionz = 239.764.7044.46
z = 339.565.6345.19
Percentage reductionz = 216.35%23.79%16.91%
z = 316.27%28.49%17.19%