Abstract
The human factor is becoming increasingly relevant for its role in industrial development; therefore, it is necessary to evaluate the machine–man–environment system in an integrated and not isolated way, as is commonly done, for evaluating the sustainability performance of manufacturing practices. For this reason, in this paper, an ergonomic triad model is proposed for calculating a novel Sustainable Work Index, (SWI), made up of the factors: human work, workstation design, organizational environment and sustainable environmental conditions. The methodology consists of defining the productive time, interviewing the workers, taking anthropometric measurements, assessing the environmental conditions, obtaining the indicators for each factor, calculating the index and interpreting the results to define improvement actions. The model was applied to a manufacturing industry obtaining a regular status with an index of 63.6%. Improvement actions were implemented, and it was possible to increase the index to 73.9%, which represents a good commitment of the company towards occupational health. The development of the new triad model to calculate the SWI will allow industries to visualize indicators of the interaction of the ergonomic triad, identify its current condition and propose actions to physically, organizationally and environmentally improve human well-being and system performance.
1. Introduction
The main objective of ergonomics is to develop and apply techniques for adapting man to his work and to find efficient and safe ways to optimize the well-being of employees and thus increase productivity. [1]. When talking about issues on man (human factor), machines (technical factor) and environment (sociotechnical factor), they cannot be treated independently and give individual solutions; on the contrary, they must seek the specific conditions of their interaction through an integrated ergonomic triad, whose essential factor is the individual; in other words, the result of the integration is a whole of common features that are above the individual characteristics of the factors, to humanize the other elements according to man [2], that is, to improve the design of machines or work areas, as well as to evaluate the environmental conditions to make human activity more comfortable and not act only trying to always adapt man to the machine or the environment, in such a way, that, the diseases derived from work do not increase in the long term.
On the other hand, sustainable development seeks to ensure that the needs of the current generation are met without affecting the ability of future generations to meet their own, development can be achieved as long as the environment, social and economic aspects are addressed jointly in the short, medium and long term. Corporate sustainability is a concept that initially focused only on environmental issues, companies and their current actions cover all three dimensions (economic, social environmental and environmental). The relationship between work and sustainability is still poorly understood, but there seems to be a natural synergy between sustainability and ergonomics, with the aim of understanding and optimizing the results of human–system interactions [3].
Ergonomics promotes sustainability through the presence of more humane companies, that is, healthier, safer, more comfortable and efficient, being the promotion of well-being at work one of the business objectives in the context of the discourse on sustainability. Taking health into account in business policies helps ensure sustainable production systems. The role of ergonomics in companies in the business sustainability environment can contribute to increasing the performance of the organization. Sustainable development includes social aspects among its objectives, where work and the worker are fundamental. Likewise, work can also benefit sustainable development, since workers are active agents in society [3].
There is a growing discussion about sustainability, initially focused on the societal level and, sometimes, especially with regard to environmental problems, now it can be seen that this topic is increasingly relevant for companies around the world and even the social dimension is becoming increasingly important [4]. Sustainable work is one that improves the organization’s performance and promotes professional development as well as workers’ health broadly and positively (not limited to the absence of illness, but in the sense of building health) and well-being. Thus, it fosters respect for and the development of intelligence and creativity (as opposed to alienating work) by performing work that has meaning and significance, understanding the profound importance of physical, cognitive and organizational issues, and above all, the importance of work to the development of culture [3,5].
The objective of this study was to generate a Sustainable Work Index (ITS) through the evaluation of the ergonomic triad model to identify quantitatively and qualitatively the interaction of human beings with their work, their work area and their environment, as well such as the company’s commitment to the welfare of its workers. This work is divided into the following sections: state of the art of the application of the ergonomic triad and its performance indicators, development of the phases of the new ergonomic triad model for the calculation of the sustainable work index, and an application case is presented in a manufacturing industry, where method engineering, physical ergonomics, organizational ergonomics, and environmental ergonomics tools were used.
2. State of Art
Industrialization has created a new environment for humankind; industries must deal and overcome challenges related to human well-being and system performance [6,7], therefore, the human factor plays a constant role in the development of industry 4.0 [8]. Some studies confirm the close relationships between ergonomics and quality and recommends integrating programs aimed at improving the quality of work and working conditions simultaneously [9]. Additionally, a literature review of the impact of human factors in the design and management of manufacturing operations on system quality performance, found that 46% of the studies reported on efforts to improve the human factor in the operating system, with quality improvements of up to 86% [10].
There are some works in the literature where they present the use of the ergonomic triad. In one of them, the Human–Machine–Environment Engineering (MESSE) system was applied to large-scale vessels throughout their life cycle [11]. In another work, the authors propose a method for evaluating the environment–man–machine system in a nuclear power plant based on virtual reality technology [12]. A further study establishes a comfort assessment framework for university libraries, through a survey for library readers that includes three aspects: workspace environment, physical environment (divided into light, thermal, acoustic and air) and environment of humanity, providing an important reference to improve the comfort of libraries [12].
The lack of applicable, industry specific indicators is among the main obstacles to measuring and improving the sustainability performance of manufacturing activities. Much of the related research has been carried out in developed countries, such as Europe and the USA, etc., and mainly for metal fabrication activities, but Ahmad and Wong developed weighted and comprehensive sustainability indicators (environmental, economic and social) for the food manufacturing industry in Malaysia [13]. In another investigation, a mathematical model was designed to find the best solution that combines safety, sustainability, high efficiency and low cost for an artificial bee colony [14].
There is extensive literature on the factors that affect human performance [15] and their impacts on productivity improvement programs in manufacturing companies [16]. In one of the investigations, work performance was evaluated; results showed that there are substantial relationships between the performance of employees, both in the degree of difficulty of the task and environmental conditions [17]. In addition, a model was developed in another study to investigate the effects of integrating human factors aspects to optimize the cost of a manufacturing system [18].
According to the literature, studies have been carried out on the factors of the ergonomic triad, focused on a single factor or the combination of two and in some cases the analysis of the three factors to seek to improve work performance. However, the sustainable work that seeks human well-being and therefore improves the performance of industries has not been measured, something that is essential for the industry when considering that “what can be measured can be improved” [19]. Although there is a wide variety of ergonomics applications and sustainable development literature, this relationship is still not well understood in company practices, therefore, the challenge is to promote new trends on sustainable work in industry through the construction of a healthy work environment, where work is adapted to human characteristics to ensure optimal conditions for the development of quality work and promote the well-being and professional development of workers and therefore organizational performance.
3. Materials and Methods
Ergonomics is a very broad discipline that is gaining strength in the industry; however, there are still companies that do not have an ergonomics department and the functions are in charge of the safety and hygiene departments and sometimes the staff is not certified or specialized in this area, probably due to the fact that companies mainly concentrate on achieving increased productivity and reducing costs, leaving aside the well-being of its workers, since it is difficult to visualize in the short term the diseases that can be generated in workers for working in an inappropriate environment. In accordance with the premise of what can be measured can be improved, indicators were sought that would demonstrate the impact of the interaction of the ergonomic triad centered on man, finding that the majority are focused on productivity or work performance indexes, where man’s participation is to improve his work technique to produce more, or to do more with less.
The main intention of this index is to generate a numerical value that reflects the current state of the relationship between man, his work area and the environment, in a comprehensive and not-isolated way, since it is well known that the application of ergonomics improves performance of the worker by offering a more comfortable environment. In this way, the companies could visualize an index and a qualitative value to determine the level of commitment towards the well-being of its workers.
To determine the indicators, factors and the index, a ratio scale was used, calculating the percentages for each one. However, the indicators were evaluated from nominal variables, regarding whether it complies or does not comply, for example, the indicator of work stations (ratio variable) is evaluated from nominal variables such as: the work surface is adjustable, there is enough space for the legs, a bench is provided, the sitting and standing positions are alternated, the operator has a footrest and the operator has an anti-fatigue mat, therefore, obtaining 3 answers does comply with a maximum possible of 6, and where the non-compliance is represented by zero since the absence of the characteristic in question is important, the indicator would have a value of 50% of the fulfillment of the characteristics that are evaluated.
In addition, a rating scale was designed to indicate the degree to which the characteristics of the ergonomic triad factors are present in the manufacturing industry, using a descriptive scale: poor, fair, good, very good and excellent, as well as a numerical scale by intervals 0–59, 60–69, 70–79, 80–89 and 90–100.
The new ergonomic triad model for sustainable work (see Figure 1) is composed of 6 phases in which a study of process times, interviews with personnel, an anthropometric analysis and the measurement of environmental conditions are carried out to generate 8 indicators that allow the calculation of 4 factors related to the interaction of the ergonomic triad to generate a sustainable work index and based on the results propose improvement actions to strengthen the index and provide optimal sustainable work for workers.
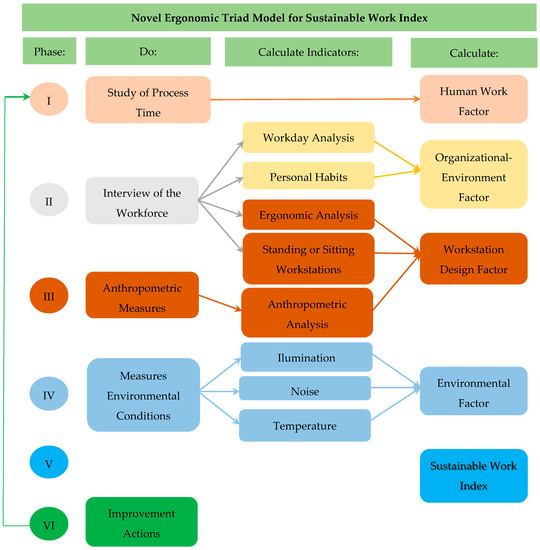
Figure 1.
Novel Ergonomic Triad Model for Sustainable Work Index.
The phases of the new ergonomic triad model to calculate a sustainable work index are:
3.1. Study of Process Times
Carry out a time study to know the standard time of the process, as well as to classify the activities: those that add value (operations), those that do not add value, but are necessary (inspection and transportation) and those that do not add value are unnecessary (delays or idle time). The activities that add value and the activities that do not add necessary value correspond to the productive time of the worker and the activities that do not add unnecessary value correspond to the unproductive time of the worker, specifically when dealing with idle time, that is, the time in which the operator is not carrying out any activity because he does not have the necessary elements to continue with his work or by waiting for the machine to finish the process, therefore, they seek to reduce or eliminate these times to optimize the process.
Calculate Human Work Factor (HWF). This factor refers to the interaction between man and work, for this the operations and how they are carried out must be known [20,21]. For this factor is indicated the productive time of the operator according to the time study, as shown in Equation (1). Ideal value of 100%.
Equation (1). Human Work Factor.
3.2. Interview of the Workforce
Conduct an interview that is structured in four sections: the first section is used to collect the worker’s data: gender, age, seniority and work shift; the second section of the interview personal habits regarding their diet are evaluated, if they do physical-athletic exercise, calisthenics exercises, active rest or work gymnastics and if they have annual medical examinations; the third section of the interview, aims to collect information to carry out an ergonomic analysis. Questions are focused in discomfort caused by work, in which part of the body have they had discomfort and how they describe the characteristics of their environment, and the last section of the interview is about the working condition: standing or sitting work. The results of the interviews are averaged to determine the indicators for each section.
With the answers from the first section of the interview, the Workday Analysis (WA) is calculated, considering the work shifts, the rotation speed, the direction of rotation and the shift extension are considered (Table 1). Each type indicates its consequences: if it is recommended, a grade of 100% is assigned and if it is not recommended, a 0 is assigned. In the status column, indicate Yes or No if the company uses that type of shift and assign the percentage correspondent. If not used, Not Applicable (NA) is indicated.

Table 1.
Workday Analysis.
With the responses of the second section of the interview, the Personnel Habits (HP), it is evaluated if the operators have the habit of having breakfast, eating three times a day and in a balanced way, drinking at least 2 L of water a day, if they drink alcoholic beverages, do physical exercise, warm up before work, and have medical tests.
Calculate Organizational-Environment Factor (OEF). It is related to man’s interaction with the design of working hours and shift work [22,23,24,25]. Equation (2) is applied with the indicators obtained in the second step regarding the Personnel Habits (PH) and the Workday Analysis (WA); 100% ideal value.
Equation (2). Organizational Environment Factor.
With the answers of the third section of the interview, it is calculated Ergonomic Analysis (EA), assesses the perception of the operator towards their work, if they considers that they are comfortable or have presented discomfort, if the work is light, adequate or heavy and in general how they feel working in the environmental conditions that provides the company.
With the answers of the four section of the interview, it is calculated Standing or Sitting Workstations (SW), if the operators work standing, it is evaluated if the work surface is adjustable, if there is enough space for the legs, if a bench is provided to sit or stand with adjustable height, if the sitting and standing positions alternate and they do have a footrest. If the operators work seated, it is evaluated if the chair adjusts easily, if the cover of the station is adjustable and if the work periods alternate with rest periods.
3.3. Anthropometric Measure
Identify the anthropometric variables necessary to size the workstation, such as heights, widths, extension, among others; define the measurement instruments according to each variable; use the direct measurement method; generate anthropometric data expressed as percentiles, that is, the percentage of individuals in a given population with one dimension, to compare with current measurements in the manufacturing cell. According to the results of the Anthropometric Analysis (AA), a percentage is determined for each measure, if the percentile corresponds to 100%, if it does not comply it is 0 and the average is obtained between the variables used.
Calculate Workstation Design Factor (WDF). It does not consider machine preparations or preventive maintenance times, focuses on human interaction with the machine or with the design of its workstation; for this, it is necessary to carry out ergonomic, workstation and anthropometric analysis [26,27,28]. This factor is calculated with the indicators EA, SW and AA obtained in the second and third step, as shown in Equation (3). Ideal value 100%.
Equation (3). Workstation Design Factor.
3.4. Measure Environmental Conditions
The main environmental conditions to be measured are lighting levels, sound levels, thermal environment and any other condition considered important in the work area. After determining the environmental conditions to be evaluated, the Official Standard that applies to each of them should be consulted. For this, each country establishes the safety and hygiene conditions that work centers must comply with through its Official Standards.
To carry out the measurements, a manufacturing cell layout must be made and divided into a spaced grid, such as a 4 by 5-point matrix, to obtain 20 points distributed over the layout of the manufacturing cell (see Figure 2), to take the reading of illumination, noise and temperature at each of the indicated points.
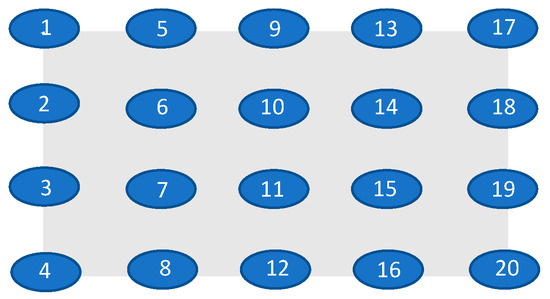
Figure 2.
Four by five-point work in manufacturing cell.
Write the readings in a format such as the one shown in Table 2, and then, in MS Excel, make the surface graphs, to see the projection of the environmental condition in the manufacturing cell in order to identify areas of opportunity for improvement.
Table 2.
Data record format of environmental conditions.
In accordance with the Official Standard, define the visual tasks of the workplace that apply and indicate the average of the data for each task, to calculate the lighting by task, see Equation (4):
Equation (4). Lighting by visual task of the workplace.
The ideal lighting value per task is ≥1. If the result is ≥1, it meets the minimum level required by the Official Standard and is assigned 100%, if the value is less than 1, it is not met and a value of 0 is assigned.
To calculate the noise (Equation (5)) the work areas and the noise exposure level (NEL) must be identified according to the Official Standard, then the average of the readings for each area should be indicated.
Equation (5). Noise by area.
The ideal value of noise per area is ≤1, if the result is less than 1 it meets the maximum permissible level required by the Official Standard and 100% is assigned, if the value is greater than 1 it does not comply and assign 0.
To calculate the temperature (Equation (6)) the work area is defined; the work regime: light, moderate or heavy; and the exposure time to determine the maximum temperature in °C according to the Official Standard, the average of the data for each work area is determined.
Equation (6). Temperature by area.
The ideal exposure value is ≤1, if the result is less than 1 it meets the maximum permissible level required by the Official Standard and is assigned 100%, if the value is greater than 1 it does not comply and assigned 0.
After obtaining the values of the environmental conditions, the indicator is calculated considering all the measurements as shown in Equation (7).
Equation (7). Environmental Conditions Indicators.
Calculate Environmental Conditions Factor (ECF). It refers to man’s interaction with the physical conditions that surround him and that influence his performance when performing various activities [29,30]. This factor is calculated with the indicators of illumination, noise, temperature or another factor that is consider important such as vibration, etc., as shown Equation (8); 100% ideal value.
Equation (8). Environmental Conditions Factor.
3.5. Calculate the Sustainable Work Index
With the results of the four factors, through Equation (9), the Sustainable Work Index is calculated in such a way that a numerical value is obtained and through Table 3 the index can be interpreted in one of the sustainable work status, which represents the degree to which the characteristics of the factors are present of the ergonomic triad in the manufacturing industry, which are fundamental for the development of sustainable work.
Table 3.
Status of Sustainable Work.
Equation (9). Sustainable Work Index.
3.6. Improvement Actions
The factors can be improved, mainly the factor that has obtained a deficient or regular result, Table 4 shows the actions and improvement tools that can be used for each of the factors of the ergonomic triad. Once the relevant improvement actions have been carried out, the new sustainable work index is calculated.
Table 4.
Improvement actions based on the ergonomic triad.
4. Results
The model was applied to a manufacturing industry, in four equal production cells. Each cell is conformed by two operators, one that operates the lathe and another that runs the grinding machine; both carry out the inspection of the part. Each operator has a 10 min break and 30 min lunch time. In total, there are 16 operators whose workdays are 4 × 3, that is, they work 4 days and rest 3 days, with 12 h of work per day.
The phases to calculate the Sustainable Work Index were carried out:
4.1. Study of Process Times
The time study was carried out through a man-machine diagram and it was identified that the operators only have a productive time per day of 37% because they must wait for each machine to finish the process. Accordingly, the Human Work Factor is 37%.
4.2. Interview of the Workforce
The interview was conducted with the operators of the manufacturing cells, 50% were from the morning shift and the other 50% from the night shift, 86% were men and 14% women, 64% were between 31 and 45 years old. Seniority is highly variable from a few months to 9 years. In the manufacturing cells they work standing up and 100% of the workers indicated that the work surface is more or less at the height of the elbows and that they have enough room for their feet; they do not have a bench to sit on and they do not alternate positions to sit and stand. The results of the interviews were averaged to determine the indicators shown in Table 5.
Table 5.
Indicators of the Workday Analysis (WA) and Personal Habits (PH).
The indicator of the workday analysis is 25%, this is due to the fact that the morning and night shifts are worked without shift rotation and although a reduced week is handled, (which is recommended), the extension of the shift is 12 h, which is not recommended. The personal habits indicator denotes that 60% of workers have good habits regarding their diet, physical conditioning and health care. With these indicators, the organizational environment factor is calculated:
Equation (2). Organizational Environment Factor.
The results of the third and fourth sections of the interview are averaged to determine the following indicators shown in Table 6.
Table 6.
Indicators of the Ergonomic Analysis (EA) and Standing Workstations (SW).
4.3. Anthropometric Measure
For the anthropometric analysis, three measuring posts were used; one person took the measurements and another person noted and verified the position of the operator and the proper use of the instrument.
- Height measurement post: the height rod was used and full height, eye height, shoulder height, height of elbows extended, and final buttock-floor height were measured. The operator stood on the height rod, with balanced shoulders and in the Frankfurt plane.
- Width measuring post: the operator stands up with arms extended, a pachymeter was used to measure the width of the shoulders, thorax and hips. The operator then raised both arms to 90° from his body and the person taking the measurements stood behind the operator to measure chest width.
- Extension measuring post: the operator sat next to a flat surface and extended the arms to measure the maximum extension and then placed the elbows next to the flat surface and extended the arms to measure the minimum extension, the flex meter was used to perform measurements.
The percentiles were calculated to compare them against the current measurements of the manufacturing cell. According to the results, the indicator of the anthropometric analysis was determined as shown in Table 7.
Table 7.
Anthropometric Analysis Indicator (AA).
The ergonomic analysis indicator show that 75% of workers are comfortable with their work area; the job position indicator is 50%, given that operators work standing up for a 12-h shift and have no footrests or bench to alternate between sitting and standing positions; and the anthropometric analysis indicator is 100%, given that the current measurements of the manufacturing cells comply with the percentiles of the operators. With these indicators the workstation design factor is calculated:
Equation (3). Workstation Design Factor.
4.4. Measure Environmental Conditions
In the analysis of environmental conditions, lighting, noise and temperature were measured. To perform the measurements, the distribution of the manufacturing cells was divided into a 4 by 5-point matrix.
Illumination was measured using the lux meter at the height of the work plane, no shadows were cast on the lux meter when the measurements were taken. It was evaluated according to the Official Mexican Standard [31]. The five visual tasks of the workstation were: interior, simple visual requirement, moderate distinction of details (lathe), moderate distinction of details (rectified) and clear distinction of details (inspection). Equation (4) calculates the lighting index for each task, for example:
Equation (4). Lighting by visual task of the workplace.
With Equation (7) an illumination indicator of 1.11 was calculated since the result is ≥1, it meets the minimum level required by the Official Mexican Standard and 100% is assigned.
Equation (7). Environmental Conditions Indicators.
Using the sound level meter, measurements of the maximum sound intensity were conducted at one meter from the height of the work surface; the results were recorded. Care was taken for the imaginary line connecting the sound sources not interfering with the operator’s body with the microphone of the sound level meter. Likewise, the position of the sound level meter at the measurement points was always vertical with the pick-up microphone raised. The value is read only when the indicating monitor stabilizes. The following work areas were evaluated according to the Official Mexican Standard [32]: cell, lathe, grinding and inspection, for example:
Equation (5). Noise by area.
With Equation (7), a noise indicator of 0.94 was calculated as the result is ≤1, it meets with the maximum permissible level required by the Official Standard and is assigned 100%.
Equation (7). Environmental Conditions Indicators.
The temperature was measured with a thermometer and the following work areas were evaluated according to the Official Mexican Standard [33,34]: cell, lathe, grinding and inspection, for example:
Equation (6). Temperature by area.
With Equation (7), a temperature indicator of 0.90 was calculated since the result is ≤1, it meets the maximum permissible level required by the Official Standard and 100% is assigned.
Equation (7). Environmental Conditions Indicators.
Table 8 shows the results of the environmental conditions indicators and the percentage corresponding to each one, as well as the calculation of the environmental conditions factor.
Table 8.
Environmental Conditions Factor.
4.5. Calculate the Sustainable Work Index
The human work factor is 37%, due to the operator having a great deal of idle time, the organizational environment factor is 42.5% due to the fact that a night shift is worked without shift rotation and a 12-h day shift. Both factors obtained a percentage lower than 70%, therefore, they are considered areas of opportunity. The workstation design factor is 75% because workers work standing up and do not have a footrest or bench to allow them to alternate between standing and sitting, which is exhausting. The environmental conditions factor is 100% given that it meets the requirements of official standards: lighting is adequate for each type of visual task; noise does not exceed the maximum allowed and they are also provided with ear plugs; and the temperature is adequate. Despite being a machining area, it has air conditioning which is of great benefit to workers because the company is located in a city that has very extreme temperatures. Therefore, the Sustainable Work Index of the company is 63.6% and its status is regular (Table 9), which means that the company has some deficiencies that must be improved to offer a more favorable environment for the worker so that they can perform your work satisfactorily.
Table 9.
Sustainable Work Index.
4.6. Improvement Actions
The improvement actions for the human work factor were to reduce the idle time of 63% caused by waiting for the machine, with the man–machine diagram it was detected that a single operator could handle the lathe and the grinding machine, therefore, idle time decreased 41%, now only 50% of the personnel is required and productive time is 78%.
For the organizational environment factor, it was suggested to use shift rotation with a fast speed, with a clockwise direction: morning–afternoon–night and working a reduced week 4 × 3, with 10 h work day, as well as creating awareness in operators of the importance of eating breakfast, eat a balanced meal, sleep well, drink enough water, do stretching exercises prior to the start of the workday (calisthenics), as well as to incorporate work gymnastics during the workday, which only lasts 7 min. Physical activity carried out in the workplace improves the effectiveness and efficiency of workers, because the employees who participate in the program feel relieved from muscle discomfort and have the courage to face the work routine.
Table 10 shows the calculation of the new SWI, where it can be seen that it went up one level on the evaluation scale, obtaining a good status, because the human operation factor increased by 41%. Now the operator remains busy longer and he walks from one machine to another, which allows him to have more movement on his legs. The organizational environment factor remains in red but is intended to perform actions such as calisthenics or work gymnastics for the well-being of the workers.
Table 10.
Sustainable Work Index.
The main result is a new ergonomic triad model aimed to calculate a sustainable work index. Through its application in a manufacturing company it was possible to identify the status of sustainable work and it was improved, therefore, it was shown that it is a functional, comprehensive and simple model.
5. Discussion
Productivity and work performance indexes exist that measure the achievements of the organization; however, a gap was detected in the literature regarding the lack of an index that measures the company’s commitment to its human capital, by offering a job and work environment that benefit the well-being of its employees.
Ergonomics has gained greater relevance in the industry and its ergonomic methods have been applied to adapt work to man, however, a reference value that represents the level of sustainable work of the company was not identified—that is, how the operator interacts with his work, machines, and the environment, for which a new ergonomic triad model was proposed that comprehensively evaluates the system and allows identifying areas of opportunity to improve the worker’s well-being and therefore the company’s performance.
The new ergonomic triad model assesses the system in a comprehensive manner, and the sustainable work index provides a quantitative value that allows measuring the degree of compliance with the factors, as well as the status of sustainable work in the industry. In addition to allowing the identification of areas to improve the well-being of the worker and therefore the performance of the company, which can promote an increase in the index of sustainable work in favor of occupational health.
The model is simple and practical and other components that are convenient according to the needs of the company can be added to each factor; for example, in the anthropometric analysis, all the anthropometric variables that are considered necessary according to the job position and in the analysis of environmental conditions, lighting, noise, temperature, vibrations and other atmospheric characteristics required by the company can be measured.
This new model could be very useful for companies since it will allow them to see in the short term the sum of their efforts on behalf of the worker, as well as to detect what they need to carry out or improve so that in the long term there are no effects on the workers’ health.
Future work will incorporate a cognitive ergonomics assessment instrument, which is a bit more complicated, because it involves psychological and mental processes.
6. Conclusions
The research began with the purpose of demonstrating the importance of the application of ergonomics in the industry. Usually in the industry what draws the attention of managers is to be able to show the projected benefit with numbers. When reviewing the literature, we found that although is application is very extensive, most of it was about ergonomic evaluation methods of jobs or of musculoskeletal disorders generated by work and very little about the analysis of the machine–man–environment system, called also ergonomic triad.
Trying to find how to define a number or a value, it was thought to use terms such as productivity and work performance, but these focus on the number of parts that are produced, the speed or ability to develop an operation, the optimal use of resources, etc. Finally, the concept of sustainable work was found, which seeks to improve the performance of the organization and promote professional development and the health of workers. Therefore, an area of opportunity was seen if a value could be generated that would represent sustainable work through the integration of the human-centered ergonomic triad, because this system promotes occupational health through improvements in the work area and environment. For this, four factors emerged: human work, workstation design, organizational environment and environmental conditions, thus forming the ergonomic triad model for sustainable work.
In addition, a Sustainable Work Index (SWI) was generated to quantitatively and qualitatively identify the interaction of human beings with their work, their work area and their environment, as well as the company’s commitment to the well-being of its workers.
To measure each of the factors, indicators were established for: ergonomic analysis, standing or sitting workstation, workday analysis, personal habits, anthropometric analysis, lighting, noise and temperature, and a sequence of steps to follow was established to calculate the sustainable work index.
Finally, a quantitative value in percentage and a qualitative value are obtained through an evaluation scale of five levels: poor, fair, good, very good and excellent to indicate the status of the company with respect to its commitment to the worker’s well-being and system performance. Furthermore, this evaluation system identifies areas of opportunity, provides improvement actions and suggest tools to be used for each of the factors of the ergonomic triad. Therefore, this model can be of great help for the manufacturing industry to promote sustainable work, showing a value that represents the current situation and that even allows managing the existence of an ergonomics department in the company, or staff that focus in this area, to prioritize sustainability at work.
Author Contributions
Conceptualization: M.M.-R. and M.G.-S.-R.; methodology: M.M.-R. and A.G.-A.; validation, M.M.-R. and I.M.-M.; formal analysis, I.M.-M. and C.R.N.-G.; investigation, M.M.-R.; writing—original draft preparation, M.M.-R.; writing—review and editing, M.G.-S.-R. and A.G.-A. All authors have read and agreed to the final version of the manuscript.
Funding
The authors received no financial support for the research, authorship, and/or publication of this article.
Acknowledgments
Authors are greatly grateful to the Universidad Autónoma de Baja California for facilitating access and use of their facilities and equipment to carry out this research.
Conflicts of Interest
The authors declared no potential conflicts of interest with respect to the research, authorship, and/or publication of this article.
References
- Dos Santos, Z.G.; Vieira, L.; Balbinotti, G. Lean Manufacturing and Ergonomic Working Conditions in the Automotive Industry. Procedia Manuf. 2015, 3, 5947–5954. [Google Scholar] [CrossRef]
- Cavassa, C.R. Ergonomía y Productividad, 2a ed.; LIMUSA: México City, México, 2016; pp. 16–17. [Google Scholar]
- Bolis, I.; Brunoro, C.M.; Sznelwar, L.I. Mapping the relationships between work and sustainability and the opportunities for ergonomic action. Appl. Ergon. 2014, 45, 1225–1239. [Google Scholar] [CrossRef] [PubMed]
- Sobhani, A.; Wahab, M.I.M.; Neumann, W.P. An innovative modeling method to evaluate human factor effects on the performance of manufacturing systems. IEEE Int. Conf. Ind. Eng. Eng. Manag. 2015, 130–134. [Google Scholar] [CrossRef]
- Zink, K.J. Designing sustainable work systems: The need for a systems approach. Appl. Ergon. 2014, 45, 126–132. [Google Scholar] [CrossRef] [PubMed]
- Kadir, B.A.; Broberg, O. Human well-being and system performance in the transition to industry 4.0. Int. J. Ind. Ergon. 2020, 76, 102936. [Google Scholar] [CrossRef]
- Dul, J.; Bruder, R.; Buckle, P.; Carayon, P.; Falzon, P.; Marras, W.S.; Wilson, J.R.; van der Doelen, B. A strategy for human factors/ergonomics: Developing the discipline and profession. Ergonomics 2012, 55, 377–395. [Google Scholar] [CrossRef]
- Wilson, J.R. Fundamentals of ergonomics in theory and practice. Appl. Ergon. 2000, 31, 557–567. [Google Scholar] [CrossRef]
- Eklund, J.A.E. Relationships between ergonomics and quality in assembly work. Appl. Ergon. 1995, 26, 15–20. [Google Scholar] [CrossRef]
- Kolus, A.; Wells, R.; Neumann, P. Production quality and human factors engineering: A systematic review and theoretical framework. Appl. Ergon. 2018, 73, 55–89. [Google Scholar] [CrossRef]
- Shang, Z.; Zhu, S.F.; Qiu, C.H. Framework of man-machine-environment application system engineering throughout life cycle of large scale vessel. Key Eng. Mater. 2014, 572, 107–110. [Google Scholar] [CrossRef]
- Sun, L.; Liu, Z.; Jia, M.; Zhao, Q. Human-Machine-Environment System Evaluation in Nuclear Power Plant Based on Virtual Reality Technology. In Man-Machine-Environment System Engineering, Lecture Notes in Electrical Engineering; Long, S., Dhillon, B.S., Eds.; Springer Nature, Singapore Pte Ltd.: Singapore, 2020; Volume 576, pp. 913–920. [Google Scholar] [CrossRef]
- Ahmad, S.; Wong, K.Y. Development of weighted triple-bottom line sustainability indicators for the Malaysian food manufacturing industry using the Delphi method. J. Clean. Prod. 2019, 229, 1167–1182. [Google Scholar] [CrossRef]
- Li, J.; Tan, X.; Li, J. Research on Dynamic Facility Layout Problem of Manufacturing Unit Considering Human Factors. Math. Probl. Eng. 2018, 2018. [Google Scholar] [CrossRef]
- Muhs, K.S.; Karwowski, W.; Kern, D. Temporal variability in human performance: A systematic literature review. Int. J. Ind. Ergon. 2018, 64, 31–50. [Google Scholar] [CrossRef]
- Bashir, H.A.; Alzebdeh, K.; Al Riyami, A.M.A. Factor Analysis of Obstacles Restraining Productivity Improvement Programs in Manufacturing Enterprises in Oman. J. Ind. Eng. 2014, 2014, 1–7. [Google Scholar] [CrossRef]
- Kahya, E. The effects of job characteristics and working conditions on job performance. Int. J. Ind. Ergon. 2007, 37, 515–523. [Google Scholar] [CrossRef]
- Brunoro, C.M.; Bolis, I.; Sigahi, T.F.A.C.; Kawasaki, B.C.; Sznelwar, L.I. Defining the meaning of ‘sustainable work’ from activity-centered ergonomics and psychodynamics of Work’s perspectives. Appl. Ergon. 2020, 89, 103209. [Google Scholar] [CrossRef]
- Muthiah, K.M.N.; Huang, S.H. A review of literature on manufacturing systems productivity measurement and improvement. Int. J. Ind. Syst. Eng. 2006, 1, 461–484. [Google Scholar] [CrossRef]
- Hartanti, L.P.S. Work measurement approach to determine standard time in assembly line. Int. J. Manag. Appl. Sci. 2016, 2, 192–195. [Google Scholar]
- Mor, R.S.; Bhardwaj, A.; Singh, S.; Sachdeva, A. Productivity gains through standardization-of-work in a manufacturing company. J. Manuf. Technol. Manag. 2019, 30, 899–919. [Google Scholar] [CrossRef]
- Nabe-Nielsen, K.; Thielen, K.; Nygaard, E.; Thorsen, S.V.; Diderichsen, F. Demand-specific work ability, poor health and working conditions in middle-aged full-time employees. Appl. Ergon. 2014, 45, 1174–1180. [Google Scholar] [CrossRef]
- Moussavi, S.E.; Zare, M.; Mahdjoub, M.; Grunder, O. Balancing high operator’s workload through a new job rotation approach: Application to an automotive assembly line. Int. J. Ind. Ergon. 2019, 71, 136–144. [Google Scholar] [CrossRef]
- Ansiau, D.; Wild, P.; Niezborala, M.; Rouch, I.; Marquié, J.C. Effects of working conditions and sleep of the previous day on cognitive performance. Appl. Ergon. 2008, 39, 99–106. [Google Scholar] [CrossRef] [PubMed]
- Duchon, J.C.; Smith, T.J.; Keran, C.M.; Koehler, E.J. Psychophysiological manifestations of performance during work on extended workshifts. Int. J. Ind. Ergon. 1997, 20, 39–49. [Google Scholar] [CrossRef]
- Battini, D.; Faccio, M.; Persona, A.; Sgarbossa, F. New methodological framework to improve productivity and ergonomics in assembly system design. Int. J. Ind. Ergon. 2011, 41, 30–42. [Google Scholar] [CrossRef]
- Dewangan, C.P.; Singh, A.K. Ergonomic Study and Design of the Pulpit of a Wire Rod Mill at an Integrated Steel Plant. J. Ind. Eng. 2015, 2015, 1–11. [Google Scholar] [CrossRef]
- Saptari, A.; Lai, W.S.; Salleh, M.R. Jig Design, Assembly Line Design and Work Station Design and their Effect to Productivity. Jor. J. Mech. Ind. Eng. 2011, 5, 9–16. [Google Scholar]
- Hoffmeister, K.; Gibbons, A.; Schwatka, N.; Rosecrance, J. Ergonomics Climate Assessment: A measure of operational performance and employee well-being. Appl. Ergon. 2015, 50, 160–169. [Google Scholar] [CrossRef]
- Parsons, K.C. Environmental ergonomics: A review of principles, methods and models. Appl. Ergon. 2000, 581–594. [Google Scholar] [CrossRef]
- Norma Oficial Mexicana NOM-025-STPS-2008, Condiciones de Iluminación en los Centros de Trabajo. Diario Oficial de la Federación, México. 2008. Available online: http://asinom.stps.gob.mx:8145/upload/noms/Nom-025.pdf (accessed on 30 September 2020).
- Norma Oficial Mexicana NOM-011-STPS-2001, Condiciones de Seguridad e Higiene en los Centros de Trabajo donde se genere Ruido. Diario Oficial de la Federación, México. 2011. Available online: http://www.dof.gob.mx/nota_detalle.php?codigo=734536&fecha=17/04/2002 (accessed on 30 September 2020).
- Norma Oficial Mexicana NOM-001-STPS-2008, Edificios. Diario Oficial de la Federación, México. 2008. Available online: http://www.stps.gob.mx/bp/secciones/dgsst/normatividad/normas/Nom-001.pdf (accessed on 30 September 2020).
- Norma Oficial Mexicana NOM-015-STPS-2001, Condiciones Térmicas Elevadas o Abatidas-Condiciones de Seguridad e Higiene. Diario Oficial de la Federación, México. 2001. Available online: http://asinom.stps.gob.mx:8145/upload/noms/Nom-015.pdf (accessed on 30 September 2020).


© 2020 by the authors. Licensee MDPI, Basel, Switzerland. This article is an open access article distributed under the terms and conditions of the Creative Commons Attribution (CC BY) license (http://creativecommons.org/licenses/by/4.0/).