Article

Analysis of the Value of Information and Coordination in a Dyadic Closed Loop Supply Chain

by
Juan Pedro Sepúlveda-Rojas
* and
Rodrigo Ternero
Industrial Engineering Department, Universidad de Santiago de Chile, Santiago CP 7254758, Chile
*
Author to whom correspondence should be addressed.
Sustainability 2020, 12(20), 8398; https://doi.org/10.3390/su12208398
Submission received: 28 July 2020 / Revised: 1 September 2020 / Accepted: 14 September 2020 / Published: 13 October 2020
(This article belongs to the Section Economic and Business Aspects of Sustainability)

Abstract

:
Purpose: This article analyzes the value of information and coordination in a closed loop supply chain (CLSC) and discusses the benefits of a global or local optimization approach and the impact of uncertainty. Methodology: A theoretical dyadic closed loop supply chain is analyzed where the manufacturer re-manufactures products returned by customers, producing “as good as new products” for the retailer. Twelve coordination scenarios were analyzed. For the definition of these scenarios, a framework based on two criteria was proposed: value of information and perimeter of decision making. Findings: Information on returns leads to lower costs than information on demand. In the presence of complete or partial coordination between the actors in the supply chain, it is preferable to have low product return rates. However, if we are in the complete absence of coordination, high rates of return are more convenient as they function as a buffer against uncertainties. The perimeter of decision making (global or local optimization) does not significantly improve the supply chain performance in relation to its costs. Only the exchange of information improves its performance. Therefore, companies should make efforts to exchange information, first, on their lot sizes, then on their returns and finally, on the customer demand. Originality: The novelty of our work relies on an analysis of the closed loop supply chain performance with the simultaneous presence of information, coordination, and uncertainty.

1. Introduction

Nowadays, it is impossible for a supply chain not to consider its impact on the environment [1,2]. Legislations are extended all over the world requiring manufacturers or importers to assume responsibility for their products at the end of their useful life, particularly of those that may harm the environment [3]. Therefore, the aspect of the environment is a critical matter that must be included in day-to-day decision-making in a closed loop supply chain and its management at the strategic, tactical, and operational levels [4]. According to [3], a closed loop supply chain results when we consider forward and reverse supply chains simultaneously. A traditional supply chain only considers forward flows.
There are many benefits to incorporating the environmentally conscious concept into supply chains. For example, better availability of resources [5], enhanced end of life strategies [6], improved value propositions [7], less waste generation [8], improved sustainability [9], enhanced social benefits [10], etc.
Coordination, according to [11], is “the act of managing interdependencies between activities performed to achieve a goal”. For many years, it has been mentioned that coordination in supply chains is essential for optimal performance [12,13,14,15,16]. Likewise, it has been asserted that these chains include those ones that incorporate reverse logistics in their operations [17,18,19,20]. However, there is no literature that is conclusive on the latter (see for example, [21,22,23]). On the other hand, something similar happens with information. In recent years, the value of information is an area of vast development in forward supply chains (e.g., [21,24,25]). According to [14], “the difference between supply chain costs under traditional and full information is one measure of the value of shared information”. One of the central elements is to determine what information is relevant, its quality, and timeliness. In our view, these aspects have not been significantly addressed in the literature on closed loop supply chains. See, for example, [22,23,26,27,28,29,30,31,32]. In addition, uncertainty in a closed-loop supply chain is a transversal topic that must be addressed when analyzing coordination and the value of information (there are uncertainties, for example, in time, quantity, and quality of returns). “Uncertainty refers to epistemic situations involving imperfect or unknown information”, according to [33]. For more details about uncertainty in supply chains, see [34,35,36].
In this work, we seek to analyze these three elements together: value of information, coordination, and uncertainty in a closed-loop supply chain. The objective of our research is to investigate how information and coordination can improve the performance of the closed-loop supply chain and how uncertainty affects these two elements. In this article, we will understand performance as the total inventory costs incurred by the supply chain. These costs include holding and backlog cost.
The novelty of our work relies on an analysis of the closed loop supply chain performance with the simultaneous presence of information, coordination, and uncertainty.
Therefore, this article analyzes and seeks to contribute to the research agenda about the value of information and coordination in closed loop supply chains. We set out to contribute to the discussion on both topics. On the one hand, we analyze the information that is most relevant, the benefits of centralized or decentralized approaches, and the impact of uncertainty on these topics. To this end, we analyze a dyadic closed loop supply chain, where the manufacturer re-manufactures products returned by customers, producing “as good as new products”. The manufacturer then sends re-manufactured products to a retailer who in turn sells them to the end customer.
The structure of this article is as follows. It begins with a review of the literature on coordination and value of information for forward and reverse supply chains. Then, the scenarios to be analyzed are presented. Subsequently, the structure of the supply chain that will be used to analyze the value of information and coordination is obtained. In that same section, the different models of linear programming used are presented. Thereupon, the design of the experiment, in which the data collection is specified, is shown. Finally, the results and conclusions of this study are displayed.

2. Literature Review

This review will be composed of four sections—one dedicated to understanding the fundamentals of coordination and value of information, then two sections will analyze those articles that positively, neutrally, and negatively assess these aspects in a closed-loop supply chain. Finally, the main findings and research perspectives in this area will be presented in the last section.

2.1. Fundamentals

According to [37], coordination is the act of correctly combining a number of objects (actions, objectives, decisions, information, knowledge) to achieve a global goal in the supply chain. It is often said that coordination is a key element for companies in a supply chain to gain competitiveness and enhance their benefits. However, what strategies can be identified as coordination? Are there several levels of coordination? An interesting work that addresses these questions is the work of [38], where they propose a classification of the types of coordination in a supply chain. Recalling the definition of coordination at the beginning of this section, it is interesting to note that as soon as the nature of an object of coordination changes, a different way of coordination is needed to manage this specific object. Thus, although companies use various modes of coordination for these various objects, little attention has been given to distinguish and unify them [37]. This author proposes four coordination types. Logistics synchronization attempts coordination (alignment) between the logistics processes of each member with the goal of delivering the products and/or services in accordance with the requirements of the end customer [38]. The exchange of information defines the provision for all members of the chain of convenient, accurate, and timely information [15]. Aligning incentives provides mechanisms to share benefits and risks, with the aim of motivating actors to seek benefits for the entire chain and not only individually [15,16]. Finally, collective learning relates to the initiation and the transmission of knowledge between actors in the supply chain.
Sepulveda Rojas and Frein [39] characterized the coordination scenarios in supply chains in two dimensions of analysis: The perimeter of the decision-making process and the exchange of information. The perimeter of the decision-making process considers two extreme approaches. First, each member of the supply chain optimizes its own operation without taking into account the impact of its policy on the other members of the chain (therefore, we have a sum of individual and local optimizations). The second dimension is global optimization, which involves identifying an optimization criterion for the entire system. Therefore, two cases are considered: global optimization (with an optimization criterion for the whole supply chain) and a sum of local optimizations (with a specific optimization criterion by actor).
The exchange of information is the process of transmitting information from one member of the supply chain to another. We distinguish two types of information: demand and decision-making according to [39]. The exchange of information on demand is the process of transmitting information in relation to customer demand. The information on the customer demand may be transmitted by the member of the supply chain closest to the end customer (the actor who more naturally will have this information) to all members of the supply chain. The exchange of information about decision making is the process of transmitting information related to decisions made by one member of the supply chain to another. Note that this type of information exchange is interesting only for the case of the local perimeter of decision-making (if this perimeter of decision-making is global, of course, there is always the exchange of information between members of the supply chain). This information is transmitted by any member of the supply chain to the other members that may be affected by it. The shared information could be the order quantity (lot size) that must be placed to the upstream members, schedules, or arrival times of the orders to the members, among others.

2.2. Articles Where Coordination and the Value of Information Positively Impact the Supply Chain Performance

There are some articles that study the value of information exchanged in scenarios where customer demand is uncertain. For example, Chen [12] showed that if the variability of customer demand is high (the customer’s demand becomes more uncertain or unpredictable), the exchange of information about customer demand is significantly more important. Lee et al. [13] showed that the exchange of information is beneficial when the correlation of demand is high, the variance of customer demand is high, and delivery times are long. We also find some elements in the work of [14]. In this work, there is a comparison between the policies of inventories with and without information exchange for a supply chain with a supplier and N retailers. The authors anticipate that the exchange of information can have significantly greater value in environments with unknown demand, for example, advance sales of new products.
In Yuan et al. [17], a model of inventory management is presented with four actors. They found that the economic benefit of the supply chain increases as the return rates increase and the design of a sharing mechanism of the economic benefit is key to coordinate decision-making for all actors in the system. The article by Yang et al. [40] presents a model based on a producer and n retailers and works with a model of inventory of a single product in an infinite time horizon. Among the most relevant conclusions of the article is that as return rates increase, the retail prices decrease; however, the income of the retailers and manufacturer for both increases. In addition, it is suggested that coordination produces greater impact on products with higher return rates and higher holding costs. Al-Salem et al. [41] proposes a model based on a producer, n distribution centers, m retailers, and a single product. Relevant results show that the integration of inventory management and the location decisions will produce benefits. In Chung et al. [18], a model is presented with one producer and one retailer, where an infinite horizon for a single product is considered. They showed that the economic benefit of a closed loop supply chain is highly sensitive to the sales price of the retailer and the annual demand. Also, they showed that in order to develop win–win type strategies, revenues of the chain must be shared. Giri and Sharma [42] presents a model based on a supplier, producer, retailer, collector, and end customer. They found that global optimization is better than sequential optimization and the full benefit of the supply chain is highly sensitive to the retail sales price and the rate of annual demand. Adenso-Díaz et al. [28] presents a simulation model composed of a supplier, producer, packer, wholesaler, retailer, and end customer. The most important results include the confirmation of the factors that play a key role in the expansion of the bullwhip effect, such as: the adjustments made by the chain’s stakeholders, the technique of forecasting utilized, the lead time between the actors of the chain, and the levels of information exchanged. Cannella et al. [19] presents a simulation model composed of a producer, one product, and a multi-period horizon. As the rates of returned products increase, the bullwhip effect and instability of the inventories decrease. Finally, it is noteworthy to say that the visibility of information throughout the cycle of remanufacturing is vital with the adoption of collaborative policies in productive environments. The article by Chen et al. [20] presents a model composed of a monopolistic plant that manufactures and remanufactures, delivering a set of products to a set of distribution centers and customers; the model evaluates possible scenarios for one product in an infinite time horizon. A set of possible scenarios with uncertain parameters is then defined. According to the results presented in the article, the closed loop supply chain model is highly robust to uncertainties in the market, the design of an integrated network achieves better results than a sequential approach, and the use of flexible prices could be a good way to react to the uncertainties of the business environment. Hosoda et al. [43] presents a model consisting of a producer and a center of remanufacturing. Among the most relevant results outlined in the article is that sharing returns and productivity information could be beneficial for the producer. Finally, Yang et al. [30] found that higher rates of return produce more remanufacturing cycles. Also, the percentage increase of total income is more significant with high deterioration rates, high holding costs, and low demand rates. Analytical results show an increase in the joint profit when an integrated policy is adopted.

2.3. Articles Where Coordination and the Value of Information Impact the Supply Chain Performance in a Neutral or Negative Way

Ketzenberg [21] explores the value of information within the context of a company facing uncertainty about customer demand, return of products, performance of recovered products, and capacity utilization. The author measures and evaluates the value of information through three cases of exchange of information. He found that there is no dominance in the values found among the different types of information exchanged. These results seem interesting and, at the same time, motivate us to carry out studies in this same direction to confirm, or not, the findings of Ketzenberg. Aras et al. [32] analyzes alternative priority and coordination strategies for repairable products in a hybrid system (manufacturing/remanufacturing), where the main result is that coordination in the first stage of the hybrid system eliminates the benefits of prioritization. Ketzenberg et al. [31] address the problem of a supplier that satisfies the demand with a new product, a recovered product, or a mixture of both. There are uncertainties about demand, the return of products, and the performance of the returned products. They showed that the value of one type of information does not dominate any other type and that there is an additional payment to invest in more than one type of information. de Brito and van der Laan [22] investigates the impact of imperfect information on the return process, in the performance of inventory management. They analyze four methods to predict the lead time of customer demand. Their results showed that in the case of imperfect information, the more informed method does not necessarily lead to better performance. Therefore, the value of information would be low or zero. Ketzenberg et al. [25] also assess the value of the performance of information in the context of a joint operation of assembly-disassembly for remanufacturing. Thus, this work presents studies on the value of coordination in a different production context. However, the value of coordination is inconclusive, such as the following articles.
In the article by [26], a model composed of a producer and a retailer is considered and inventory is modeled for a single product. One of the features of this model is that the quantities of CO2 generated by the manufacturing process is determined. One of the main contributions of this article is that results suggest that high return rates should not be allowed for remanufacturing since this may generate high levels of greenhouse gas emissions. Diabat et al. [23] presents a location inventory model composed of l retailers, m remanufacturing centers, and n distribution centers. They found that at higher return rates, holding costs increase and the number of facilities decrease. Shi et al. [29] presents a model composed of a single actor who performs manufacturing and remanufacturing. One of the most relevant conclusions is that remanufacturing is a strategy that saves resources, especially for producers with limited capacity. It is also determined that the variability of demand for a product affects the production policy of the other products in the supply chain.

2.4. Findings and Research Perspectives

To summarize the main items addressed in this review, Table 1 shows the main characteristics of the works analyzed, with a final column where, in our view, it is indicated whether the coordination and the value of the information is beneficial for a closed-loop supply chain or not. The analysis confirms the initial hypothesis of our work, where it was mentioned that the benefits in the closed loop supply chain are not clear because almost half of the articles of this review are neutral in relation to the benefits of the value of information and coordination. Additionally, the most commonly exchanged information is demand, returns, inventory, and lot sizes. These variables match the ones that will be used in this article. With regard to returns of goods, it is noted that the benefit of having high rates of returns is not conclusive either. Finally, the most frequently used structures of supply chains are those of a manufacturer and a retailer or a single manufacturer/remanufacturer. In our view, this is mainly because of the difficulty in performing this type of analysis with more complex supply chain structures. Therefore, this work is consistent with the literature on the use of a supply chain structure of a manufacturer and a retailer.
Some gaps or research perspectives in this area could jointly incorporate the uncertainty of demand, the uncertainty in quantity and quality of the returned products, and carry out these analyzes for more complex supply chain structures. Another gap, according to our judgment, is the lack of articles applied to real cases.

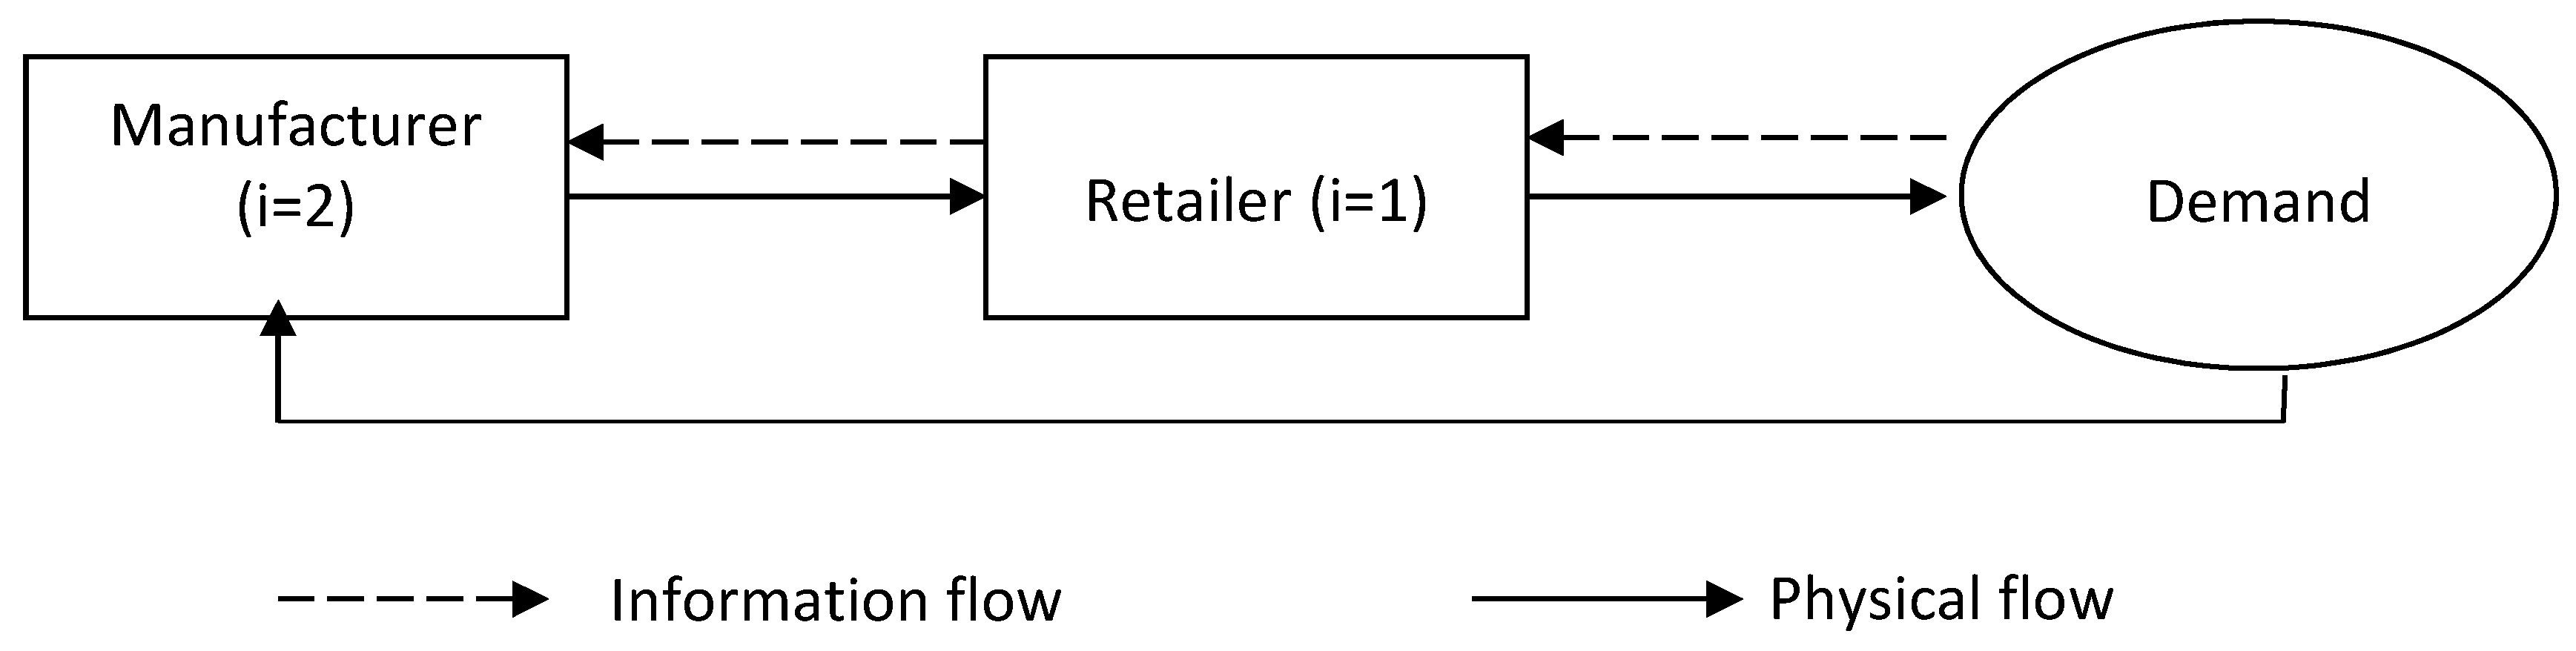
3. Materials and Methods

Two criteria were used to define the coordination scenarios according to [39]—value of information and perimeter of decision-making. More details about these criteria can be found in Section 2.1. The value of the information refers to the availability, or not, of information in t = 0 regarding the information on the demand, returns, and batch sizes over all the planning horizon (36 periods). In our case, the retailer may or may not have information on the demand of the end customer. On the other hand, the supplier may or may not have information on returns and batch sizes that will be ordered by the retailer. Also, information may be partially available, for example, only the demand information, but not the returns or batch sizes. The second criterion for defining coordination scenarios is the perimeter of decision-making. If the perimeter is global, we are in the presence of an optimization of the supply chain, with all actors acting together to achieve a common goal. When each actor seeks to optimize only their own operations without considering the impact of their decisions on the other actors in the chain, a perimeter of local decision-making occurs. These two cases mentioned are frequently used in the literature on coordination in supply chains. They can be referred to as global versus local optimization or as a centralized versus decentralized approach. In Section 2.2 and Section 2.3 of the literature review, only articles that refer to these topics are presented. In the case of local optimization, there may, or may not, be an exchange of information among actors. In the case of a global decision-making perimeter, it is assumed that information is always shared as it would not make sense otherwise.
Below, Table 2 presents the 12 coordination scenarios to be analyzed in this work. It is important to mention that the column “information status” refers to the availability of information on demand and returns.
For example, Scenario 6 is when the retailer neither has information of the demand, nor transmits its batch sizes to the supplier. In addition, in this case, the supplier does not have information about the amount of returned product.
These scenarios will allow us to assess from a case of complete information, passing through intermediate cases of partial information to an ending case where no information is available. Finally, these scenarios of information will be analyzed for the two perimeters of decision-making that have been considered.

3.1. Linear Programming Models for Each Scenario

A supply chain of two actors composed of a retailer and a manufacturer was defined to perform this analysis. This type of supply chain is widely used in the literature because it presents a low level of complexity in its structure, which will allow us to analyze the coordination and information scenarios. Below is an outline of this supply chain, see Figure 1:
There is a manufacturer that sends the finished product to retail. The retailer sells this product to an end customer. After a period of time, at the end of the useful life of this product, a percentage of this demand returns to the manufacturer. The manufacturer remanufactures these returned products, leaving them in the same condition as a “new” product. Finally, the factory sends these remanufactured products to the retailer, where they are indistinguishable from final products manufactured with virgin raw material. An example of this type of supply chain is the office furniture industry. Currently, there are companies that remanufacture furniture and then sell them indistinctly from those products made with virgin raw material and at the same price. It is well known that there are other cases where remanufactured products are sold in secondary markets and at a different price. However, there are also cases where the new and remanufactured products are completely indistinguishable, have the same price, and are sold in the same market. Finally, the 12 coordination scenarios mentioned above can be analyzed in this supply chain.
Subsequently, a linear programming model was made for each of the scenarios proposed in this study. The notations used are as follows:
Parameters:
i: index 1 represents the Retailer and index 2 the Manufacturer;
N: number of planning periods (N = 36 periods);
Li: information lead time (Li = 2 periods);
Lp: production and transport lead time (Lp = 2 periods);
Fxi,t: forecast of order of member “i” in period “t”;
Fdt: forecast of the final customer demand in period “t”;
Frt: forecast of the returned quantities from the customer to the manufacturer in period t;
Dt: final customer demand in period “t”.
HCi,t: unit holding cost for member “i” in period “t”(HCi,t = 1 ∀i,t);
BCi,t: unit backlog cost for member “i” in period “t”(BCi,t = 2 ∀i,t);
Variables
Shi,t: units sent by member “i” in period “t”;
Xi,t: order size of member “i” in period “t”;
Si,t: inventory units for member “i” at the end of period “t” (notice the orders in transit are not included here);
bi,t: units in backlog for member “i” at the end of period “t”;
Rt: returned quantities from the customer to the manufacturer in period t.
As an example, the linear programming model for scenario 1 is presented below.
M i n T C = t = 1 N i = 1 2 H C i , t S i , t + B C i , t b i , t
s.t.
Retailer (i = 1):
S 1 , t = S 1 , t 1 + S h 2 , t L p S h 1 , t
S h 1 , t S 1 , t 1 + S h 2 , t L p
S h 1 , t D t + b 1 , t 1
b 1 , t = D t + b 1 , t 1 S h 1 , t
Manufacturer (i = 2):
S 2 , t = S 2 , t 1 + X 2 , t L p S h 2 , t + R t
S h 2 , t S 2 , t 1 + X 2 , t L p + R t
S h 2 , t X 1 , t L i + b 2 , t 1
b 2 , t = X 1 , t L i + b 2 , t 1 S h 2 , t .
Equation (1) represents the objective function, where the total cost of the entire supply chain is minimized. This total cost is made up of holding and backlog costs. Equations (2) and (6) represent the level of stock in period t for the retailer and manufacturer, respectively. The level of stock in period t for the retailer is the balance of stock flow in the previous period (Si,t-1) plus shipments of the manufacturer in period t-Lp (Shi + 1, t-lp) minus the shipping from the retailer to the customer in period t (Shi,t). In the case of the manufacturer, the returns in period t are added to this flow-balance equation. It should be noted that the manufacturer launches a manufacturing order in period t-Lp of new products (Xi,t-LP). Moreover, it is assumed in this case that the returned products (Rt) are already remanufactured in a previous process by the manufacturer and therefore, become part of the manufacturer’s stock of finished products. Equations (3), (4), (7) and (8) are the shipping of the finished product from the retailer and the manufacturer, respectively. It is the minimum value between the available stock of each one of them (Equations (3) and (7)) and the demand, including the backlog of the previous period (bi,t-1) by the customer or retailer, respectively (Equations (4) and (8)). Finally, Equations (5) and (9) are the constraints of backlog flow balance of the retailer and the manufacturer.
Linear programming models for other scenarios are similar to the model explained for scenario 1 as above. There are only slight modifications related to the scenarios in which forecasts must be made. In such cases, the notation of the variable is modified. In this way, we have Fdt, Fxi,t, and Frt instead of Dt, Xi,t, and Rt.
Finally, in the case of local optimizations scenarios, in the retailer’s stock constraint (see Equation (2)), we change the variables from Shi + 1, t-Lp to Xi, t-(Li + Lp) because it is assumed that all retail orders arrive after Li + Lp periods. Thus, unlimited capacity of the manufacturer is assumed in this case.
Once obtained, the optimal lot sizes (Xi,t) are fixed in all scenarios, even in scenarios that use forecasts. However, in the latter case, the inventory total costs must be recalculated, replacing the forecasts by the real values because it is assumed that once the decision of the lot size (Xi,t) is made based on the forecasts, this decision cannot be modified.

3.2. Design of the Experiment

To analyze the value of information and coordination in a closed-loop supply chain, we proceeded to design a theoretical experiment, in which demands, returns, and uncertainties are defined. In the case of the demand, it was assumed that the demand is random and follows a uniform probability distribution. Many articles use this assumption in the literature and it is also used in MIT’s Beer Game [43]. This article from [43] provided us with a framework to obtain the demand values, the holding, and backlog costs for our experiment. We used the data of this game because it is widely known and has been validated over time through its extensive use. The demand varies in time and a planning horizon of 36 periods is used. Therefore, each instance of demand is a vector with 36 periods. With regard to returns, we decided to analyze three cases, with a rate of product return of 80%, 50%, and 20% of the value of the demand. This assumption about the rate of return is fairly common in the literature, which indicates that the returns are a percentage of the demand of the end customer. It is also assumed that the recovery rate for these returned products is 100%, i.e., everything that returns may be recovered. Uncertainty is included in our analysis from two points of view, one related to the characterization of the scenarios analyzed and the other when forecasts are made. In the first case, it is natural to argue that a scenario with complete availability of information is less uncertain than a scenario where no information is available. In the second case of uncertainty, for example, a demand forecast was defined as the real value of the demand plus an error term (uncertainty) that can grow if uncertainty increases. This error is proposed as a uniform distribution where its limits can grow, thus achieving a greater percentage of error and therefore, more uncertainty. The same approach is used for the forecasting of each of the levels of returns defined. See Table 3 where the different values used to generate the instances of analysis are defined.
Twenty instances of demand were defined to be analyzed according to the distribution of Table 3. There were also 20 instances in the case of returns and forecasts. For example, to obtain the total cost of scenario 1 (complete information on demand and returns, under a global optimization perimeter), each instance of a specific return rate (20%, 50%, or 80%) was combined with each instance of the demand. This combination allows the total cost of scenario 1 for a rate of return of 20% (for example) to be the average of the objective value of 400 linear programming models (20 × 20). At this point, we must note that the defined linear programming problems can be solved in polynomial time, therefore, there is no problem associated with the resolution time of each model. Each coordination scenario in this work was calculated in the same way.

4. Results

The main results obtained are shown below. In global coordination (Figure 2a) and local coordination figures (Figure 2b) for different rates of return, we may note that:
The higher the level of uncertainty, the greater the total costs of the supply chain, in the cases of global or local coordination, for most of the return rates.
With regard to the type of information that is most relevant to the supply chain, it can be seen that the information on returns is more important because it presents lower costs than having information on demand. This is verified by comparing costs between scenarios 10 and 7 (global coordination) and scenarios 11 and 8 (local coordination). In the latter case, for rates of return of 80% products, this observation is not fulfilled. It is important to remember that in scenarios 10 and 11, the information is fully known, but we do not know the end customer demand. The opposite occurs in scenarios 7 and 8, i.e., the end customer demand is known but the returns are not. According to these results, this generates more uncertainty, therefore there are higher costs for not having information on the returns. This brings us to the first novel result of our work:
  • Result 1: Information about returns is more important than information about customer demand.
Low levels of returns, in our case, 20% of the returns of the volume of demand, generate lower costs. The reason for these results is that higher return rates generate greater stock, therefore costs increase due to the costs of maintaining inventory. However, it is not possible to verify this relationship when comparing higher return rates (50% and 80%). This brings us to the second novel result of our work:
2.
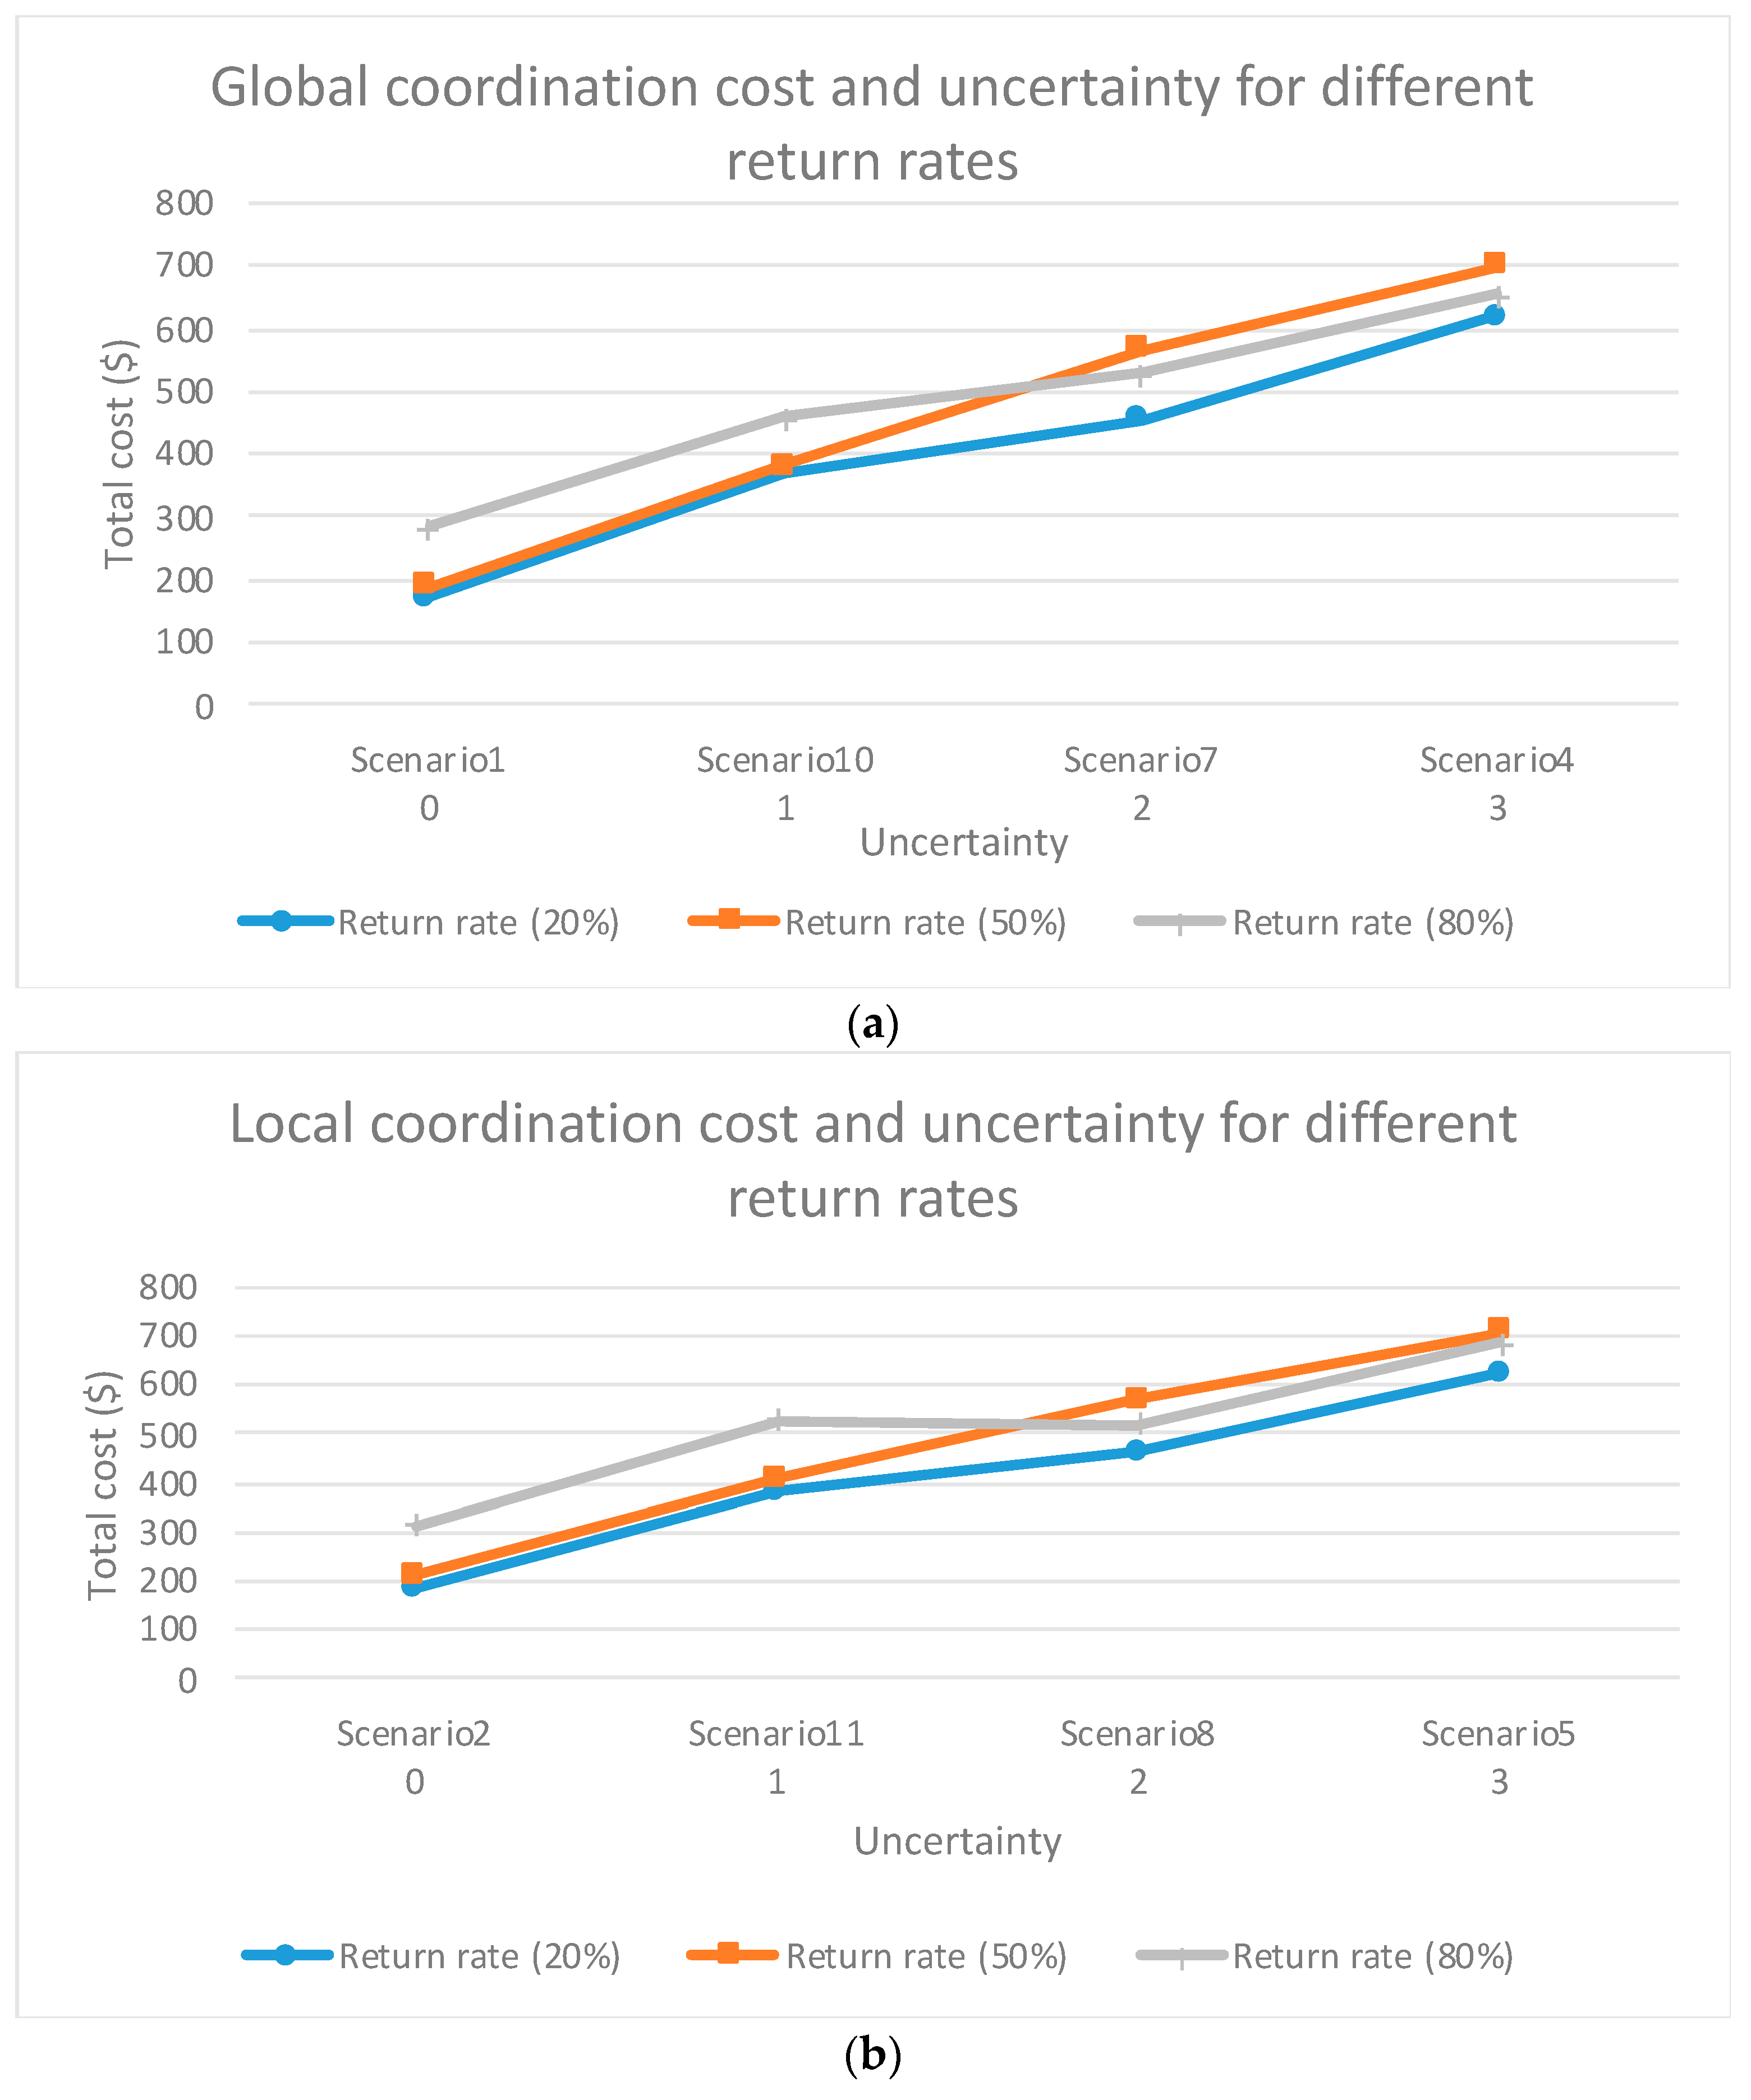
Result 2: It is preferable to process low return rates since return rates greater than 20% imply an increase in supply chain cost due to the increase in holding costs, among others.
When comparing the perimeter of decision-making, i.e., when comparing between global and local coordination, for 20% return rates (Figure 3a) and 50% (Figure 3b), we observe that the value of this type of coordination is not clear.
For each level of uncertainty, the difference is minimal and almost imperceptible among the different perimeters of decision-making, being slightly better in global coordination. This is consistent with the literature as in different articles, it is mentioned that the benefits of coordination are not clear. This result is repeated for each rate of return and for each level of uncertainty. This brings us to the third novel result of our work:
3.
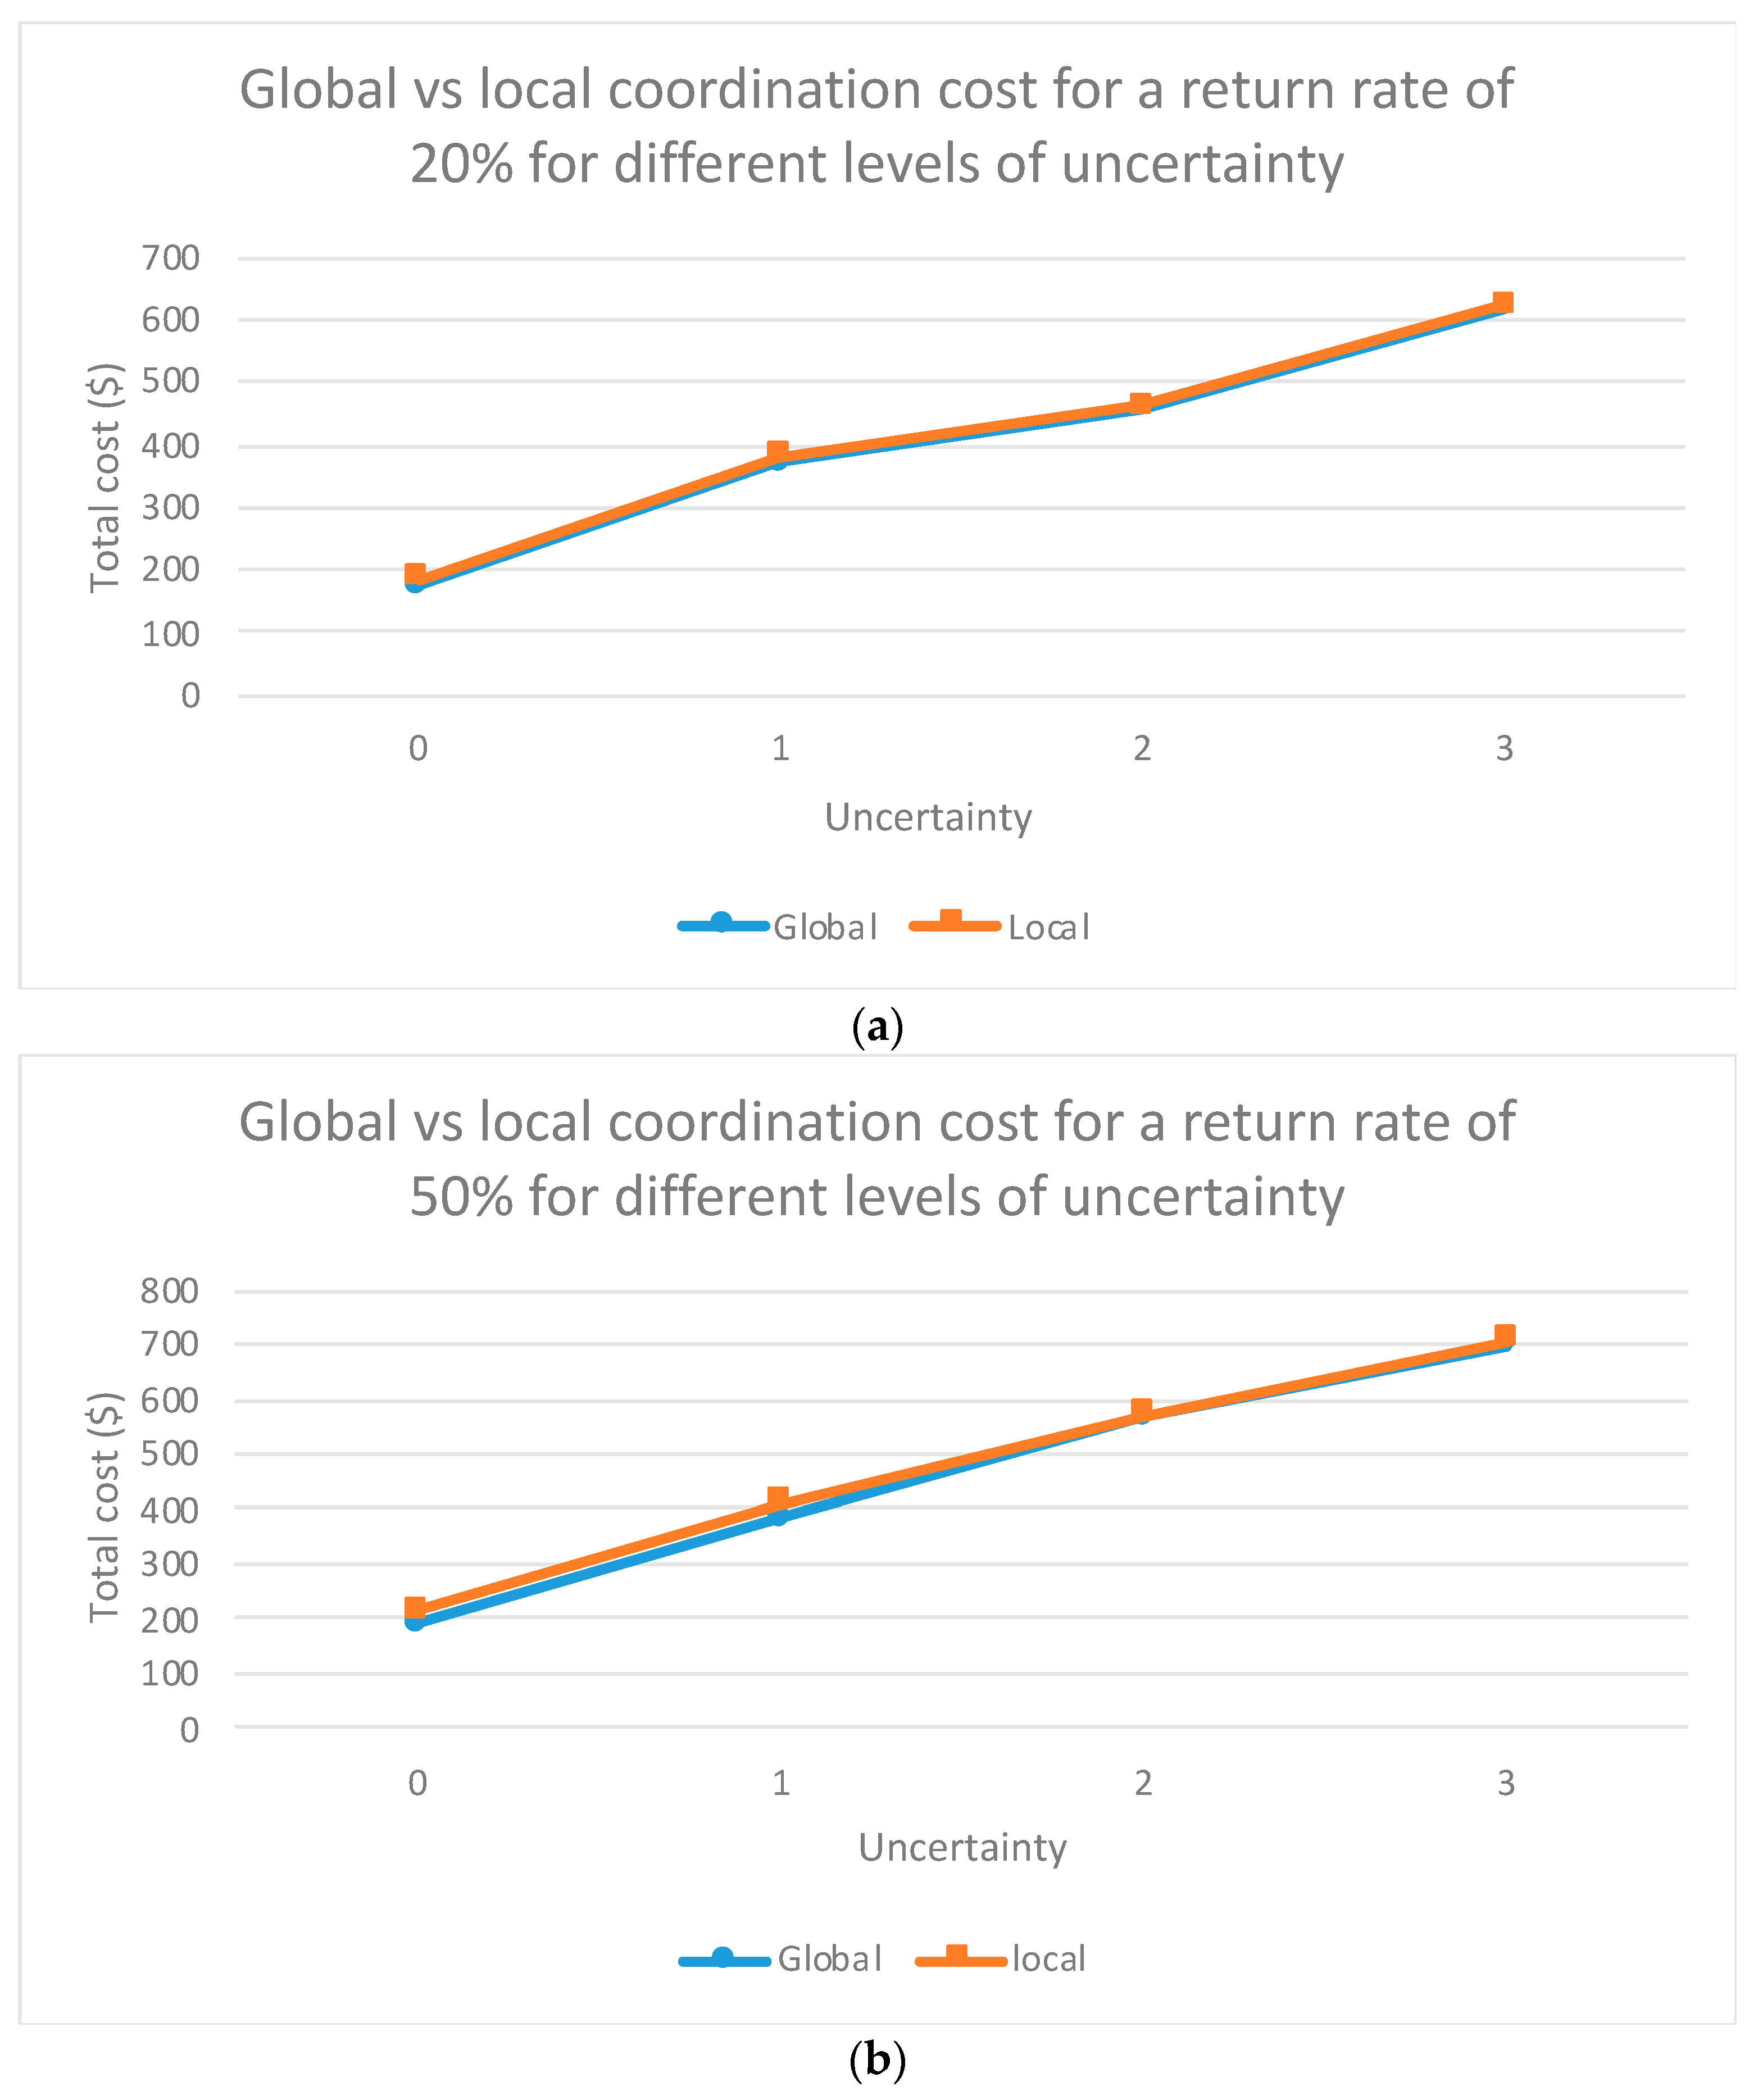
Result 3: It is confirmed that global coordination does not necessarily achieve lower costs for the supply chain. Furthermore, this article verifies that this is still valid for different return rates and different levels of uncertainty.
When we analyze the case of complete absence of coordination between actors (See Figure 4), that is, scenarios that do not share the information on the decisions of the actors, and we are in the presence of local coordination, we find that high rates of returns (in our case, 80%) have much lower total costs of the chain (for different levels of uncertainty). We believe that this is due to the fact that high return rates generated a greater stock that serves as a buffer to absorb the impact of this greater uncertainty among the actors. On the other hand, comparing for each rate of return and total costs with respect to the impact of the information available (scenarios 3, 12, 9, and 6), we note that there is no significant difference. This implies that if there is no exchange of information on decisions taken, it is not relevant to have information on the demand, the returns, or both. This brings us to the fourth and fifth novel result of our work:
4.
Result 4: Without any type of coordination or information between the supply chain actors, it is preferable to have high levels of return since these returns operate as a buffer against uncertainty.
5.
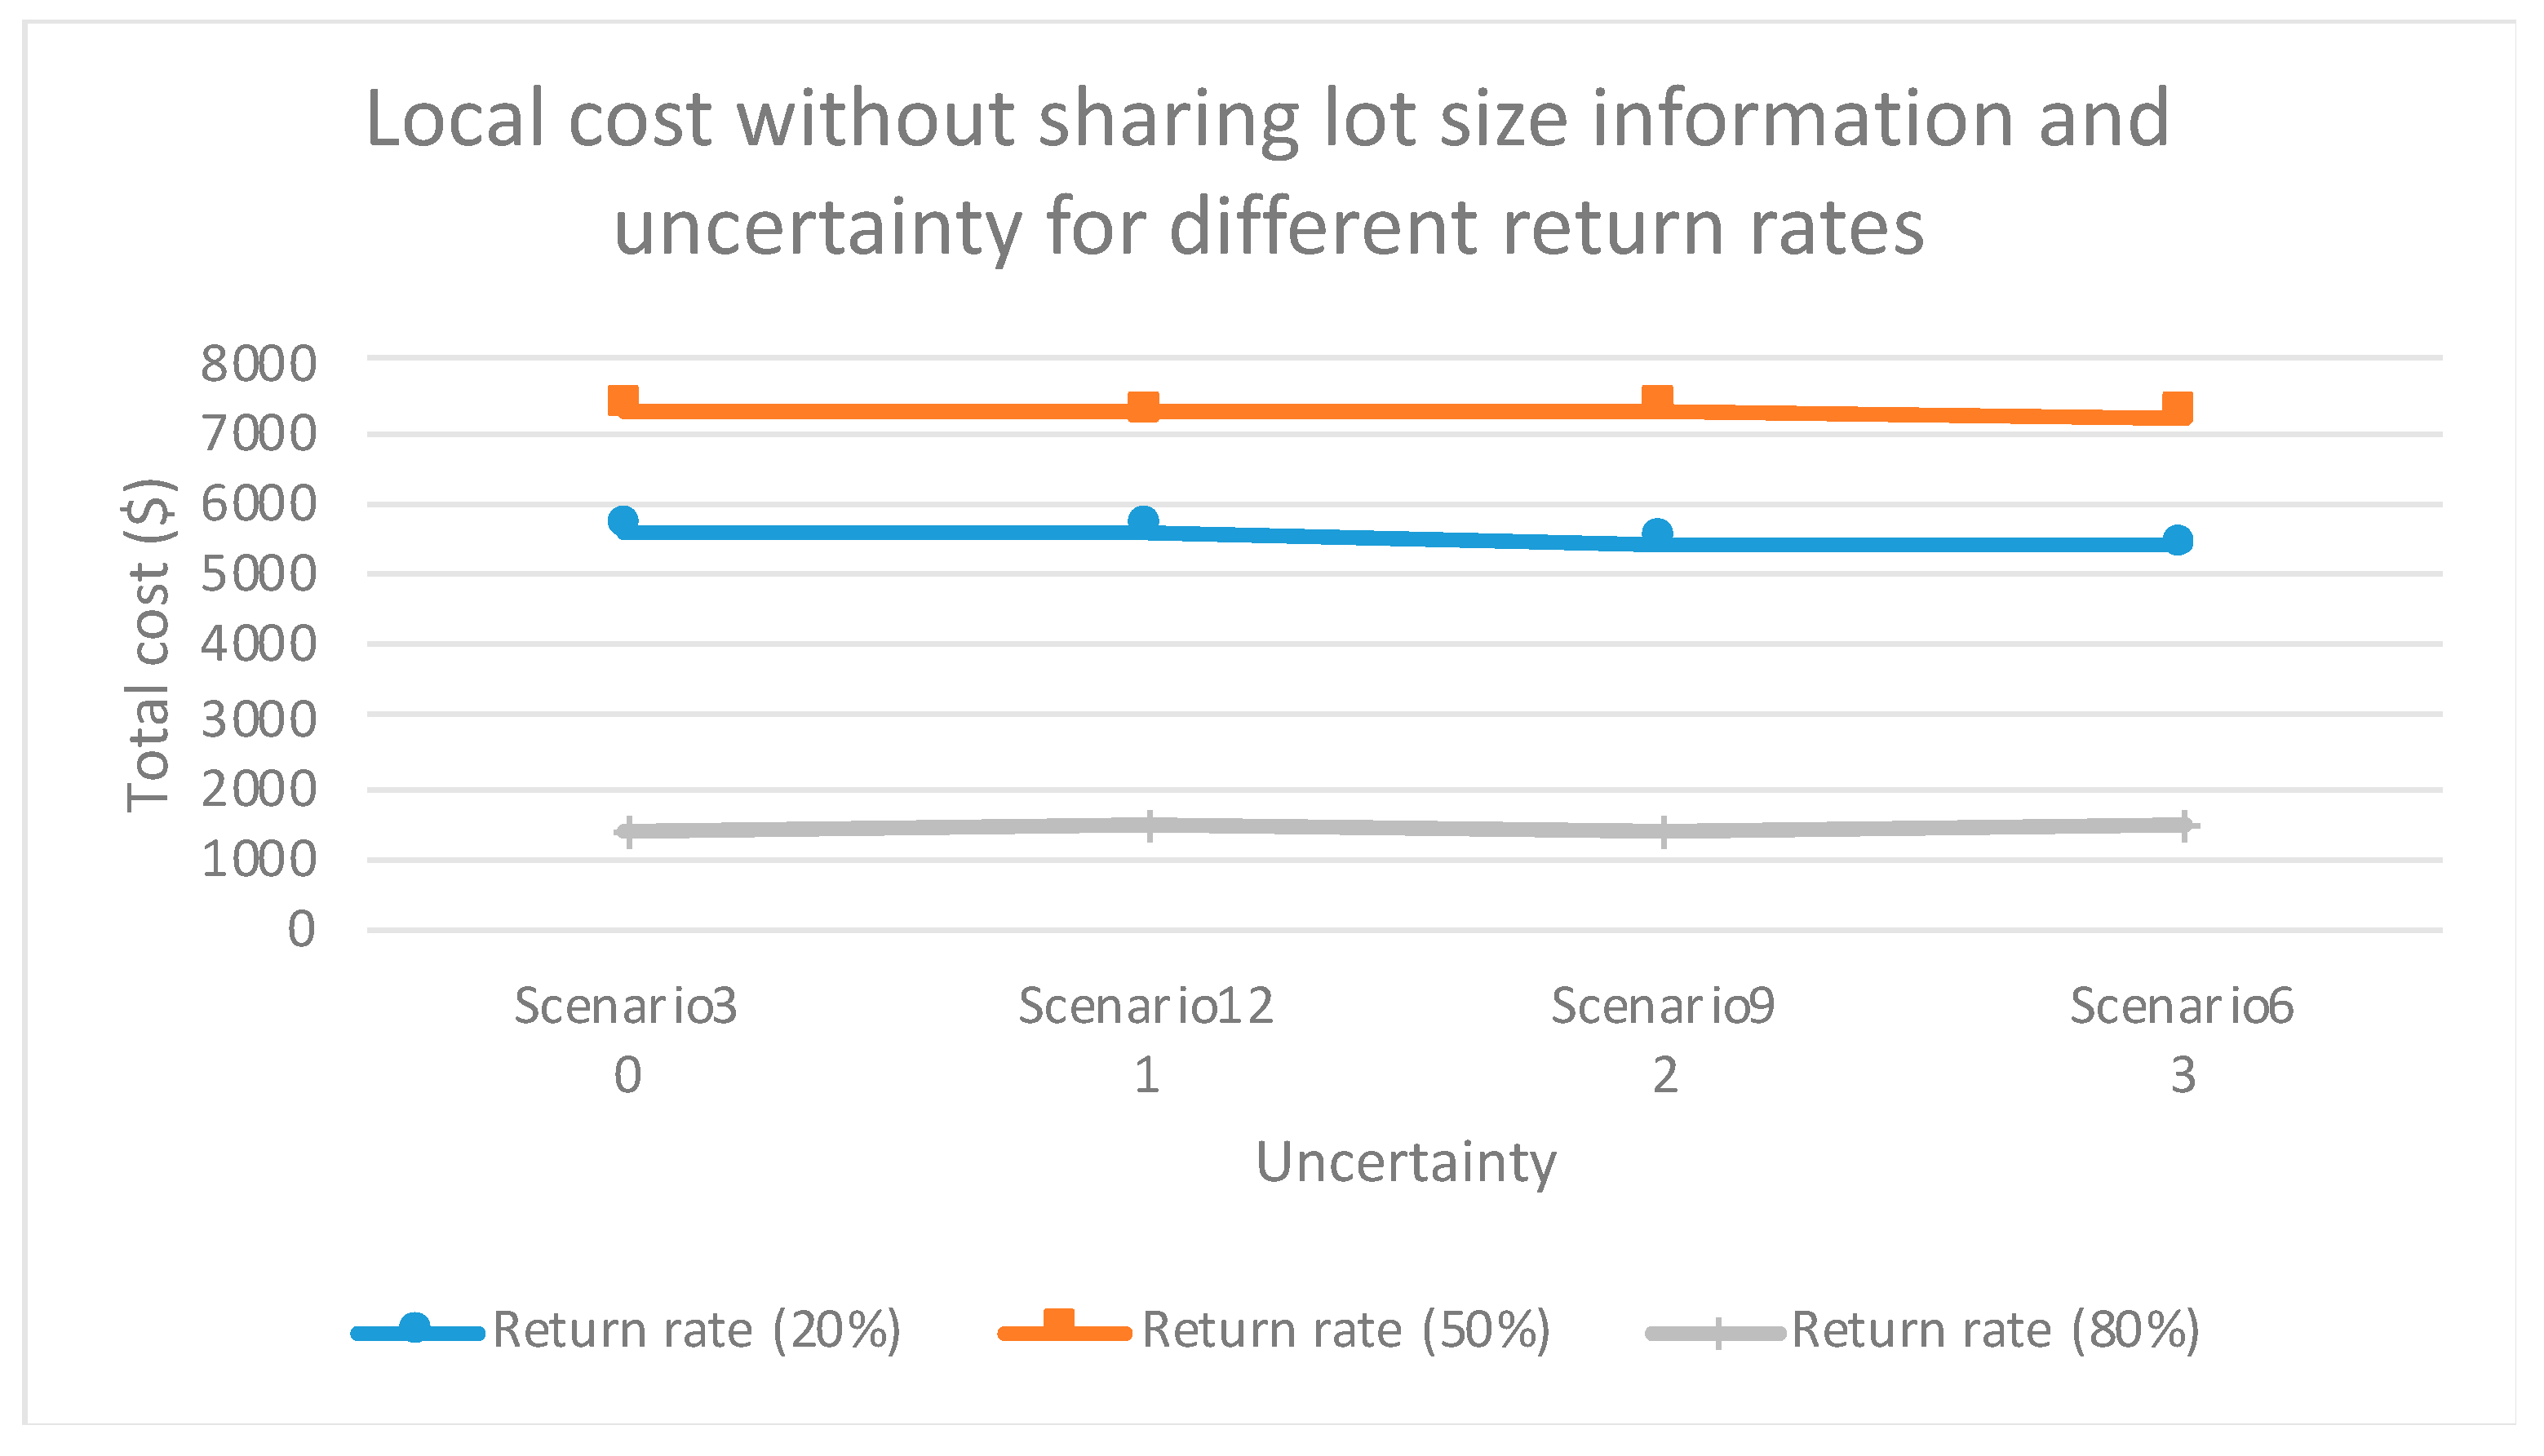
Result 5: If no information on lot size is exchanged, then exchanging information on demand or returns does not improve supply chain costs. Even for each return rate, the supply chain costs are almost constant.
The former is also verified when comparing the total costs with those of other scenarios analyzed. Thus, the need for greater collaboration between actors sharing decisions on their purchases or batch sizes with their suppliers and customers is evident.
Finally, when comparing this last result with the previous figures, we may also conclude that the information sharing is positive.

5. Conclusions

This article analyzes the value of information and coordination in a dyadic closed loop supply chain and discusses the impact of uncertainty. We analyzed a dyadic closed loop supply chain where the manufacturer re-manufactures products returned by customers, producing “as good as new” products, sending them to a retailer who in turn, sells to the end customer. This configuration of supply chain was validated in the literature review.
Twelve coordination scenarios were analyzed. For the definition of these scenarios, a framework based on two criteria was proposed: value of information and perimeter of decision making. With these coordination scenarios, in our view, a large spectrum of possible combinations of useful information in the supply chain is covered. This brings us to the first managerial implication of our work:
  • Managerial implication 1: A framework for the analysis of different coordination scenarios was proposed. This can help companies to position themselves in any of these scenarios and therefore define courses of action based on them. For example, what type of information to exchange, how much would they expect to gain in that case, and whether or not to undertake greater forms of collaboration with customers or suppliers.
For each of these scenarios, a linear programming model was proposed to evaluate the total supply chain cost. The models are thought to be a contribution for modeling closed loop supply chain problems. This brings us to the second managerial implication of our work:
2.
Managerial implication 2: New linear programming models are proposed, which can be used by companies to determine their lot sizes in this context.
In addition, uncertainty is included through the type of information shared and the forecasts used. It is novel to incorporate uncertainty in these analyses because they produce studies that are closer to reality and what managers must face. Uncertainty is always present in any production process and it may become an important factor in the performance of the supply chain. We proposed an experiment with theoretical data to evaluate each scenario. This brings us to the third managerial implication of our work:
3.
Managerial implication 3: By including uncertainty, returns, and different coordination scenarios, the models are closer to real life situations of the companies, therefore these models can be more useful for them.
As described in the results section, it was noted that the information on returns is more important than the information on the end customer demand in almost all scenarios. Therefore, the manager efforts should be to attain this information. This brings us to the fourth managerial implication of our work:
4.
Managerial implication 4: Information on returns leads to lower costs than information on demand. Therefore, if the company must make an economic effort to obtain or exchange information with the other actors in the chain, this information must be about returns.
With regard to the rate of returns, it was determined that low rates of return lead to low total costs in the chain. Only a high rate of return (in our case, 80%) is beneficial in the complete absence of information exchange among the actors. This occurs only in the cases of local optimizations. This brings us to the fifth managerial implication of our work:
5.
Managerial implication 5: In the presence of complete or partial coordination between the actors in the chain, it is preferable to have low product return rates. However, if we are in the complete absence of coordination, high rates of return are more convenient as they function as a buffer against all the uncertainties.
On the other hand, a perimeter of global decision is slightly better than a local one, although the difference is quite minimal. It is confirmed that the availability and exchange of information leads to quite good performance of the supply chain, regardless of the perimeter of decision-making. Finally, the higher the level of uncertainty, the greater the total costs of the chain. This comes to reaffirm the fact of making an effort to have more information and to exchange it with the other actors in the chain. This brings us to the sixth managerial implication of our work:
6.
Managerial implication 6: The perimeter of decision making (global or local optimization) does not significantly improve the supply chain performance in relation to its costs. Only the exchange of information improves its performance. Therefore, we are effectively verifying the value of the information for all the scenarios analyzed in this closed-loop supply chain. Therefore, companies should make efforts to exchange information, first, on their lot sizes, then on their returns, and finally, on customer demand.
It is also important and necessary to highlight the limitations of this study. These are summarized below:
  • Limitations of the study: focusing only in inventory cost without considering other costs in the objective function of the model (for example, manufacturing, remanufacturing, quality of returns, etc.) and using a dyadic supply chain (future studies could consider more complex structures and verify the results by applying to a real case).
Projections of future research in relation to this work are to analyze different structures of supply chains, incorporate a more complete objective function, and incorporate other analysis techniques, in particular, game theory or artificial intelligence techniques. These theoretical results should be verified through their application in a real case.

Author Contributions

Conceptualization, J.P.S.-R.; methodology, J.P.S.-R. and R.T.; software, J.P.S.-R.; validation, J.P.S.-R. and R.T.; formal analysis, J.P.S.-R. and R.T.; investigation, J.P.S.-R. and R.T.; resources, J.P.S.-R.; data curation, J.P.S.-R.; writing—original draft preparation, J.P.S.-R.; writing—review and editing, J.P.S.-R. and R.T.; visualization, J.P.S.-R.; supervision, J.P.S.-R.; project administration, J.P.S.-R.; funding acquisition, J.P.S.-R. All authors have read and agreed to the published version of the manuscript.

Funding

This research was funded by DICYT (Departamento de Investigaciones Científicas y Tecnológicas), Universidad de Santiago de Chile, grant number POSTDOC_DICYT Código 062017SR_AYUDANTE.

Acknowledgments

Many thanks to the Industrial Engineering Department of the University of Santiago de Chile for the support.

Conflicts of Interest

The authors declare no conflict of interest.

References

  1. Zhang, C.T.; Ren, M.L. Closed-loop supply chain coordination strategy for the remanufacture of patented products under competitive demand. Appl. Math. Model. 2016, 40, 6243–6255. [Google Scholar] [CrossRef]
  2. Li, J.; Wang, Z.; Jiang, B.; Kim, T. Coordination strategies in a three-echelon reverse supply chain for economic and social benefit. Appl. Math. Model. 2017, 49, 599–611. [Google Scholar] [CrossRef]
  3. Govindan, K.; Soleimani, H.; Kannan, D. Reverse logistics and closed-loop supply chain: A comprehensive review to explore the future. Eur. J. Oper. Res. 2015, 240, 603–626. [Google Scholar] [CrossRef] [Green Version]
  4. Weraikat, D.; Zanjani, M.K.; Lehoux, N. Coordinating a green reverse supply chain in pharmaceutical sector by negotiation. Comput. Ind. Eng. 2016, 93, 67–77. [Google Scholar] [CrossRef]
  5. Goyal, S.; Esposito, M.; Kapoor, A. Circular economy business models in developing economies: Lessons from India on reduce, recycle, and reuse paradigms. Thunderbird Int. Bus. Rev. 2018, 60, 729–740. [Google Scholar] [CrossRef]
  6. Lopes de Sousa Jabbour, A.B.; Rojas Luiz, J.V.; Rojas Luiz, O.; Jabbour, C.J.C.; Ndubisi, N.O.; Caldeira de Oliveira, J.H.; Junior, F.H. Circular economy business models and operations management. J. Clean. Prod. 2019, 235, 1525–1539. [Google Scholar] [CrossRef]
  7. Mishra, J.L.; Hopkinson, P.G.; Tidridge, G. Value creation from circular economy-led closed loop supply chains: A case study of fast-moving consumer goods. Prod. Plan. Control 2018, 29, 509–521. [Google Scholar] [CrossRef]
  8. Herczeg, G.; Akkerman, R.; Hauschild, M.Z. Supply chain collaboration in industrial symbiosis networks. J. Clean. Prod. 2018, 171, 1058–1067. [Google Scholar] [CrossRef]
  9. Winkler, H. Closed-loop production systems-A sustainable supply chain approach. CIRP J. Manuf. Sci. Technol. 2011, 4, 243–246. [Google Scholar] [CrossRef]
  10. Despeisse, M.; Baumers, M.; Brown, P.; Charnley, F.; Ford, S.J.; Garmulewicz, A.; Knowles, S.; Minshall, T.H.W.; Mortara, L.; Reed-Tsochas, F.P.; et al. Unlocking value for a circular economy through 3D printing: A research agenda. Technol. Forecast. Soc. Chang. 2017, 115, 75–84. [Google Scholar] [CrossRef] [Green Version]
  11. Malone, T.W.; Crowston, K. The Interdisciplinary Study of Coordination. ACM Comput. Surv. 1994, 26, 87–119. [Google Scholar] [CrossRef] [Green Version]
  12. Chen, F. Echelon reorder points, installation reorder points, and the value of centralized demand information. Manag. Sci. 1998, 44, 221–234. [Google Scholar] [CrossRef] [Green Version]
  13. Lee, H.L.; So, K.C.; Tang, C.S. The Value of Information Sharing in a Two-Level Supply Chain. Manag. Sci. 2000, 46, 626–643. [Google Scholar] [CrossRef] [Green Version]
  14. Cachon, G.; Fisher, M. Supply chain inventory management and the value of shared information. Manag. Sci. 2000, 46, 1032–1048. [Google Scholar] [CrossRef] [Green Version]
  15. Lee, H.L. Creating value through supply chain integration. Supply Chain Manag. Rev. 2000, 4, 30–36. [Google Scholar]
  16. Simatupang, T.M.; Sridharan, R. The Collaborative Supply Chain. Int. J. Logist. Manag. 2002, 13, 15–30. [Google Scholar] [CrossRef]
  17. Yuan, K.F.; Ma, S.H.; He, B.; Gao, Y. Inventory decision-making models for a closed-loop supply chain system with different decision-making structures. Int. J. Prod. Res. 2015, 53, 183–219. [Google Scholar] [CrossRef]
  18. Chung, S.; Wee, H.; Yang, P. Optimal policy for a closed-loop supply chain inventory system with remanufacturing. Math. Comput. Model. 2008, 48, 867–881. [Google Scholar] [CrossRef]
  19. Cannella, S.; Bruccoleri, M.; Framinan, J.M. Closed-loop supply chains: What reverse logistics factors influence performance? Int. J. Prod. Econ. 2016, 175, 35–49. [Google Scholar] [CrossRef] [Green Version]
  20. Chen, W.; Kucukyazici, B.; Verter, V.; Jesús Sáenz, M. Supply chain design for unlocking the value of remanufacturing under uncertainty. Eur. J. Oper. Res. 2015, 247, 804–819. [Google Scholar] [CrossRef]
  21. Ketzenberg, M. The value of information in a capacitated closed loop supply chain. Eur. J. Oper. Res. 2009, 198, 491–503. [Google Scholar] [CrossRef]
  22. de Brito, M.P.; van der Laan, E. Inventory control with product returns: The impact of imperfect information. Eur. J. Oper. Res. 2009, 194, 85–101. [Google Scholar] [CrossRef]
  23. Diabat, A.; Abdallah, T.; Henschel, A. A closed-loop location-inventory problem with spare parts consideration. Comput. Oper. Res. 2015, 54, 245–256. [Google Scholar] [CrossRef]
  24. Ferrer, G. Yield information and supplier responsiveness in remanufacturing operations. Eur. J. Oper. Res. 2003, 149, 540–556. [Google Scholar] [CrossRef]
  25. Ketzenberg, M.E.; Souza, G.C.; Guide, V.D.R. Mixed Assembly and Disassembly Operations for Remanufacturing. Prod. Oper. Manag. 2003, 12, 320–335. [Google Scholar] [CrossRef]
  26. Bazan, E.; Jaber, M.Y.; Zanoni, S. Carbon emissions and energy effects on a two-level manufacturer-retailer closed-loop supply chain model with remanufacturing subject to different coordination mechanisms. Int. J. Prod. Econ. 2017, 183, 394–408. [Google Scholar] [CrossRef]
  27. Hosoda, T.; Disney, S.M.; Gavirneni, S. The impact of information sharing, random yield, correlation, and lead times in closed loop supply chains. Eur. J. Oper. Res. 2015, 246, 827–836. [Google Scholar] [CrossRef] [Green Version]
  28. Adenso-Díaz, B.; Moreno, P.; Gutiérrez, E.; Lozano, S. An analysis of the main factors affecting bullwhip in reverse supply chains. Int. J. Prod. Econ. 2012, 135, 917–928. [Google Scholar] [CrossRef]
  29. Shi, J.; Zhang, G.; Sha, J. Optimal production planning for a multi-product closed loop system with uncertain demand and return. Comput. Oper. Res. 2011, 38, 641–650. [Google Scholar] [CrossRef] [Green Version]
  30. Yang, P.C.; Wee, H.M.; Chung, S.L.; Ho, P.C. Sequential and global optimization for a closed-loop deteriorating inventory supply chain. Math. Comput. Model. 2010, 52, 161–176. [Google Scholar] [CrossRef]
  31. Ketzenberg, M.; Laan, E.; Teunter, R. Value of information in closed loop supply chains. Prod. Oper. Manag. 2006, 15, 393–406. [Google Scholar] [CrossRef]
  32. Aras, N.; Verter, V.; Boyaci, T. Coordination and Priority Decisions in Hybrid Manufacturing/Remanufacturing Systems. Prod. Oper. Manag. 2006, 15, 528–543. [Google Scholar] [CrossRef]
  33. Uncertainty—Wikipedia. Available online: https://en.wikipedia.org/wiki/Uncertainty (accessed on 10 August 2020).
  34. Nativi, J.J.; Lee, S. Impact of RFID information-sharing strategies on a decentralized supply chain with reverse logistics operations. Int. J. Prod. Econ. 2012, 136, 366–377. [Google Scholar] [CrossRef]
  35. Dekker, R.; Fleischmann, M.; Inderfurth, K.; Wassenhove, L.N. Reverse Logistics: Quantitative Models for Closed-Loop Supply Chains; Springer Science & Business Media: Berlin, Germany, 2013; ISBN 978-3-540-24803-3. [Google Scholar]
  36. Van der Laan, E.; Salomon, M.; Dekker, R.; Van Wassenhove, L. Inventory Control in Hybrid Systems with Remanufacturing. Manag. Sci. 2008, 45, 733–747. [Google Scholar] [CrossRef]
  37. Simatupang, T.M.; Wright, A.C.; Sridharan, R. The knowledge of coordination for supply chain integration. Bus. Process Manag. J. 2002, 8, 289–308. [Google Scholar] [CrossRef]
  38. Fisher, M.L. What is the right supply chain for your product? Harv. Bus. Rev. 1997, 75, 105–117. [Google Scholar]
  39. Sepulveda Rojas, J.P.; Frein, Y. Coordination and demand uncertainty in supply chains. Prod. Plan. Control 2008, 19, 712–721. [Google Scholar] [CrossRef]
  40. Yang, P.C.; Chung, S.L.; Wee, H.M.; Zahara, E.; Peng, C.Y. Collaboration for a closed-loop deteriorating inventory supply chain with multi-retailer and price-sensitive demand. Int. J. Prod. Econ. 2013, 143, 557–566. [Google Scholar] [CrossRef]
  41. Al-Salem, M.; Diabat, A.; Dalalah, D.; Alrefaei, M. A closed-loop supply chain management problem: Reformulation and piecewise linearization. J. Manuf. Syst. 2016, 40, 1–8. [Google Scholar] [CrossRef]
  42. Giri, B.C.; Sharma, S. Optimizing a closed-loop supply chain with manufacturing defects and quality dependent return rate. J. Manuf. Syst. 2015, 35, 92–111. [Google Scholar] [CrossRef]
  43. Sterman, J.D. Teaching Takes Off: Flight Simulators for Management Education; OR/MS Today: Catonsville, MD, USA, 1992; pp. 40–44. [Google Scholar]
Figure 1. Structure for the reverse supply chain analysis.
Sustainability 12 08398 g001
Figure 2. (a) Global coordination cost and uncertainty for different return rates. (b) Local coordination cost and uncertainty for different return rates.
Sustainability 12 08398 g002
Figure 3. (a) Global vs. local coordination cost for a return rate of 20% for different levels of uncertainty. (b) Global vs. local coordination cost for a return rate of 50% for different levels of uncertainty.
Sustainability 12 08398 g003
Figure 4. Local cost without sharing lot size information and uncertainty for different return rates.
Sustainability 12 08398 g004
Table 1. Main characteristics of the articles analyzed.
AuthorSupply Chain StructureInformation SharedInformation About
Returns
Coordination and Value of Information
(F. Chen, 1998)Serial inventory system with N stagesDemandn/aPositive
(Lee, So, and Tang, 2000)One manufacturer, one retailerDemand, lead timen/aPositive
(Cachon and Fisher, 2000)1 manufacturer, N retailersDemandn/aPositive
(Ketzenberg, 2009)1 manufacturer/remanufacturerDemand, returns, capacity, return performanceYesNeutral or negative
(Aras, Verter, and Boyaci, 2006)1 manufacturer/remanufacturerPriorityYesNeutral or negative
(Ketzenberg, Souza, and Guide, 2003)1 manufacturer/remanufacturerInformation performanceYesNeutral or negative
(Ketzenberg, Laan, and Teunter, 2006)1 manufacturer/remanufacturerDemand, returns, returns performanceYesNeutral or negative
(de Brito and van der Laan, 2009)Single echelonLead time, demandYesNeutral or negative
(Yuan et al., 2015)A retailer, a manufacturer, a supplier, and a collectorLead time, cycle times, demandYesPositive
(Bazan, Jaber, and Zanoni, 2017)1 manufacturer, 1 retailBatch size, number of remanufactured and new products, number of times a product is remanufactured.YesNeutral or negative
(Yang et al., 2013)1 manufacturer, N retailersInventory in retail and producer, shipments of products to and from the retailerYesPositive
(Diabat, Abdallah, and Henschel, 2015)l retailers, m remanufacturing centers and n distribution centersLocation, transport, and inventory stock decisionsYesNeutral or negative
(Shi, Zhang, and Sha, 2011)1 manufacturer/remanufacturerBatch sizes of new and remanufactured productsYesNeutral or negative
(Al-Salem et al., 2016)1 manufacturer, N distribution centers, M retailersWarehouse allocation and inventory policyYesPositive
(Chung, Wee, and Yang, 2008)1 manufacturer, 1 retailManufacturing and remanufacturing rates, demand, returns, setup, and holding costs.YesPositive
(Yang et al., 2010)A manufacturer, a retailer, a collector and a material supplier.Number of deliveries of new and remanufactured products
and acquisition of products
YesPositive
(Giri and Sharma, 2015)A retailer, 1 manufacturer, 1 supplier and 1 collectorProduction rates, number of deliveries, return rates, remanufactured productsYesPositive
(Adenso-Díaz et al., 2012)5 echelon supply chainInventories, lot sizing, shipmentsYesPositive
(Cannella, Bruccoleri, and Framinan, 2016)1 manufacturer/remanufacturerBacklogs, products collected, inventory, remanufactured products, and shipments.YesPositive
(W. Chen et al., 2015)1 manufacturer, n distribution centers,Market size, returns, yield recovery, shipmentsYesPositive
(Hosoda, Disney, and Gavirneni, 2015)1 manufacturer, 1 remanufacturerLevels of inventory, demand, and returnsYesPositive
Table 2. Coordination scenarios to be analyzed in this work.
Information Shared
(Value of Information)
Decision Making Perimeter
Information statusDemandReturnsLot SizingGlobalLocal
Everything is knownYesYesYesScenario 1Scenario 2
Everything is knownYesYesNo Scenario 3
Nothing is knownNoNoYesScenario 4Scenario 5
Nothing is knownNoNoNo Scenario 6
Partially knownYesNoYesScenario 7Scenario 8
Partially knownYesNoNo Scenario 9
Partially knownNoYesYesScenario 10Scenario 11
Partially knownNoYesNo Scenario 12
Table 3. Values used to generate the instances of analysis.
Demand/ReturnForecast and Uncertainty
Dt ~ U (8;12)Fdt~Dt + U (−1;1)
Fdt~Dt + U (−2;2)
Fdt~Dt + U (−3;3)
Rt (20%) ~ Dt × 20%Frt ~ Rt (20%) + U (−1;1)
Frt ~ Rt (20%) + U (−2;2)
Frt ~ Rt (20%) + U (−3;3)
Rt (50%) ~ Dt × 50%Frt ~ Rt (50%) + U (−1;1)
Frt ~ Rt (50%) + U (−2;2)
Frt ~ Rt (50%) + U (−3;3)
Rt (80%) ~ Dt × 80%Frt ~ Rt (80%) + U (−1;1)
Frt ~ Rt (80%) + U (−2;2)
Frt ~ Rt (80%) + U (−3;3)

