Article

Sectoral Decomposition of Korea’s Energy Consumption by Global Value Chain Dimensions

1
Division of Climate Technology Cooperation, Green Technology Center, Seoul 04554, Korea
2
Department of Commerce and Finance, Kookmin University, Seoul 02707, Korea
*
Author to whom correspondence should be addressed.
Sustainability 2020, 12(20), 8483; https://doi.org/10.3390/su12208483
Submission received: 20 September 2020 / Revised: 4 October 2020 / Accepted: 5 October 2020 / Published: 14 October 2020
(This article belongs to the Special Issue Towards Sustainability: Energy and Carbon Efficiency)

Abstract

:
This paper analyzed the annual trends in energy consumption of 14 industries in Korea from 2000 to 2014 using an extended log mean Divisia index (LMDI) method that embedded global value chain (GVC) divisions in the standard LMDI decomposition. Using a world input–output table, we calculated foreign value-added share in the GVC activities for each industry. Based on a Cobb–Douglas production technology, we embedded GVC divisions in the ordinary LMDI factor decomposition. The key findings indicate that the production effect mainly drives energy consumption, while energy consumption has decreased by both the foreign-structure effects and the foreign-intensity effects. Together with a decline in the domestic energy intensity effects, both of the GVC effects have improved energy efficiency. Energy-intensive industries have consumed more energy than other industries, while they have more incentive to save energy costs because these costs are a large proportion of total import costs. The opposite pattern occurred in other industry groups. Industries that do not naturally depend on energy tend to consume more energy and became more energy-intensive.

1. Introduction

Globalization has greatly influenced patterns in both international trade and energy use. It concatenates trade and environmental policies in the global value chain (GVC) perspective. Over the past two decades, trade liberalization has accelerated fragmentation of production across borders. Goods are produced in sequential stages of production across developing, emerging, and developed countries. GVCs have become a prominent feature of the world economy. In particular, the international division of labor has been stimulated by multinational corporations in overseas markets. For example, Apple utilizes division of labor to sell completed products to consumers around the world after procuring parts from Japan and Korea and assembling and processing them in China [1]. The United States’s telecommunication companies such as T-Mobile and Sprint have attempted international division of labor by outsourcing their customer call centers to Asian regions such as India. While in the early 2000s, an advance in communication and transportation technology with trade liberalization had intensified the GVCs network, after the 2008 global financial crisis, the prevalence of trade barriers has weakened the networks of GVCs [2]. Thus, economic policies that cope with uncertainty in changes in GVCs are an important issue for the world economy.
On the other hand, coping with climate change is also important. Most countries made new climate policies to control greenhouse gas (GHG) emissions because they were required to by the 2015 Paris Protocol [3]. As most countries in the world have experienced economic growth, their production has been driven by fossil fuels. This has caused massive GHG emissions, leading to climate change. According to the United Nations Framework Convention on Climate Change, many EU countries such as the U.K. and Germany have seen their GHG emissions fall steadily since 1990, while they peaked in 2007 and 2013, respectively, for the United States and Japan. Korea business as usual GHG emissions are projected to rise to 850.6 million tons carbon dioxide equivalents (CO2e) by 2030. Notably, Korea’s total energy consumption has increased by 2.5% annually, although Korea has fewer natural resources than other countries. Energy consumption has increased because of the expansion of facilities and a rise in the production of energy-intensive industries—primary metal, coke, petroleum, chemicals, and semiconductors—thus, boosting industrial energy consumption. Although Korea imports 96% of its total energy supply, the manufacturing sector accounted for 30.4% of GDP in 2014. Energy-intensive industrial products represent half of the manufacturing sector’s exports, which represent 84.1% of Korea’s gross exports [4]. Consequently, the energy intensity of energy-dependent industries in Korea is growing faster than that of other manufacturing industries and constitutes approximately 80% of the total energy consumption of Korea’s manufacturing industry. Both issues need analysis of which forces drive changes in energy consumption at the industrial level.
This paper analyzed annual trends in energy consumption of 14 industries in Korea from 2000 to 2014 using the log mean Divisia index (LMDI) factor decomposition. Departing from the previous literature, we extended the LMDI decomposition through the GVC dimensions constructed by Timmer et al. [5] and Los et al. [2]. In doing so, we measured the impact of Korea’s participation in GVC networks on energy consumption. This is important because most production processes in small open economies such as Korea’s intersect with international trade. First, using a world input–output table (WIOT released 2016), we calculated the foreign value-added share (FVAS) in the GVC activities for each industry. Second, based on a Cobb–Douglas production function, we embedded GVC divisions in the ordinary LMDI factor decomposition. It is referred to as the extended LMDI.
Our findings show that the production effect is the main driving force that increases energy consumption, while among the GVC components, energy consumption has decreased in both foreign-structure and foreign-intensity effects. This indicates that industries that depend more on imports are likely to utilize energy resources efficiently. Together with a decline in domestic energy-intensity effects, both GVC effects have improved energy efficiency.
To consider heterogeneity in the industry’s natural dependence on energy inputs, we compared the decomposition results of energy-intensive industries and other industries. We defined “Iron and steel/Non-ferrous metals,” “Chemical and petrochemical,” and “Non-metallic minerals” as energy-intensive industries. Energy-intensive industries have attained higher growth than other industries. This means that Korean economic growth has been led mainly by those industries that have consumed more energy. Furthermore, they have more incentive to save energy costs because these costs are a large proportion of total import costs. The opposite pattern occurred in the other industry groups. Industries that do not naturally depend on energy resources tend to consume more energy and became more energy intensive. Because such trends continued even after the financial crisis, the industry structure in the other industries has become more energy-intensive.
The remainder of this paper proceeds as follows. Section 2 reviews literature on the LMDI and GVC. Section 3 explains the methodology. Section 4 presents the data and results. Section 5 concludes the study.

2. Literature Survey

Since the decomposition methods of the refined Laspeyres and the LMDI that investigate the driving factors of energy consumption were suggested by Sun [6] and Ang [7], numerous decomposition analyses of domestic energy consumption have been conducted. The decomposition equation method was ideally developed by Ang and Choi [8] and by Ang [9] without the residuals. Each study of domestic energy decomposition consumption has its own implications with different respect to time-series and sectors. Kim [10] reviewed the Korean energy decomposition analysis literature and suggested the usage of output for each industry rather than value-added to measure the exact driving factors of domestic energy consumption.
Recent research papers on decomposition analysis of domestic energy consumption have attempted to add an implication with a transformed decomposition equation. In 2018, China accounted for 24% of global energy consumption and 34% of GDP growth [11]. Therefore, there have been many papers covering China’s energy consumption. Xu et al. [12] investigated the driving factors of domestic energy consumption in the cement industry sector. They utilized the production of the cement industry so that the production effect can be measured precisely with quantities, not value-added. Wang et al. [13] suggested a new model for decomposing domestic energy consumption that combines the Cobb–Douglas production function and the LMDI approach. In their approach, the production effect in the LMDI equation is decomposed into capital and labor effects following the production function framework. Wang and Feng [14] focused on the non-ferrous metal industry and decomposed production effects into labor productivity and industry scale effects. Sun and Liu [15] added fresh insight by modifying the decomposition equation with the national debt factor and found evidence that debt-related factors had a positive impact and mostly contributed to China’s increased energy consumption.
Achour and Belloumi [16] decomposed Tunisian energy consumption in the transport sector, adding transport quantity and population effects into the equation by utilizing annual data from 1985 to 2014. Akyurek [17] and Kim [18] investigated the driving factors of manufacturing industry energy consumption in Turkey and Korea, respectively. While Akyurek’s [17] research included 10 manufacturing industries, Kim [18] decomposed manufacturing energy consumption in 9 manufacturing sectors. Bianco [19] focused on the tourism sector in Italy to decompose electricity consumption using seven factors including energy intensity, productivity, turnover, accommodation structure, average hotel dimension, hotel share, and the total number of hospitality structures in the tourism sector only.
Recent decomposition analysis has been extending the implications by broadening the research into multiple countries. Fernandez et al. [20] extended the decomposition analysis by focusing on EU-27 countries with three decomposition levels. The decomposition levels were classified by country-level, region, and energy intensity. In each decomposition level, the empirical results imply different driving factors for energy consumption. Chen et al. [21] conducted decomposition analysis on energy consumption in the agricultural industry for 89 countries and analyzed the decoupling trend between energy consumption and economic growth by the evidence of production effects in the decomposition analysis. The results show that only 18 countries have reached the decoupling stage. The paper that is most closely related to our work is Wang et al. [13]. They extended the LMDI decomposition to include capital and labor factors by using a Cobb–Douglas production function. Our paper differs from Wang et al. [13] by extending the LMDI on the GVC perspectives. Numerous papers using the LMDI to decompose energy consumption for various countries have been published. So, as far as we know, however, this paper is the first attempt to combine the LMDI and GVC to embed international trade into the decomposition. This research contributes to the literature by broadening the horizon of decomposition analysis.
The literature on decomposed production activities at the country, sector, or country–sector levels to GVC activities is burgeoning. Empirical studies [5,22,23,24,25,26] focus mainly on the position of countries within global production networks by estimating the domestic value-added (DVA) content of a unit bundle of exports. Most of the literature focused on measuring the network of international trade in intermediate inputs and vertical specialization in trade. In the context, production processes are further split into separate activities, and countries increasingly specialize in particular stages of production.

3. Methodology and Data

In this section, we discuss our methodology and data. We contributed to the ordinary LMDI factor decomposition by reflecting a linkage of the domestic value-added with the GVC networks. It is appropriate for analyzing energy structures of a small open economy such as Korea, since most production processes in Korea are involved in international trade. First, we discuss how to measure the foreign value-added in the GVC activities for each industry. Second, we embed GVC divisions in the ordinary LMDI factor decomposition. In doing so, contributions of intermediate sectors to domestic energy consumption are further split into domestic contribution and foreign contribution.

3.1. Measuring International Fragmentation on GVCs

To measure fragmentation of production chains between one nation and the rest of the world, we derived the distribution of value-added by one nation’s final goods that are involved in full-length production chains across countries. This is based on the WIOTs. By adopting Timmer et al. [5] and Los et al. [2], we measured the contribution of foreign countries to the final goods in each industry sector. The WIOTs is an outcome of the World Input–Output Database (WIOD) project with the aim of developing accounting model frameworks to understand global integration. The database’s core is a set of harmonized supply and use tables along with data on international trade in goods and services. The new version of WIOTs covers 43 countries (including Korea, Japan, China, and EU members) and 56 industries (including 19 manufacturing and 33 service industries) for the period from 2000 to 2014. The tables connect the trade flow of intermediate and final goods across countries and industries. Table 1 illustrates the structure of WIOTs. There are N countries. For each country, the number of industries is N and the number of final demand categories is C . The ( S N × S N ) matrix A represents the intermediate inputs required per gross output unit, while υ ^ represents the value-added generated per gross output unit. Each country’s intermediate use indicates the intermediate input which is produced from an industry sector (row) of a country and used to produce goods in an industry sector (column) of another country.
As in Los et al. [2], the total contribution of value-added on the GVC networks can be calculated in an infinite geometrical series, as follows:
g = k = 1 g k = υ ^ ( I + A + A 2 + ) × ( F ˜ e ) = υ ^ ( I A ) 1 × ( F ˜ e )
where g indicates an S × N vector of value-added created by the GVC networks. F ˜ stands for a final demand matrix of dimensions ( S N × C N ), which has actual values only for cells in the final demand row for the country–industry ( i , j ) and is 0 otherwise. By multiplying F ˜ by a ( C N )-summation vector e , we obtain a ( S N )-vector F ˜ e with a single positive element of the world’s final demand of product ( i , j ). For first-tier suppliers, the value-added is represented by υ ^ ( F ˜ e ) . Their intermediate products A ( F ˜ e ) are provided by second-tier suppliers whose value-added is υ ^ A ( F ˜ e ) . As the number of tiers of value chains k approaches infinity, we obtain Equation (1). The vector g consists of the contribution of all countries ( k ) to each product ( i , j ) . The matrix ( I A ) 1 is the well-known Leontief inverse.
Next, we derived the final output value of product ( i , j ) F I N O ( i , j ) by aggregating value-added contributions, V A ( k ) ( i , j ) , of all countries in Equation (2).
F I N O ( i , j ) = k V A ( k ) ( i , j )
We decomposed the value of F I N O ( i , j ) into the sum of value-added contributions by foreign countries other than the country-of-completion j , defined by foreign value-added (FVA). For all countries contributing to the product, we can derive FVA by extracting the DVA—the sum of the value-added contribution by the country-of-completion j from FINO.
F V A ( i , j ) = k j V A ( k ) ( i , j ) = F I N O ( i , j ) V A ( j ) ( i , j )
We defined the share generated outside the country-of-completion as FVAS. Similarly, the share generated inside the country-of-competition was defined as DVAS. That is,
F V A S = F V A F I N O ; D V A S = 1 F V A S .
We used FVAS to measure the extent of international fragmentation on GVCs. DVA was used to estimate the value-added of a country-of-competition by a Cobb–Douglas production function. Using Equation (5), we extended the LMDI methodology on GVC dimensions.
Y i t = κ ( Y d , i t ) D V A S i t ( Y f , i t ) 1 D V A S i t
where Y d , i t and Y f , i t are the total values of domestic intermediate goods and foreign intermediate goods, respectively, used as inputs for production of good i at year t . According to the production technology, foreign intermediate sectors in GVC networks (including infinite numbers of tiers of value chains) contribute to produce good i by 1 D V A S i t . Notice that the share of DVA varies with good i and year t . Y i t represents the value of final good i . κ is a constant of scale parameter. For convenience, we set κ to one. The relative pattern of the results does not vary with κ .

3.2. LMDI Decomposition from the GVC Perspective

We adopted the standard LMDI method [9] to decompose energy consumption into three effects—production, structure, and intensity effects. The solutions to the LMDI decomposition approach are an outcome of perfect decomposition, which are time-reversal and component-reversal invariants. As in Ang [9], the LMDI decomposition handles zero-value problems by substituting 0 for infinitesimal numbers. The energy consumption in year t can be expressed as Equation (6). The change of the three components between a base year and a target year t are denoted in Equation (7).
E t = i ( Y t × Y i t Y t × E i t Y i t )
Δ E = Δ E Y + Δ E S + Δ E I
where E and Y denote energy consumption and real GDP, respectively. The subscripts i and t are the indices of industry and year, respectively. The equations reflect the impacts of GDP growth ( Δ E Y ), industrial structural change ( Δ E S ), and energy intensity ( Δ E I ), respectively, on energy consumption.
Next, we extended the standard LMDI method to GVC dimensions. By using Equation (5), we embedded GVC components into Equation (6) as shown in Equation (8). Each component of the structure and intensity effects in Equation (7) decomposed into domestic and foreign components: domestic-structure and foreign-structure effects and domestic-intensity and foreign-intensity effects, respectively. See Equation (10).
E t = i ( Y t × ( κ ( Y d , i t ) D V A S i t ( Y f , i t ) 1 D V A S i t Y t ) × ( ( E i t ) D V A S i t ( E i t ) 1 D V A S i t κ ( Y d , i t ) D V A S i t ( Y f , i t ) 1 D V A S i t ) )
E t = i ( Y t × ( κ Y d , i t Y t ) D V A S i t × ( κ Y f , i t Y t ) 1 D V A S i t × ( E i t κ Y d , i t ) D V A S i t × ( E i t κ Y f , i t ) 1 D V A S i t )
Δ E = Δ E Y + Δ E d , S + Δ E f , S + Δ E d , I + Δ E f , I
where Δ E Y , Δ E d , S , Δ E f , S , Δ E d , I , and Δ E f , I represent production, domestic-structure, foreign-structure, domestic-intensity, and foreign-intensity effects, respectively. Each effect on the right-hand side of Equation (8) can be computed as shown in Equations (11) through (15).
Δ E Y = i ( E i t E i t 1 ln ( E i t / E i t 1 ) ) × ln ( Y t Y t 1 )
Δ E d , S = i ( E i t E i t 1 ln ( E i t / E i t 1 ) ) × ln ( ( κ Y d , i t / Y t ) D V A S i t ( κ Y d , i t 1 / Y t 1 ) D V A S i t 1 )
Δ E f , S = i ( E i t E i t 1 ln ( E i t / E i t 1 ) ) × ln ( ( κ Y f , i t / Y t ) 1 D V A S i t ( κ Y f , i t 1 / Y t 1 ) 1 D V A S i t 1 )
Δ E d , I = i ( E i t E i t 1 ln ( E i t / E i t 1 ) ) × ln ( ( E i t / κ Y d , i t ) D V A S i t ( E i t 1 / κ Y d , i t 1 ) D V A S i t 1 )
Δ E f , I = i ( E i t E i t 1 ln ( E i t / E i t 1 ) ) × ln ( ( E i t / κ Y f , i t ) 1 D V A S i t ( E i t 1 / κ Y f , i t 1 ) 1 D V A S i t 1 )
The production effect Δ E Y reflects the impact of GDP growth on energy consumption as in the standard LMDI model. The domestic-structure and foreign-structure effects Δ E d , S and Δ E f , S reflect the impact of energy consumption changes in domestic and foreign intermediate goods, respectively, to value-added in GVC networks. An increase in Δ E f , S indicates that industries that import more intermediate inputs are more energy-intensive than industries that import fewer.
The domestic- and foreign-intensity effects Δ E d , I and Δ E f , I are literally defined as the ratios of industrial energy use to domestic and foreign intermediate goods, respectively. Because we consider energy consumption of a country-of-competition, a rise in Δ E d , I reflects that energy factors are used much more to produce one unit of value-added of the corresponding industry. We cautiously surmise that a rise in Δ E f , I indicates that the value-added from foreign intermediate goods compared to domestic energy consumption to produce the final outcome has increased. This means that in the process of production of intermediate goods, domestic energy is efficiently consumed to produce value-added for foreign intermediate goods.

3.3. Data Construction

We used three dataset sources to measure the Korean energy-use patterns from the GVC perspective. First, we constructed a dataset for two kinds of industry-level energy uses—both total primary energy supply (TPES) and total final consumption (TFC) released by the energy balance database of the International Energy Agency (IEA) [27]. In doing so, we counted the case where using the final energy consumption could exclude information on the transformation loss of electrical power generation. The measurement unit is thousand ton of oil equivalent (ktoe). By comparing two LMDI results, we can indirectly derive the impact of the conversion (generation) sector on energy consumption. Second, for value-added of the domestic and foreign intermediates, we obtained industrial value-added for all countries from the WIOT’s 2016 release. The share of D V A S i t is calculated by using information from the WIOT. The unit is in millions of U.S. dollars.
Unfortunately, the IEA energy balance and WIOT databases are constructed using different industrial definitions (Appendix A, Table A1). The industrial definition used in the WIOT is more disaggregated than that in the IEA energy balance. We summed up the WIOT’s data according to the IEA standard and then merged the two datasets. The completed database covers 14 industries (including manufacturing and services). The sample period was from 2000 to 2014. Finally, we derived real GDP data in billions KRW from the Korean Statistical Information Service [28]. Table 2 shows the descriptive statistics for the data used.
Data sources: IEA energy balances, WIOT’s 2016 releases, and the Korean Statistical Information Service. TPES—total primary energy supply, TFC—total final consumption, GVC—global value chain.
Although the IEA energy balances provide aggregate supply data for each country, TPES data do not exist by sector. Sectoral energy consumption data are only measured in the form of TFC. Because there is a generation sector between TPES and TFC, the TPES data were estimated as follows. First, we assumed that the difference between TPES and TFC is equal to the input of secondary energy generators—electricity and heat. In addition, the residential and non-energy-use sectors are not classified as production sectors and were omitted in our analysis. By using the share of each sector in TFC, the input of the secondary generator was assigned to its corresponding sector. Therefore, the TPES data for the 14 production sectors we used included both sectoral consumption other than secondary energy and total input of secondary energy generators.
Table 3 shows the change rate in energy consumption and value-added for the 14 production sectors between 2000 and 2014. Overall, total energy consumption increased by 36.66% and 19.92% in TPES and TFC, respectively. There was no such remarkable difference between the change rate of TPES and TFC, except for transport equipment and agriculture/forestry/fishing. The differences in change rates between TPES and TFC depends on the electrification of each sector and the conversion efficiency in the generation sector. On the other hand, the value-added measured by GVC and real GDP shows significant differences because GVC reflects foreign economic situations in consideration of international trade. According to GVC data, Korean value-added increased by 192.40%, while real GDP increased 75.63%. For the mining and quarrying sector, while real GDP decreased, the value-added measured by GVC increased. This implies that the domestic mining and quarrying industry sector has diminished, and the Korean domestic industry has relied heavily on foreign mining and quarrying industries.
Energy intensity is measured by dividing TPES by real GDP. Korean energy intensity decreased from 2000 to 2014 by −0.03. Among the 14 production sectors, while most sectors indicated a decrease in energy intensity, which means that energy might be being used efficiently, for the iron and steel/non-ferrous metals, mining and quarrying, and food and tobacco sectors, energy intensity increased. For mining and quarrying—considered to have decreased in terms of real GDP—the weak production capacity of this sector would be the main reason rather than a decrease in energy efficiency. Surprisingly, productivity improvements in the service sector in Korea did not deliver improvements in energy-intensity because energy consumption in the sector increased. We utilized the datasets from multiple sources to find the driving force behind Korean energy consumption under consideration of GVC. The results of the decomposition comparison between domestic and GVC value-added provide the foreign economic impact on Korean energy consumption, and the comparison of the results between TPES and TFC demonstrates the importance of considering the generation sector in the decomposition analysis.

4. Empirical Results

4.1. Aggregate Energy Decomposition

In this paper, we focused on a long-run trend of Korean energy consumption from 2000 to 2014 by considering the impact of GVC networks on energy consumption. The Korean economy is a small open economy, and its exports and imports are greatly affected by the world economy. Since 2000, it has undergone a change related to trade policies. Hence, its industry structure and energy consumption were largely affected by foreign trade. We adopted the fixed base year approach of LMDI decomposition by comparing economic variables from a base year (2000) with different years.
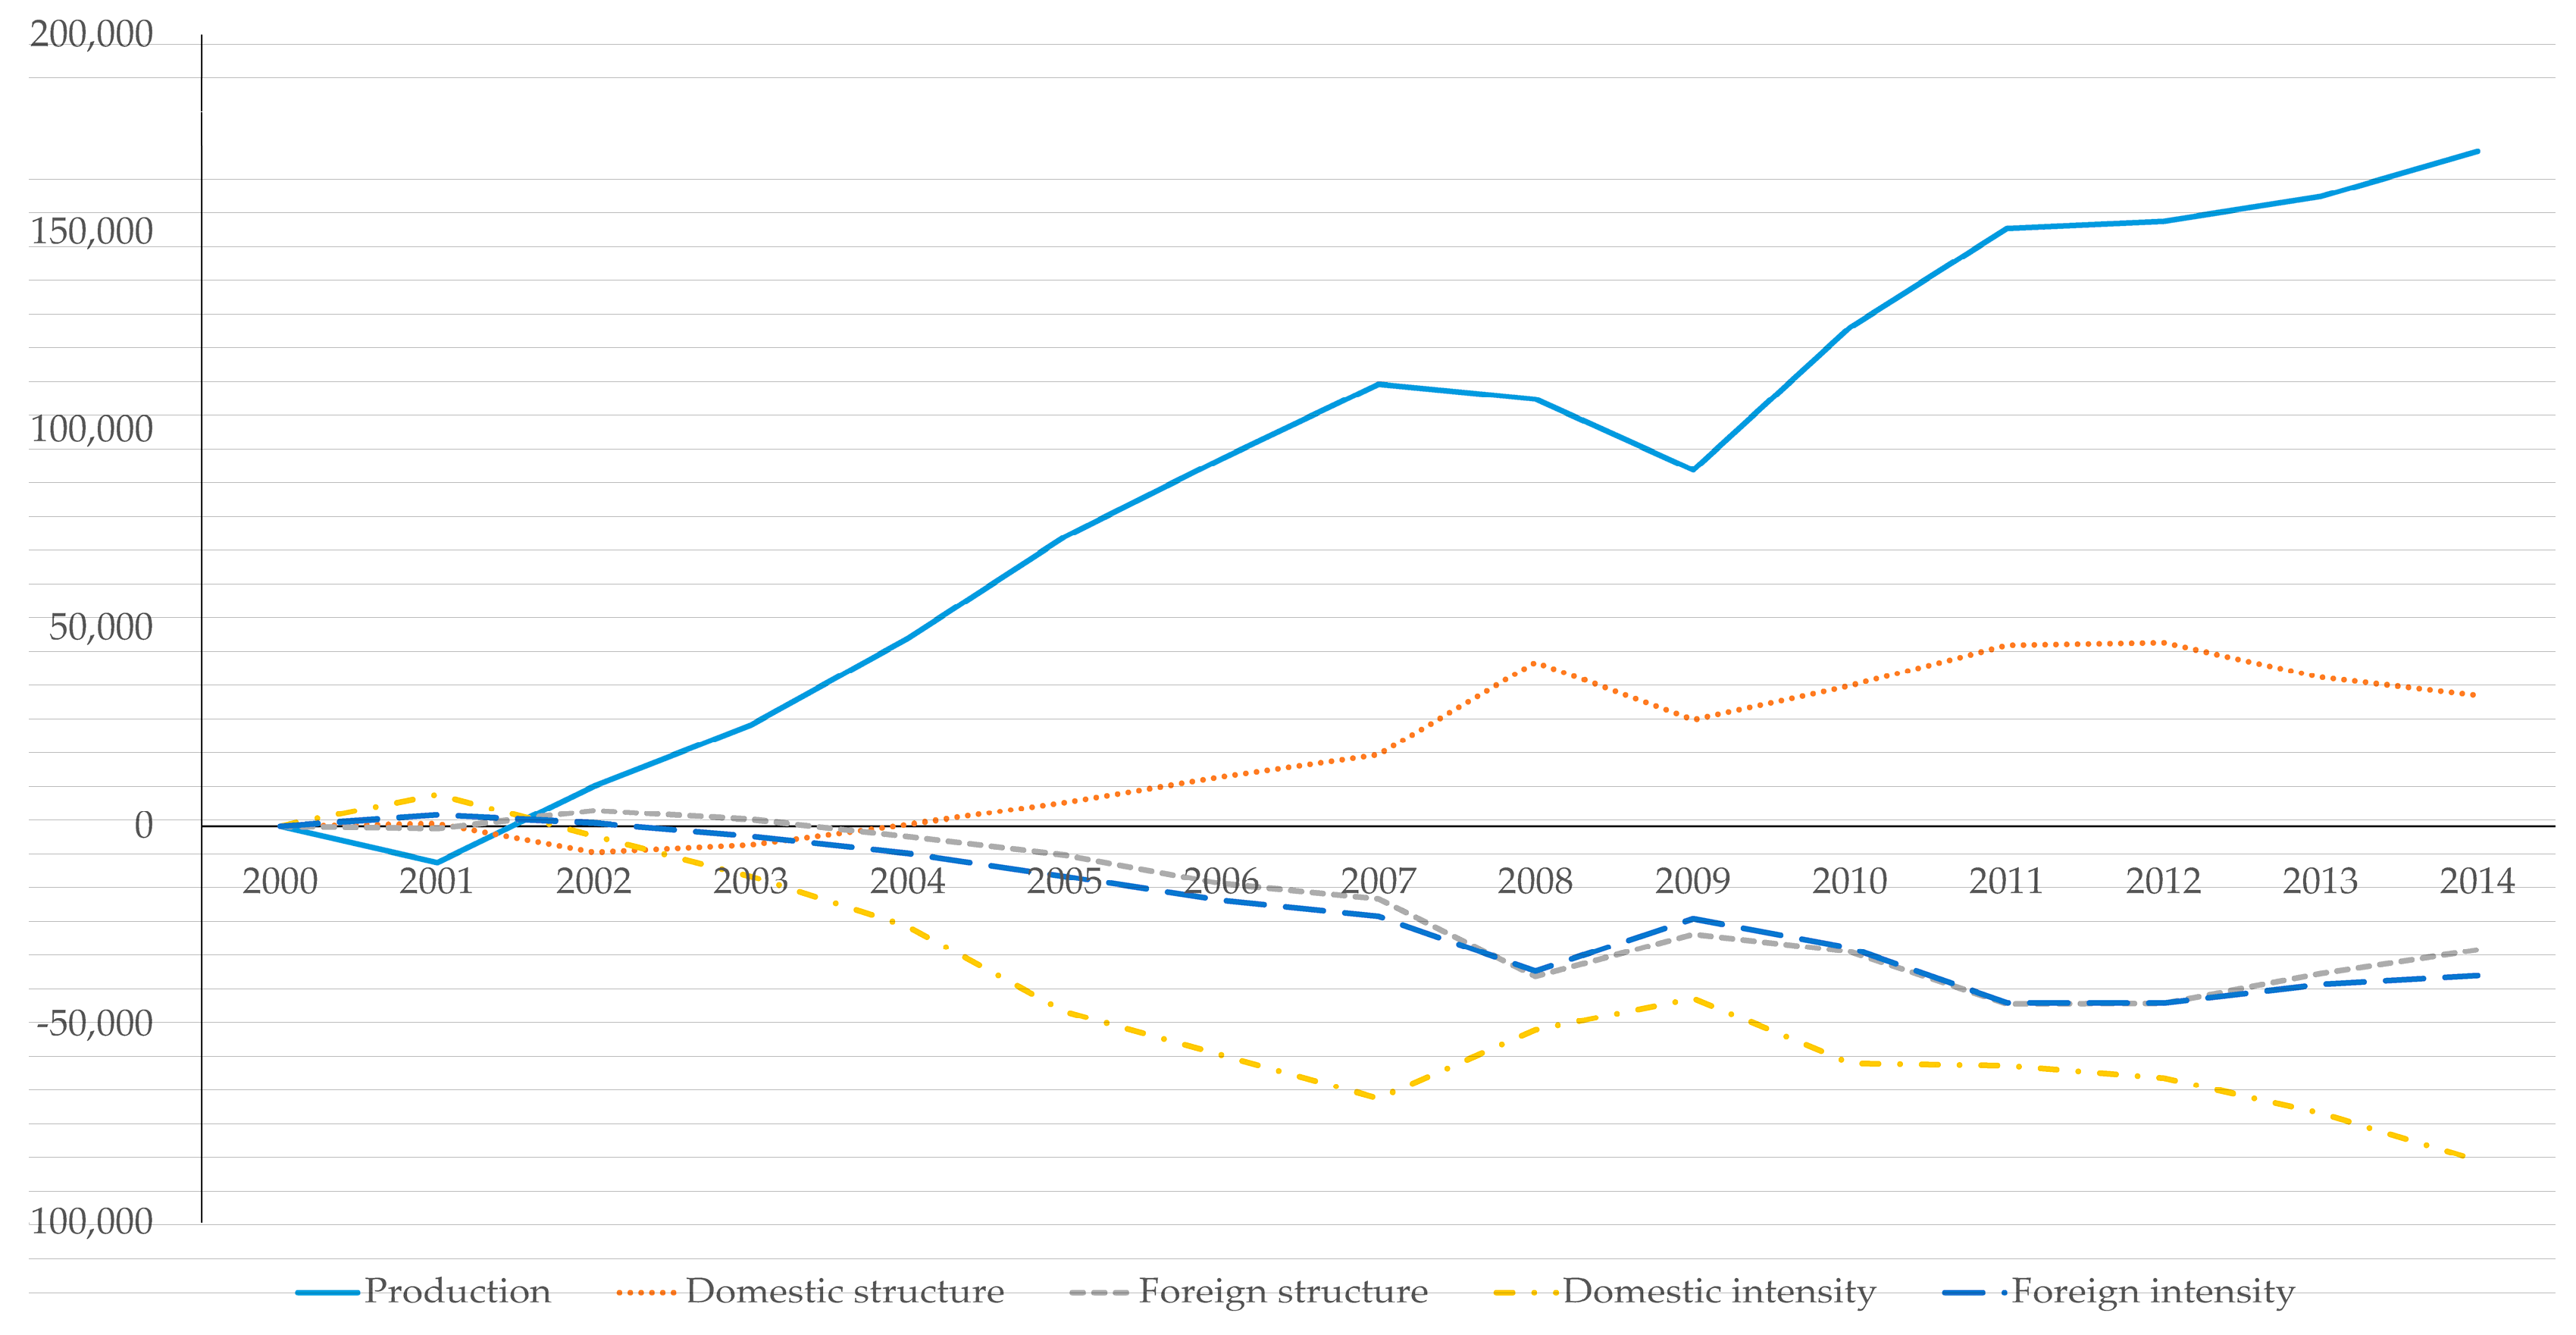
Figure 1 displays production, domestic-structure, foreign-structure, domestic-intensity, and foreign-intensity effects for the whole industry according to cumulative change from 2000 to 2014. Consistent with the previous literature, the production effect is a main driving force in increasing energy consumption. The impact of economic activity on energy consumption weakened during the financial crisis from 2007 to 2008. Domestic-structure effects also have affected an increase in energy consumption. Energy-intensity effects have weakened: energy factors are used less to produce one unit of value-added in the corresponding industry. The GVC components, both foreign-structure effects and foreign-intensity effects declined. This means that, in the process of production of intermediate goods, domestic energy is efficiently consumed to produce value-added for foreign intermediate goods. Industries that import more intermediate inputs have tended to be less energy-intensive than others.
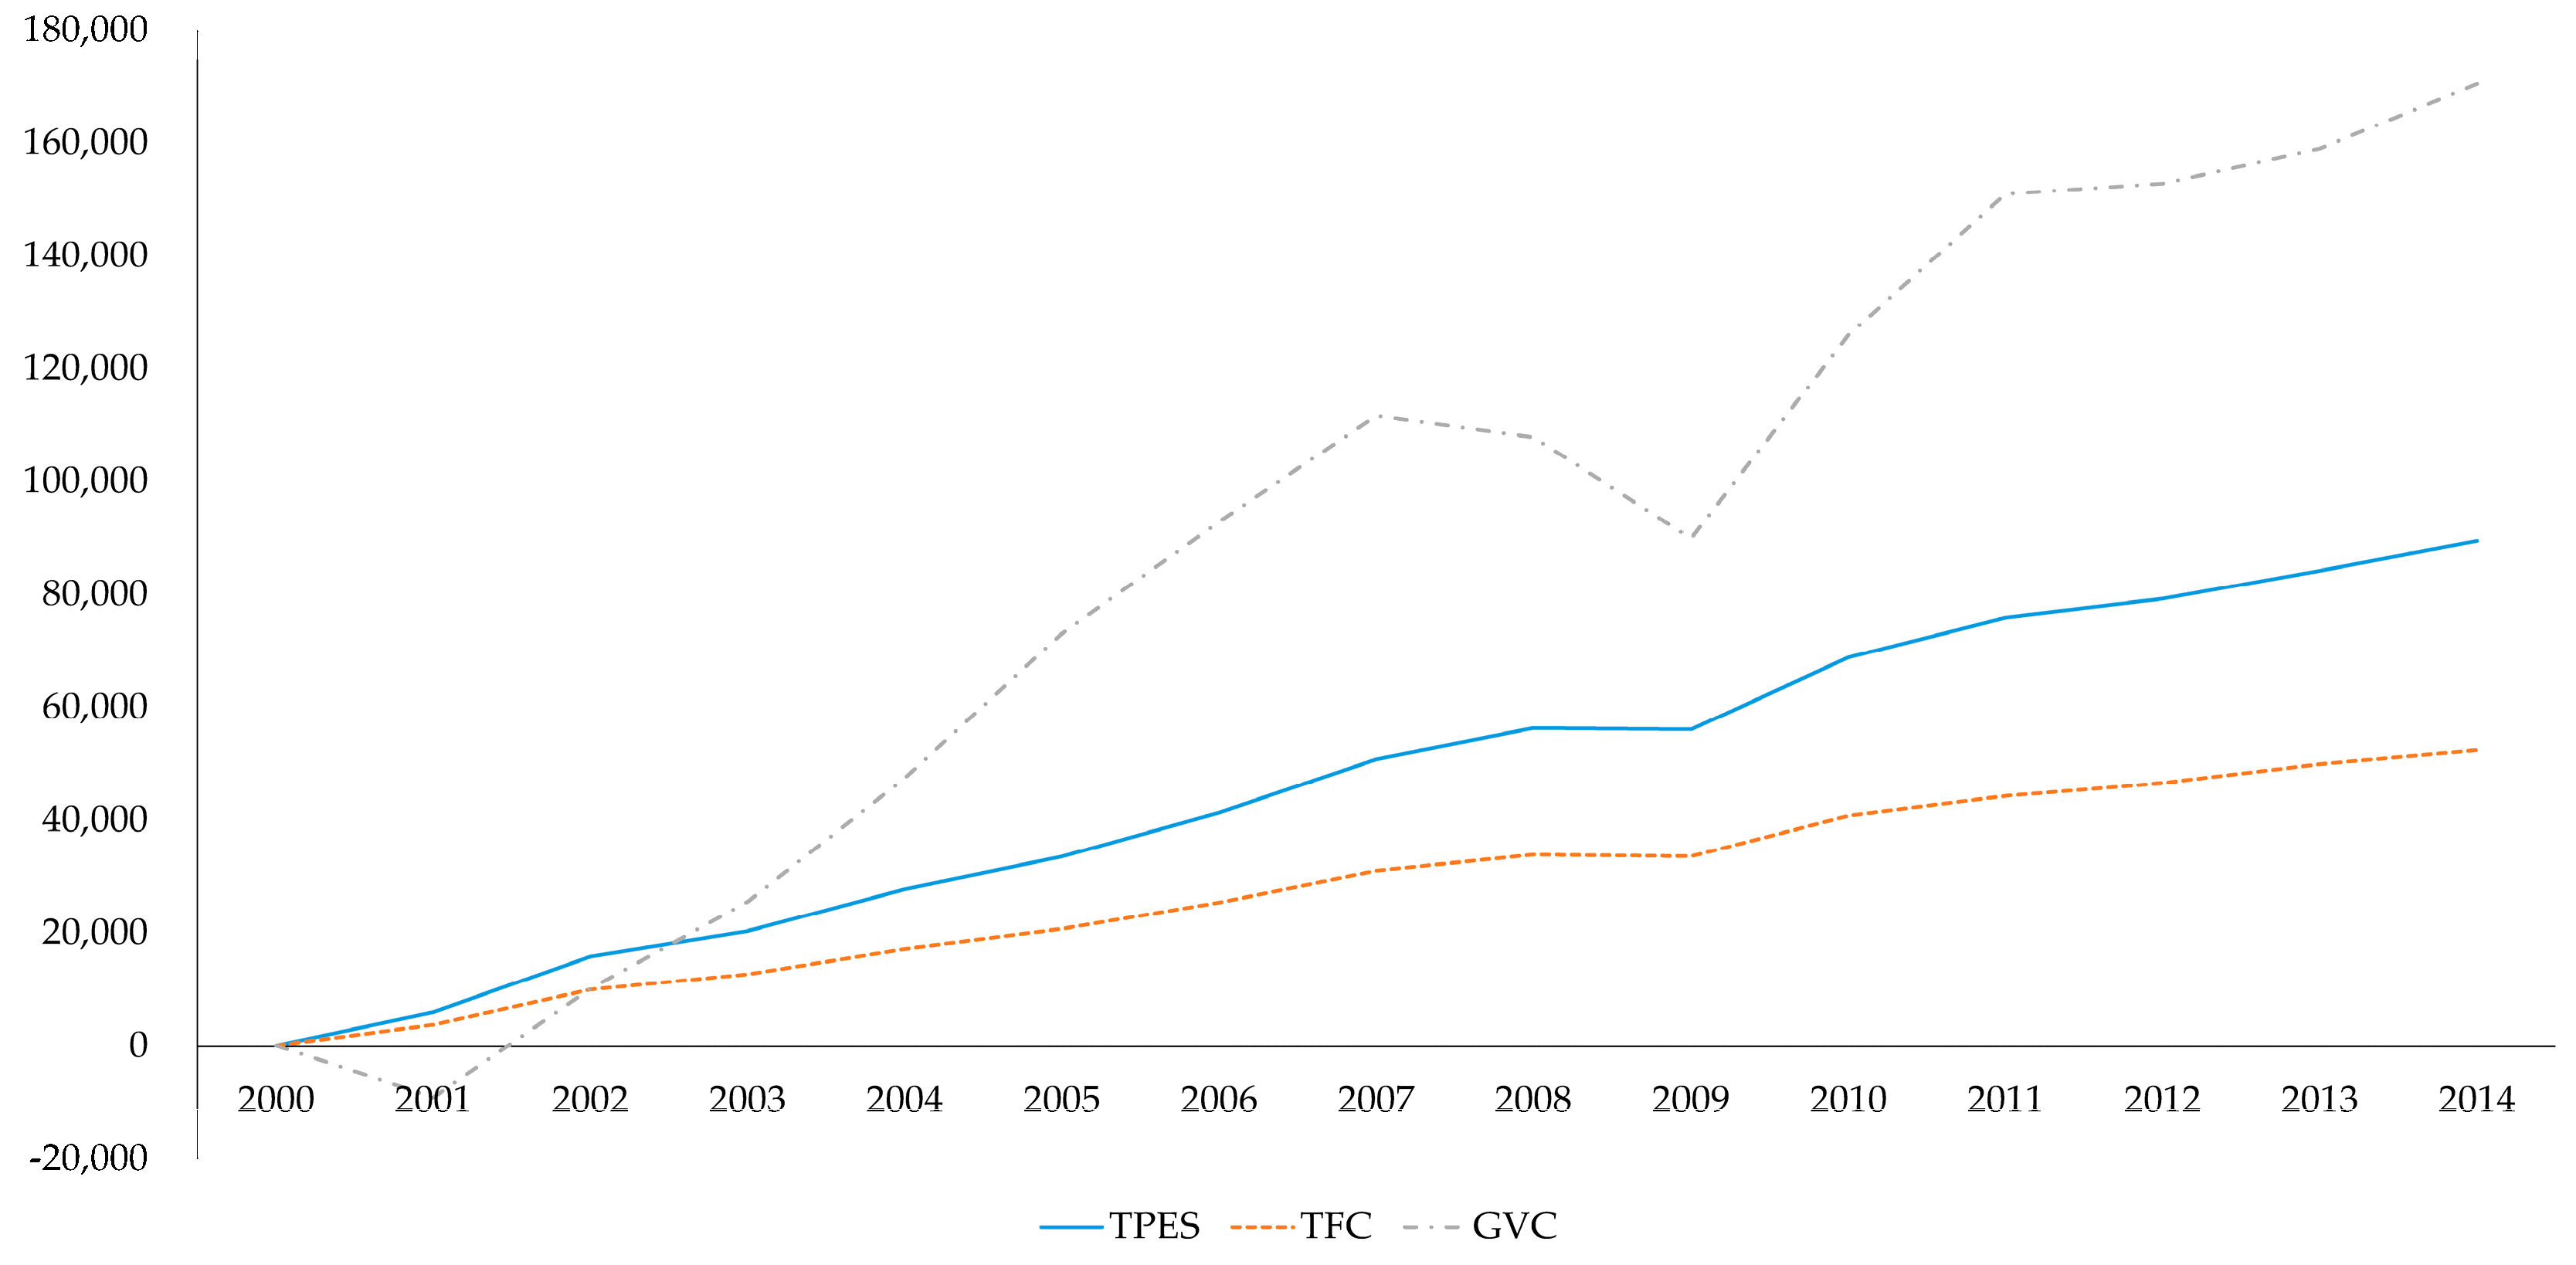
In this study, each effect was compared with the corresponding ordinary LMDI results. Figure 2 compares the production effect between the extended LMDI and the two kinds of ordinary LMDI results (TPES and TFC decomposition). TPES includes energy input in the conversion sector. It is bigger than TFC. Because the industrial output in the extended LMDI covers the value chain of intermediate goods from abroad, the production effect is much larger than the ordinary results. This indicates that ordinary decomposition can underestimate the production and structural effects in a small open economy like Korea’s.
In 2014, production effects on energy consumption in the extended LMDI are about 2.3 times greater than the corresponding TPES decomposition, while they fluctuated more during the financial crisis. The production effects difference between the extended and ordinary LMDI models is shown for the financial crisis period. Because GVC includes not only domestic production but also foreign production, in a world recession, the production effect would be worse.
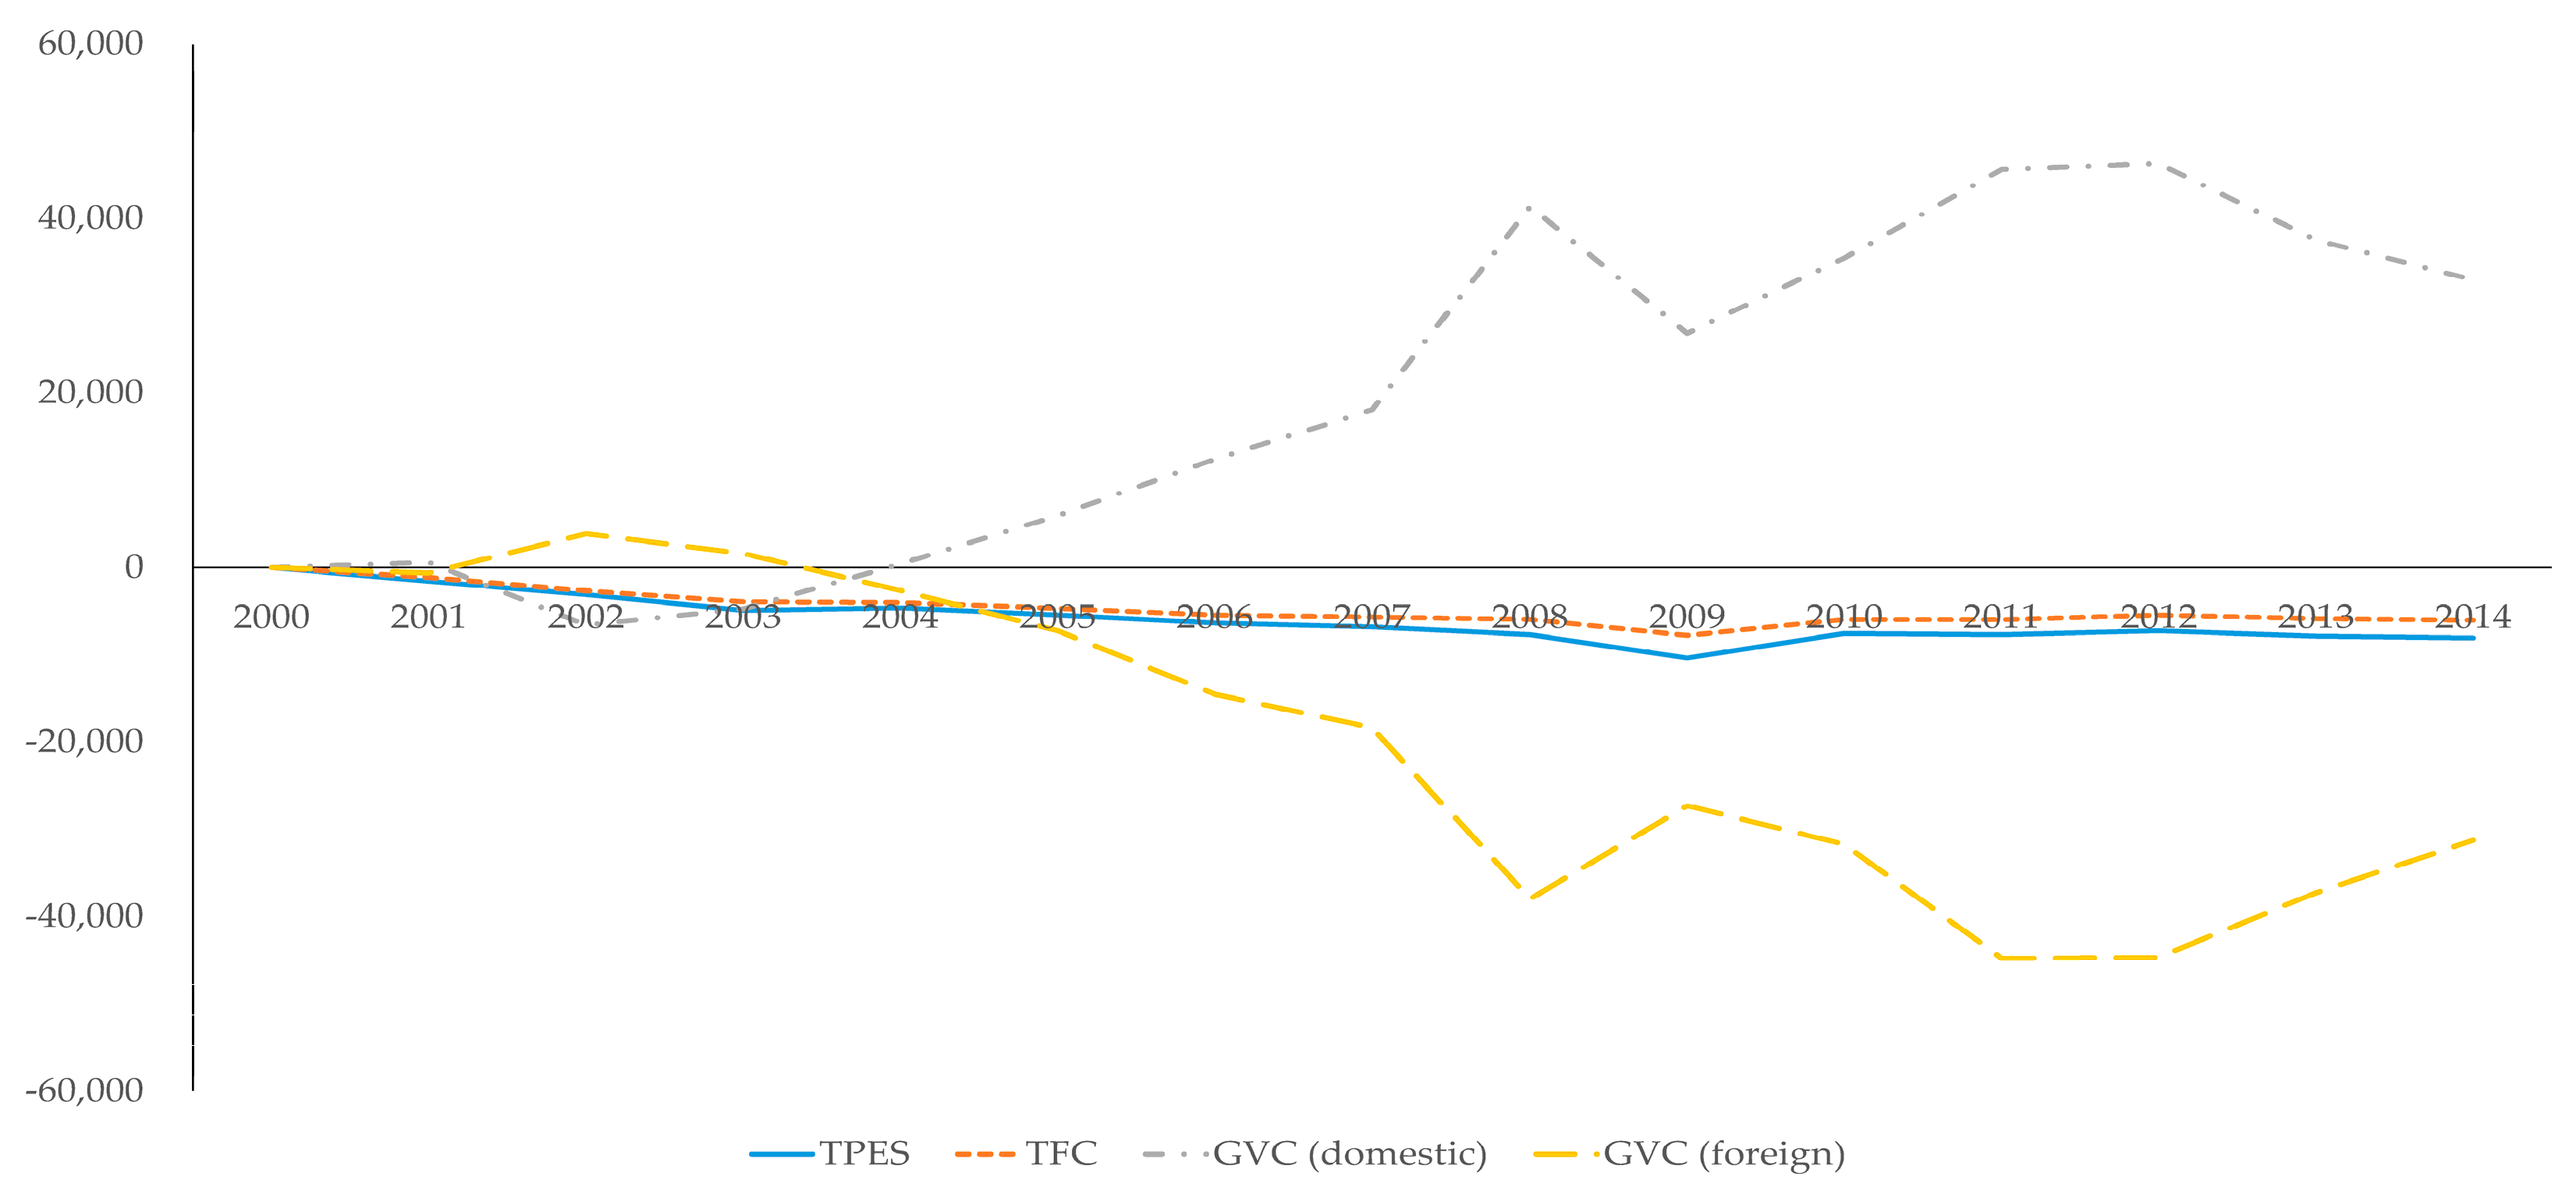
Figure 3 presents the structure effects derived by the ordinary LMDI and the extended LMDI models. The structural effects measure each industry sector’s share of energy consumption. Since 2004, domestic structural effects have been much larger than the corresponding ordinary results while foreign structural effects have opposite patterns. In 2008, the domestic extended LMDI structural effects spiked. During the financial crisis, overall industries were more energy intensive. However, industries that imported more intermediate inputs tended to be less energy intensive than others.
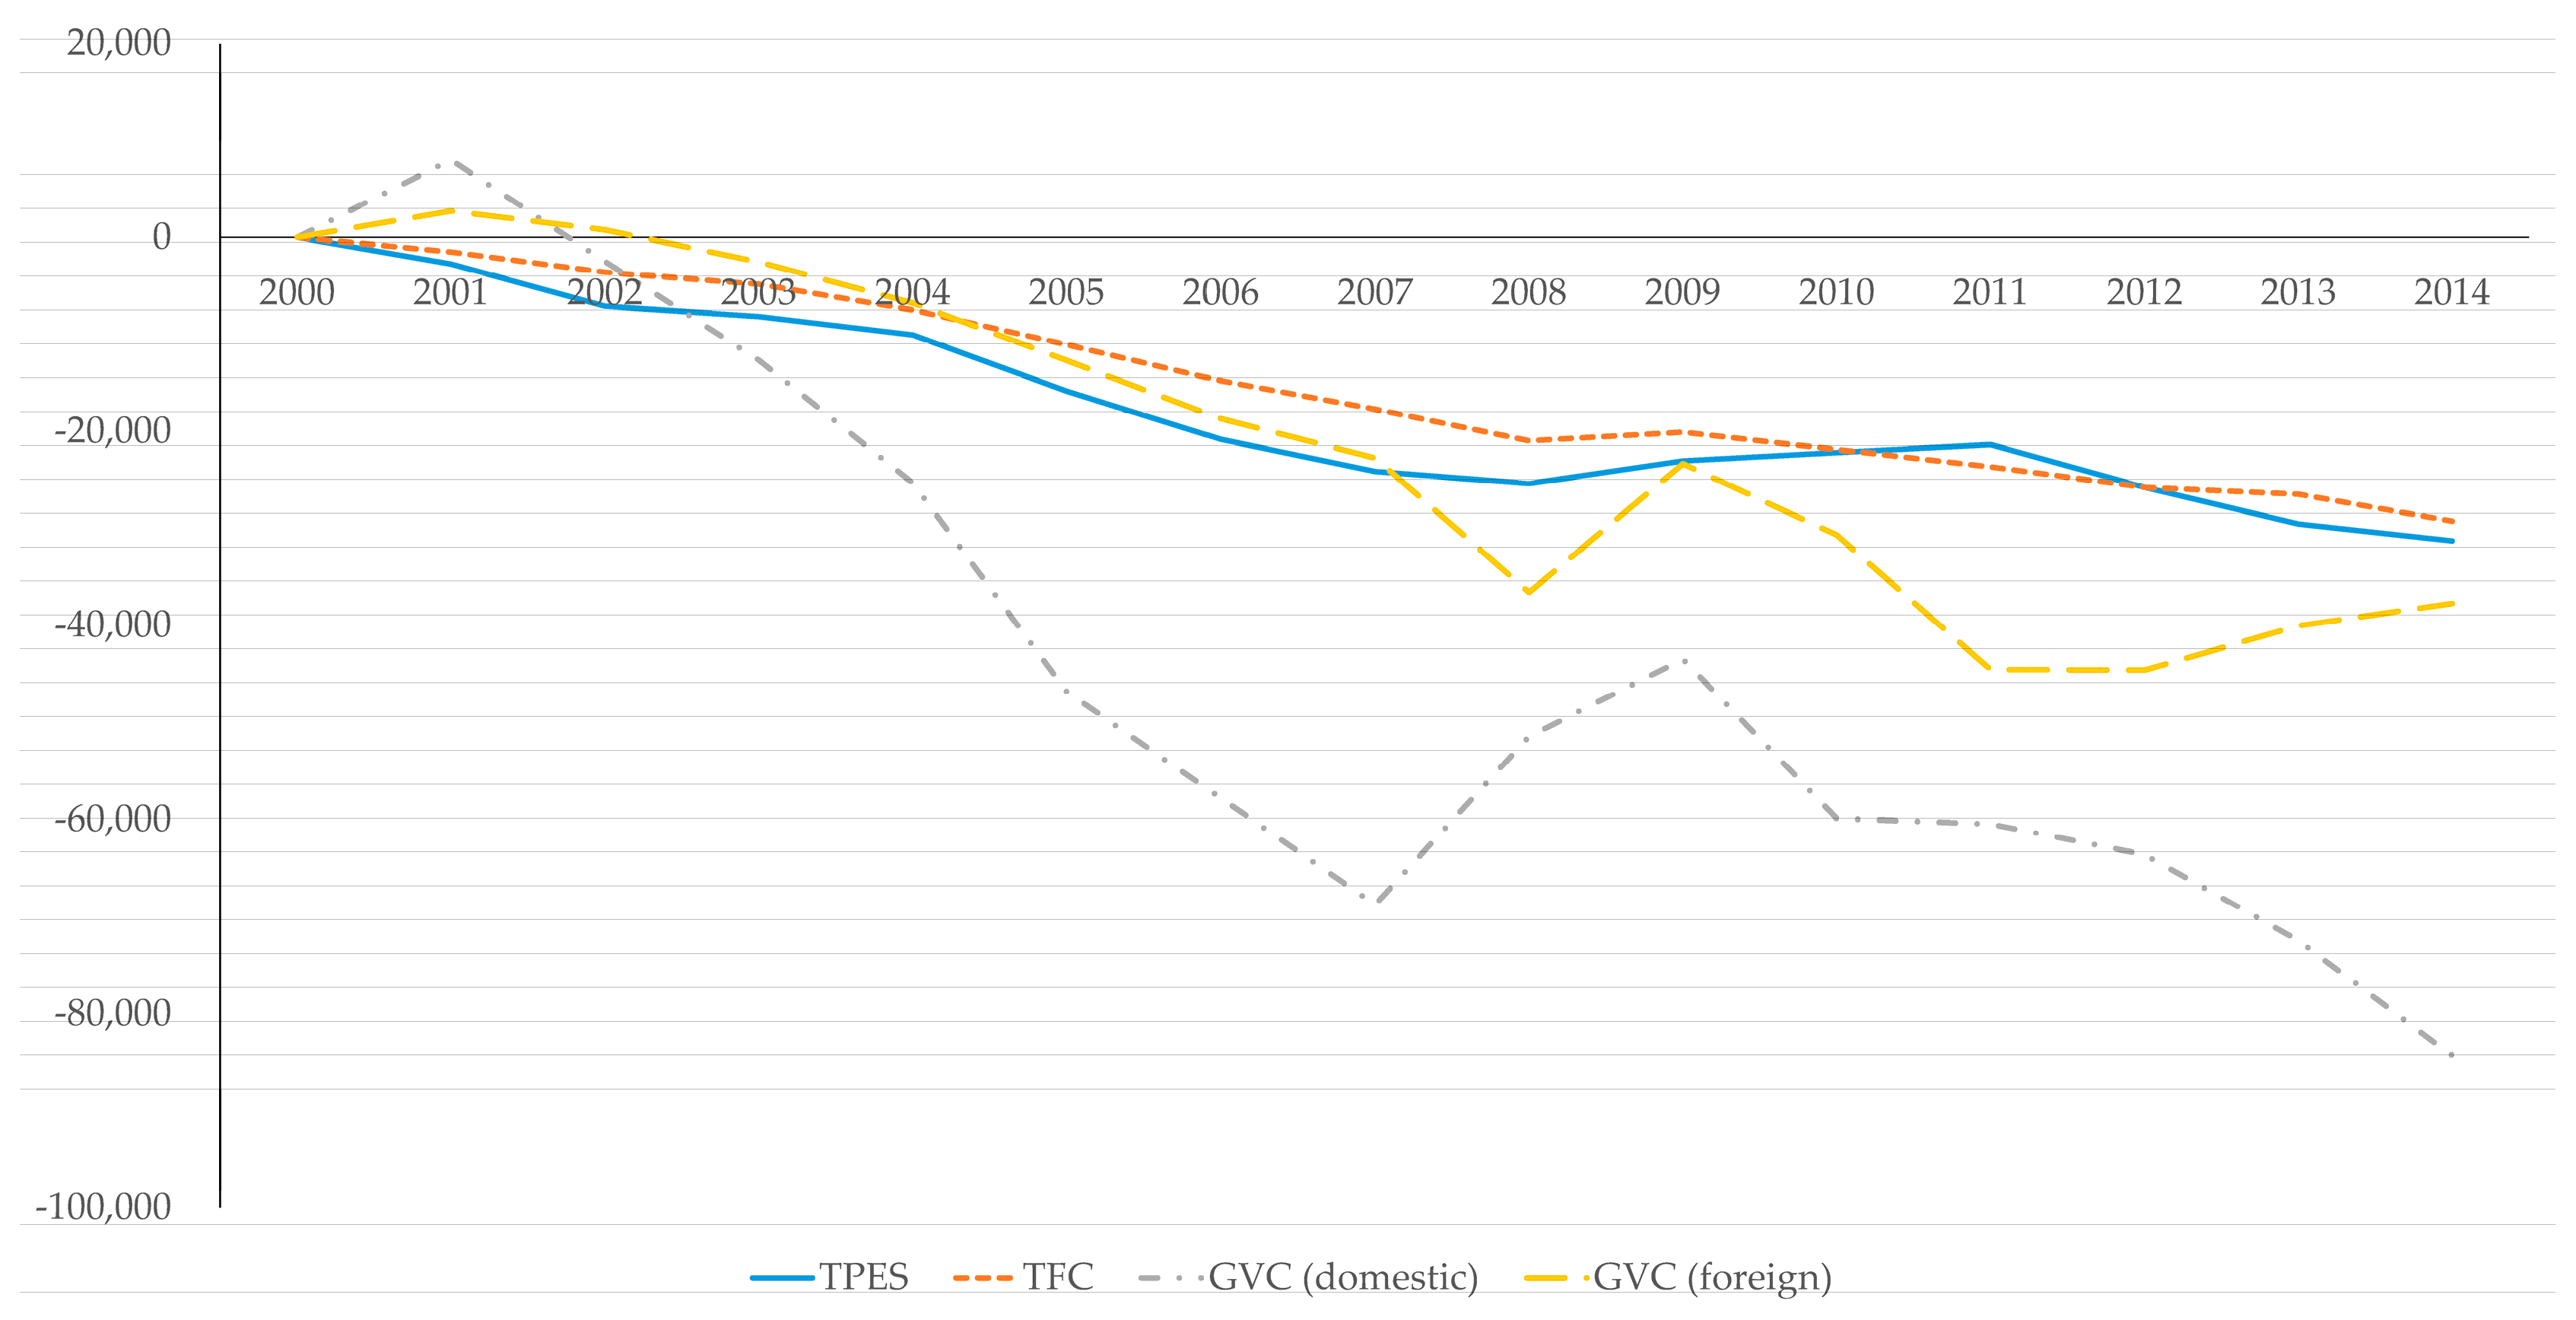
Figure 4 compares the two intensity effects. The ordinary LMDI intensity effects of TPES and TFC have constantly decreased. Intensity effects can be a proxy for an improvement in energy efficiency but they do not mean energy efficiency exactly. Overall, energy efficiency has been improved. Similar to the results of production and structural effects, intensity effects of the extended LMDI have been greater than the corresponding ordinary results. Both domestic- and foreign-intensity effects have decreased energy consumption. Because FVAS has steadily decreased since 2000, foreign-intensity effects in energy consumption have not fallen as much as domestic-intensity effects. Overall, energy inputs have been consumed efficiently to produce final output using both domestic and foreign intermediate goods.

4.2. Decomposition Results of Energy-Intensive and Other Industries

This study compares decomposition results of energy in energy-intensive and other industries. We define “iron and steel/non-ferrous metals”, “chemical and petrochemical”, and “non-metallic minerals” as energy-intensive industries. Notably, these industries comprise a large proportion of gross exports, which are critical for Korean industrial competitiveness. The comparison allows for policy insights because most of Korea’s leading industries within the manufacturing sector are energy intensive.
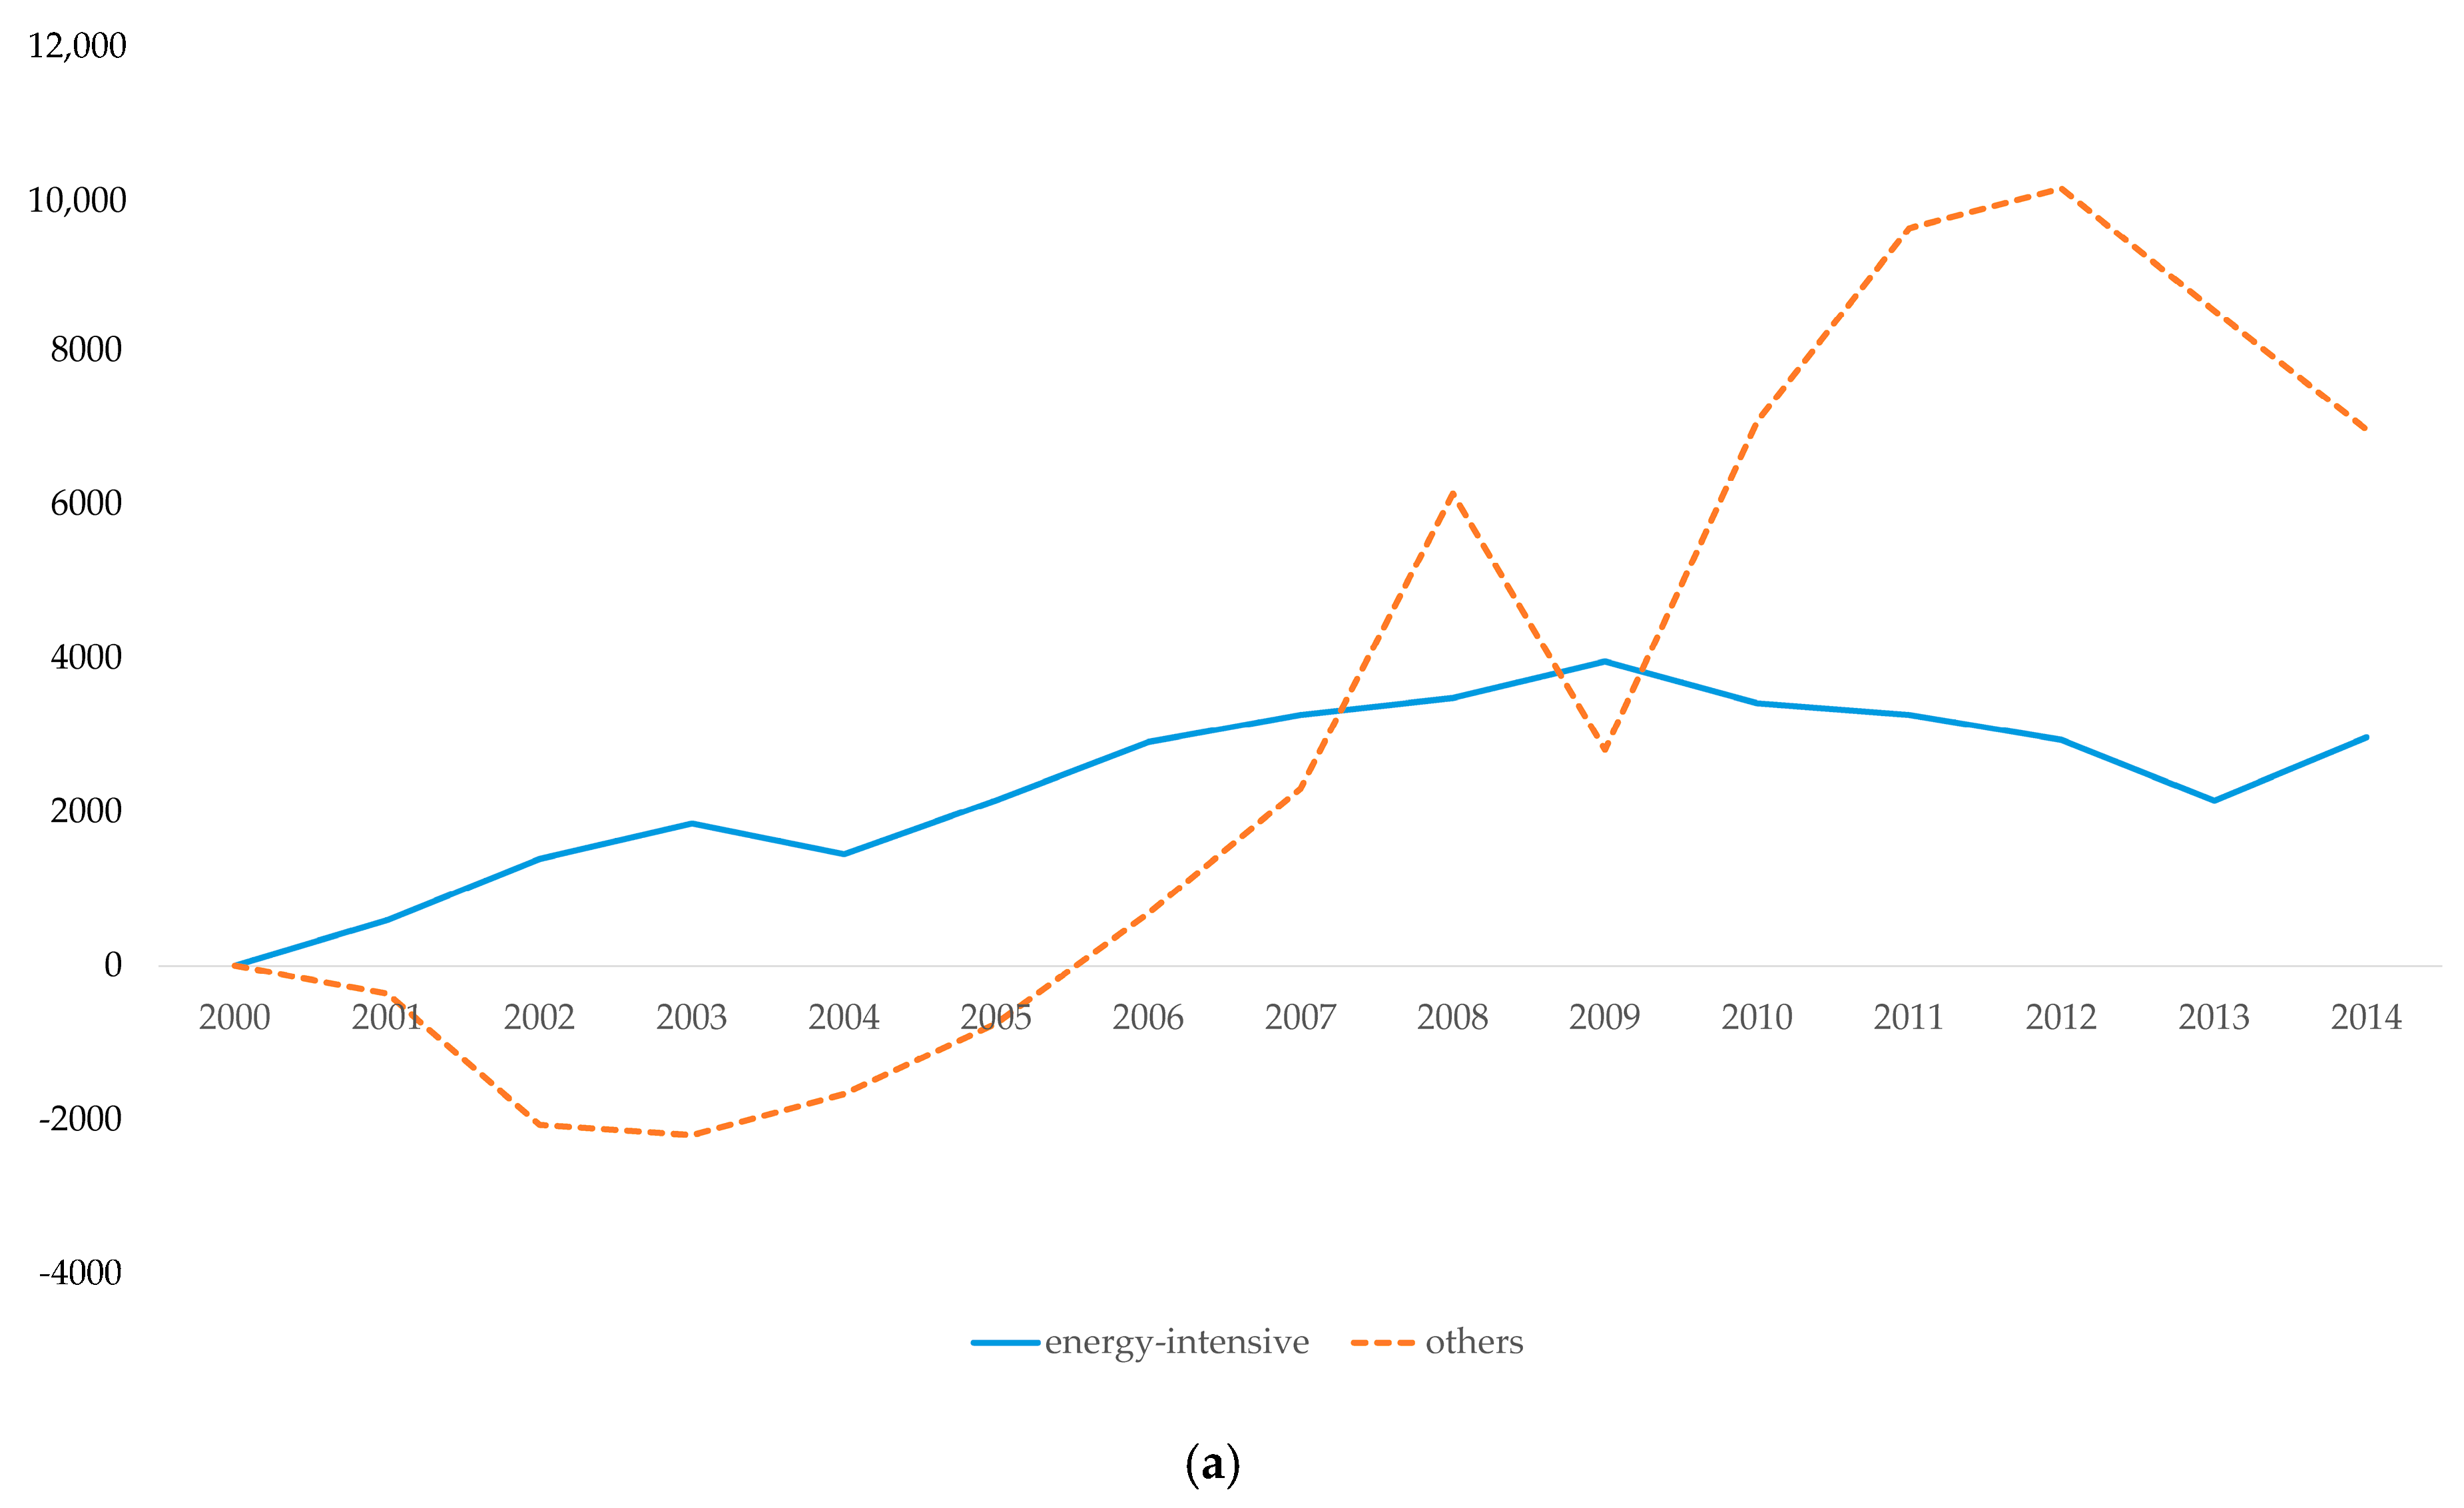
Figure 5 presents production effects. Indeed, energy-intensive industries have consumed more than other industries because they have attained higher growth, which means that Korean economic growth has been mainly led by these industries. Accordingly, productivity in energy-intensive industries was affected more by the economic recession than other manufacturing industries.
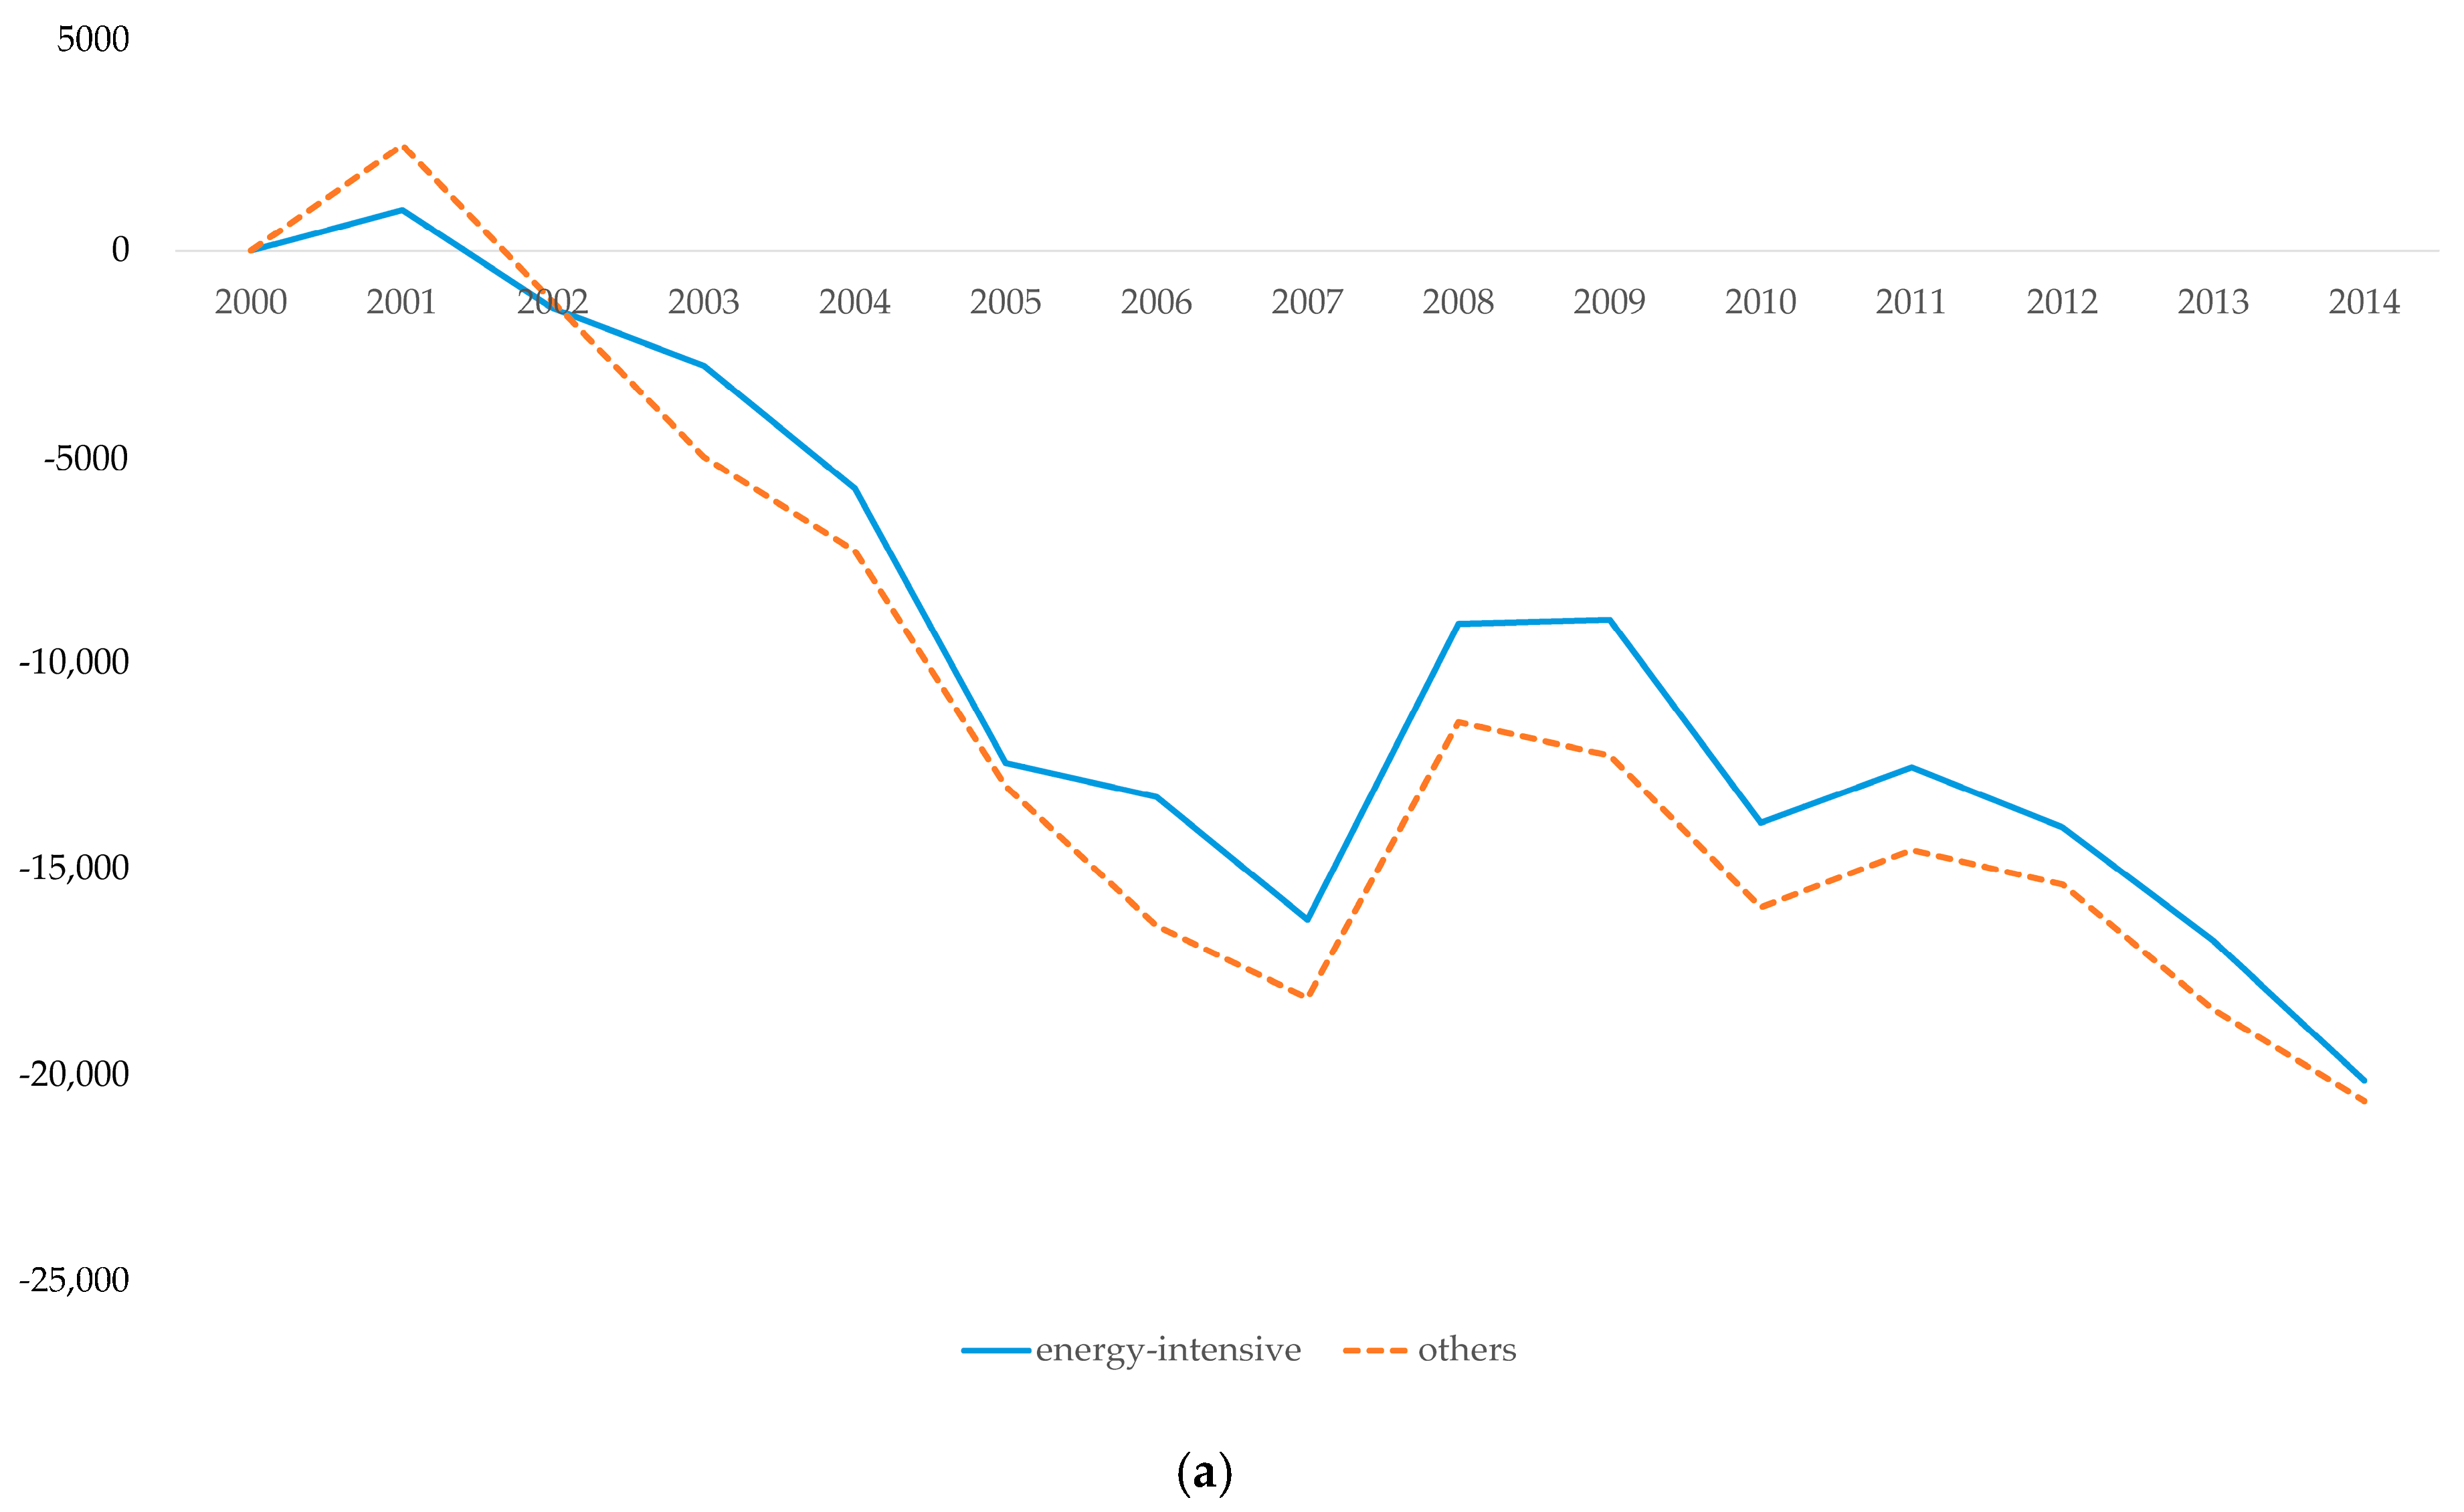
Figure 6a,b presents domestic- and foreign-structure effects, respectively. Figure 6a demonstrates that in a recession, in contrast to production effects, other industries tend to get hit harder than energy-intensive industries. Energy consumption shares have increased less in energy-intensive industries than in others. In detail, energy consumption in paper and wood product industries peaked in 2008, in a group of other industries. The paper and wood product industry had the highest energy consumption share in the total of other manufacturing industries. It indicates that industries that do not naturally depend on energy tend to consume more energy. Because such trends continued even after the financial crisis, the industry structure in other industries has become more energy intensive. This might be driven by market failures led by the Korean government’s price intervention.
Figure 6b displays opposite patterns in terms of foreign-structure effects. The import-oriented industry groups tended to become less energy intensive because they are exposed to global economic shocks but are naturally less dependent on energy factors. Indeed, the change in industry structure occurred due to less technological (natural) dependence on energy.
Figure 7a,b presents domestic- and foreign-intensity effects, respectively. In Figure 7a, domestic-intensity effects on efficient uses of energy for other industries were slightly higher than for energy-intensive industries. The foreign-intensity effects on efficient uses of energy showed opposite patterns. In Figure 7b, the more an energy-intensive industry imported, the more efficiently it utilized energy. This is because these industries have more incentive to save energy costs, which constitute a large proportion of total import costs. In other words, they import energy inputs from abroad. Indeed, efficient energy use peaked during the global financial crisis. In 2008, the foreign-intensity effect for energy-intensive industries led to a steep decrease in energy consumption.
In summary, extending the LMDI through the GVC networks provides new insights about the driving forces of energy consumption. This provides evidence that efficient allocation of energy inputs on GVC dimensions is important for economic growth, especially for countries that import most of their energy inputs from abroad.

5. Conclusions

This paper analyzed the annual trends in energy consumption for 14 Korean industries from 2000 to 2014 using the LMDI factor decomposition. Departing from the previous literature, we extended the LMDI decomposition through the GVC dimensions constructed by Timmer et al. [1] and Los et al. [2]. In doing so, we measured the energy consumption impact of Korean participation in GVC networks. Using the WIOT released in 2016, we calculated FVAS in the GVC activities for each industry. Based on a Cobb–Douglas production function, we embedded GVC divisions in the ordinary LMDI factor decomposition.
Our findings show that the production effect is the main driving force increasing energy consumption. Energy consumption has decreased by both foreign-structure and foreign-intensity effects. This indicates that industries that depend on more imports are likely to utilize energy resources efficiently. Together with a decline in domestic-intensity effects, both GVC effects have improved their energy efficiency. Energy-intensive industries have consumed more than other industries because they have attained higher growth. This means that economic growth has been led mainly by energy-intensive industries in Korea. These industries have more incentive to reduce energy costs because those costs represent a large proportion of their total import costs. The opposite pattern occurred in other industry groups. Industries that do not naturally depend on energy tend to consume more energy and became more energy-intensive. Our results indicate that efficiently allocated energy inputs from GVCs are important for economic growth, particularly for countries that import most of their energy inputs from abroad.
Our paper has limitations. We extended the ordinary LMDI factor decomposition to a particular country’s energy consumption, although the WIOD provides information on GVC activities across multiple countries and multiple industries. The WIOD also contains information on the type of production factors involved: capital and labor of various skill categories. Together with other countries’ energy consumption, it can allow a sharper focus on the issue of complementarities of production factors in value chains, and deeper insight into the geographical nature of various spillovers across countries.

Author Contributions

Conceptualization, Methodology, Software, Formal Analysis, Writing, Review, and Editing, B.C. and T.J. All authors have read and agreed to the published version of the manuscript.

Funding

This research received no external funding.

Conflicts of Interest

The authors declare no conflict of interest.

Appendix A

Table A1. Production sectors.
IEA (2019)KOSIS 1 (2020)WIOT
Iron and steel/non-ferrous metalsBasic metalsBasic metals
Fabricated metal productsFabricated metal products, except machinery and equipment
Chemical and petrochemicalCoke, briquette, and refined petroleum productsRubber and plastic products
Coke and refined petroleum products
Chemicals and chemical productsChemicals and chemical products
Basic pharmaceutical products and pharmaceutical preparations
Non-metallic mineralsOther non-metallic mineral productsOther non-metallic mineral products
Transport equipmentTransport equipmentMotor vehicles, trailers, and semi-trailers
Other transport equipment
MachineryElectrical equipmentElectrical equipment
Computer, electronic, and optical instrumentComputer, electronic, and optical products
Other machinery and equipmentMachinery and equipment n.e.c.
Mining and quarryingMining and quarryingMining and quarrying
Food and tobaccoFood and tobacco productsFood products, beverages, and tobacco products
Paper, pulp, and printing/wood and wood productsWood, pulp, paper, and paper productsPaper and paper products
Wood and of products of wood and cork, except furniture; articles of straw and plaiting materials
Printing and reproduction of recorded media
ConstructionConstructionConstruction
Textile and leatherTextile and leatherTextiles, wearing apparel, and leather products
Non-specified (industry)Other manufacturingFurniture; other manufacturing
Repair and installation of machinery and equipment
TransportTransportLand transport and transport via pipelines
Water transport
Air transport
Warehousing and support activities for transportation
Commercial and public servicesWholesale and retail/accommodation and food servicesWholesale and retail trade and repair of motor vehicles and motorcycles
Wholesale trade, except of motor vehicles and motorcycles
Retail trade, except of motor vehicles and motorcycles
Postal and courier activities
Accommodation and food service activities
Human health and social workHuman health and social work activities
Electricity, gas, steam, and air conditioning supply
Water collection, treatment, and supply
Sewerage; waste collection, treatment, and disposal activities; materials recovery; remediation activities and other waste management services
Financial and insuranceFinancial service activities, except insurance and pension funding
Insurance, reinsurance, and pension funding, except compulsory social security
Activities auxiliary to financial services and insurance activities
Real estateReal estate activities
Business serviceTelecommunications
Computer programming, consultancy, and related activities; information service activities
Motion picture, video and television program production, sound recording, and music publishing activities; programming and broadcasting activities
Legal and accounting activities; activities of head offices; management consultancy activities
Architectural and engineering activities; technical testing and analysis
Scientific research and development
Advertising and market research
Other professional, scientific, and technical activities; veterinary activities
Administrative and support service activities
Public administration and defensePublic administration and defense; compulsory social security
EducationEducation
Culture and other servicesPublishing activities
Other service activities
Activities of households as employers; undifferentiated goods- and services-producing activities of households for own use
Activities of extraterritorial organizations and bodies
Agriculture/forestry/fishingAgriculture, forestry, and fishingCrop and animal production, hunting, and related service activities
Fishing and aquaculture
Forestry and logging
1 Korean Statistical Information Service, https://kosis.kr.

References

  1. Linden, G.; Kenneth, K.L.; Dedrick, J. Who captures value in a global innovation network? The case of Apple’s iPod. Commun. ACM. 2009, 52, 140–144. [Google Scholar] [CrossRef]
  2. Los, B.; Timmer, M.P.; de Vries, G.J. How global are global value chains? A new approach to measure international fragmentation. J. Reg. Sci. 2015, 55, 66–92. [Google Scholar] [CrossRef]
  3. UNFCC. The Paris Agreement. Available online: https://unfccc.int/process-and-meetings/the-paris-agreement/the-paris-agreement (accessed on 9 September 2020).
  4. Choi, B. Productivity and misallocation of energy resources: Evidence from Korea’s manufacturing Sector. Resour. Energy Econ. 2020, 61, 101184. [Google Scholar] [CrossRef]
  5. Timmer, M.P.; Azeez Erumban, A.; Los, B.; Stehrer, R.; de Vries, G.J. Slicing Up Global Value Chains. J. Econ. Perspect. 2014, 28, 99–118. [Google Scholar] [CrossRef] [Green Version]
  6. Sun, J.W. Changes in energy consumption and energy intensity: A complete decomposition model. Energy Econ. 1998, 20, 85–100. [Google Scholar] [CrossRef]
  7. Ang, B. Decomposition of industrial energy consumption. The energy intensity approach. Energy Econ. 1994, 16, 163–174. [Google Scholar] [CrossRef]
  8. Ang, B.W.; Choi, K.H. Decomposition of aggregate energy and gas emission intensities for industry: A refined divisia index method. Energy J. 1997, 18, 59–73. [Google Scholar] [CrossRef]
  9. Ang, B. The LMDI approach to decomposition analysis: A practical guide. Energy Policy 2005, 33, 867–871. [Google Scholar] [CrossRef]
  10. Kim, J. A Review on energy decomposition analysis in Korea. Korean Energy Econ. Rev. 2015, 14, 265–291. [Google Scholar] [CrossRef]
  11. British Petroleum (BP). BP Statistical Review-2019; British Petroleum (BP): London, UK, 2019. [Google Scholar]
  12. Xu, J.H.; Fleiter, T.; Eichhammer, W.; Fan, Y. Energy consumption and CO2 emissions in China’s cement industry: A perspective from LMDI decomposition analysis. Energy Policy 2012, 50, 821–832. [Google Scholar] [CrossRef]
  13. Wang, W.; Liu, X.; Zhang, M.; Song, X. Using a new generalized LMDI (logarithmic mean Divisia index) method to analyze China’s energy consumption. Energy 2014, 67, 617–622. [Google Scholar] [CrossRef]
  14. Wang, M.; Feng, C. Decomposing the change in energy consumption in China’s nonferrous metal industry: An empirical analysis based on the LMDI method. Renew. Sustain. Energy Rev. 2018, 82, 2652–2663. [Google Scholar] [CrossRef]
  15. Sun, X.; Liu, X. Decomposition analysis of debt’s impact on China’s energy consumption. Energy Policy 2020, 146, 111802. [Google Scholar] [CrossRef]
  16. Achour, H.; Belloumi, M. Decomposing the influencing factors of energy consumption in Tunisian transportation sector using the LMDI method. Transp. Policy 2016, 52, 64–71. [Google Scholar] [CrossRef]
  17. Akyürek, Z. LMDI decomposition analysis of energy consumption of Turkish manufacturing industry: 2005–2014. Energy Effic. 2020, 13, 649–663. [Google Scholar] [CrossRef]
  18. Kim, S. LMDI Decomposition analysis of energy consumption in the Korean manufacturing sector. Sustainability 2017, 9, 202. [Google Scholar] [CrossRef] [Green Version]
  19. Bianco, V. Analysis of electricity consumption in the tourism sector. A decomposition approach. J. Clean. Prod. 2020, 248, 119286. [Google Scholar] [CrossRef]
  20. Fernández González, P.; Landajo, M.; Presno, M.J. Multilevel LMDI decomposition of changes in aggregate energy consumption. A cross country analysis in the EU-27. Energy Policy 2014, 68, 576–584. [Google Scholar] [CrossRef]
  21. Chen, X.; Shuai, C.; Zhang, Y.; Wu, Y. Decomposition of energy consumption and its decoupling with economic growth in the global agricultural industry. Environ. Impact Assess. Rev. 2020, 81, 106364. [Google Scholar] [CrossRef]
  22. Feenstra, R.C.; Hanson, G.H. The impact of outsourcing and high-technology capital on wages: estimates for the united states, 1979–1990. Q. J. Econ. 1999, 114, 907–940. [Google Scholar] [CrossRef] [Green Version]
  23. Hummels, D.; Ishii, J.; Yi, K.M. The nature and growth of vertical specialization in world trade. J. Int. Econ. 2001, 54, 75–96. [Google Scholar] [CrossRef]
  24. Johnson, R.C.; Noguera, G. Accounting for intermediates: Production sharing and trade in value added. J. Int. Econ. 2012, 86, 224–236. [Google Scholar] [CrossRef] [Green Version]
  25. Timmer, M.P.; Los, B.; Stehrer, R.; de Vries, G.J. Fragmentation, incomes and jobs: An analysis of European competitiveness. Econ. Policy 2013, 28, 613–661. [Google Scholar] [CrossRef]
  26. Koopman, R.; Wang, Z.; Wei, S.J. Tracing value-added and double counting in gross exports. Am. Econ. Rev. 2014, 104, 459–494. [Google Scholar] [CrossRef] [Green Version]
  27. IEA. World Energy Balances; IEA: Paris, France, 2019. [Google Scholar]
  28. Korean Statistical Information Service (KOSIS) GDP and GNI by Economic Activity. Available online: https://kosis.kr (accessed on 11 August 2020).
Publisher’s Note: MDPI stays neutral with regard to jurisdictional claims in published maps and institutional affiliations.
Figure 1. Log mean Divisia index (LMDI) decomposition results over the GVC networks (unit: thousand ton of oil equivalent (ktoe)).
Sustainability 12 08483 g001
Figure 2. Production effects (unit: ktoe).
Sustainability 12 08483 g002
Figure 3. Structure effect (unit: ktoe).
Sustainability 12 08483 g003
Figure 4. Intensity effect (unit: ktoe).
Sustainability 12 08483 g004
Figure 5. Production effect of energy-intensive industries and others (unit: ktoe).
Sustainability 12 08483 g005
Figure 6. (a) Domestic-structure effect of energy-intensive industries and others (unit: ktoe). (b) Foreign-structure effect of energy-intensive industries and others (unit: ktoe).
Sustainability 12 08483 g006aSustainability 12 08483 g006b
Figure 7. (a) Domestic-intensity effects of energy-intensive industries and others (unit: ktoe). (b) Foreign-intensity effects of energy-intensive industries and others (unit: ktoe).
Sustainability 12 08483 g007aSustainability 12 08483 g007b
Table 1. The structure of world input–output tables (WIOTs).
Intermediate Use
(S Columns per Country)
Final Use
(C Columns per Country)
Total
1N1N
S industries, country 1
S industries, country 43
Value added
Output
Table 2. Descriptive statistics for data used.
VariablesMeanSt.devMaxMinUnits
TPES11,412.6811,743.9349,077.49336.60ktoe
TFC6691.337889.6031,867.00134.00ktoe
Value-added (GVC)52,788.6371,675.87398,065.05488.31Millions USD
Real GDP86,479.84168,579.72846,274.802260.40Billions KRW
Table 3. The change in energy consumption, value-added, and energy intensity.
SectorTPES (%)TFC (%)GVC (%)Real GDP (%)Energy Intensity
Iron and steel/non-ferrous metals63.3467.04291.1452.630.03
Chemical and petrochemical36.5845.74261.3074.63−0.07
Non-metallic minerals6.502.66158.6545.91−0.25
Transport equipment75.0628.62283.6694.84−0.02
Machinery160.60167.88178.18155.010.00
Mining and quarrying46.7253.73106.35−29.880.11
Food and tobacco32.3013.34102.9721.430.02
Paper, pulp and printing/wood and wood products4.792.9496.7123.12−0.07
Construction67.9267.92131.0917.700.00
Textile and leather−45.09−52.5196.9918.78−0.32
Non-specified (industry)−39.72−46.57391.6051.24−0.55
Transport20.8321.32177.1569.10−0.23
Commercial and public services54.0216.90195.2277.87−0.01
Agriculture/forestry/fishing9.83−26.5284.6523.04−0.02
Total36.6619.92192.4075.63−0.03
Data sources: IEA energy balances, WIOT’s 2016 releases, and the Korean Statistical Information Service.