Gender Differences in Wage, Social Support, and Job Satisfaction of Public Sector Employees


Department of Industrial & Management Engineering, Hansung University, Seoul 02876, Korea
*
Author to whom correspondence should be addressed.
Sustainability 2020, 12(20), 8514; https://doi.org/10.3390/su12208514
Submission received: 9 September 2020
/
Revised: 12 October 2020
/
Accepted: 12 October 2020
/
Published: 15 October 2020
(This article belongs to the Section Economic and Business Aspects of Sustainability)
Abstract
:This study aims to analyze gender differences in wages, social support, and job satisfaction in the public sector. From the 5th Korean Working Conditions Survey data, 2046 subjects were selected as public sector workers. This study analyzed gender differences in the relationships by stepwise regression analysis and mediation model. The results showed that wages were directly affected by education level, followed by work experience and working hours. Also, there were significant gender difference relationships, and males’ wages increased faster than females as education level increased. The social support of females is higher than that of males regardless of wages or educational level, and it is more influenced by the level of education than that of wages. However, there was no gender difference in the regression equation of social support and wage on job satisfaction. Bridging gender gaps in the workplace is a crucial component of inclusive and sustainable growth. This study substantially contributes to the existing knowledge of gender differences, such as regression analysis and new findings.
1. Introduction
A sustainable society means a society that can ensure gender-equal opportunities for employment, leadership, and decision-making as well as gender-equal access to economic resources and quality education [1]. Gender equality at work is a crucial dimension of inclusive and sustainable growth or social justice [2,3]. Furthermore, eliminating discrimination at work became a significant challenge of the 2030 Agenda for Sustainable Development, launched by the United Nations (UN) [4]. Therefore, the study of factors affecting gender equality in the workplace is considered an important area of sustainability.
The public sector is a good research target for studying gender differences in the workplace. In South Korea, public sector workers work in the government, local government, or public institutions [5]. In 2018, the number of Korean public sector workers was 2,451,000, accounting for 9.1% of the total employed workforce. Men accounted for 55.0%, and women accounted for 45.0% [6]. Workers in the public sector are hired through open competition that does not discriminate against gender or education. Job security is also high due to guaranteeing retirement age. It is also recognized as a sector with a relatively good working environment compared to the private sector, as it has regulations and systems for work–family balance [7]. Thus, the public sector has good working conditions and no gender discrimination policies [7,8].
A higher quality of employment is based on employment’s critical dimensions, such as gender equality, safety, inclusion, and diversity [9]. Wages, social support, and job satisfaction are used as the comparison factors for testing gender differences [3,4,7,8]. Workers’ education level, work experience, and working hours are also used as independent variables to assess gender differences [4,7,8,10,11,12]. However, few studies have systematically analyzed gender differences in wages, social support, and job satisfaction among public sector workers [10,11,12]. There is a lack of study to systematically analyze gender differences in the relationship between factors through quantitative analysis.
This study analyzes gender differences in the relationship between education level, work experience, and working hours on wages in the public sector. The purpose of this study also examines gender differences in the relationship of education level, work experience, working hours, and wages on social support. Finally, this study investigates whether gender difference exists in the relationship of social support and wages on job satisfaction.
1.1. Literature Review
1.1.1. Gender Wage Gap
The gender wage gap is an essential indicator of gender equality in the labor market [9]. Previous studies have analyzed the factors that contribute to gender wage differences, and factors influencing the gender wage gap are education level, gender, occupation, work experience, and working hours [13,14]. Wage differences between men and women can persist even when controlling for education, work history, occupation, and industry [1]. Pay gaps may vary depending on organizational contexts, such as supervisory discretion and job type [15]. The gender wage gap was smaller in the non-profit sector, primarily due to lower occupational segregation levels of the non-profits [4]. However, there is no study investigating gender wage differences in the relationship between education, work experience, and working hours.
1.1.2. Social Support
Social support is information that leads people to believe that they are cared for, loved, esteemed, and members of a mutual obligation network [16]. Factors influencing social support are known as wage, education level, gender, and work experience [17,18]. Some studies have analyzed gender differences in terms of organizational and social support [18]. Social support plays an essential role in enhancing job satisfaction [10]. There is no study to analyze gender differences in the relationship between work experience, education, and wage level on social support.
1.1.3. Job Satisfaction
Job satisfaction is a positive or pleasant emotional state resulting from a subjective perception of an individual’s work experience [19]. Public sector workers’ job satisfaction is essential because it affects public services [20]. It can lead to a positive and desirable organizational behavior and outcomes [21]. Previous studies suggest that job satisfaction is related to gender, education level, work experience, wage, leadership style, organizational climate, social support, working conditions, and other individual and organizational factors [8,10,12,17,20,21,22,23]. Some studies confirmed gender differences in job satisfaction [10,23]. There is no study examining gender differences in the relationship between wage level and social support on job satisfaction in the public sector.
2. Materials and Methods
2.1. Data Collection
This study used raw data from the 5th Working Environment Survey conducted by the Korea Occupational Safety and Health Agency in 2017. The Korean Working Conditions Survey (KWCS) [24] benchmarked the European Working Conditions Survey (EWCS) [25]. KWCS is a survey to investigate the overall work environment, such as employment type, occupation, type of business, and exposure to risk factors, targeting employees aged 15 years or older [24]. Professional interviewers conducted the KWCS for households selected nationwide, and 50,205 workers participated. Participants were paid a fee, and the response rate was 0.449. We received the KWCS data for secondary analysis from the Institute for Occupational Safety and Health [24].
Among 50,205 respondents, 2046 subjects were selected as public sector workers, according to the Korean Standard Industrial Classification [26]. They consisted of public administration, national defense, and social security administration (42.5%), followed by educational service industry (27.6%) and health and social welfare (8.9%).
2.2. Research Variable
Table 1 shows the research variables used in this study. Research variables consisted of general characteristics of workers and subjective questionnaires.
The general characteristics of workers consisted of gender, work experience, working hours per week, wage level, and education level. Work experience is on a yearly basis, and working hours per week are shown in 1-h increments.
The social support variable was composed of 8 items on a 5-point scale, and the mean score of 8 items was defined as a social support variable. The job satisfaction variable was composed of 6 items on a 5-point scale, and the mean score of the 6 items was defined as a social support variable.
2.3. Reliability Analysis
Table 2 displays the final results of reliability analysis to ensure the subjective questionnaire variables’ internal consistency. As shown in Table 2, S1 and S2 question items in the social support and J5 and J6 question items in the job dissatisfaction were removed by Cronbach’s alpha. The final result of reliability analysis yields a Cronbach’s alpha value of 0.784 to 0.821, and it is very satisfactory. The social support and job satisfaction variables were recalculated for average values, excluding the removed question items.
2.4. Models and Regression Analysis for Testing Gender Differences
A correlation analysis was carried out to investigate the relationship between education level, work experience, working hours, wage, social support, and job satisfaction.
In this study, the Edwards and Lambert’s mediation model [27] was used to investigate the relationship between independent and dependent variables.
Table 3 shows examples of regression analysis to test gender differences. This study analyzes the three types of relationships for exploring gender differences: (1) effect of education level, work experience, and working hours on wage; (2) effect of education level, work experience, and wage on social support; and (3) effect of social support and wage on job satisfaction.
A regression analysis was used to test gender differences in the relationships shown in Table 3 [28]. Among the regression coefficients, Z’s coefficient indicates how much higher the y-intercept for males (coded Z = 1) is than for females (coded Z = 0), and the coefficient of B*Z indicates the slope in the regression equation.
The regression equation of each model was estimated by the stepwise method, and insignificant variables were removed from the regression equation. Statistical analyses were performed using SPSS 18.0, and a significance level of 0.05 was applied.
3. Results
3.1. Correlation Coefficients between Worker’s General Characteristics and Subjective Scores
Table 4 shows the correlation coefficients between workers’ work experience, working hours, education level, wages, social support, and job satisfaction.
In Table 4, wages showed the highest correlation coefficient with education level (0.660), followed by work experience (0.630) and working hours (0.600). In other words, wage tends to increase with education, work experience, and working hours.
On the other hand, the social support score showed a relatively low linear relationship with personal factors such as wage (0.159), an education level (0.160), and work experience (0.113). The job satisfaction score showed a high correlation with social support (0.459), followed by education level (0.202), and wage level (0.184).
3.2. Gender Effect on Wage
Table 5 shows the regression equations obtained by the model considering gender differences. The regression equations were estimated by the stepwise regression method.
3.2.1. Effect of Education Level on Work Experience or Working Hours
In Table 5, the work experience was increased as the level of education increased and there was a gender difference. Also, the working hours were increased as the education level increased. There was a gender difference, and females tend to have longer working hours than males as education level increases.
3.2.2. Effect of Education Level on Wage Level
The wage level was also increased as the education level increased. There was a gender difference, and males tend to have a higher wage level than females as their education level increased.
3.2.3. Effect of Education Level and Work Experience on Wage Level
The effect of education level and work experience on wages differs according to gender. The wages were increased with the level of education and the work experience. The wages were more affected by the level of education than work experience. Also, men’s wages were increased faster than that of women as the education level increased, whereas women’s wages were increased faster than men’s as the work experience increased.
3.2.4. Effect of Education Level and Working Hours on Wage Level
The effect of education level and working hours on wages differs according to gender. Wages increase with education level and working hours and were more affected by education level. Also, gender differences showed that men’s wages increased faster than women’s as the education level increased. In contrast, wages had no gender difference with working hours per week.
3.2.5. Effect of Education Level, Work Experience, and Working Hours on Wage Level
Gender differences exist in the effects of education level, work experience, and working hours on wages. Wages increase with education level, work experience, and working hours. Also, gender differences showed that men’s wages increased faster than women’s as the education level increased. In comparison, wages had no gender difference with the work experience and working hours. Figure 1 shows a regression model to analyze the effect of education level, work experience, and working hours per week on wages. In Figure 1, the dependent variable was wage (y), the mediation variables were work experience (X) and working hours (H), and the independent variable was education level (E).
The coefficients shown in Figure 1 represent the regression equation’s coefficients with the highest R2 among the regression equations in Table 5. Based on Table 5 and Figure 1, wages are directly affected by the level of education and indirectly affected by work experience and working hours. Also, there was a significant gender difference, and men’s wages increased faster than women’s as the education level increased.
3.3. Gender Effect on Social Support
3.3.1. Effect of Education Level and Work Experience on Social Support
In Table 6, the social support increased with the education level and work experience. There was no gender difference in the relationship of education level and work experience on social support. The social support was more affected by the level of education than work experience.
3.3.2. Effect of Education Level and Wage Level on Social Support
Social support increased with the education level and wage level. Also, it was slightly more affected by the level of education than the wage level. There was a gender difference in the y-intercept of the relationship. The y-intercept for females was higher than that of males.
3.3.3. Effect of Education Level, Work Experience, and Wage Level on Social Support
The regression equation of education level, work experience, and wage level on social support was the same as the regression equation by education level and wage level. Social support can be predicted only by education level and wage, among the variables of education level, work experience, and wage. However, the explanatory power is low.
3.4. Gender Effect on Job Satisfaction
3.4.1. Effect of Social Support on Wage Level
In Table 7, the wage increased with social support. There was a gender difference in the regression equation, and the y-intercept of males was higher than that of females in the regression equation.
3.4.2. Effect of Social Support on Job Satisfaction
In the regression equations of social support on job satisfaction, job satisfaction increased with social support. There was a gender difference in the regression equation, and the y-intercept of males was higher than that of females in the regression equation.
3.4.3. Effect of Social Support and Wage Level on Job Satisfaction
In the regression equations of social support and wage level on job satisfaction, job satisfaction increased with social support or wage level. Job satisfaction was more affected by social support than wages. There was no gender difference in the regression equation.
4. Discussion
The public sector is perceived as having a relatively good working environment and policies for no gender discrimination [8,10]. We investigate the gender differences in the relationships between education level, work experience, working experience, wage level, social support, and job satisfaction. The regression equation analysis and mediation model were used to analyze gender differences and relationships between factors.
Job satisfaction of public sector employees is essential because it affects public service [29]. Social support and wage also play an important role in enhancing job satisfaction [10].
The wages increased with education, work experience, and working hours. The wages were most significantly affected by education level, followed by work experience and working hours. Public sectors play an essential role in addressing gender equality, including the wage gap [13,14]. However, there was a gender difference and men were more affected by their educational level than women in the relationship of education level on wages. That is, women at the same level of education earn lower wages than men. This result is the same as the result of Jang’s [30] study, and there is a substantial gender difference. Although female’s shares are increasing in the public sector, females are still more likely than men to be working in job roles below their qualification levels [31].
Previous studies have shown that women’s social support is lower than that of men [17,18]. However, females’ social support is higher than that of males regardless of wages or educational level. In the regression equation, social support is more influenced by education level than that of wages. In this study, males’ job satisfaction is higher than that of females in the regression equation of social support on job satisfaction. However, there were no gender difference in the relationship equation of social support and wage on job satisfaction.
Job satisfaction was greatly more influenced by social support than that of wages. This result is consistent with studies that job satisfaction increases with social support [10,32]. However, there was no gender difference in the relationship of social support and wages on job satisfaction. Organizational support relieves employee emotional pressure and improves service levels and job satisfaction [32]. Previous studies suggested that wages had a more significant effect on men’s job satisfaction [20,33]. It was interpreted as the result of a strong sense of duty that men are responsible for their families economically [33].
This study on social support and job satisfaction indicates that regulations and systems for no gender discrimination in the public sector are being established. This finding is linked to the gender role as a mother–wife career [1,30], and female employees could consider that family-friendly benefits are desirable [34]. Family-friendly policies may reduce the time employees devote to household activities and improve worker satisfaction [35,36]. The policies on no gender difference and welfare in the public sectors can make female workers feel relatively socially supported. However, this study is not enough to explain the reasons for the results. Therefore, further research is expected to reveal the factors affecting no gender differences in the public sectors.
5. Conclusion and Limitations of the Study
This study has a few limitations. In this study, there is a limitation of not considering various factors affecting wage, social support, or job satisfaction, such as well-being [37] and work–life balance [38]. Second, this study used public sector data composed of various occupations from KWCS data but it was not possible to explain differences by industry [39]. Thus, the study’s findings cannot be generalized across sectors and organizations and are not enough to explain the reasons for the results. Therefore, further research is expected that reflects the characteristics of each industry or various factors.
Despite these limitations, this study is meaningful because it confirmed that gender differences exist in wages and social support, but there is no gender difference in the relationship of social support and wage on job satisfaction in the public sector. The present research substantially contributes to the existing knowledge of gender differences, such as regression analysis and new findings. This study’s results are expected to be used as a basic guideline to improve the gender differences among public sector workers. The present study is also likely to guide the enhancement of job satisfaction of individuals. Bridging gender gaps in the workplace is a crucial component of inclusive and sustainable growth [3]. This study indicates that efforts to address discrimination in the public sector of South Korea are also necessary for sustainable development initiated by the UN [4].
Author Contributions
Conceptualization, S.H.Y. and B.Y.J.; methodology, S.H.Y. and B.Y.J.; data analysis, S.H.Y.; resources, S.H.Y. and B.Y.J.; data curation, S.H.Y. and B.Y.J.; writing—original draft preparation, S.H.Y. and B.Y.J.; writing—review and editing, S.H.Y. and B.Y.J.; supervision, B.Y.J.; funding acquisition, B.Y.J. All authors have read and agreed to the published version of the manuscript.
Funding
This research received no external funding.
Acknowledgments
This research was financially supported by Hansung University. The authors are grateful to the Occupational Safety and Health Research Institute (OSHRI) and the Korea Occupational Safety and Health Agency (KOSHA) for providing the raw data from the KWCS.
Conflicts of Interest
The authors declare no conflict of interest.
References
- Roig, R.; Aybar, C.; Pavía, J.M. Gender Inequalities and Social Sustainability. Can Modernization Diminish the Gender Gap in Political Knowledge? Sustainability 2020, 12, 3143. [Google Scholar] [CrossRef] [Green Version]
- Eizenberg, E.; Jabareen, Y. Social sustainability: A new conceptual framework. Sustainability 2017, 9, 68. [Google Scholar] [CrossRef] [Green Version]
- Bastida, M.; Pinto, L.H.; Blanco, O.A.; Márquez, C.M. Female Entrepreneurship: Can Cooperatives Contribute to Overcoming the Gender Gap? A Spanish First Step to Equality. Sustainability 2020, 12, 2478. [Google Scholar] [CrossRef] [Green Version]
- Núñez, R.B.C.; Bandeira, P.; Santero-Sánchez, R. Social Economy, Gender Equality at Work and the 2030 Agenda: Theory and Evidence from Spain. Sustainability 2020, 12, 5192. [Google Scholar] [CrossRef]
- Act on the Management of Public Institutions. Available online: https://elaw.klri.re.kr/kor_service/lawView.do?hseq=48581&lang=ENG (accessed on 9 September 2020).
- Gender Jobs by Public Sector by Job Type. Available online: http://kosis.kr/statHtml/statHtml.do?orgId=101&tblId=DT_1EP_7002&conn_path=I2 (accessed on 9 September 2020).
- Jang, I.S. The Problems and Improvement Plan of the Increase in Job Applicants. Labor Rev. 2019, 167, 7–19. [Google Scholar]
- Park, S.Y.; Park, S.Y. Influence of Job Stress Factors on Job Satisfaction among Local Officials: Mediating Effect of Depression. Korean Assoc. Local Govern. Stud. 2018, 21, 123–142. [Google Scholar] [CrossRef]
- Etienne, J.M.; Narcy, M. Gender Wage Differentials in the French Nonprofit and For-profit Sectors: Evidence from Quantile Regression. Ann. Econ. Stat. 2010, 99, 67–90. [Google Scholar] [CrossRef]
- Jonsdottir, I.J.; Rafnsdottir, G.L.; Ólafsdóttir, T. Job strain, gender and well-being at work: A case study of public sector line managers. Int. J. Workplace Health Manag. 2020. [Google Scholar] [CrossRef]
- Taylor, J.; Westover, J.H. Job Satisfaction in The Public Service. Pub. Manag. Rev. 2011, 13, 731–751. [Google Scholar] [CrossRef]
- Grissom, J.A.; Nicholson-Crotty, J.; Keiser, L. Does My Boss’s Gender Matter? Explaining Job Satisfaction and Employee Turnover in the Public Sector. J. Public Adm. Res. Theory 2012, 22, 649–673. [Google Scholar] [CrossRef]
- Pearlman, J. Gender differences in the impact of job mobility on earnings: The role of occupational segregation. Soc. Sci. Res. 2018, 74, 30–44. [Google Scholar] [CrossRef] [PubMed]
- Black, S.E.; Juhn, C. The Rise of Female Professionals: Are Women Responding to Skill Demand? Am. Econ. Rev. 2000, 90, 450–455. [Google Scholar] [CrossRef]
- Kronberg, A.K. Workplace Gender Pay Gaps: Does Gender Matter Less the Longer Employees Stay? Work Occup. 2020, 47, 3–43. [Google Scholar] [CrossRef]
- Sprigg, C.A.; Niven, K.; Dawson, J.; Farley, S.; Armitage, C.J. Witnessing Workplace Bullying and Employee Well-Being: A Two-Wave Field Study. J. Occup. Health Psychol. 2019, 24, 286–296. [Google Scholar] [CrossRef] [PubMed] [Green Version]
- Şahin, D.S.; Özer, Ö.; Yanardağ, M.Z. Perceived social support, quality of life and satisfaction with life in elderly people. Educ. Gerontol. 2019, 45, 69–77. [Google Scholar] [CrossRef]
- Hsieh, C.M.; Tsai, B.K. Effects of Social Support on the Stress-Health Relationship: Gender Comparison among Military Personnel. Int. J. Environ. Res. Public Health 2019, 16, 1317. [Google Scholar] [CrossRef] [Green Version]
- Locke, E.A. The Nature and Causes of Job Satisfaction. In Handbook of Industrial and Organizational Psychology; Dunnette, M.D., Ed.; Rand McNally: Chicago, IL, USA, 1976; pp. 1297–1349. [Google Scholar]
- Mundia, L. Satisfaction with work-related achievements in Brunei public and private sector employees. Cogent Bus. Manag. 2019, 6, 1664191. [Google Scholar] [CrossRef]
- Pecino, V.; Mañas, M.A.; Díaz-Fúnez, P.A.; Aguilar-Parra, J.M.; Padilla-Góngora, D.; López-Liria, R. Organisational Climate, Role Stress, and Public Employees’ Job Satisfaction. Int. J. Environ. Res. Public Health 2019, 16, 1792. [Google Scholar] [CrossRef] [Green Version]
- Merga, H.; Fufa, T. Impacts of working environment and benefits packages on the health professionals’ job satisfaction in selected public health facilities in eastern Ethiopia: Using principal component analysis. BMC Health Serv. Res. 2019, 19, 494. [Google Scholar] [CrossRef] [Green Version]
- Cantarelli, P.; Belardinelli, P.; Belle, N.A. Meta-Analysis of Job Satisfaction Correlates in the Public Administration Literature. Rev. Public Pers. Admin. 2016, 36, 115–144. [Google Scholar] [CrossRef]
- The 5th Work Condition Survey Data. Available online: http://oshri.kosha.or.kr/eoshri/resources/KWCSDownload.do (accessed on 9 September 2020).
- 6th European Working Conditions Survey (2015) Questionnaire. Available online: https://www.eurofound.europa.eu/sites/default/files/page/field_ef_documents/6th_ewcs_2015_final_source_master_questionnaire.pdf (accessed on 9 September 2020).
- Korean Standard Industrial Classification. Available online: http://kssc.kostat.go.kr/ksscNew_web/ekssc/main/main.do# (accessed on 9 September 2020).
- Edwards, J.R.; Lambert, L.S. Methods for integrating moderation and mediation: A general analytical framework using moderated path analysis. Psychol. Methods 2007, 12, 1–22. [Google Scholar] [CrossRef] [PubMed] [Green Version]
- Jeong, B.Y.; Park, K.S. Sex differences in anthropometry for school furniture design. Ergonomics 1990, 33, 1511–1521. [Google Scholar] [CrossRef] [PubMed]
- Oh, S.J.; Son, H.S. Job Stability and Job Satisfaction: Comparison between Workers in Private and Public Sector. Labor Rev. 2017, 153, 79–90. [Google Scholar]
- Jang, J.Y. Policy Tasks to Reduce the Gender Wage Gap. Labor Rev. 2017, 146, 16–24. [Google Scholar]
- Parken, A.; Ashworth, R. From evidence to action: Applying gender mainstreaming to pay gaps in the Welsh public sector. Gender Work Organ. 2019, 26, 599–618. [Google Scholar] [CrossRef] [Green Version]
- Wen, J.; Huang, S.; Ho, P. Emotional intelligence, emotional labor, perceived organizational support, and job satisfaction: A moderated mediation model. Int. J. Hosp. Manag. 2019, 81, 120–130. [Google Scholar] [CrossRef]
- Nam, A. Study on the Working Environment and Job Satisfaction of Male and Female Workers. J. Women Econ. 2019, 15, 51–72. [Google Scholar]
- Pailhé, A.; Solaz, A. Is there a wage cost for employees in family-friendly workplaces? The effect of different employer policies. Gender Work Organ. 2019, 26, 688–721. [Google Scholar] [CrossRef]
- Saltzstein, A.L.; Ting, Y.; Saltzstein, G.H. Work–family balance and job satisfaction: The impact of family-friendly policies on attitudes of federal government employees. Public Adm. Rev. 2001, 61, 452–467. [Google Scholar] [CrossRef]
- Bloom, N.; Kretschmer, T.; Van Reenen, J. Are Family-Friendly Workplace Practices a Valuable Firm Resource? Strateg. Manag. J. 2011, 32, 343–367. [Google Scholar] [CrossRef] [Green Version]
- Lee, S.Y.; Lee, H.J. Effects of the Personal and Job Characteristics, Professionalism, Organizational Commitment and Depression on the Job Satisfaction of Public Social Work Officials in Korea. Korean J. Stress Res. 2017, 25, 162–169. [Google Scholar] [CrossRef] [Green Version]
- Heo, C.U. Impact of work-life balance on job satisfaction and life satisfaction: Case of paid workers. Korea Tour. Res. Assoc. 2018, 32, 151–164. [Google Scholar]
- Shin, D.S.; Park, M.H.; Jeong, B.Y. Effects of female worker’s salary and health on safety education and compliance in three sectors of the service industry. Work 2020, 65, 63–70. [Google Scholar] [CrossRef] [PubMed]
Figure 1.
Regression model of education level, work experience, and working hours on wage level (* Significant at 0.05 level for regression coefficient).
Figure 1.
Regression model of education level, work experience, and working hours on wage level (* Significant at 0.05 level for regression coefficient).
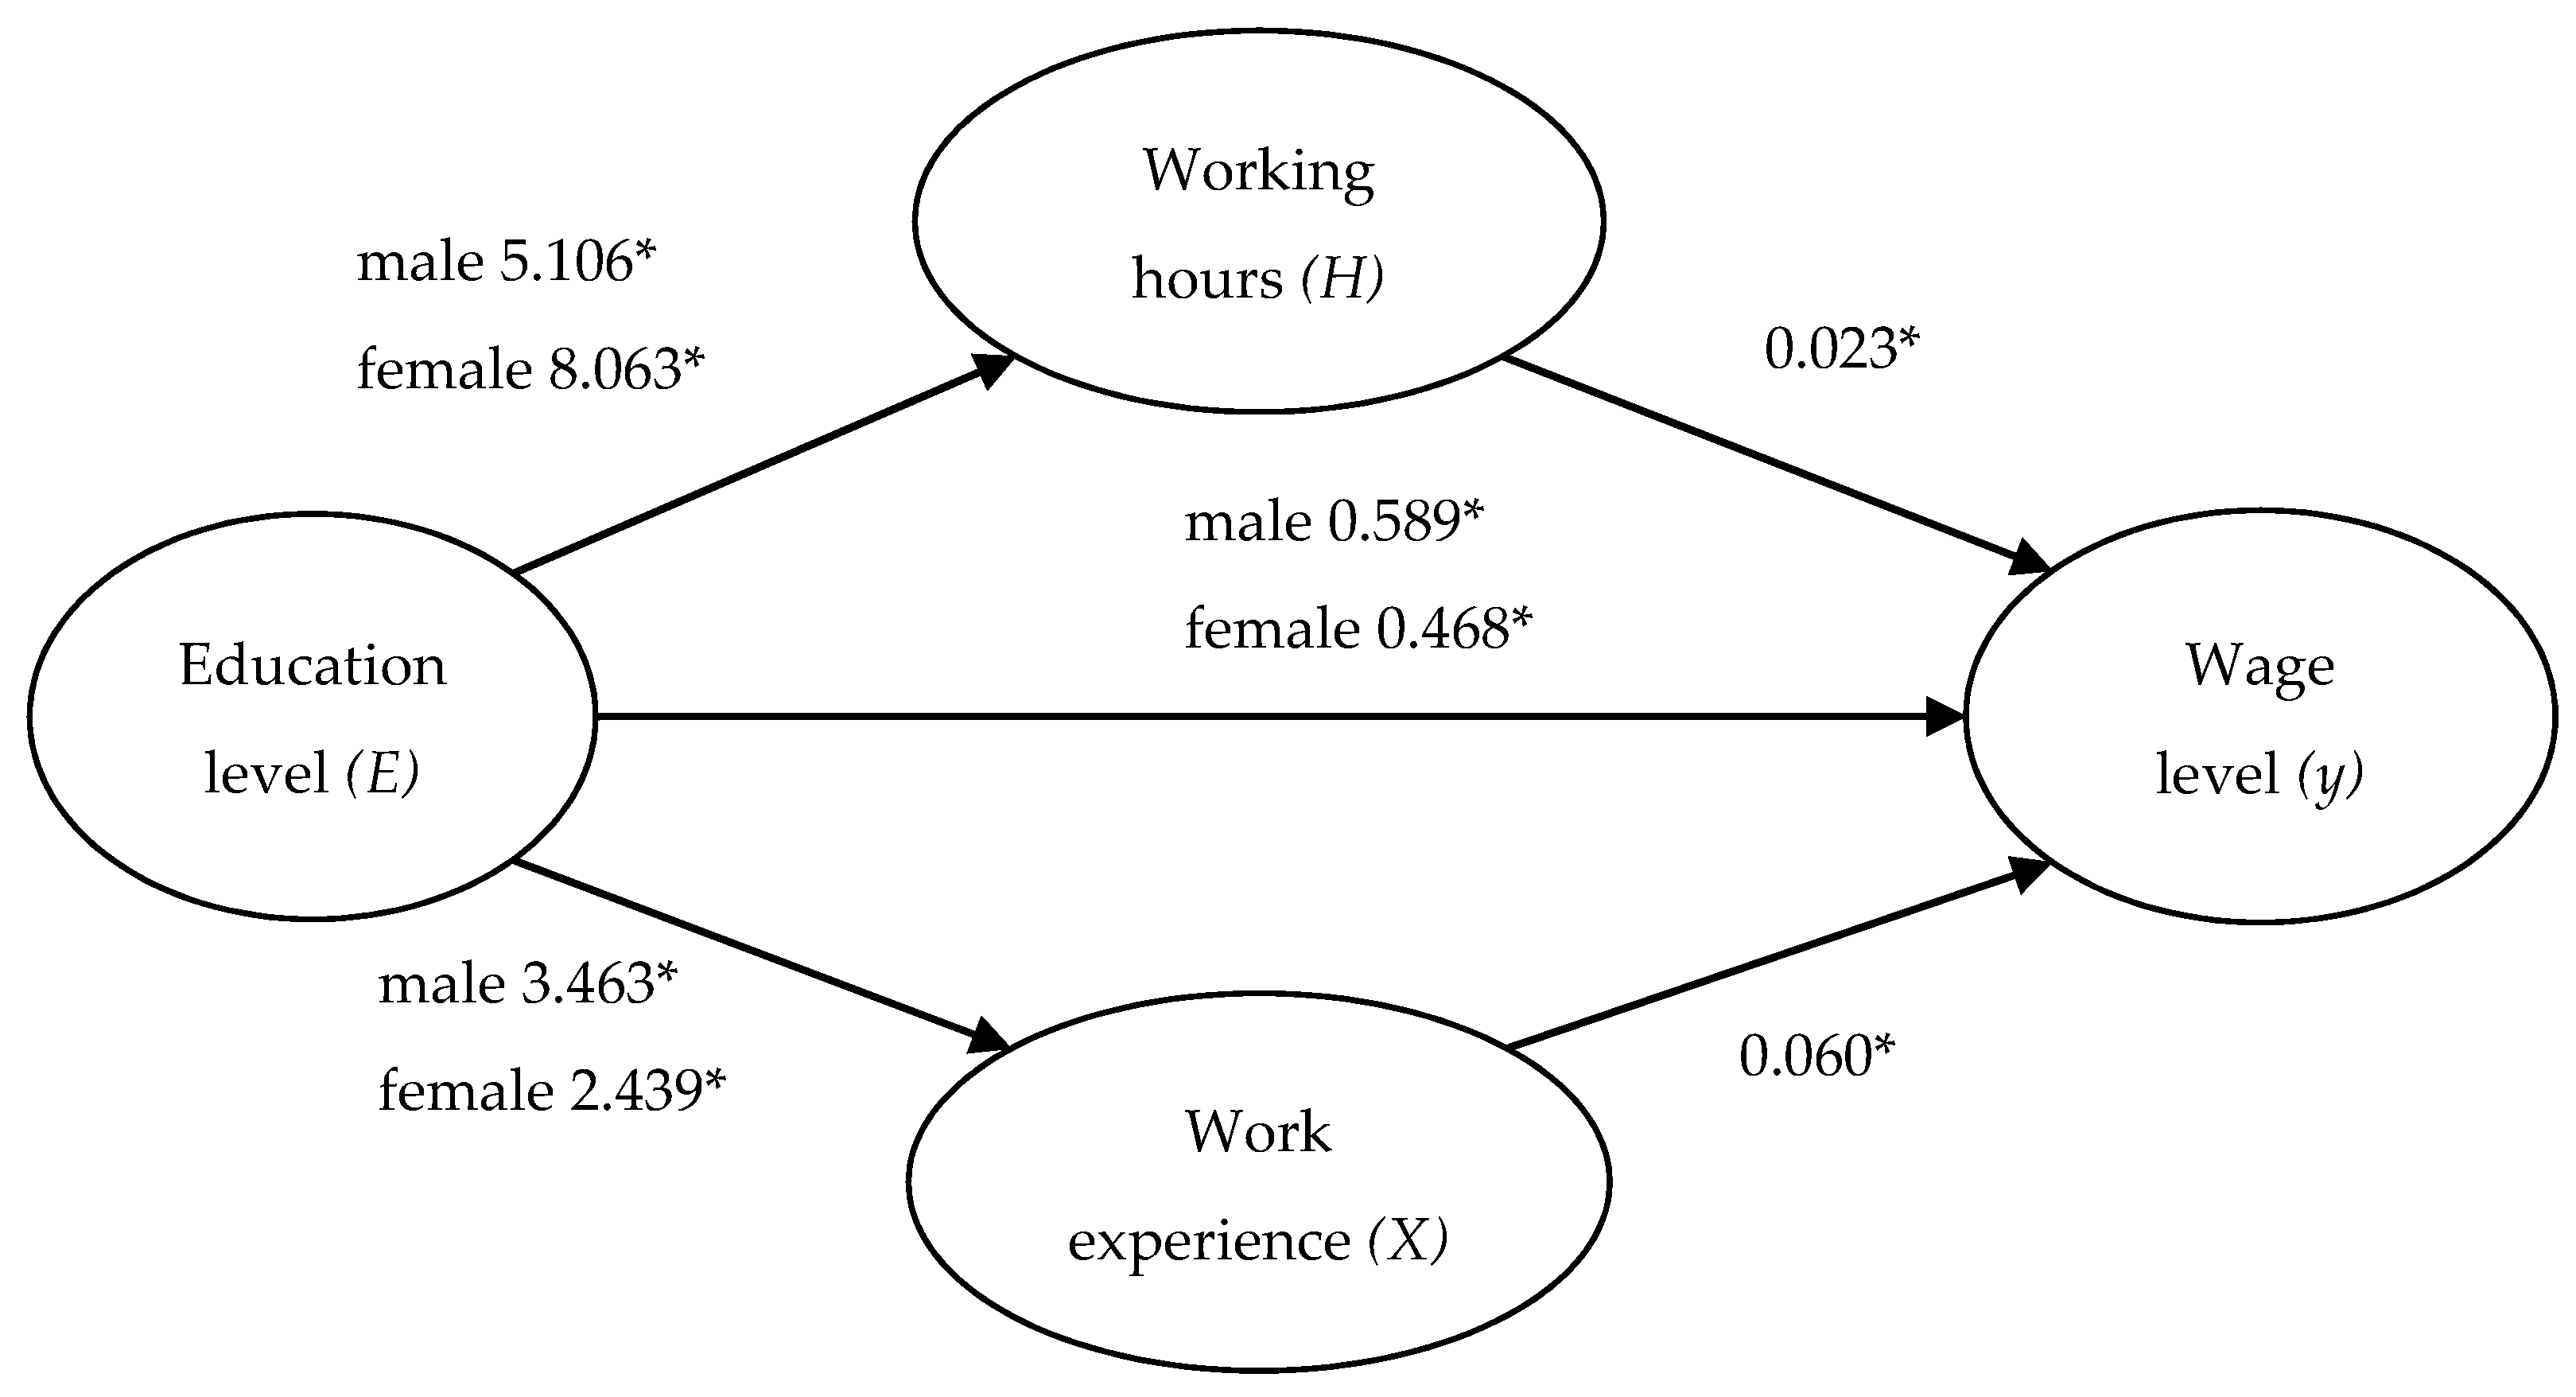
Figure 2.
Regression model of education level, work experience, and wage on social support (* Significant at 0.05 level for regression coefficient).
Figure 2.
Regression model of education level, work experience, and wage on social support (* Significant at 0.05 level for regression coefficient).

Figure 3.
Regression analysis of social support and wage level on job satisfaction (* Significant at 0.05 level for regression coefficient).
Figure 3.
Regression analysis of social support and wage level on job satisfaction (* Significant at 0.05 level for regression coefficient).


Table 1.
Research variables of this study.
| Variable | Variable Abbreviation: Description | Observed Score |
|---|---|---|
| Gender | Z: Gender | 0: female, 1: male |
| Work experience | X: Number of years of work experience | years |
| Working hours | H: Working Hours per week | hours |
| Wage level | W: Average monthly Wage (KRW million) | 1: <100, 2: 100–200, 3: 200–300, 4: 300–400, 5: >400: |
| Education level | E: Final educational background | 1: elementary, 2: middle school, 3: high school, 4: college |
| Social support | S1: My colleagues support me. | 1: Never, 2: Rarely, 3: Sometimes, 4: Most of the time, 5: Always |
| S2: My boss helps and supports me. | ||
| S3: Respect me personally. | ||
| S4: Praise when you do a good job. | ||
| S5: Helps employees to work well together. | ||
| S6: It helps to handle things. | ||
| S7: It gives helpful feedback about work. | ||
| S8: Encourage and help you develop. | ||
| Job satisfaction | J1: At my work, I feel full of energy | 1: Never, 2: Rarely, 3: Sometimes, 4: Most of the time, 5: Always |
| J2: I am enthusiastic about my job | ||
| J3: Time flies when I am working | ||
| J4: In my opinion, I am good at my job | ||
| J5: I exhausted at the end of the working day | 1: Always, 2: Most of the time, 3: Sometimes, 4: Rarely, 5: Never | |
| J6: I doubt the importance of my work |
Table 2.
Results of reliability analysis using Cronbach’s alpha.
| Latent Variable | Initial Items | Removed Question Item | Final Items | Cronbach’s Alpha |
|---|---|---|---|---|
| Social support | 8 | S1, S2 | 6 | 0.898 |
| Job dissatisfaction | 6 | J5, J6 | 4 | 0.784 |
Table 3.
Regression analysis using indicator variable, Z.
| Model | Dependent Variable (y) | Independent Variable | Regression Model |
|---|---|---|---|
| Model 1 | Wage level | Z, E, X, H, E*Z, X*Z, H*Z | y = β0 + α0 Z + β1 E + β2 X + β3 H + α1 E*Z + α2 X*Z + α3 H*Z |
| Model 2 | Social support | Z, E, X, W, E*Z, X*Z, W*Z | y = β0 + α0 Z + β1 E + β2 X + β3 W + α1 E*Z + α2 X*Z + α3 W*Z |
| Model 3 | Job satisfaction | Z, W, S, W*Z, S*Z | y = β0 + α0 Z + β1 W + β2 S + α1 W*Z + α2 S*Z |
Note: Z = Gender (0 = female and 1 = male); E = Education level; X = Work experience; H = Working hours; W = Wage level; and S = Social support.
Table 4.
Correlation coefficients between worker’s characteristics and subjective scores.
| Work Experience | Working Hours | Education Level | Wage Level | Social Support | Job Satisfaction | |
|---|---|---|---|---|---|---|
| Work experience | 0.334 * | 0.343 * | 0.630 * | 0.113 * | 0.092 * | |
| Working hours | 0.620 * | 0.600 * | 0.061 * | 0.104 * | ||
| Education level | 0.660 * | 0.160 * | 0.202 * | |||
| Wage level | 0.159 * | 0.184 * | ||||
| Social support | 0.459 * |
* Significant at 0.05 level.
Table 5.
Regression analysis on wage level.
| Dependent Variable (y) | Independent Variable | Regression Model | R2 | Model Validity |
|---|---|---|---|---|
| Work experience | Z, E, E*Z | y = −0.104 + 2.439E + 1.024E*Z | 0.156 | p < 0.001 * |
| Working hours | Z, E, E*Z | y = 7.548 + 14.184Z + 8.063E − 2.957E*Z | 0.422 | p < 0.001 * |
| Wage level | Z, E, E*Z | y = 0.200 + 0.773E + 0.202E*Z | 0.499 | p < 0.001 * |
| Wage level | Z, E, X, E*Z, X*Z | y = 0.211 + 0.601E + 0.070X + 0.171E*Z − 0.012X*Z | 0.650 | p < 0.001 * |
| Wage level | Z, E, H, E*Z, H*Z | y = −0.157 + 0.563E + 0.03H + 0.176E*Z | 0.542 | p < 0.001 * |
| Wage level | Z, E, X, H, E*Z, X*Z, H*Z | y = −0.064 + 0.468E + 0.060X + 0.023H + 0.121E*Z | 0.672 | p < 0.001 * |
* Significant at 0.05 level, Note: Z = Gender (0 = female, 1 = male); E = Education level; X = Work experience; and H = Working hours.
Table 6.
Regression analysis of education level, work experience, and wage level on social support.
| Dependent Variable (y) | Independent Variable | Regression Model | R2 | Model Validity |
|---|---|---|---|---|
| Social support | Z, E, X, E*Z, X*Z | y = 3.477 + 0.072B+ 0.004E | 0.029 | p < 0.001 * |
| Social support | Z, E, W, E*Z, W*Z | y = 3.479 + 0.049B + 0.045I − 0.057Z | 0.033 | p < 0.001 * |
| Social support | Z, E, X, W, E*Z, X*Z, W*Z | y = 3.479 + 0.049B + 0.045I − 0.057Z | 0.033 | p < 0.001 * |
* Significant at 0.05 level, Note: Z = Gender (0 = female, 1 = male); E = Education level; X = Work experience; and W = Wage level.
Table 7.
Regression analysis of social support and wage level on job satisfaction.
| Dependent Variable (y) | Independent Variable | Regression Model | R2 | Model Validity |
|---|---|---|---|---|
| Wage level | Z, S, S*Z | y = 1.141 + 0.405S + 1.046Z | 0.164 | p < 0.001 * |
| Job satisfaction | Z, S, S*Z | y = 1.829 + 0.468S + 0.052Z | 0.212 | p < 0.001 * |
| Job satisfaction | Z, W, S, S*Z, W*Z | y = 1.780 + 0.045W + 0.450S | 0.223 | p < 0.001 * |
* Significant at 0.05 level, Note: Z = Gender (0 = female, 1 = male); W = Wage level; and S = Social support.
Publisher’s Note: MDPI stays neutral with regard to jurisdictional claims in published maps and institutional affiliations. |
© 2020 by the authors. Licensee MDPI, Basel, Switzerland. This article is an open access article distributed under the terms and conditions of the Creative Commons Attribution (CC BY) license (http://creativecommons.org/licenses/by/4.0/).
Share and Cite
MDPI and ACS Style
Yang, S.H.; Jeong, B.Y. Gender Differences in Wage, Social Support, and Job Satisfaction of Public Sector Employees. Sustainability 2020, 12, 8514. https://doi.org/10.3390/su12208514
AMA Style
Yang SH, Jeong BY. Gender Differences in Wage, Social Support, and Job Satisfaction of Public Sector Employees. Sustainability. 2020; 12(20):8514. https://doi.org/10.3390/su12208514
Chicago/Turabian StyleYang, Seung Hee, and Byung Yong Jeong. 2020. "Gender Differences in Wage, Social Support, and Job Satisfaction of Public Sector Employees" Sustainability 12, no. 20: 8514. https://doi.org/10.3390/su12208514
Note that from the first issue of 2016, this journal uses article numbers instead of page numbers. See further details here.