Article

Assessment of Anthropogenic Sources of Potentially Toxic Elements in Soil from Arable Land Using Multivariate Statistical Analysis and Random Forest Analysis

Faculty of Urban and Environmental Sciences, Central China Normal University, Wuhan 430079, China
*
Author to whom correspondence should be addressed.
Sustainability 2020, 12(20), 8538; https://doi.org/10.3390/su12208538
Submission received: 18 August 2020 / Revised: 1 October 2020 / Accepted: 5 October 2020 / Published: 15 October 2020

Abstract

:
In order to study the spatial distribution and anthropogenic sources of potentially toxic elements in Xiangzhou, soil samples were collected from arable land and were analyzed for five different potentially toxic elements: Cd, Hg, As, Pb, and Cr. Inverse distance weighting (IDW) was used to study the spatial distribution of potentially toxic elements in the soil, while principal component analysis (PCA) and random forest analysis (RFA) were applied to examine the anthropogenic sources. It was shown that the combination of multiple analysis tools provides an effective way of delineating multiple potentially toxic elements from anthropogenic sources. The results showed that the average contents of Cd, Hg, and Cr in soils were lower than the background values of Hubei, whereas the average concentrations of As and Pb in soils were higher than the background values of Hubei. Through PCA, it was concluded that human activities contributed more than 60% of the As, Pb, and Cr concentrations in Xiangzhou soils, which was verified by a random forest simulation methodology. Through random forest analysis, Pb, As, and Cr in the soil were found to originate from factories and enterprises, livestock farms, mining areas, and traffic; Cd in the soil was found to originate from mining and the processing of minerals, human production and construction activities, and agricultural irrigation; and Hg in the soil was found to originate from livestock manure, mining and processing of minerals, and human industrial production. The results of this study could provide support for better management of soil pollution through prevention practices such as specific industrial governance and layout optimization.

Graphical Abstract

1. Introduction

A balanced soil ecosystem is the premise for improving the productivity of agricultural land [1]. Some potentially toxic trace elements in soil are indispensable for the growth of crops. However, when their accumulation exceeds a certain standard, they are enriched in the food chain, threatening the health of animals, plants, and humans [2,3]. In the 21st century, with the vigorous development of industrial production, the content of potentially toxic elements in the soil of agricultural land in many areas has exceeded national standards [4]. Exploring the sources of potentially toxic elements in soil pollution has become an important area of study [5]. The accumulation of potentially toxic elements and the decline of soil environmental quality due to human activities do not only involve developing countries [6]; the rich scientific literature demonstrates that these are global issues [7,8].
Cd, Hg, As, Pb, and Cr are five common potentially toxic elements (PTEs) in cultivated land. Because of their strong toxicity, they are collectively referred to as the “five poisons” [9,10]. In the most recent literature, researchers used compositional data analysis (CoDA) to explore the sources of elements in soil [11]. CoDA allows for identifying and interpreting the geochemical associations and sources (natural, anthropic, or mixed) of PTEs [12]. In past research, researchers typically used multivariate statistical analysis, geostatistical analysis, and geospatial analysis to explore the sources of potentially toxic elements in soil, which were proven to be ideal methods for pollution research [13]. Trace elements in the soil not only originate from the natural accumulation of soil parent materials, but are also affected by many other factors [14]. They are nondegradable and biologically toxic, they can migrate and transform in the soil, they can enter other environmental media and organisms, and they may ultimately act on the human body and cause serious health problems [15,16,17]. Jin et al. (2019) evaluated soil and equipment dust samples from 71 playgrounds across Beijing, and they used geographic information system (GIS) and multivariate analysis methods to assess the spatial distribution and potential sources of these potentially toxic elements [18]. Wu et al. (2015) collected 170 topsoil samples and evaluated the metal pollution level of potentially toxic elements in the urbanized area of Dongguan, China [19]. Chen et al. (2005) measured Cd, Cu, Pb, and Zn concentrations in soil and equipment dust on the roadside and revealed their relationship with urban traffic in Beijing, China [20]. These studies show that human interference, such as industrial activities, the use of agricultural fertilizers, mineral mining, artificial irrigation, industrial waste discharge, and transportation, represents the leading cause of the accumulation of potentially toxic elements in soil [21,22].
However, there are still some deficiencies in the current research. A rough qualitative analysis cannot quantify the extent of source impact on the pollution of the surrounding soil, and it does not reveal the impact of industry type on the concentration of potentially toxic elements in different local soils. Random forest analysis (RFA) is a new type of machine learning technology. It can effectively avoid the phenomenon of overfitting in traditional classification methods, and the model is not affected by missing variables, which improves the prediction accuracy of impact factors in terms of variable contribution. RFA has been gradually applied to the study of soil trace elements. In addition, it is different from model methods such as the backpropagation (BP) artificial neural network method and logistic regression method. The random forest regression model can estimate the importance of variables; thus, it is suitable for analysis of the sources of potentially toxic elements in soil.
From the perspective of the relationship between multisource environmental variables and the content of potentially toxic elements in agricultural land, we used multivariate statistical analysis, PCA, GIS, and RFA, in conjunction with big data, to (1) find factors with a high impact on the accumulation of potentially toxic elements in soil under different geographical and cultural conditions, (2) quantify the driving force of human factors on the spatial distribution of potentially toxic elements in soil, and (3) provide a theoretical basis for regional farmland protection and sustainable agricultural development.

2. Materials and Methods

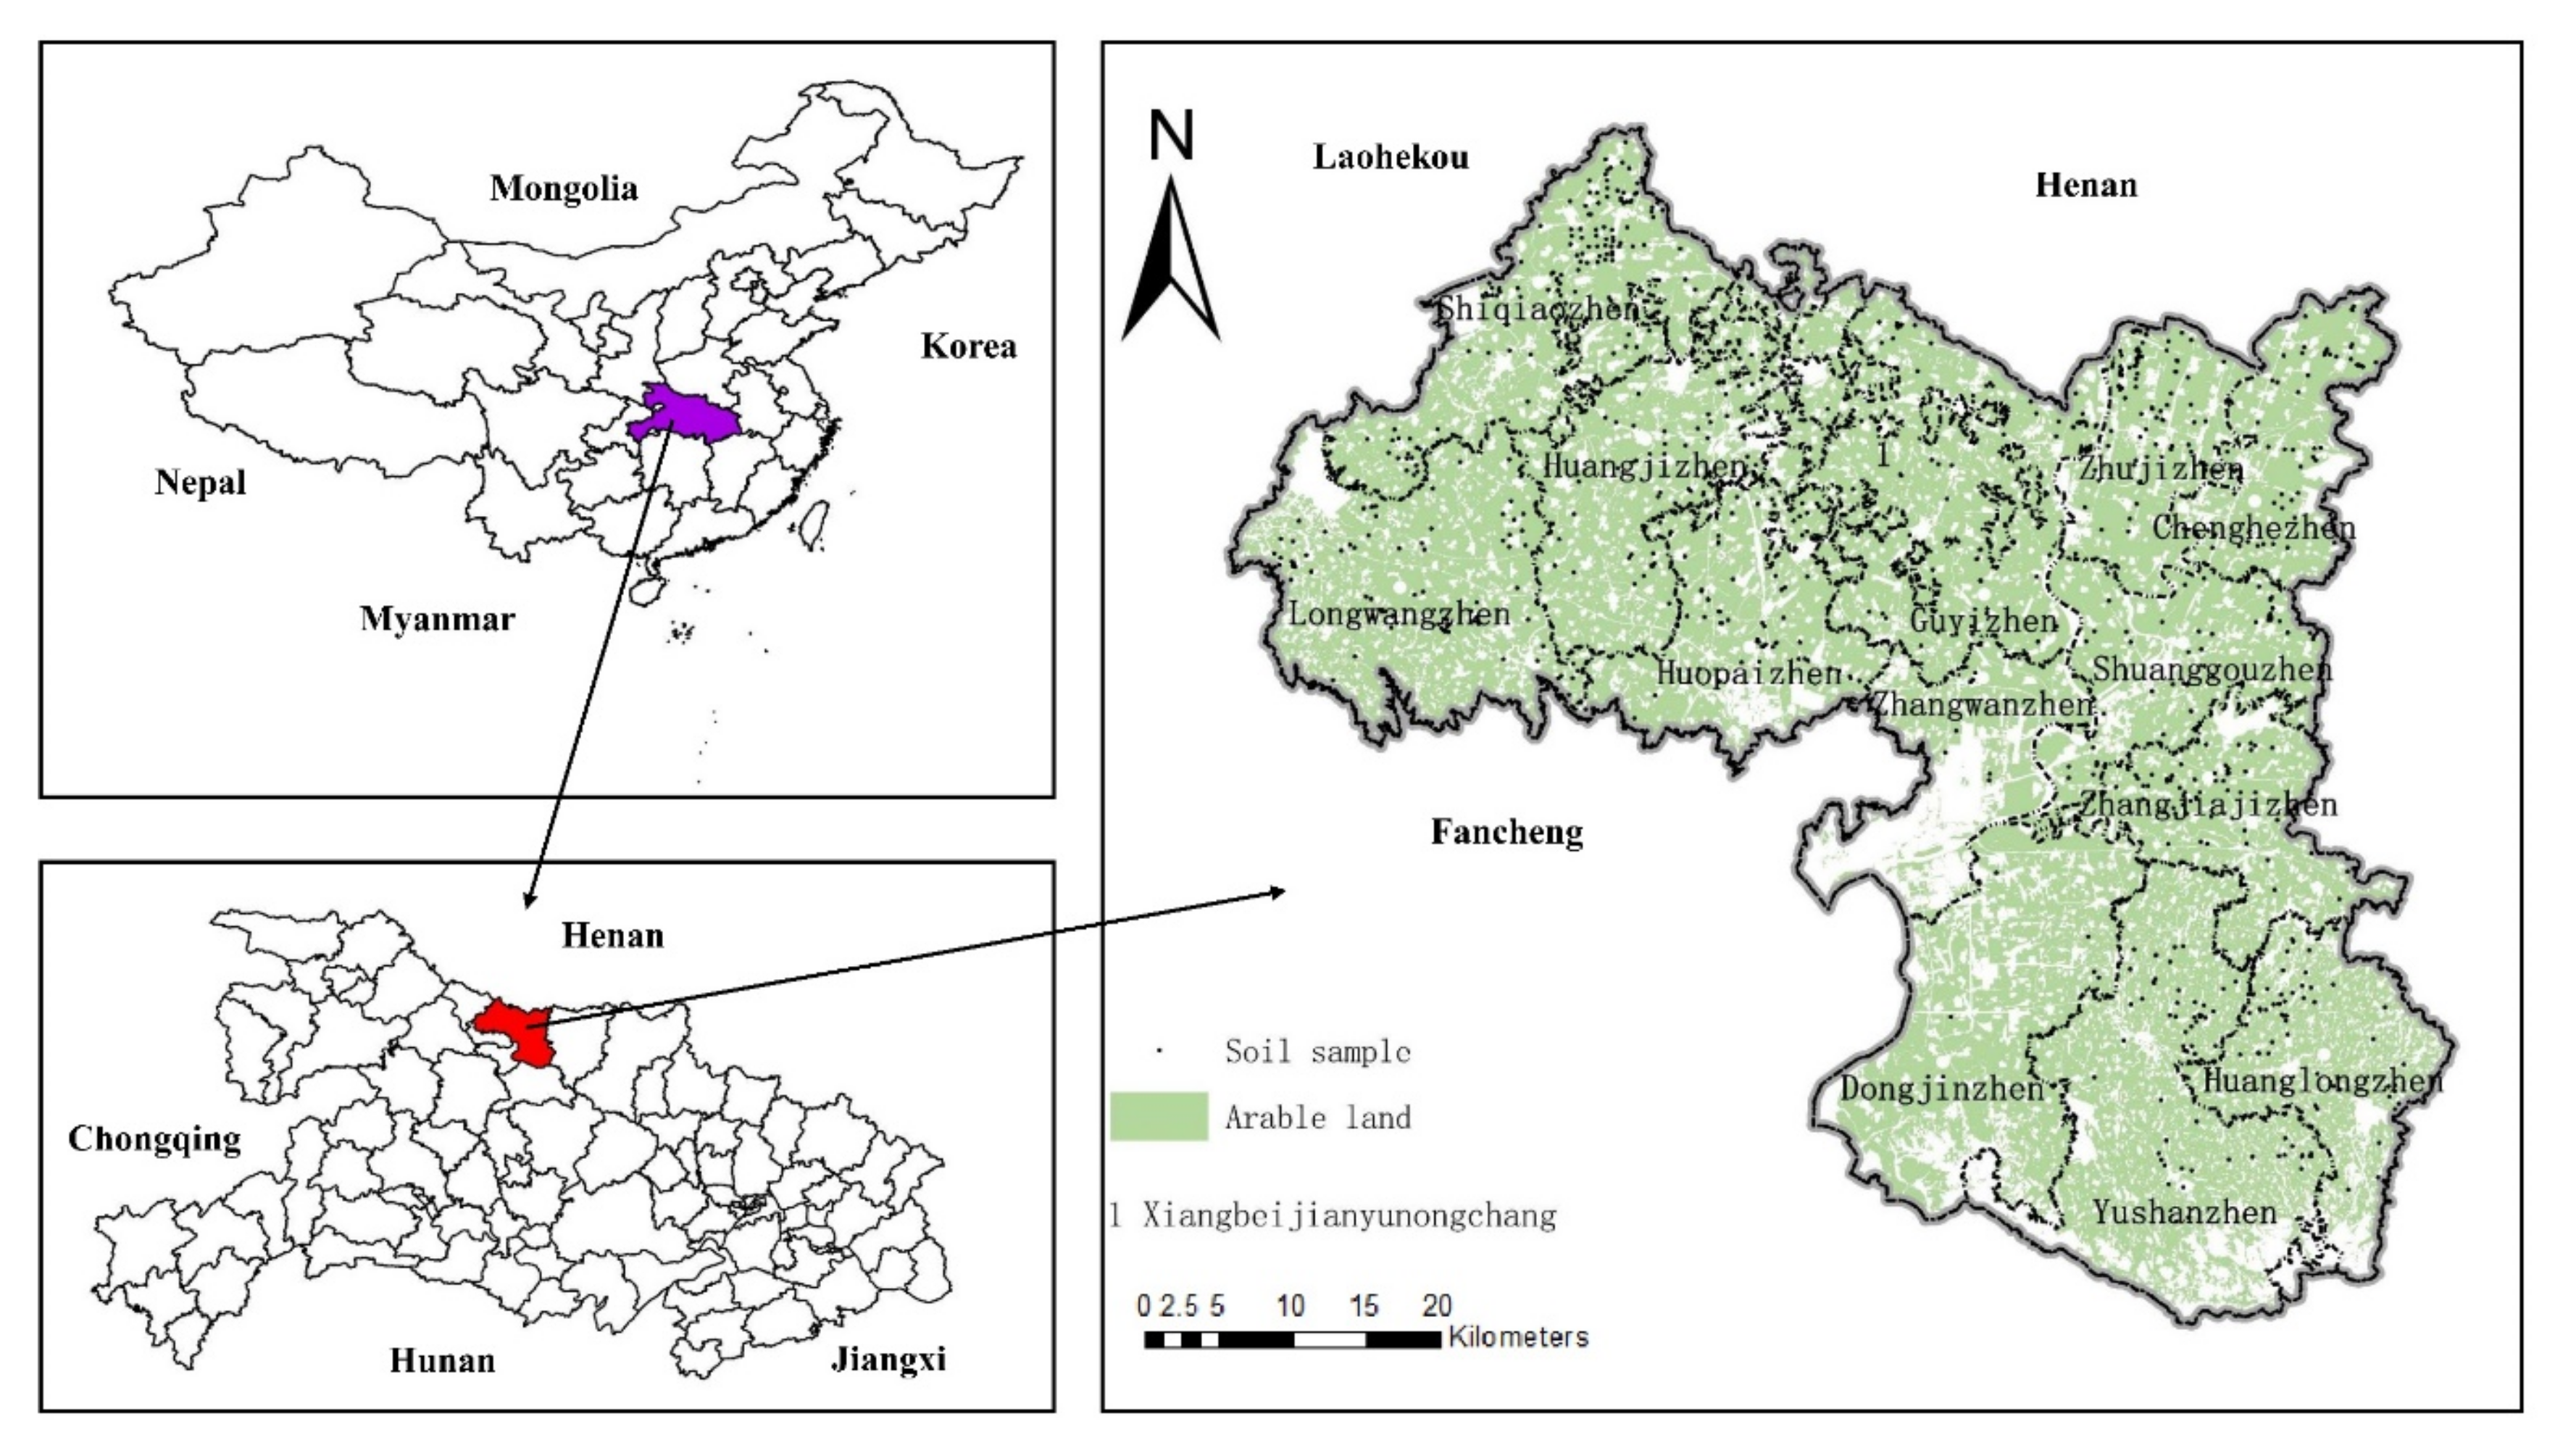
2.1. Study Location and Field Sampling

The study was conducted in Xiangzhou, which is located in the northwest of Hubei Province. Xiangzhou has a humid subtropical monsoon continental climate. The annual average temperature is 15.3–15.8 °C, and the annual average precipitation is 800–900 mm. There is a high degree of urbanization. In recent years, industry and agriculture have developed rapidly in the context of the construction of provincial subcentral cities.
However, this is likely to have caused the decline in the surrounding soil environmental quality, as Xiangzhou is dominated by the three pillar industries of automobile manufacturing and parts processing, cash crop processing, and equipment manufacturing. Xiangzhou is an important transportation hub in Hubei Province, whereby vehicles travel frequently within Xiangzhou due to its high road network density. The soil environment near the road is therefore influenced by car exhaust containing harmful gases. Xiangzhou covers an area of 2306 km2, and its main land use types are agricultural land, construction land, and unused land, of which agricultural land is 2028.07 km2, accounting for 82.22% of the total land area. As an important grain-producing area in Hubei Province, there are 700 km2 of high-standard farmland, accounting for 34.51% of the total agricultural land. The main types of soil are yellow-brown soil, paddy soil, and fluvo-aquic soil. The soil pH is 4.8–7.1, the soil organic matter is 10.5–33.9 g/kg, and the soil bulk density is 1.5–1.6 g/cm3. Many important factors affect the accumulation of potentially toxic elements in agricultural land, including the long-term use of pesticides and fertilizers and the discharge of domestic and industrial wastewater.

2.2. Sample Analysis

Samples were collected from agricultural land in Xiangzhou, and a global positioning system (GPS) was used to accurately locate all 975 sampling points in 2019 (Figure 1). Soil was obtained from the top 5 cm of exposed soil. After weeds, stones, and other debris were removed, the soil sample was mixed thoroughly, and 1.0 kg of the soil sample was retained for each sample point according to the quartering method. The soil sample was placed in a room to air dry before it was ground and passed through a 0.149 mm nylon mesh sieve for analysis and testing. Water was added to a small amount of each sample before shaking. Then, after instrument calibration, the pH value of the soil was measured using the potentiometric method. Matrices in geological samples are difficult to digest; hence, before digestion, the sample was soaked in a mixture of three acids (nitric acid, hydrofluoric acid, and perchloric acid) for 12 h, and then the sample was subjected to high pressure in a microwave digester.
The level of Cd in the sample was measured using graphite furnace atomic absorption spectrometry. Atomic absorption spectrometry requires the element to be detected to be atomizable, whereby a higher atomization level facilitates detection. The advantage of graphite furnace atomic absorption spectrometry is that the graphite furnace can increase the degree of the atomization of elements. Therefore, even if the content of an element in the soil is very low, it can be accurately detected using this method.
The level of Cr was identified using flame atomic spectrometry, which has a wide range of applications. Generally speaking, all elements that can be atomized can be detected using this technology. The detection efficiency of this technology is high, it produces reliable results, the application process is simple and easy, and the use cost is relatively low.
The detection of Hg, Pb, and As was achieved using atomic fluorescence spectrometry. This study used national standards of the People’s Republic of China to control the quality of sufficient samples, and the measurement results were in accordance with the national standard reference error.

2.3. Experimental Method

2.3.1. Analytical Framework

The following methods were applied in this research to identify the anthropogenic sources of potentially toxic elements and to quantify the impact degree: Spearman correlation analysis, PCA, and RFA (Figure 2). Multivariate statistical analysis was used to determine the pollution risk of potentially toxic elements. Then, principal component analysis was used to analyze the types of potentially toxic elements to determine their main pollution sources, and a detailed pollution source contribution rate was obtained through a random forest simulation calculation. Therefore, through the framework of Spearman correlation analysis, PCA, and RFA, the influence of human activities on the content of potentially toxic elements in soil in the study area could be revealed. The large number of samples in this study guaranteed the accuracy of the experiment.

2.3.2. Principal Component Analysis

PCA allows for the use of a few factors to describe the relationship between many indicators or factors. A few comprehensive indicators are obtained that reflect the characteristics of the whole sample according to correlations between the indicators. PCA is often used to study the source of elements in various media. It is widely believed that elements with significant correlation may have homology [23]. According to the characteristics of the PCA model, multiple indicators are converted into a few comprehensive indicators to reflect the information of the original data. This method can be used to determine the source of potentially toxic elements in the soil [24].

2.3.3. Random Forest Analysis

Random forest analysis (RFA) was proposed by the scientist Breiman in 2001 as a new type of machine algorithm that uses bootstrap resampling technology to extract multiple samples from the original sample with replacement, thereby forming a new sample set. For each independently drawn sample, RFA uses the weighted average to train a decision tree (called a weak predictor), generates multiple decision trees, and finally forms a forest (called a strong predictor), which allows us to obtain the final prediction result on the basis of the average value of all decision tree predictions. RFA’s main characteristic is that there are no requirements related to the type and distribution of the data. When noise and outliers exist in the dataset, the accuracy of prediction results is high, and it has the advantage of preventing data overfitting [25].

3. Results

3.1. Concentrations of Potentially Toxic Elements in Soil

The basic statistics for Cd, Hg, As, Pb, and Cr in arable land areas are listed in Table 1, including the minimum, maximum, mean, standard deviation, coefficient of variation (CV), and background value. The mean concentrations of all potentially toxic elements, except for As and Pb, were below the average background value (ABV) in Hubei Province [26]. Enrichment factors (EFs) are used to assess pollution levels and to evaluate the degree of human impact [27]:
EF = C i / C r e f s a m p l e C i / C r e f b a c k g r o u n d
where C i is the concentration of the ith metal element (mg/kg) and C r e f is the concentration of the reference element for normalization (mg/kg). The average accumulation rates ( C m e a n /ABV) for As and Pb were 1.03 and 1.09, respectively. According to the EF value, soils can be classified into five levels: minimal enrichment (EF < 2); moderate enrichment (2 < EF < 5); significant enrichment (5 < EF < 20); very high enrichment (20 < EF < 40); extremely high enrichment (40 < EF) [28]. The results showed that As and Pb were locally elevated to a certain extent. It was therefore inferred that the study area is mildly contaminated by human activities.
As Spearman correlation does not require the normality of variables, it was applied to the data for the five potentially toxic elements for 975 samples using SPSS software (Table 2), where correlations among As and Pb, As and Cr, and Pb and Cr were found to be high, with values of 0.678, 0.572, and 0.465, respectively, indicating that their common sources are highly consistent.

3.2. Data Analysis

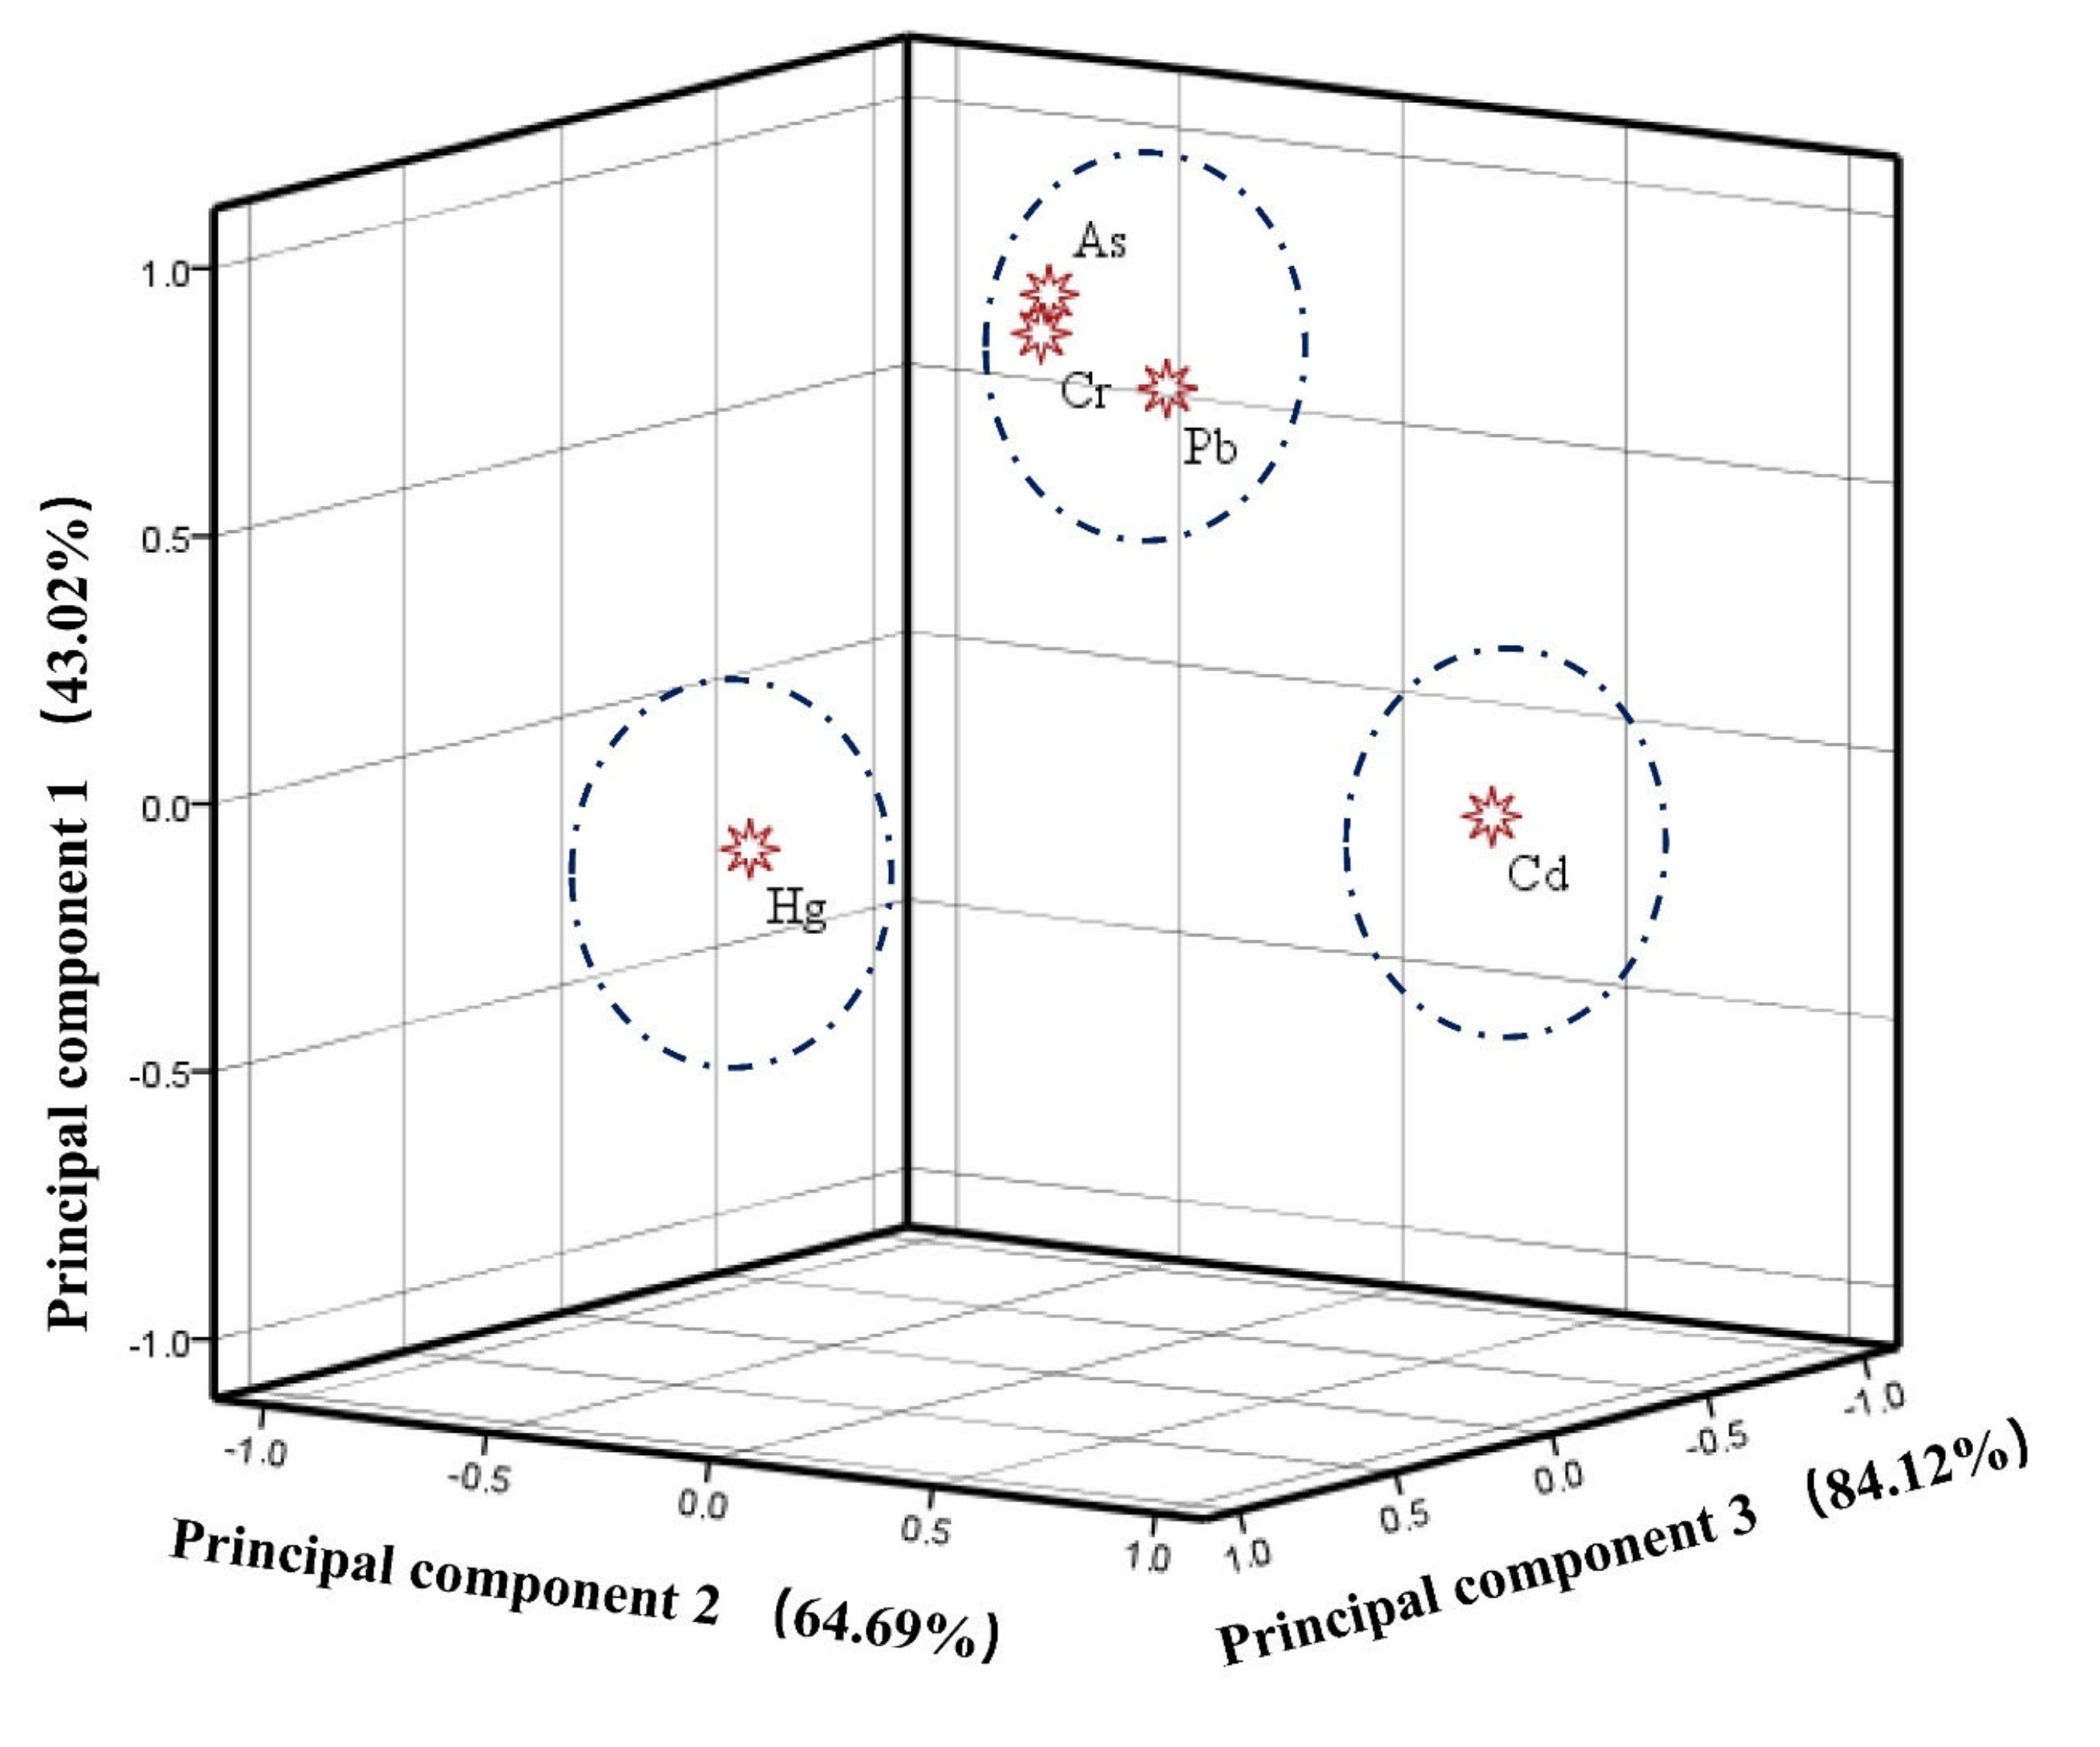
3.2.1. Principal Component Analysis

Principal component analysis allows for a reduction in the dimensionality of multiple variables, which helps to reveal non-obvious relationships among variables. Kaiser–Meyer–Olkin (KMO) and Bartlett’s sphericity tests were carried out using SPSS software, obtaining a KMO value of 0.598 (>0.5) and p = 0.0000. The associated probability of Bartlett’s sphericity test was 0.0000 (<0.05); thus, the sample data could be subjected to principal component analysis (factor analysis).
According to the results of cross-validation (Table 3, Figure 3), the first three components explained more than 84.12% of the total variance in the study area and were hence selected as the principal components. This method showed that, in Xiangzhou, PC1 explained 43.02% of the total variance and was dominated by AS, Pb, and Cr, PC2 explained an additional 21.67% of the total variance and was dominated by Hg, and PC3 explained an additional 19.43% of the total variance and was dominated by Cd.
In the study area, PC1 was dominated by As, Pb, and Cr. It can be concluded that their presence was mainly derived from human activities, such as industrial emissions, agricultural fertilizer use, and vehicle exhaust emissions [29]. In this study, Cd and Hg mainly dominated PC2 and PC3, which potentially indicates mixed sources. According to previous studies, Cd and Hg mainly originate from soil parent material and human activities [30].
The inverse distance weighting (IDW) method was used to create a spatial distribution map of the potentially toxic elements using ArcGIS software. Figure 4a shows the spatial distribution of Cd, centered on the old city and increasing radially outward. The Cd content in paddy fields near the northern waters of the study area and dry land near the hills and mountains in the south was higher than that in other areas. On the basis of the elevation map, a lower terrain presented a higher Cd content. Figure 4b shows the spatial distribution of Hg, which presented a “basin” type distribution (i.e., high in the surroundings and low in the middle). Figure 4c–e show the spatial distributions of As, Pb, and Cr, which were generally relatively consistent. The high-value areas were mainly distributed on both sides of the road and near farms and industrial and mining enterprises, etc., which is consistent with the results of the principal component analysis.

3.2.2. Anthropogenic Sources of Potentially Toxic Elements

Through a Euclidean distance analysis of mining areas, livestock farms, factories and enterprises, roads, water systems, and construction land in ArcGIS software, the distances between sample points and nearby water systems, construction land, roads, factories, and enterprises were obtained. A multivalue extraction of sample points was performed to obtain the distance of each sample point to the nearest water system, road, etc. The data were used in a subsequent random forest analysis to quantitatively analyze the impact of sources, as shown in Figure 5.
Fuyin Expressway, Erguang Expressway, and other highways and main roads in urban areas were taken as the measurement objects, whereby distance from the road (Dist. Road) can reflect the possible impact of automobile exhaust during transportation on the soil environment (Figure 5a). The water system in the study area was mainly composed of surface elements such as Bai River, Guangou Reservoir, and Hongshuihe Reservoir. The distance from a water system (Dist. Water) can reflect the impact of agricultural activities such as irrigation and aquaculture on the surrounding soil environment (Figure 5b). The construction land in the study area was mainly concentrated in the center of the old city, and industrial parks were dominated by livestock farms, mining areas, the automobile industry, agricultural and sideline product processing industries, the service industry, and the textile industry (Figure 5c–f). Distance from processing and manufacturing enterprises and construction land can explain the impact of human activities on the surrounding agricultural land.

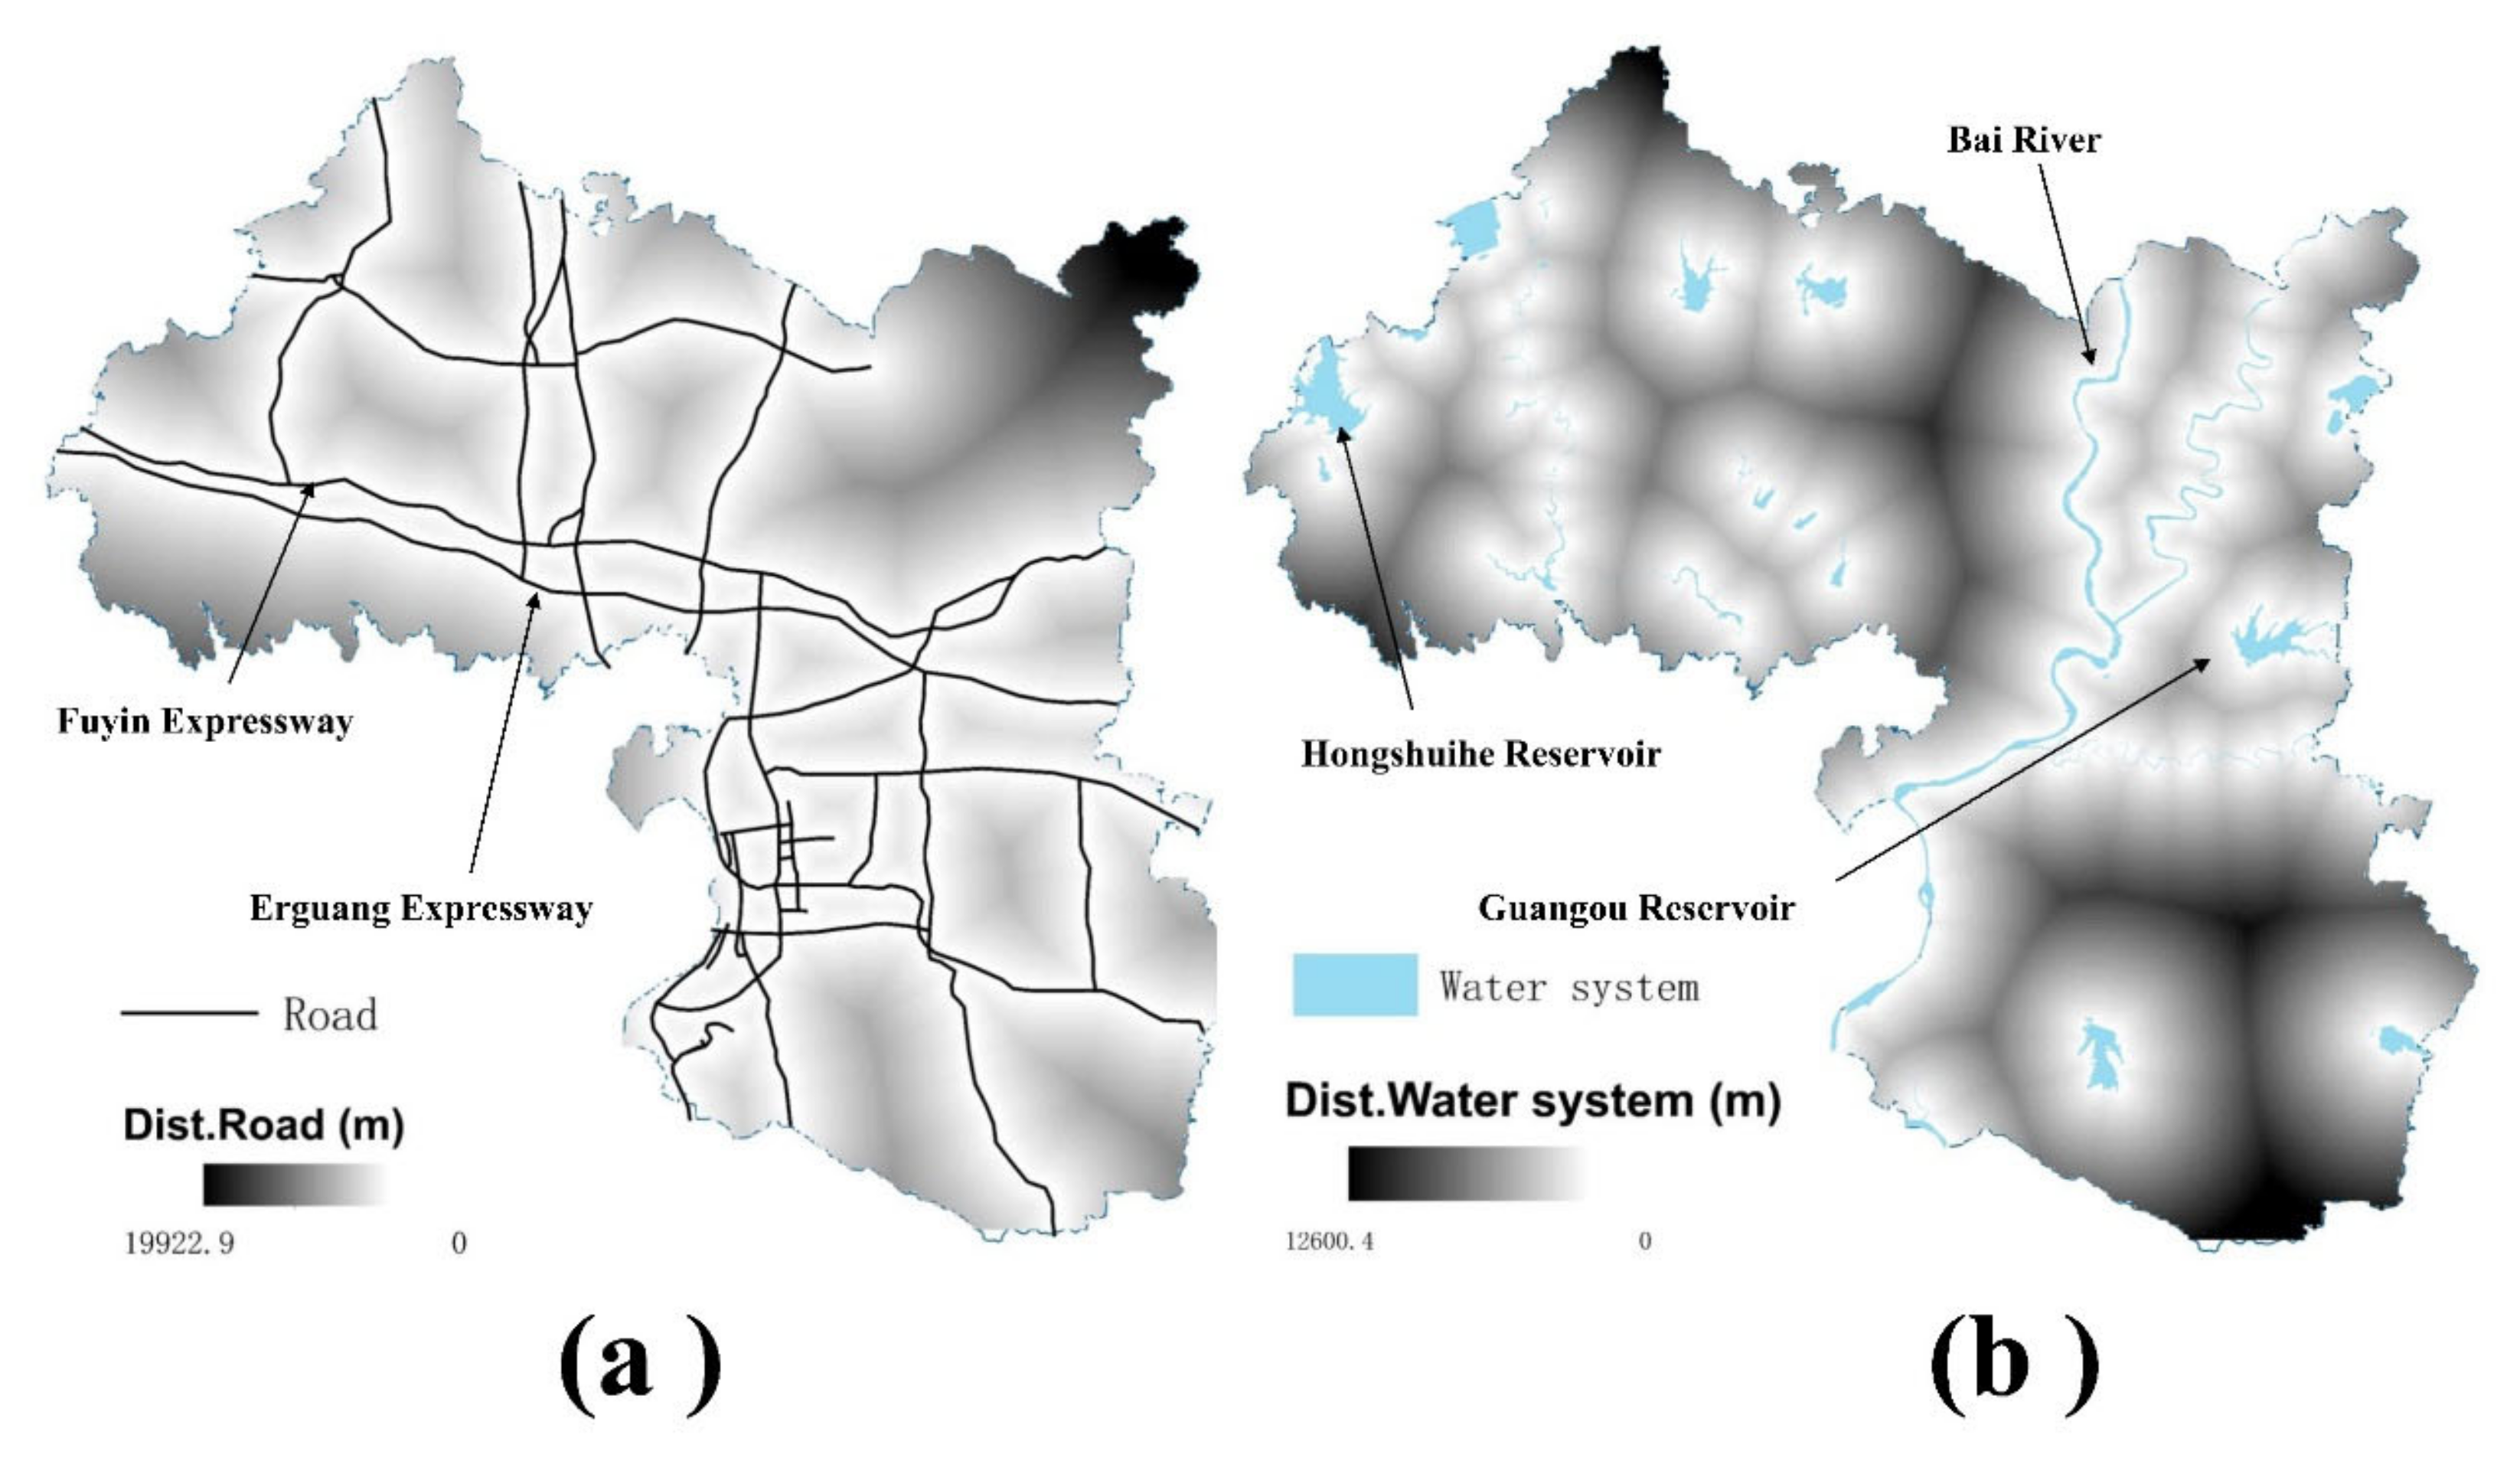
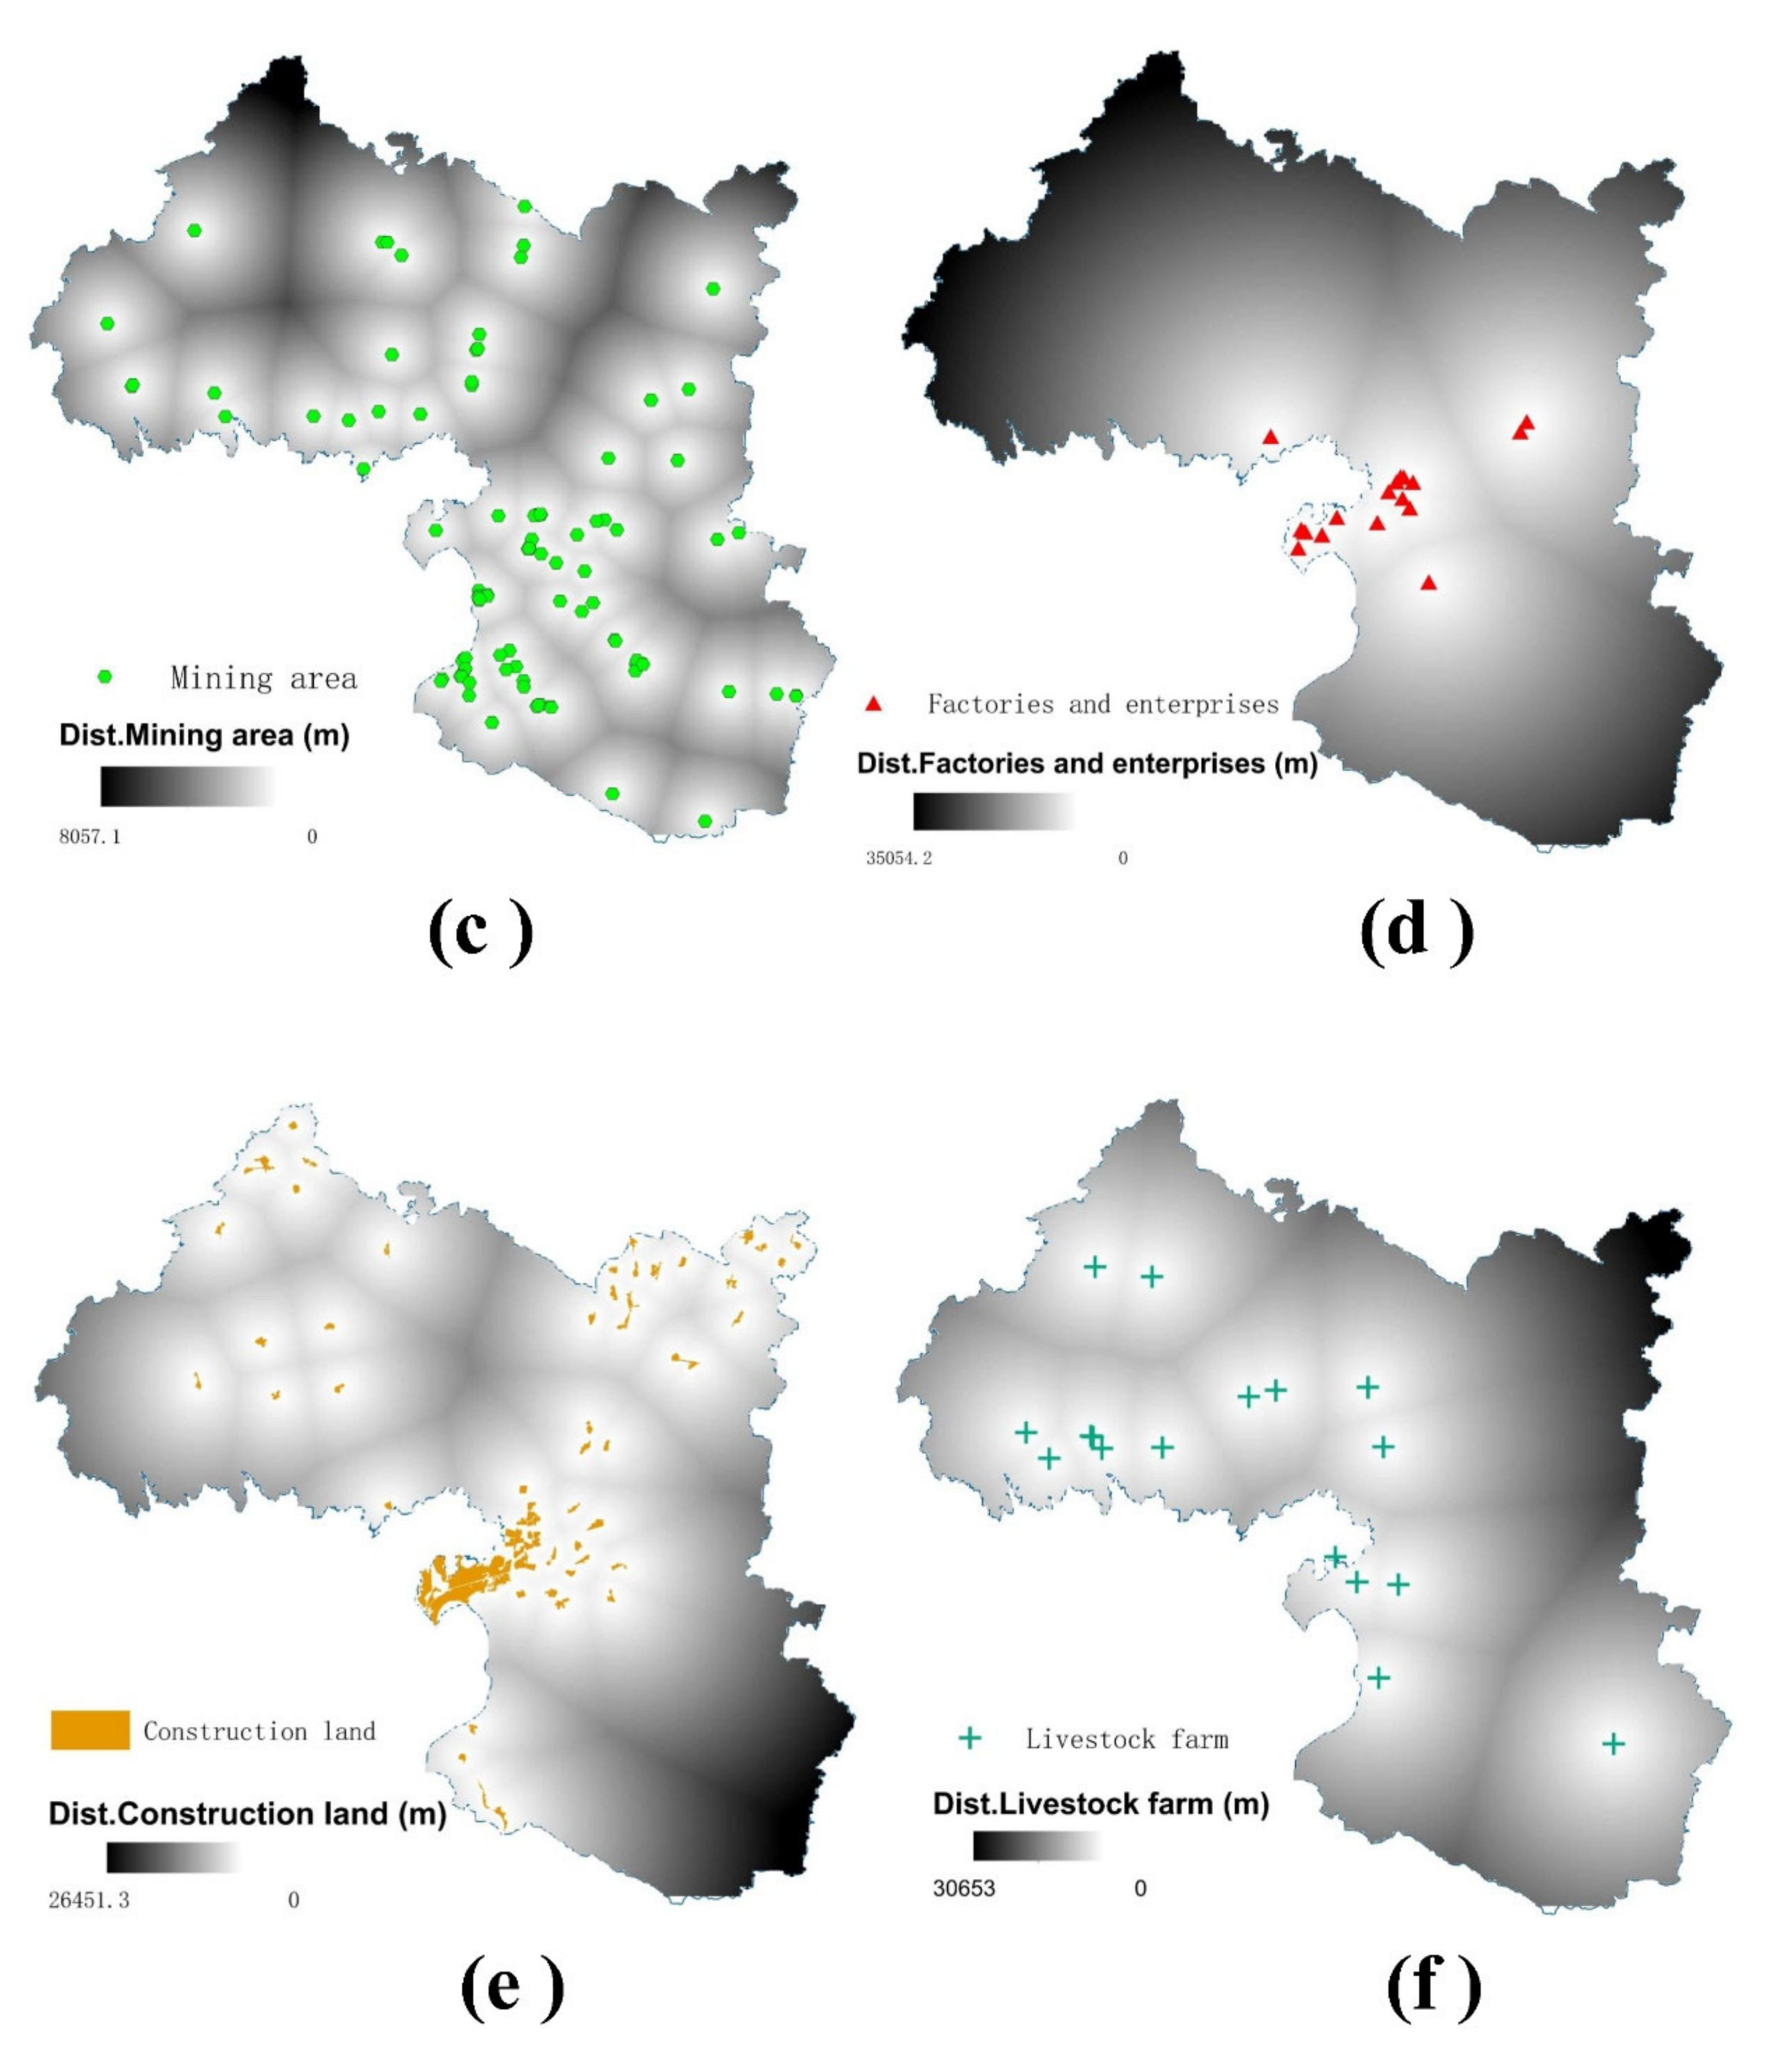
3.2.3. Random Forest Analysis Results

A random forest regression model was built using the Random Forest toolkit in R, taking the contents of the five potentially toxic elements at the sample points as the dependent variables and natural and human factors as the independent variables. After repeated tests, the best fitting effect was obtained when the number of decision trees was ntree = 1000 and the number of predictor variables selected by each node was mtry = 3. Random forest regression training was subsequently performed. A higher weight of a factor denotes its greater contribution to the accumulation of potentially toxic elements in the soil in a study area. In order to further analyze the source of Cd, Hg, As, Pb, and Cr, the Random Forest toolkit in R was used to build a random forest regression model. The 975 surface soil samples of the cultivated land in the study area were randomly divided into a training set and validation set. The training set was used to build the random forest regression model, and the remaining data were used to verify the fitting accuracy of the model. In this paper, the training-to-validation ratio was 8:2, whereby 780 samples were selected for training, and 195 samples were selected for verification. The RFA of each region showed a proportion of explained variance higher than 70% with correlation coefficients (r) of 0.81, 0.74, 0.84, 0.89, and 0.82 for the five respective elements, showing very high prediction accuracy. Table 4 shows the contribution rate of the six human impact factors.
As shown in Figure 6a–e, the mean squared error (MSE) represents the weights of manmade influential factors. Distance from a mining area (23.78%), distance from construction land (20.83%), and distance from a water system (20.71%) were the three most important factors explaining the Cd content. Distance from a livestock farm (14.43%), distance from mining areas (13.64%), and distance from factories and enterprises (12.03%) were the three most important factors explaining the Hg content. Distance from factories and enterprises (47.22%), distance from mining areas (43.93%), and distance from livestock farms (32.88%) were the three most important factors explaining the As content. Distance from factories and enterprises (40.83%), distance from livestock farms (31.46%), and distance from a road (30.53%) were the three most important factors explaining the Pb content. Distance from a livestock farm (49.38%), distance from factories and enterprises (48.23%), and distance from a mining area (45.11%) were the three most important factors explaining the Cr content.

4. Discussion

The random forest analysis showed that the mining and processing of minerals, human production and construction activities, and agricultural irrigation were important manmade factors affecting the accumulation of Cd in the soil, which is consistent with existing research. The variation in Cd concentration is usually the result of human activities, such as industrial activities or atmospheric deposition [31].
Previous studies showed that the natural sources of Hg are rocks, soils, water, and sediments, mostly in the form of minerals [32,33]. Here, the random forest regression results revealed that the discharge of livestock manure, mining and processing of minerals, and human industrial production were important manmade factors affecting the accumulation of Hg in the soil. Studies conducted by Mukherjee and others found that the mercury concentration in waste soils in the European Union (EU) is significantly higher than the global average value, indicating that, when humans are engaged in industrial and agricultural production, they cause mercury pollution in the surrounding soil [34].
The random forest regression model showed that human industrial production, the mining and processing of minerals, and the discharge of livestock manure were important human factors affecting the accumulation of As in the soil, whereas human industrial production, livestock manure discharge, and transportation were important human factors affecting the accumulation of Pb in the soil. Lastly, the discharge of livestock manure, human industrial production, and mining and processing of minerals were important manmade factors affecting the accumulation of Cr in the soil.
The results of Spearman correlation analysis and principal component analysis showed that the sources of As, Pb, and Cr were the same, which was also verified by the random forest model. Their common artificial sources were industrial enterprises and breeding areas, which can also be seen in the spatial distribution map, whereby proximity to human activities resulted in higher contents of As, Pb, and Cr. Previous studies showed that Pb is discharged into the environment along with the exhaust gas of vehicles that burn leaded gasoline, while the loss of parts during transportation causes Pb to pollute nearby soil along with dust in the air; therefore, Pb enrichment occurs in the soil on both sides of a road with high traffic [35]. According to a previous study, industrial production and processing, mining, smelting and transportation in mining areas, and livestock manure from farms can cause the enrichment of As and Cr [36].

5. Conclusions

In this study, we conducted sampling tests on the topsoil of cultivated land and used multivariate statistical analysis, PCA, GIS analysis, and RFA to determine the driving force of human factors on the spatial distribution of potentially toxic elements in soil.
The enrichment of unnatural potentially toxic elements may have a pollution effect on crop growth and human health. It is important to realize that measures involving the source and its governance can influence the level of these elements. On the one hand, we should implement appropriate measures and policies from the perspective of industrial activities. Factories with serious pollution should stop production for rectification and relocation and improve their pollution treatment technology. On the other hand, we also need to focus on traffic road planning, with the aim of keeping main roads away from high-standard farmland and introducing advanced automobile exhaust treatment technologies, along with a strict implementation of emission standards for motor vehicles. Furthermore, we suggest that the relevant departments plant more trees on both sides of roads with other protective approaches to reduce the influence of the accumulation of potentially toxic elements from exhaust emissions during transportation on the surrounding agricultural land [37].

Author Contributions

Conceptualized and designed the research, H.H. and Y.Z.; responsible for software, Y.L.; tested the content of potentially toxic elements in soil, K.L., M.L., Y.T., and L.X.; discussed the results, F.W. All authors have read and agreed to the published version of the manuscript.

Funding

This research was funded as part of the “Classification project of soil environmental quality of cultivated land in Xiangzhou”.

Acknowledgments

The authors are especially grateful to the Xiangzhou government for providing data.

Conflicts of Interest

The authors declare no conflict of interest.

References

  1. Romic, M.; Romic, D. Heavy metals distribution in agricultural topsoils in urban area. Environ. Geol. 2003, 43, 795–805. [Google Scholar] [CrossRef]
  2. Burges, A.; Epelde, L.; Garbisu, C. Impact of repeated single-metal and multimetal pollution events on soil quality. Chemosphere 2015, 120, 8–15. [Google Scholar] [CrossRef] [PubMed]
  3. Li, Z.; Ma, Z.; van der Kuijp, T.J.; Yuan, Z.; Huang, L. A review of soil heavy metal pollution from mines in China: Pollution and health risk assessment. Sci. Total Environ. 2014, 468, 843–853. [Google Scholar] [CrossRef] [PubMed]
  4. Facchinelli, A.; Sacchi, E.; Mallen, L. Multivariate statistical and GIS-based approach to identify heavy metal sources in soils. Environ. Pollut. 2001, 114, 313–324. [Google Scholar] [CrossRef]
  5. Jiang, Y.; Chao, S.; Liu, J.; Yang, Y.; Chen, Y.; Zhang, A.; Cao, H. Source apportionment and health risk assessment of heavy metals in soil for a township in Jiangsu Province, China. Chemosphere 2017, 168, 1658–1668. [Google Scholar] [CrossRef] [PubMed]
  6. Hou, D.; Al-Tabbaa, A. Sustainability: A new imperative in contaminated land remediation. Environ. Sci. Policy 2014, 39, 25–34. [Google Scholar] [CrossRef]
  7. Muyessar, T.; Jilili, A.; Jiang, F.Q. Distribution characteristics of soil heavy metal content in northern slope of Tianshan Mountains and its source explanation. Chin. J. EcoAgric. 2013, 21, 883–890, (In Chinese with English Abstract). [Google Scholar] [CrossRef]
  8. Zuzolo, D.; Cicchella, D.; Lima, A.; Guagliardi, I.; Cerino, P.; Pizzolante, A.; Thiombane, M.; de Vivo, B.; Albanese, S. Potentially toxic elements in soils of Campania region (Southern Italy): Combining raw and compositional data. J. Geochem. Explor. 2020, 213, 106524. [Google Scholar] [CrossRef]
  9. Zhang, X.M.; Zhang, X.Y.; Zhong, T.Y.; Jiang, H. Spatial distribution and accumulation of heavy metal in arable land soil of China. Environ. Sci. 2014, 35, 692–703. [Google Scholar]
  10. Li, C.F.; Cao, J.F.; Lü, J.S.; Yao, L.; Wu, Q.Y. Ecological risk assessment of soil heavy metals for different types of land use and evaluation of human health. Environ. Sci. 2018, 39, 5628–5638. [Google Scholar]
  11. Thiombane, M.; Zuzolo, D.; Cicchella, D.; Albanese, S.; Lima, A.; Cavaliere, M.; de Vivo, B. Soil geochemical follow-up in the Cilento World Heritage Park (Campania, Italy) through exploratory compositional data analysis and C-A fractal model. J. Geochem. Explor. 2018, 189, 85–99. [Google Scholar] [CrossRef]
  12. Tepanosyan, G.; Sahakyan, L.; Maghakyan, N.; Saghatelyan, A. Combination of compositional data analysis and machine learning approaches to identify sources and geochemical associations of potentially toxic elements in soil and assess the associated human health risk in a mining city. Environ. Pollut. 2020, 261, 114210. [Google Scholar] [CrossRef] [PubMed]
  13. Yang, Y.; Christakos, G.; Guo, M.; Xiao, L.; Huang, W. Space-time quantitative source apportionment of soil heavy metal concentration increments. Environ. Pollut. 2017, 223, 560–566. [Google Scholar] [CrossRef] [PubMed]
  14. Yang, Q.; Li, Z.; Lu, X.; Duan, Q.; Huang, L.; Bi, J. A review of soil heavy metal pollution from industrial and agricultural regions in China: Pollution and risk assessment. Sci. Total Environ. 2018, 642, 690–700. [Google Scholar] [CrossRef]
  15. Ke, X.; Gui, S.; Huang, H.; Zhang, H.; Wang, C.; Guo, W. Ecological risk assessment and source identification for heavy metals in surface sediment from the Liaohe River protected area, China. Chemosphere 2017, 175, 473–481. [Google Scholar] [CrossRef]
  16. Nanos, N.; Martín, J.A.R. Multiscale analysis of heavy metal contents in soils: Spatial variability in the Duero river basin (Spain). Geoderma 2012, 189, 554–562. [Google Scholar] [CrossRef]
  17. Hou, D.; Li, F. Complexities surrounding China’s soil action plan. Land Degrad. Dev. 2017, 28, 2315–2320. [Google Scholar] [CrossRef] [Green Version]
  18. Jin, Y.; O’Connor, D.; Ok, Y.S.; Tsang, D.C.; Liu, A.; Hou, D. Assessment of sources of heavy metals in soil and dust at children’s playgrounds in Beijing using GIS and multivariate statistical analysis. Environ. Int. 2019, 124, 320–328. [Google Scholar] [CrossRef]
  19. Wu, S.; Peng, S.; Zhang, X.; Wu, D.; Luo, W.; Zhang, T.; Zhou, S.; Yang, G.; Wan, H.; Wu, L. Levels and health risk assessments of heavy metals in urban soils in Dongguan, China. J. Geochem. Explor. 2015, 148, 71–78. [Google Scholar] [CrossRef]
  20. Chen, T.-B.; Zheng, Y.-M.; Lei, M.; Huang, Z.-C.; Wu, H.-T.; Chen, H.I.; Fan, K.-K.; Yu, K.; Wu, X.; Tian, Q.-Z. Assessment of heavy metal pollution in surface soils of urban parks in Beijing, China. Chemosphere 2005, 60, 542–551. [Google Scholar] [CrossRef]
  21. Alloway, B.J. Sources of heavy metals and metalloids in soils. In Heavy Metals in Soils; Springer: Dordrecht, The Netherlands, 2013; pp. 11–50. [Google Scholar]
  22. Zhao, B.; O’Connor, D.; Zhang, J.; Peng, T.; Shen, Z.; Tsang, D.C.W.; Hou, D. Effect of pyrolysis temperature, heating rate, and residence time on rapeseed stem derived biochar. J. Clean. Prod. 2018, 174, 977–987. [Google Scholar] [CrossRef]
  23. Josse, J.; Husson, F. Selecting the number of components in principal component analysis using cross-validation approximations. Comput. Stat. Data Anal. 2012, 56, 1869–1879. [Google Scholar] [CrossRef]
  24. Micó, C.; Recatalá, L.; Peris, M.; Sánchez, J. Assessing heavy metal sources in agricultural soils of an European Mediterranean area by multivariate analysis. Chemosphere 2006, 65, 863–872. [Google Scholar] [CrossRef]
  25. Breiman, L. Random forests. Mach. Learn. 2001, 45, 5–32. [Google Scholar] [CrossRef] [Green Version]
  26. CNEMC (China National Environmental Monitoring Centre). The Backgrounds of Soil Environment in China; China Environmental Science Press: Beijing, China, 1990. [Google Scholar]
  27. Loska, K.; Wiechula, D.; Korus, I. Metal contamination of farming soils affected by industry. Environ. Int. 2004, 30, 159–165. [Google Scholar] [CrossRef]
  28. Sutherland, R.A. Bed sediment-associated trace metals in an urban stream, Oahu. Hawaii Environ. Geol. 2000, 39, 611–627. [Google Scholar] [CrossRef]
  29. Walraven, N.; van Os, B.J.; Klaver, G.T.; Middelburg, J.J.; Davies, G.R. The lead (Pb) isotope signature, behaviour and fate of traffic-related lead pollution in roadside soils in The Netherlands. Sci. Total Environ. 2014, 472, 888. [Google Scholar] [CrossRef] [PubMed]
  30. Yang, Z.; Lu, W.; Long, Y.; Bao, X.; Yang, Q. Assessment of heavy metals contamination in urban topsoil from Changchun City, China. J. Geochem. Explor. 2011, 108, 27–38. [Google Scholar] [CrossRef]
  31. Kadi, M.W. Soil pollution hazardous to environment: A case study on the chemical composition and correlation to automobile traffic of the roadside soil of Jeddah city, Saudi Arabia. J. Hazard. Mater. 2009, 168, 1280–1283. [Google Scholar] [CrossRef]
  32. Yin, R.S.; Feng, X.B.; Wang, J.X. Mercury isotope variations between bioavailable mercury fractions and total mercury in mercury contaminated soil in Wanshan mercury mine, SW China. J. Chem. Geol. 2013, 336, 80–86. [Google Scholar] [CrossRef]
  33. Sathish, R.; Amuthan, A. Preparation, chemical analysis and sub-acute toxicity evaluation of linga pathangam (a mercury based Siddha herbo-metallic drug) in rats. Int. J. Pharm. Pharm. Sci. 2014, 6, 5. [Google Scholar]
  34. Mukherjee, A.B.; Zevenhoven, R.; Brodersen, J. Mercury in waste in the European Union: Sources, disposal methods and risks. Resour. Conserv. Recycl. 2004, 42, 155–182. [Google Scholar] [CrossRef] [Green Version]
  35. Oves, M.; Khan, M.S.; Zaidi, A.; Ahmad, E. Soil contamination, nutritive value, and human health risk assessment of heavy metals: An overview. Toxic. Heavy Met. Leg. Biorem. 2012, 1, 1–28. [Google Scholar]
  36. Deng, W.B.; Li, X.X.; An, Z.S.; Yang, L.; Hou, K.; Zhang, Y. Identification of sources of metal in the agricultural soils of the Guanzhong Plain, northwest China. Environ. Toxicol. Chem. 2017, 36, 1510–1516. [Google Scholar] [CrossRef] [PubMed]
  37. Arao, T.; Ishikawa, S.; Murakami, M.; Abe, K.; Maejima, Y.; Makino, T. Heavy metal contamination of agricultural soil and countermeasures in Japan. Paddy Water Environ. 2010, 8, 247–257. [Google Scholar] [CrossRef]
Figure 1. Soil sampling locations in Xiangzhou.
Sustainability 12 08538 g001
Figure 2. Analytical framework of the impact of human activities on potentially toxic elements.
Sustainability 12 08538 g002
Figure 3. PCA result of concentrations of potentially toxic elements in soil.
Sustainability 12 08538 g003
Figure 4. Spatial distribution of potentially toxic elements in the study area. (a) Spatial distribution of Cd; (b) Spatial distribution of Hg; (c) Spatial distribution of As; (d) Spatial distribution of Pb; (e) Spatial distribution of Cr.
Sustainability 12 08538 g004aSustainability 12 08538 g004b
Figure 5. Human activities in the study area. (a) Spatial distribution of road; (b) Spatial distribution of water system; (c) Spatial distribution of mining area; (d) Spatial distribution of factories and enterprises; (e) Spatial distribution of construction land; (f) Spatial distribution of livestock farm.
Sustainability 12 08538 g005aSustainability 12 08538 g005b
Figure 6. Plots of the variable importance measures (% increase in MSE) in Xiangzhou. (a) Results of the MSE in Cd; (b) Results of the MSE in Hg; (c) Results of the MSE in As; (d) Results of the MSE in Pb; (e) Results of the MSE in Cr.
Sustainability 12 08538 g006
Table 1. Summary statistics of concentrations of potentially toxic elements in soil at 975 points in Xiangzhou. CV, coefficient of variation.
ElementMinimum (mg/kg)Maximum (mg/kg)Mean
(mg/kg)
SD
(mg/kg)
CV
(%)
Background Value
Cd0.050.360.140.030.210.17
Hg0.021.560.050.081.540.08
As5.7621.5012.622.700.2112.30
Pb19.6047.5029.063.910.1326.70
Cr51.60103.0078.419.730.1286.00
Table 2. Correlation analysis of concentrations of potentially toxic elements in arable land in Xiangzhou.
ElementCdHgAsPbCr
Cd1
Hg0.276 **1
As−0.009−0.089 **1
Pb0.288 **0.114 **0.678 **1
Cr0.016−0.267 **0.572 **0.465 **1
** p < 0.01; ** significantly correlated at the 0.01 level (bilateral).
Table 3. Results of principal component analysis (PCA). PC, principal component.
MetalsFactor Load (Orthogonal Rotation)
PC1PC2PC3
Cd0.0280.9790.002
Hg0.0130.0090.995
As0.898−0.027−0.017
Pb0.7870.3630.163
Cr0.815−0.068−0.050
% Variance contribution rate43.0221.6719.43
% Cumulative contribution rate43.0264.6984.12
Table 4. Results of the variable importance measures (% increase in mean squared error (MSE)) in Xiangzhou.
% Increase in MSECdHgAsPbCr
Dist. Construction land20.838.0226.7124.2337.54
Dist. Livestock farm19.0414.4332.8831.4649.38
Dist. Factories and enterprises20.1112.0347.2240.8348.23
Dist. Mining area23.7813.6443.9322.6145.11
Dist. Water system20.718.1028.3328.7439.82
Dist. Road19.999.4234.6330.5334.65
Publisher’s Note: MDPI stays neutral with regard to jurisdictional claims in published maps and institutional affiliations.

