3.1. Data
The available experimental data, extracted from commercial FCD, concern routes of commercial vehicles travelling inside the study area. The available FCD dataset has been used to obtain trips of commercial vehicles. The number of monitored vehicles (944) is about 2% (penetration rate) of the vehicles travelling inside the province of Reggio Calabria. In the province, with respect to the total registered vehicles at the provincial level in 2019 [
10], the percentage of freight vehicles was 11.5%.
The available commercial FCD cannot be used directly to analyse routes and paths. It is necessary to process rough FCD by applying a sequence of temporal and spatial filtering criteria in order to obtain a set of observed routes of commercial vehicles.
Regarding temporal criteria, the first temporal selection concerns the period of the year. The available FCD dataset spans 2 summer weeks and contains 289,489 spatial–temporal vehicle positions, grouped in elementary trips and defined as a succession of consecutive spatial positions of the same vehicle from the time instant in which the movement begins (start) to the time instant in which the movement stops (stop).
The observed data refer to a period before the COVID-19 lockdown. Whether the freight distribution behaviour according to the criteria adopted (that is one of the points analysed in this paper) changes or not in relation to the lockdown period will be investigated in further studies.
By applying the above filtering criterion, the number of elementary trips that cross the province of Reggio Calabria was 14,278, operated by 412 monitored vehicles and counted only once (
Table 1).
The second temporal selection criterion is finalized to identify the paths of each vehicle as defined in
Section 1. Paths of a single vehicle are obtained from elementary trips. Two successive elementary trips (that is, when the last spatial position of the first trip and the initial one of the second trip are coincident) belong to the same path according to the first (lower) temporal threshold (limit LAG1).
The temporal spacing is measured as the difference between the “start” instant of the second trip and the “stop” instant of the first one. According to a previous work [
12], the value of the limit LAG1 is assumed to be equal to 5 min. By applying this selection criterion, the number of paths is 11,289.
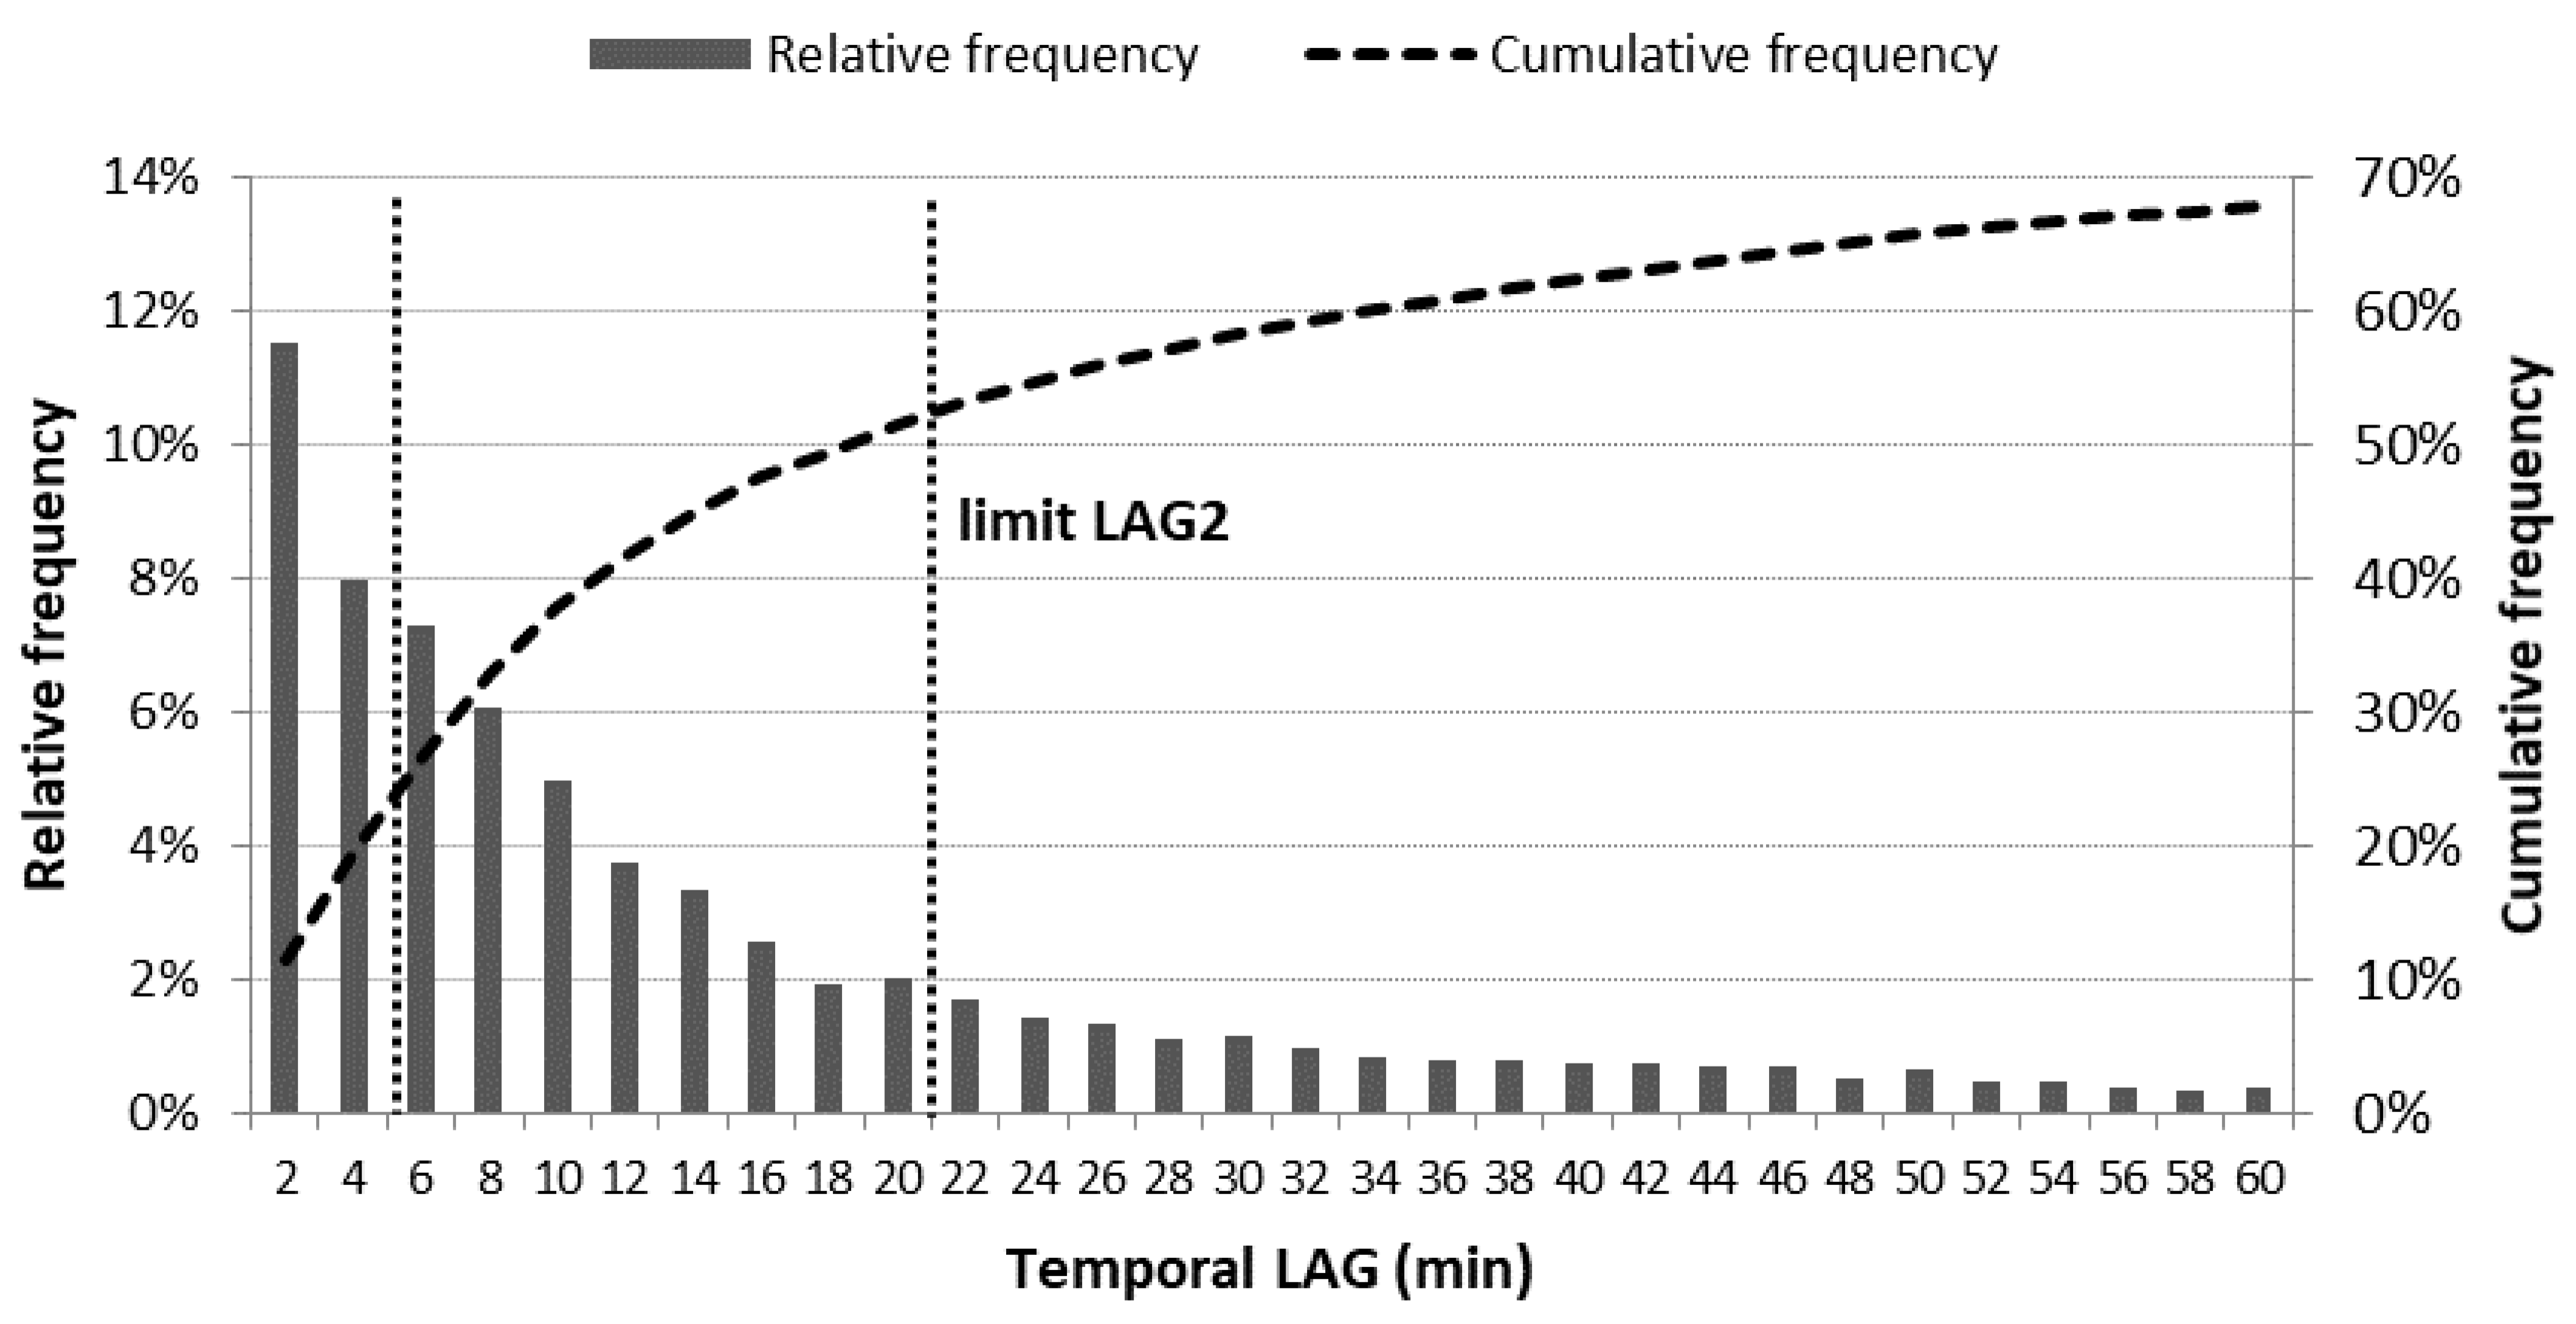
The third temporal selection criterion aims to identify the freight pickup and delivery points. In this case, two consecutive paths are compared, with the destination point of the first path coincident with the origin point of the second one. Two consecutive paths belong to the same route, as defined in
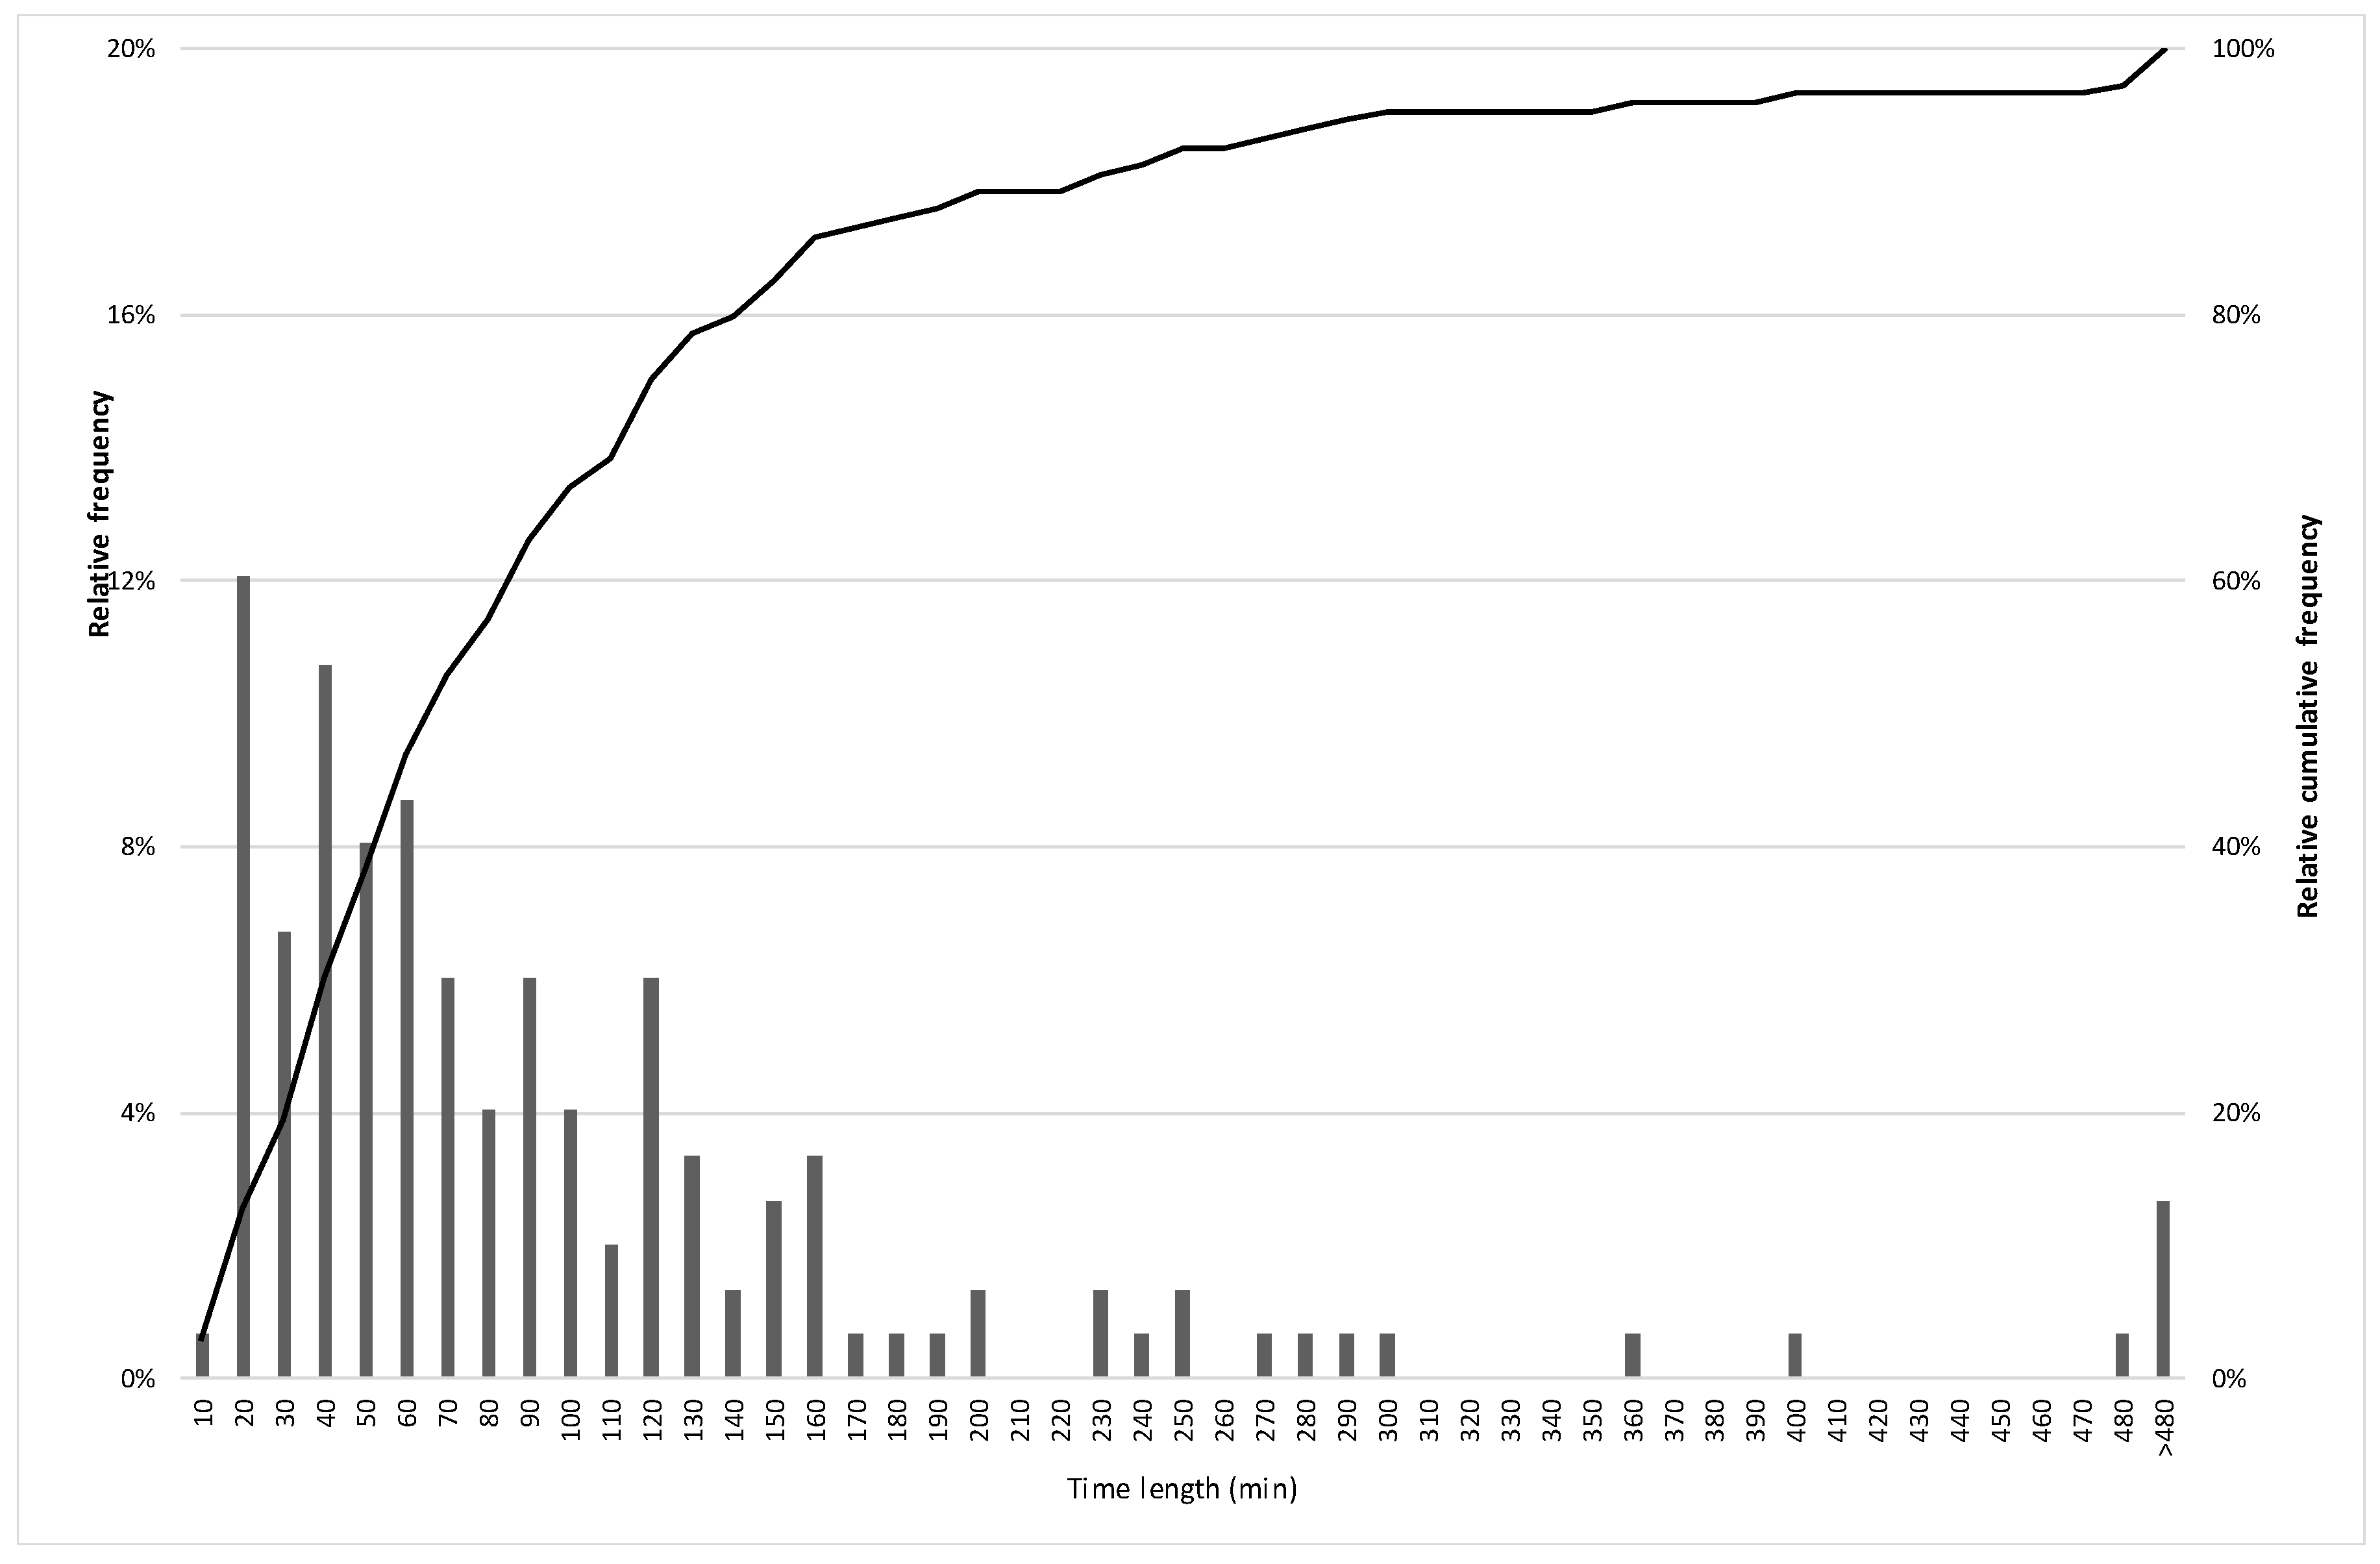
Section 1, if the time spacing is lower than a threshold value. In order to obtain this threshold value, the frequencies of temporal gaps have been plotted (
Figure 3). The results of the frequency analysis lead to the identification of an upper limit LAG2, which separates the individual paths of commercial vehicles from the paths composing a route. The value of limit LAG2 is equal to 20 min in this case.
Furthermore, the Limit LAG1 value allows the classification of the trajectories: isolated trips (path) and trip chains (route).
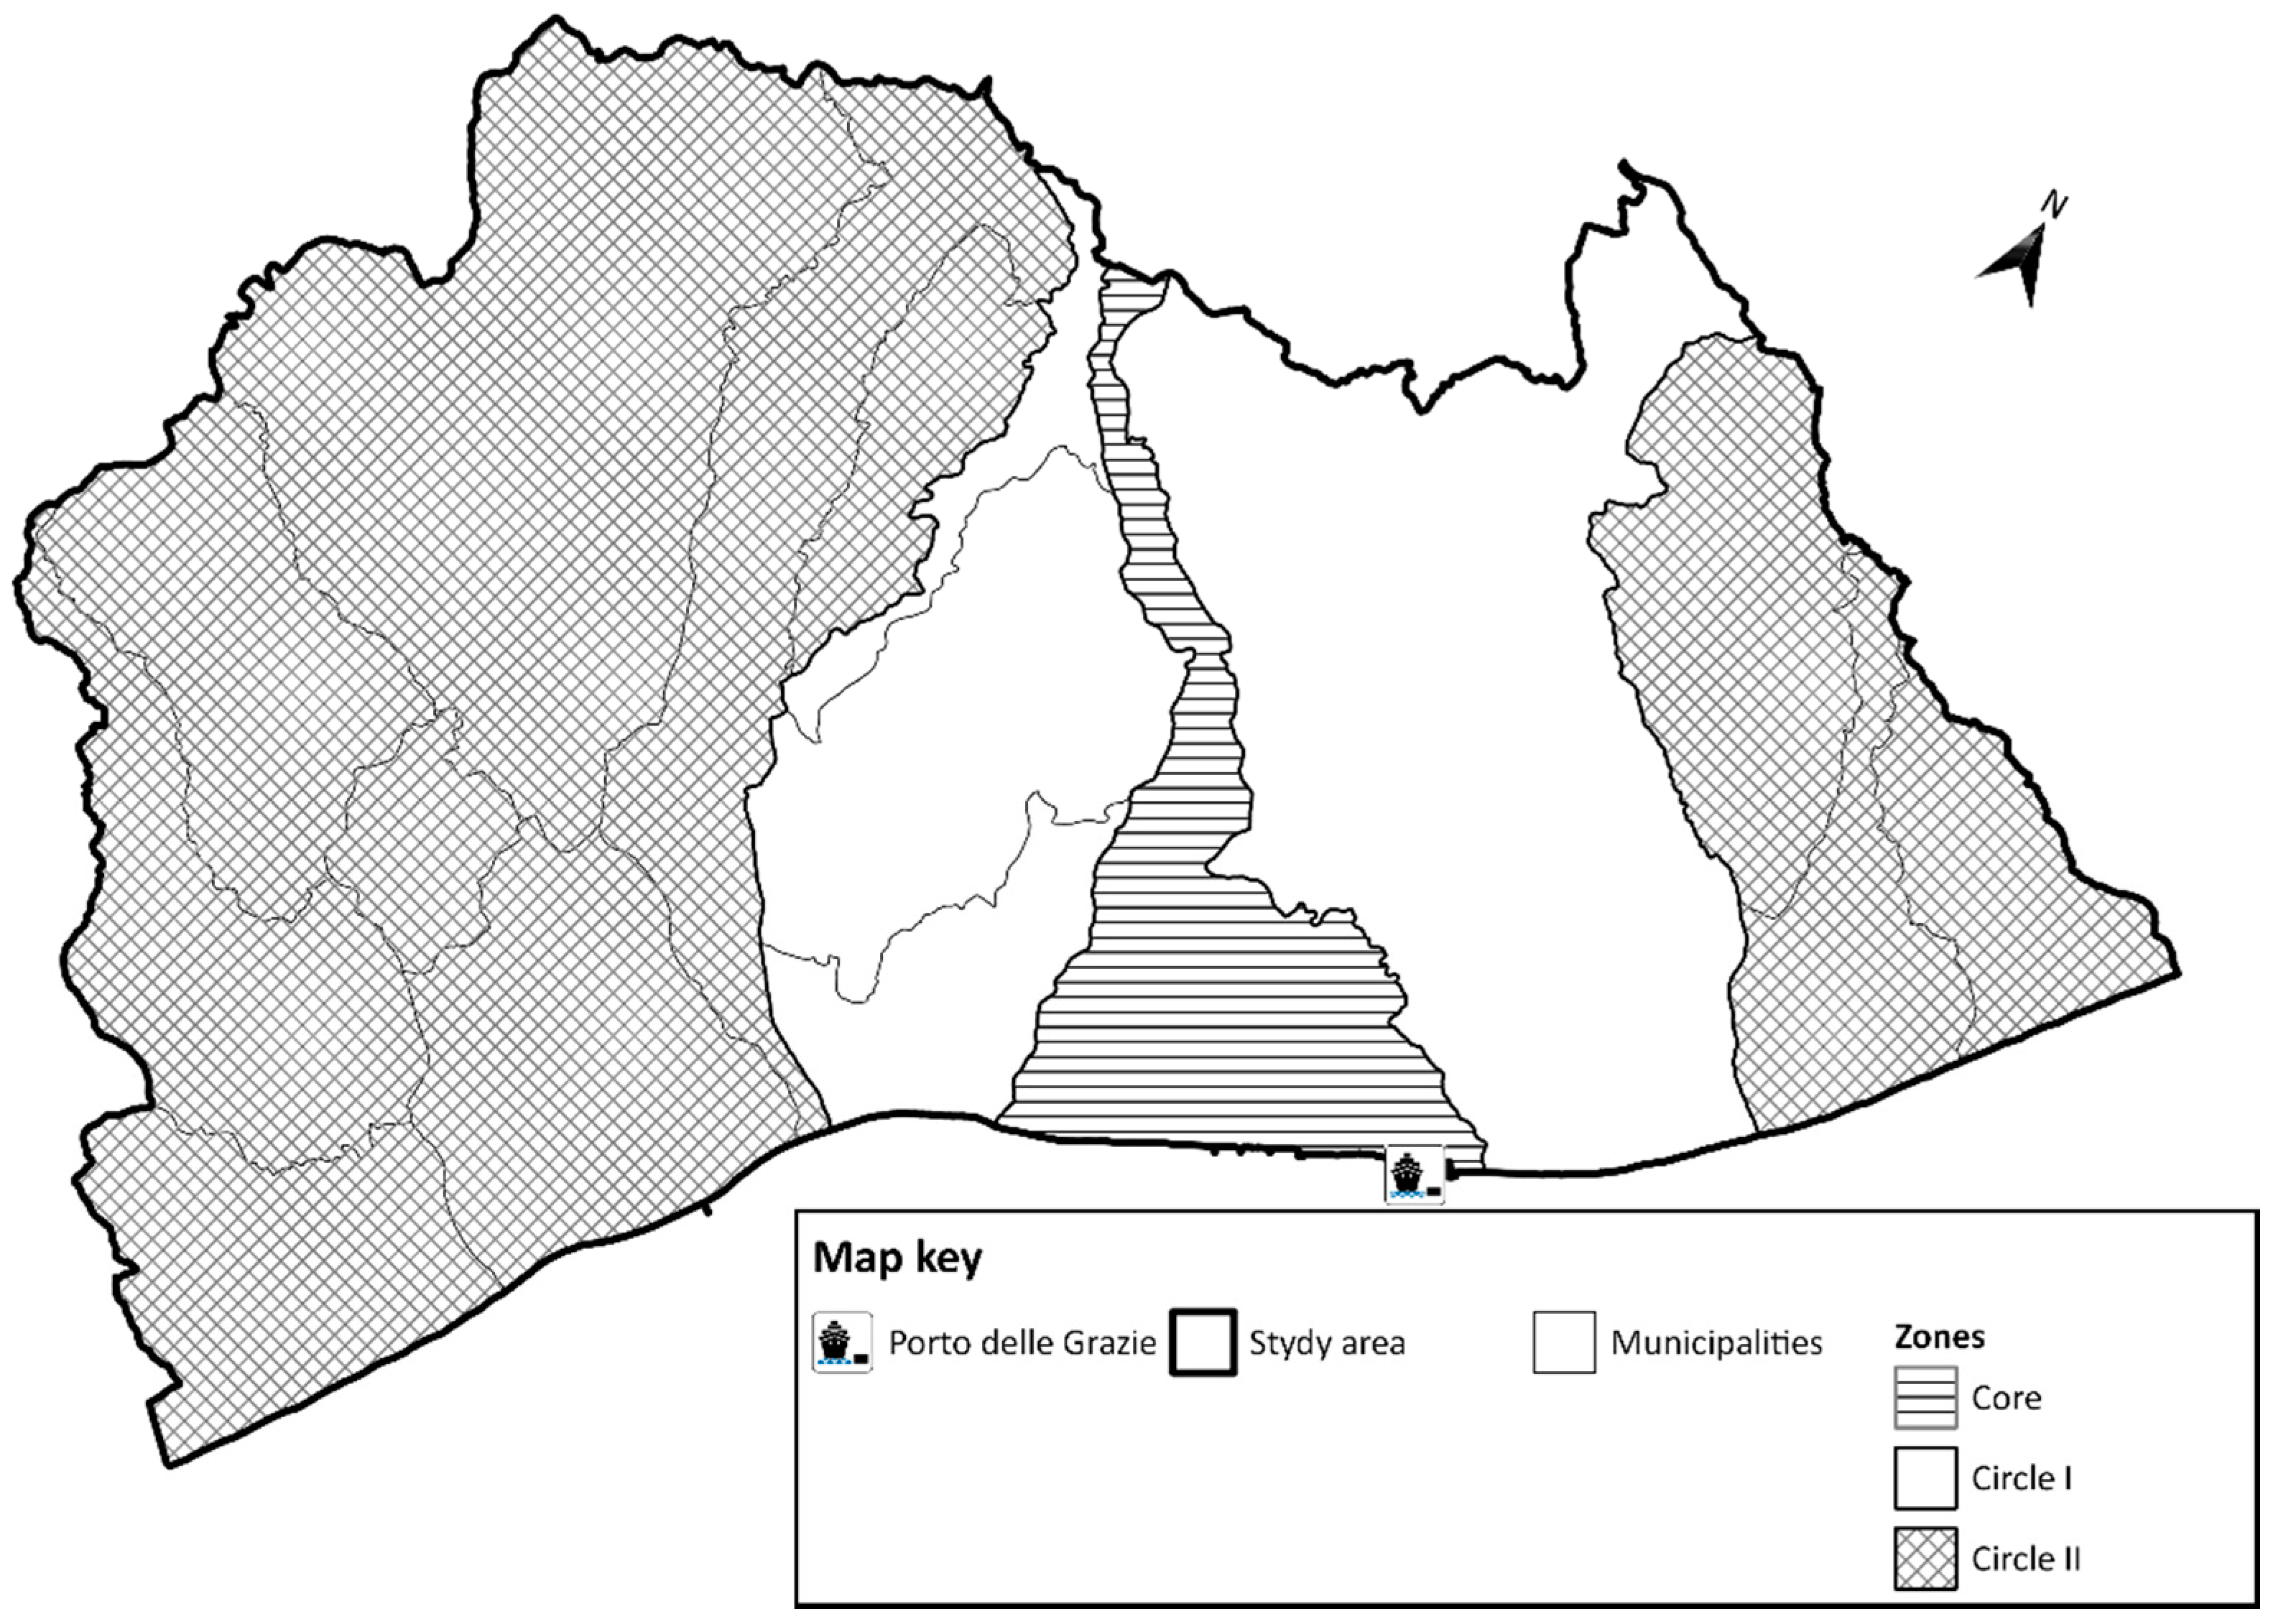
Based on spatial criteria, from total points and the relative trajectories registered in relation to vehicle movements, trajectories are classified into:
external trajectories, selecting vehicle movements that have no point in the study area;
study area trajectories, which have at least one point inside the study area.
By considering study area trajectories, it is possible to identify:
internal trajectories with both origin and destinations inside the study area (I/I);
outcoming trajectories with origin inside the study area and destinations outside the study area (I/E);
incoming trajectories with origin outside the study area and destinations inside the study area (E/I);
crossing trajectories with origin and destinations outside the study area but with at least one point inside the area (E-E).
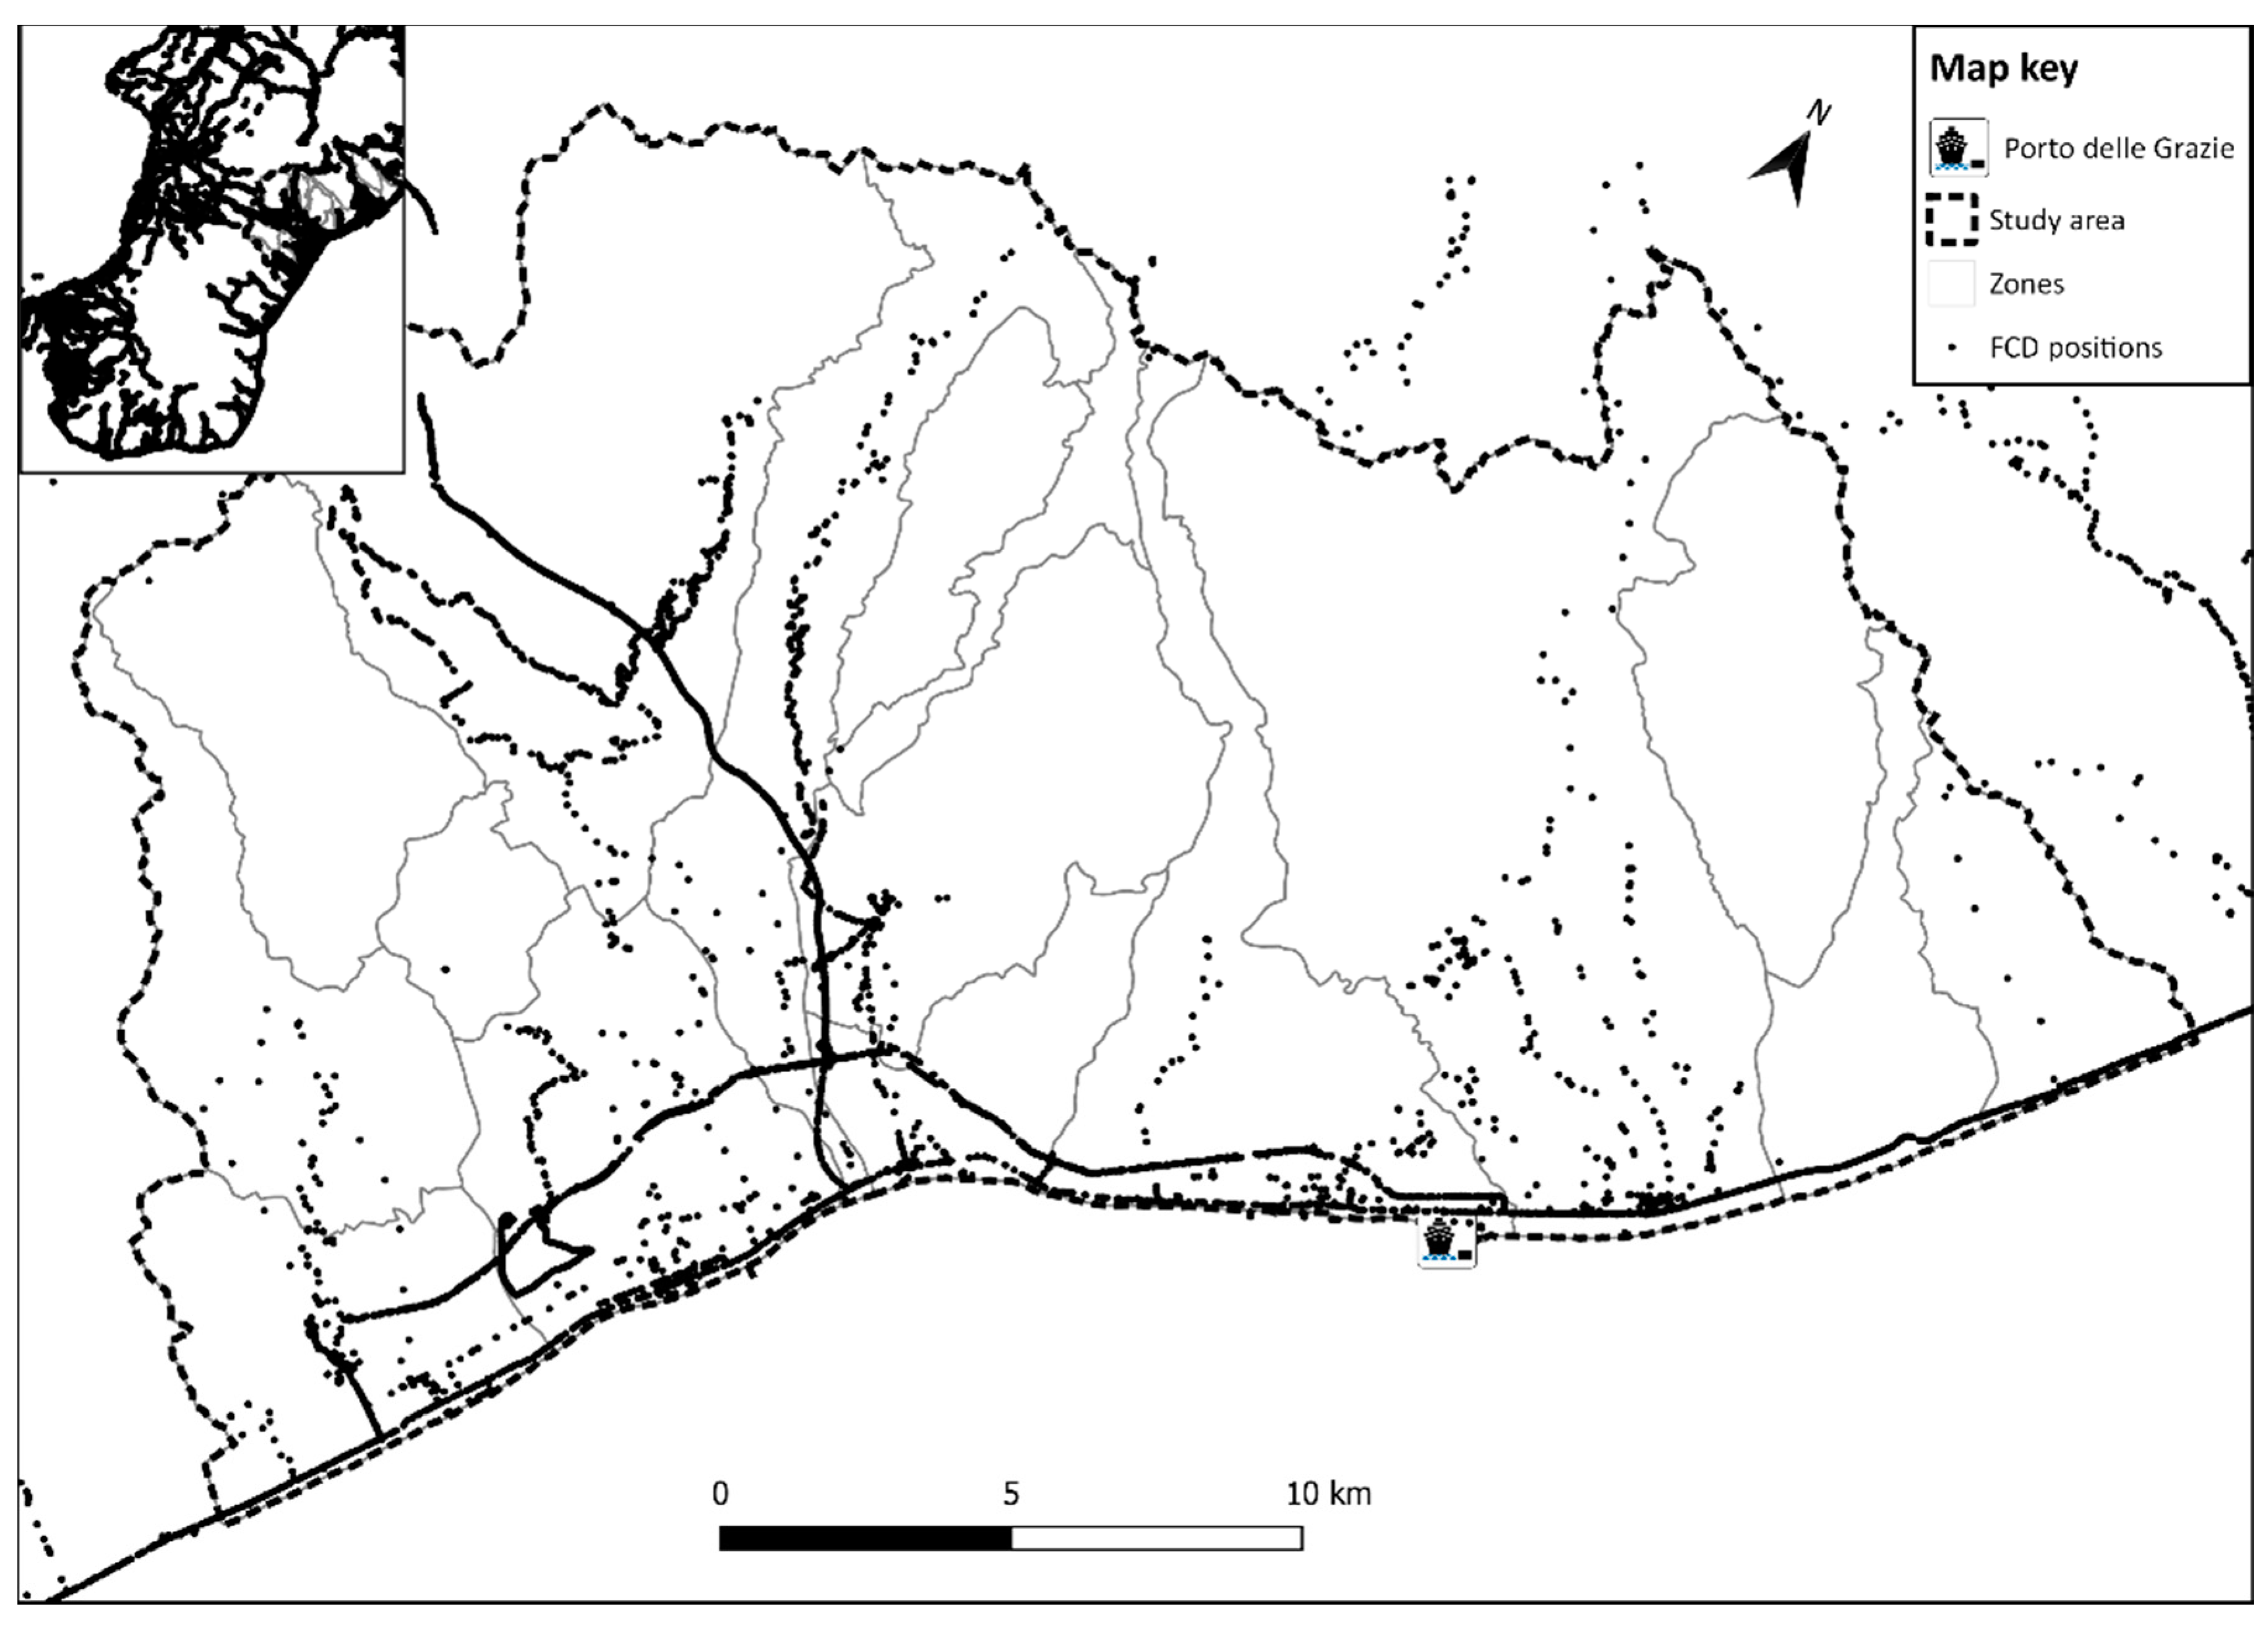
In the study case, 11,289 paths were identified (
Figure 4) starting from the original 289,489 total points related to 412 vehicles.
By applying spatial filtering, the total paths (11,289) are divided into 10,574 external paths without any point in the study area and 715 study area paths with at least one point in the study area. By selecting study area paths, there are 523 internal paths (I/I), 73 outcoming paths (E/I), 73 incoming paths (I/E), and 46 crossing paths. These numbers are specified for 2 selected summer weeks in
Table 2.
The total number of paths in the 2 summer weeks (715) was operated by 61 commercial vehicles, corresponding to approximately 6% of the total number of monitored commercial vehicles. By assuming limit LAG2 as threshold, the total number of routes analysed was equal to 407, which included 258 isolated paths and 149 routes.
Table 3 reports a synopsis of observed vehicles, paths, and routes.
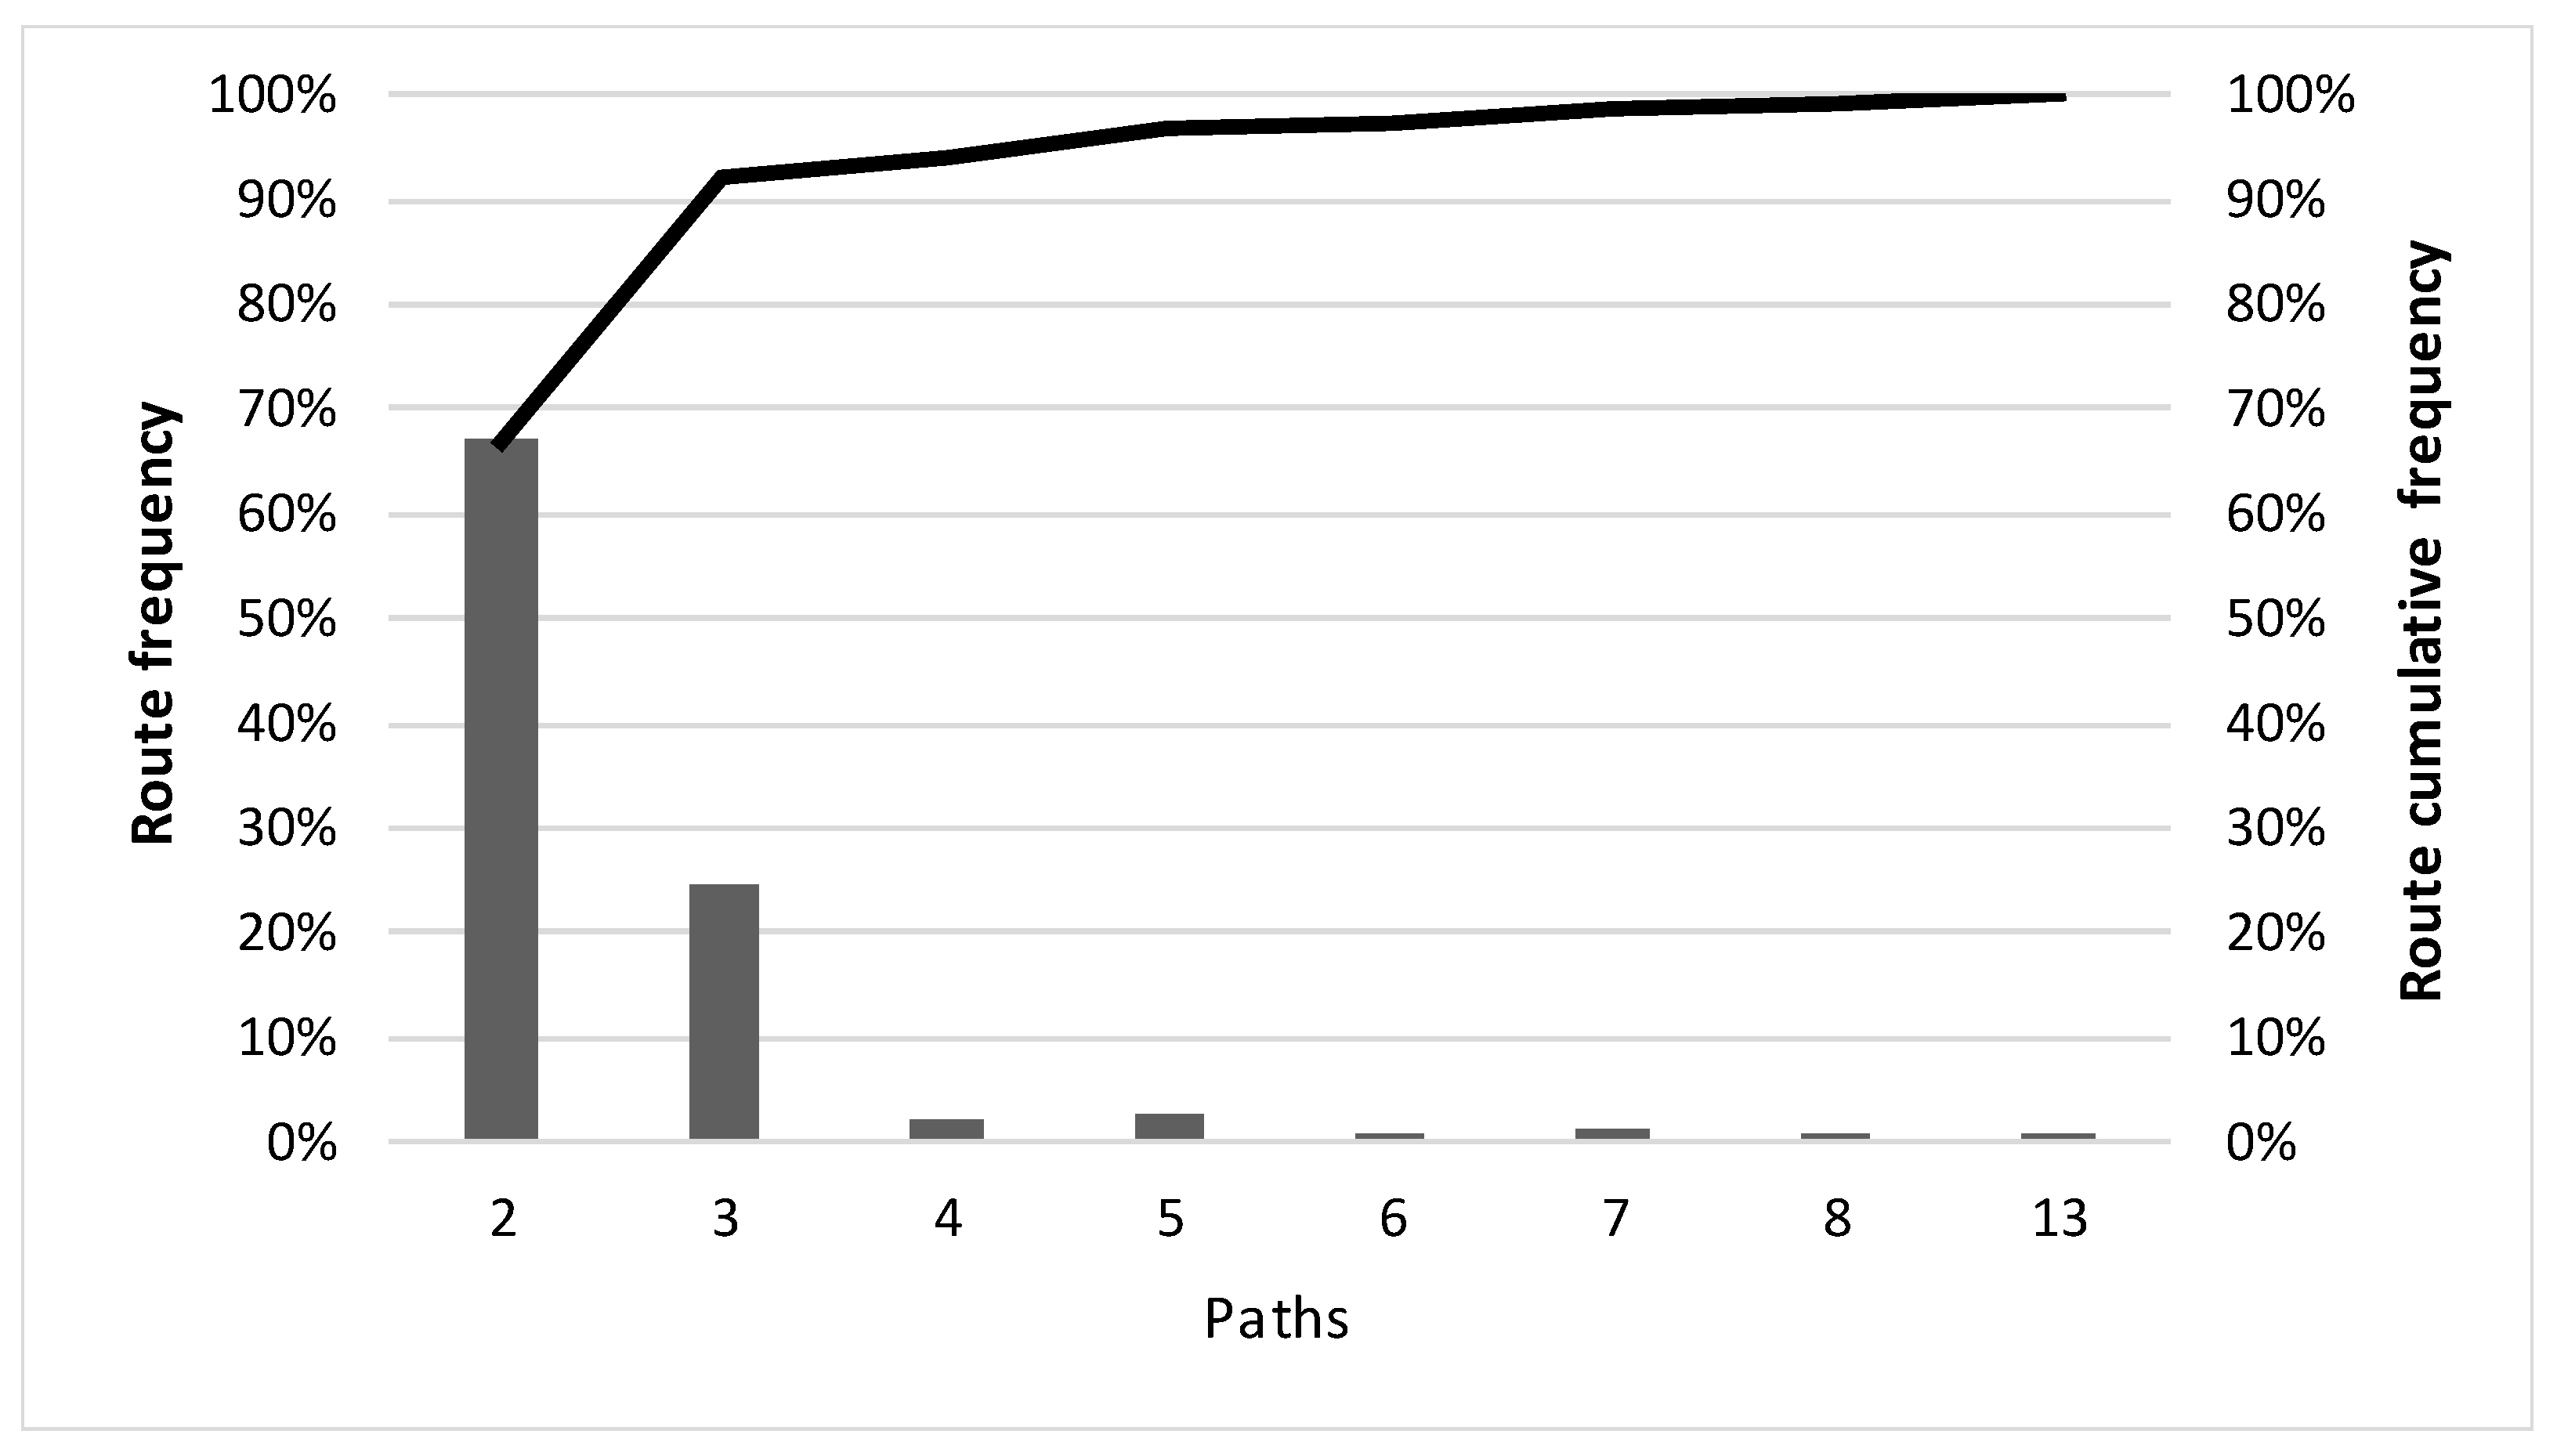
By examining the set of routes, a frequency analysis (
Figure 5) was carried out in order to identify the percentage distribution of the number of composing paths. It is worth noting that 137 routes (92% of the total routes) were made up by fewer than three paths. The remaining routes (12 routes, 8% of the total) were the object of the analysis presented in this paper, as they represented the freight pickup and delivery process. The selected routes included 73 paths, with an average total time of a route less than 70 min in 73% of the cases (
Figure 6).
3.2. Route and Path Choice
The results were obtained by means of a network model (graph and calibrated link cost functions) by estimating the performances of the road transport infrastructures in the study area.
The comparison was executed in terms of:
similarity of the sequences of nodes visited between observed routes and simulated/optimized routes: number and percentages of pairs related to four criteria: minimum travel time, travel distance, travel cost, and energy consumption;
similarity of the paths composing the routes between observed routes and optimized routes: number and percentage of paths related to the four criteria;
coverage of the criteria of the observed routes and paths.
3.2.1. Route Choice
Table 4 reports the main characteristics of the sample of routes obtained from the elaboration of the FCD. An ID code identifies each route. The characteristics are the number of paths composing each route, the time spent at the stop, and the total travel times. The sample comprehended 12 routes and 73 paths, 6.1 paths on average; the average time spent at the stops was 55 min; and the average travel time was 73 min.
The same table reports a comparison of the observed (FCD) simulated and optimised routes. The following information is reported for each route:
time, distance, and energy attributes of chosen routes estimated by means of transport system models (network model);
time, distance, and energy attributes of optimized routes adopting each selected criterion (time, distance, and energy of best routes).
Figure 7 reports a graphical representation of three routes of the sample (IDs 40, 56, and 81). Each route is represented in terms of origin point, sequence of travelled road infrastructure, intermediate stops, and final destination point.
From available information, two analyses of similarity of observed and optimized routes were performed. The first analysis compared the order of the visited nodes by considering the number of connected pairs (
Table 5). The second analysis compared the order of the visited nodes by considering the percentage with respect to the considered criteria (
Table 5). Both analyses took into account the route direction, which could be the same when the order of visit was the same or the opposite when the order of visit was inverted. The same analysis was performed by not considering the direction (all directions). These differentiations were considered in order to verify whether direction can influence the choices’ criterion.
Some evidence emerges from the analysis of the experimental results.
From the results of the first analysis (
Table 6) emerged that no criterion prevailed over the others. The “time” criterion prevailed over the others only in route 40. The observed route had the same characteristics as the optimized route with respect to “Time” criterion. This did not happen in most of the cases analysed. In fact, the average percentages calculated for each criterion were between 40% and 54%.
The observed choices were coincident with the optimized ones with respect to all three criteria (time, distance, and energy) only in routes 79 and 85. Furthermore, the results do not show an explicit relationship between the choice criteria and the spatial extension of the routes. Both in routes with a limited number of paths (short routes) and in those with a higher number of paths (long routes), it was not possible to univocally identify a dominant choice criterion. However, the “time” criterion was the most frequently chosen one. Regardless of the direction (both directions) and the type of choice criterion (all criteria), the optimized routes coincided with the observed ones in 71% of the examined cases. The percentage calculation was made considering the time attribute, regardless of the optimization criterion.
A further comparison was made by calculating the percentage of similarity with respect to the attributes associated with each selection criterion.
Even in the second analysis (
Table 5), the results show that, in general, there was no prevalent criterion for route choice. The average percentages, calculated for each criterion, were between 40% and 48%. Also, the “time” criterion was the most frequent criterion, and it was dominant on the other ones in route 40. The observed choices coincided with the optimized ones, considering all three criteria (time, distance, and energy) in routes 79 and 85. If the direction of the node succession was neglected, the optimization covered at most 57% of the choices observed.
3.2.2. Path Choice
Further similarity analyses were carried out to compare the observed paths and the optimized paths. The calculation methods used to generate optimized paths refer to the PCP, as described in
Section 2.2. Each obtained path was the result to a two-level decisional process (generation and choice). The selection criteria adopted for each origin–destination pair (or pickup/delivery of freight) were:
the minimum travel time (Time1), the minimum travelled distance (Distance1), and the minimum energy consumed (Energy1);
the minimum among the above attributes (Time2, Distance2, Energy2) calculated with the k-shortest paths method.
The 73 observed paths were compared with the paths generated by the
k-shortest path [
25] algorithms, assuming
k = 2 and adopting the selected criteria. The comparison concerned the measured attributes for each generated and observed path (time, distance, and energy). By comparing the attributes, it was possible to measure the similarity between the generated paths and the observed paths chosen by the transport users in terms of values of the three attributes. The similarity was therefore measured with the number and percentage of routes with the same values of attributes.
Table 7 reports, for each optimization criterion, the number and percentage of generated paths whose values of attributes coincided with those of the observed paths. It is worth noting that the Energy1, Distance1, and Time1 criteria, when considered individually, did not exceed the value of 78% of similarity.
In particular, the number of routes generated with the Energy1 optimization criterion with the same values of attributes of the observed routes was 57. If compared with the 73 total chosen routes, the routes generated with the Energy1 criterion were the majority of the analysed routes (78%). The Distance1 criterion also covered a large subset of observed routes (55%, or 75% of the chosen routes). However, these paths were included among those generated by adopting the Energy1 criterion. By adopting the Time1 criterion, the values of attributes of generated paths and observed ones were coincident 54 times. Among these, the number of routes not generated with the Energy1 criterion was only 4.
Using the values of the attributes and the similarity indicators, the coverage degree of the criteria was also assessed by calculating the values of the cumulative functions of the number and percentage of similar paths in terms of one or more criteria.
Table 8 shows the order of the optimization criteria based on the similarity percentage of the chosen routes. As previously noted, the Energy1 criterion covered 78% of the chosen routes. Considering the Energy1 and Time1 criteria, 61 selected routes were covered (i.e., 84% of the total routes). The remaining criteria, Energy2 and Distance2, covered a reduced percentage of the set of analysed routes, which, added to Energy1 and Time1, did not exceed 89%. It is worth noting that the increase in the cumulative percentage due to these last two criteria was limited (5%).
The remaining part of the sample of analysed routes included 8 routes generated with different criteria among the selected ones. This is a percentage that did not exceed 11% of the total analysed routes.


