Article

Preventing Patent Risks in Artificial Intelligence Industry for Sustainable Development: A Multi-Level Network Analysis

1
Center for Studies of Intellectual Property Rights, Zhongnan University of Economics and Law, Wuhan 430073, China
2
School of Management, Huazhong University of Science and Technology, Wuhan 430074, China
*
Author to whom correspondence should be addressed.
Sustainability 2020, 12(20), 8667; https://doi.org/10.3390/su12208667
Submission received: 26 September 2020 / Revised: 15 October 2020 / Accepted: 16 October 2020 / Published: 19 October 2020
(This article belongs to the Section Economic and Business Aspects of Sustainability)

Abstract

:
In recent years, assessing patent risks has attracted fast-growing attention from both researchers and practitioners in studies of technological innovation. Following the existing literature on risks and intellectual property (IP) risks, we define patent risks as the lack of understanding of the distribution of patents that lead to losing a key patent, increased research and development costs, and, potentially, infringement litigation. This paper aims to propose an explorative approach to investigating patent risks in the target technology field by integrating social network analysis and patent analysis. Compared to previous research, this study makes an important contribution toward identifying patent risks in the overall technological field by employing a patent-based multi-level network model that has not appeared in existing methodologies of patent risks. In order to verify the effectiveness of this approach, we take artificial intelligence (AI) as an example. Data collected from the Derwent Innovation Index (DII) database were used to build the patent-based multi-level network on patent risks from market, technology, and assignee perspectives. The results indicate that the lack of international collaborations among assignees and industry–university–research collaboration may lead to patent collaboration risks. Regarding patent market risks, the lack of overseas patent applications, especially the lack of distribution in the main competitive markets, is a key factor. As for patent technology risks, most of the leading assignees lack awareness of the distribution in the following technological fields: industrial electric equipment, engineering instrumentation, and automotive electrics. In summary, assignees from the U.S. with first mover advantages are still powerful leaders in the AI technology field. Although China is catching up very rapidly in the total number of AI patents, the apparent patent risks under the perspectives of collaboration, market, and technology will obviously hamper the catch-up efforts of China’s AI industry. We conclude that, in practice, the proposed patent-based multi-level network model not only plays an important role in helping stakeholders in the AI technological field to prevent patent risks, find new technology opportunities, and obtain sustainable development, but also has significance for guiding the industrial development of various emerging technology fields.

1. Introduction

In the knowledge-based economy era, risks in the technological innovation process have been attracting increasing attention worldwide. Advancements in technological innovation (TI) are no longer confined to the TI advancement of individual markets, technological fields, and assignees in a given technology field [1,2]. Many stakeholders have actively investigated whole TI networks and attempted to identify the central actors and prevent potential TI risks [3,4]. Based on probability theory, the concept of risk was first proposed by European scientist Pasco, and had been said to imply a calculus of probabilities and consequences of an unwanted event [5]. In recent years, most scholars defined risk from the theory of damage or the theory of uncertainty. Based on the theory of damage, Haynes regarded risk as the chance of damage or loss [6]. In 1901, Willett defined risk as the objectified uncertainty regarding the occurrence of an undesirable event [7]. Knight further distinguished between risk in the sense of a measurable probability and an uncertainty that cannot be measured, and defined risk as “measurable uncertainty” [8]. Considering the damage and uncertainty of risk, it is necessary to identify and prevent the risk before it results in possible damage. TI is an experimental procedure that covers uncertainty and unavoidable risks, especially intellectual property risks [9,10]. Patent information, which contains enormous and rich technical items, has been touted as one of the most important outputs of TI, and intellectual property risks have been identified [11,12]. Accordingly, the success of TI is closely related to the effective identification and prevention of patent risks.
In the era of knowledge-based economies, artificial intelligence (AI) plays a vital role in maintaining learning experiences as well as improving learning efficiency [13]. AI technology is commonly considered to be promising in a wide range of human welfare sectors, including transportation, home/service robotics, healthcare, education, low-resource communities, public safety and security, employment and the workplace, and entertainment [14]. Many countries have made substantial efforts and research and development (R&D) investments in AI technology. For instance, the U.S. government has attached great importance to top-level strategic design in the AI technology field. In 2016, the White House released two important reports, namely “Preparing for the Future of Artificial Intelligence” and “The National Artificial Intelligence Research and Development Strategic Plan” [15]. In February 2019, the “American AI Initiative” was launched, which is the nation’s strategy for promoting American leadership in AI. One year after the American AI Initiative, the White House Office of Science and Technology Policy released “American AI Initiative: Year One Annual Report”, which summarizes the progress of AI in the U.S. [16]. Japan has also focused on the formulation of an AI strategy and planning. In March 2017, the “Artificial Intelligence Technology Strategy” was released by the Strategic Council for AI Technology. This strategy provided a three-phase development plan for AI: (1) the utilization and application of data-driven AI developed in various domains, (2) the public use of AI and data developed across various domains by approximately 2020, and (3) the creation of ecosystems built by connecting complex application services by approximately 2025 to 2030 [17]. China’s government has also released sets of innovation policies related to AI technology. In July 2017, the State Council announced “A Next Generation Artificial Intelligence Development Plan”, the most comprehensive of all national AI strategies, which divided China’s AI goals into three “Strategic Objectives” and proposed the goal of having China become the world leader in AI by 2030 [18]. In the “Report on the Work of the Government (2019)”, it expanded Intelligent Plus initiatives to facilitate transformation and upgrading in manufacturing [19]. In June 2019, the National Governance Committee for the New Generation Artificial Intelligence issued principles of next-generation artificial intelligence (AI) governance, pledging to develop responsible AI in China. While there has already been much attention to promoting the development of AI technology, it would seem that making breakthroughs and gaining competitive advantages in this field will necessarily require a comprehensive understanding of the risks involved in the technological innovation process.
However, although patent information is widely regarded as the key to identify patent risks, the majority of previous studies focus on evaluating patent infringement risks, and they have failed to define the concept of patent risks. In this paper, we attempt to define patent risks as the lack of understanding of the distribution of patents that lead to losing a key patent, increased research and development costs, and, potentially, infringement litigation. Preventing patent risks is fundamental for assignees who own patents as well as stakeholders who make, use, or sell products containing patented technology. Moreover, few studies have explored patent risks from a more comprehensive perspective which integrates market-level, technology-level, and assignee-level patent data; even fewer studies have examined patent risks in the AI field from a comprehensive perspective. As a rapidly developing and emerging technological area, AI technology requires extensive attention to patent risks to foster more sustainable development outcomes and competitive advantages. Therefore, in order to better identify patent risks from patent information, it is of great importance to answer these two questions: (1) What are the existing main patent competitive markets, technological hotspots and fronts, and collaborative research patterns in AI technology? (2) What are the patent risks from the perspectives of collaboration, market, and technology? These concerns are critical for stakeholders to give valuable suggestions for future policy-making and obtain sustainable development in the field of AI technology globally.
To solve these concerns, we propose a comprehensive framework for identifying patent risks. A patent-based social network approach has been used to identify the “elite” of French cancer researchers in 1999, and explore the relationships in TI [20]. Patent information in the social network, which contains enormous and rich technical items, has more credibility and practicability. Therefore, based on social network analysis and patent analysis, this framework explores patent risks from comprehensive perspectives as well as multi-levels, and has more advantages than the previous social network. This paper specifically selects the AI technology field as a case study, and collects and analyzes ten thousand AI patents from 1998 to 2018. The examination of the network of AI patents has the following aims: to outline the possibilities of using a patent-based multi-level network approach for research into patent risks; to describe the market network, technology network, and collaboration network of AI technology and how they are structured; and to identify patent risks under the perspectives of collaboration, market, and technology. Our final motivation is the overarching interest in helping stakeholders in the AI technological field to prevent patent risks, find new technology opportunities, and obtain sustainable development.
The remainder of this paper is organized as follows. Section 2 presents the literature related to multi-level network analysis and patent risks. In Section 3, we introduce the research methodology and retrieval of patent information. The case study of patent risks in AI technology by employing a patent-based multi-level network is presented in Section 4, where the feasibility of our method is demonstrated. We conclude and discuss the main findings, policy recommendations, contributions, future research directions, and limitations in Section 5.

2. Literature Review

2.1. Multi-Level Network Analysis

A multi-level network, an essential analytical perspective of social network analysis (SNA), can be defined as a network with nodes of several types, where the nature of ties differ according to the kind of nodes they connect [21,22]. It also means analyzing separately, then jointly, and integrating several levels of agency [23]. In general, organizations, individuals, countries or regions, and other different kinds of events can commonly be represented as nodes and their interactive relationships as ties. Compared to existing methodologies, the multi-level network analysis has the following advantages. First, the existing research on SNA was mainly from a single perspective (e.g., macro-level or micro-level), and paid little attention to the comprehensive framework [24]. In this study, we employed multi-level network analysis that provided an integrated analytical framework for exploring central actors and their organizations in the process of technological innovation from comprehensive levels, namely macro-level, meso-level, and micro-level. The multi-level network analysis extended the research perspectives of SNA. Considering much of the work in identifying scientific communities is only from a micro perspective, Bellotti developed a multi-level network that meaningfully described network structures of collaborations [25]: micro-level illustrated scientists’ collaborations, macro-level illustrated institutions’ collaborations, and meso-level combined network measures at a micro and macro levels [25]. Second, less attention has been paid to the meso-level network research. In this study, the multi-level network is regarded as an essential analytical tool measuring the meso-level of interaction in the field of technological innovation networks. By employing a two-mode network, the multi-level network analysis attaches great importance to the meso-level network that links the macro-level and micro-level together, which also makes up the lack of separation of the macro-level and micro-level. Based on the method of structural linked design, Lazega et al. contributed to the research of “duality”, and first used the multi-level network to measure the meso-level of integration [26]. Two-mode networks are commonly applied in multi-level network research, which focused on two sets of actors, or one set of actors and one set of events, and measured ties between nodes belonging to different sets [27,28].
Drawing on this deep research on multi-level networks, recent studies have employed multi-level networks in TI fields and in various industries and organizations. Bellotti et al. introduced multi-level network into scientific work; they analyzed collaboration networks between scientists, and illustrated how these networks are embedded in institutional levels [29]. Brennecke and Rank extended the multi-level network perspective by exploring the knowledge-sharing process between individuals and organizations [30]. Barnett et al. proposed a multi-level network analysis to study the URL citation network of global universities at both the institutional and national levels on the World Wide Web. This research also ascertains the antecedent factors that determine the structure of the network among world universities [31]. By employing a multi-level network approach, Meredith et al. aimed to investigate information-seeking ties and network structure among organizations in secondary schools [32].
In the related work, a multi-level network is considered a valuable tool for presenting different kinds of technological innovation networks in diverse domains, such as high-tech, steel structures, TV programs, and so on [23,33]. Furthermore, network data in the aforementioned studies are mainly derived from journals, the Google search engine, projects, surveys, questionnaires, etc. However, limited studies have focused on emerging technologies, which have been paid increasing attention by academicians and practitioners in the global era. When it comes to emerging technologies, it should be recognized that patent information contains rich, valuable, and essential technical items, and 80% of these technical items are able to be identified in patent information [34]. We argue, therefore, that the analytical tools of traditional multi-level network analysis can be expanded by the use of this rich patent information in a multi-level network framework.

2.2. Development of Patent Risks

In the knowledge-based economy era, assessing patent risks has become more important in studies of technological innovation [35]. In practice, patent risk is regarded as a major threat for actors that aim to sustain their competitive advantage and obtain sustainable development in the fierce technological competition marketplace, and can cause loss or damage of assets potential [36]. According to the existing literature, the theoretical research on patent risk mainly focuses on the upper concept of patent risk, namely intellectual property risk. From the traditional risk management perspective, intellectual property risks refer to the analysis of what an individual or enterprise needs to be prepared for when deciding to protect their intellectual property (IP). Intellectual property risk arises from the complexity of various factors within the intellectual property system, and it falls within the realm of phenomena that are foreseeable; therefore, we can measure it, and the value loss resulting for a victim of IP theft is also measurable [37]. Although patent risks play an important role in IP risks, there are fewer studies that take into account the patent risks when stakeholders attempt to obtain sustainable development in technological competition. Following the existing literature on risks and IP risks, this paper attempts to define patent risks as the lack of understanding of the distribution of patents that lead to losing a key patent, increased research and development costs, and, potentially, infringement litigation. Patent risks affect more than just assignees who own patents; any stakeholder is vulnerable if it makes, uses, or sells products containing patented technology. Patent risks in the overall technological field can be effectively identified by exploring the distribution of patents, such as overseas patent applications, technological hotspots and fronts, and collaborative patenting activities.
Most of the recent literature focuses on assessing patent risks in a scientific and systematic way. The existing research is more dependent on manual perusal of patent documents by experts to judge and predict risks [38]. However, the qualitative method is subjective, because its results mainly depend on individual knowledge [39]. Regarding the increasing number of patent data and the complexity of patent information, the above approaches are both time-consuming and labor-intensive and the results will be inaccurate [38]. Based on statistics and machine learning algorithms, other scholars argue that quantitative methods are more objective than the qualitative approach, and, thus, help to improve the validity of analysis. As the most useful indication of technologies, patent information contains rich, valuable, and essential technical items for promoting technological development for both organizations and industries [34]. Therefore, patent information is regarded as an objective data source in this study. In order to measure patent risks, several patent-based approaches have been introduced. According to the research on patent risks, the most widely used approach is to assess patent infringement risks by analyzing patent information [40]. Lee et al. attempted to propose a semantic patent claim analysis, and assessed patents with high risks of possible infringements [38]. By employing the subject–action–object (SAO) semantic technological similarity-based approach, Park and Yoon attempted to investigate patent infringement between a patent and product by generating a product–patent infringement map [4]. Other researchers applied patent claim maps [41], patent topic maps [42], and keyword-based patent maps [43] for this purpose. A more sophisticated approach to focus on the relationships between patent infringements is social network analysis (SNA). Recently, SNA has been regarded as an effective tool to explore many important phenomena depending on networks. Most of the recent studies have employed SNA for establishing patent collaboration networks at the country level or organizational level in various technological fields, such as care robots, information and communication technologies (ICTs), nanotechnology, etc., and identifying central researchers, institutions, publications, journals, and research clusters in this network [24,44]. However, a few works, although still limited, have applied SNA for assessing patent infringement risks. Based on SNA, Kim and Song built a patent-infringement lawsuits graph, and identified key actors in this graph by computing the network centrality. The proposed approach can be used to identify the key companies for patent-infringement lawsuits, assess patent infringement risks, and evaluate patent portfolios [3]. Tsai and An proposed to employ the SNA to analyze patent infringement relationships, explore the roles and influence of companies by computing their network centrality measures, and prevent patent infringement risks [45]. Unlike the existing studies attaching importance to specific patents infringed by other patents, the approach we propose focuses on all patents in the target technological field and attempts to develop a new and comprehensive patent-based multi-level network model for identifying patent risks from the perspectives of collaboration, market, and technology by integrating patent analysis and SNA. This approach helps both researchers and practitioners to prevent patent risks, find new technology opportunities, and obtain sustainable development.

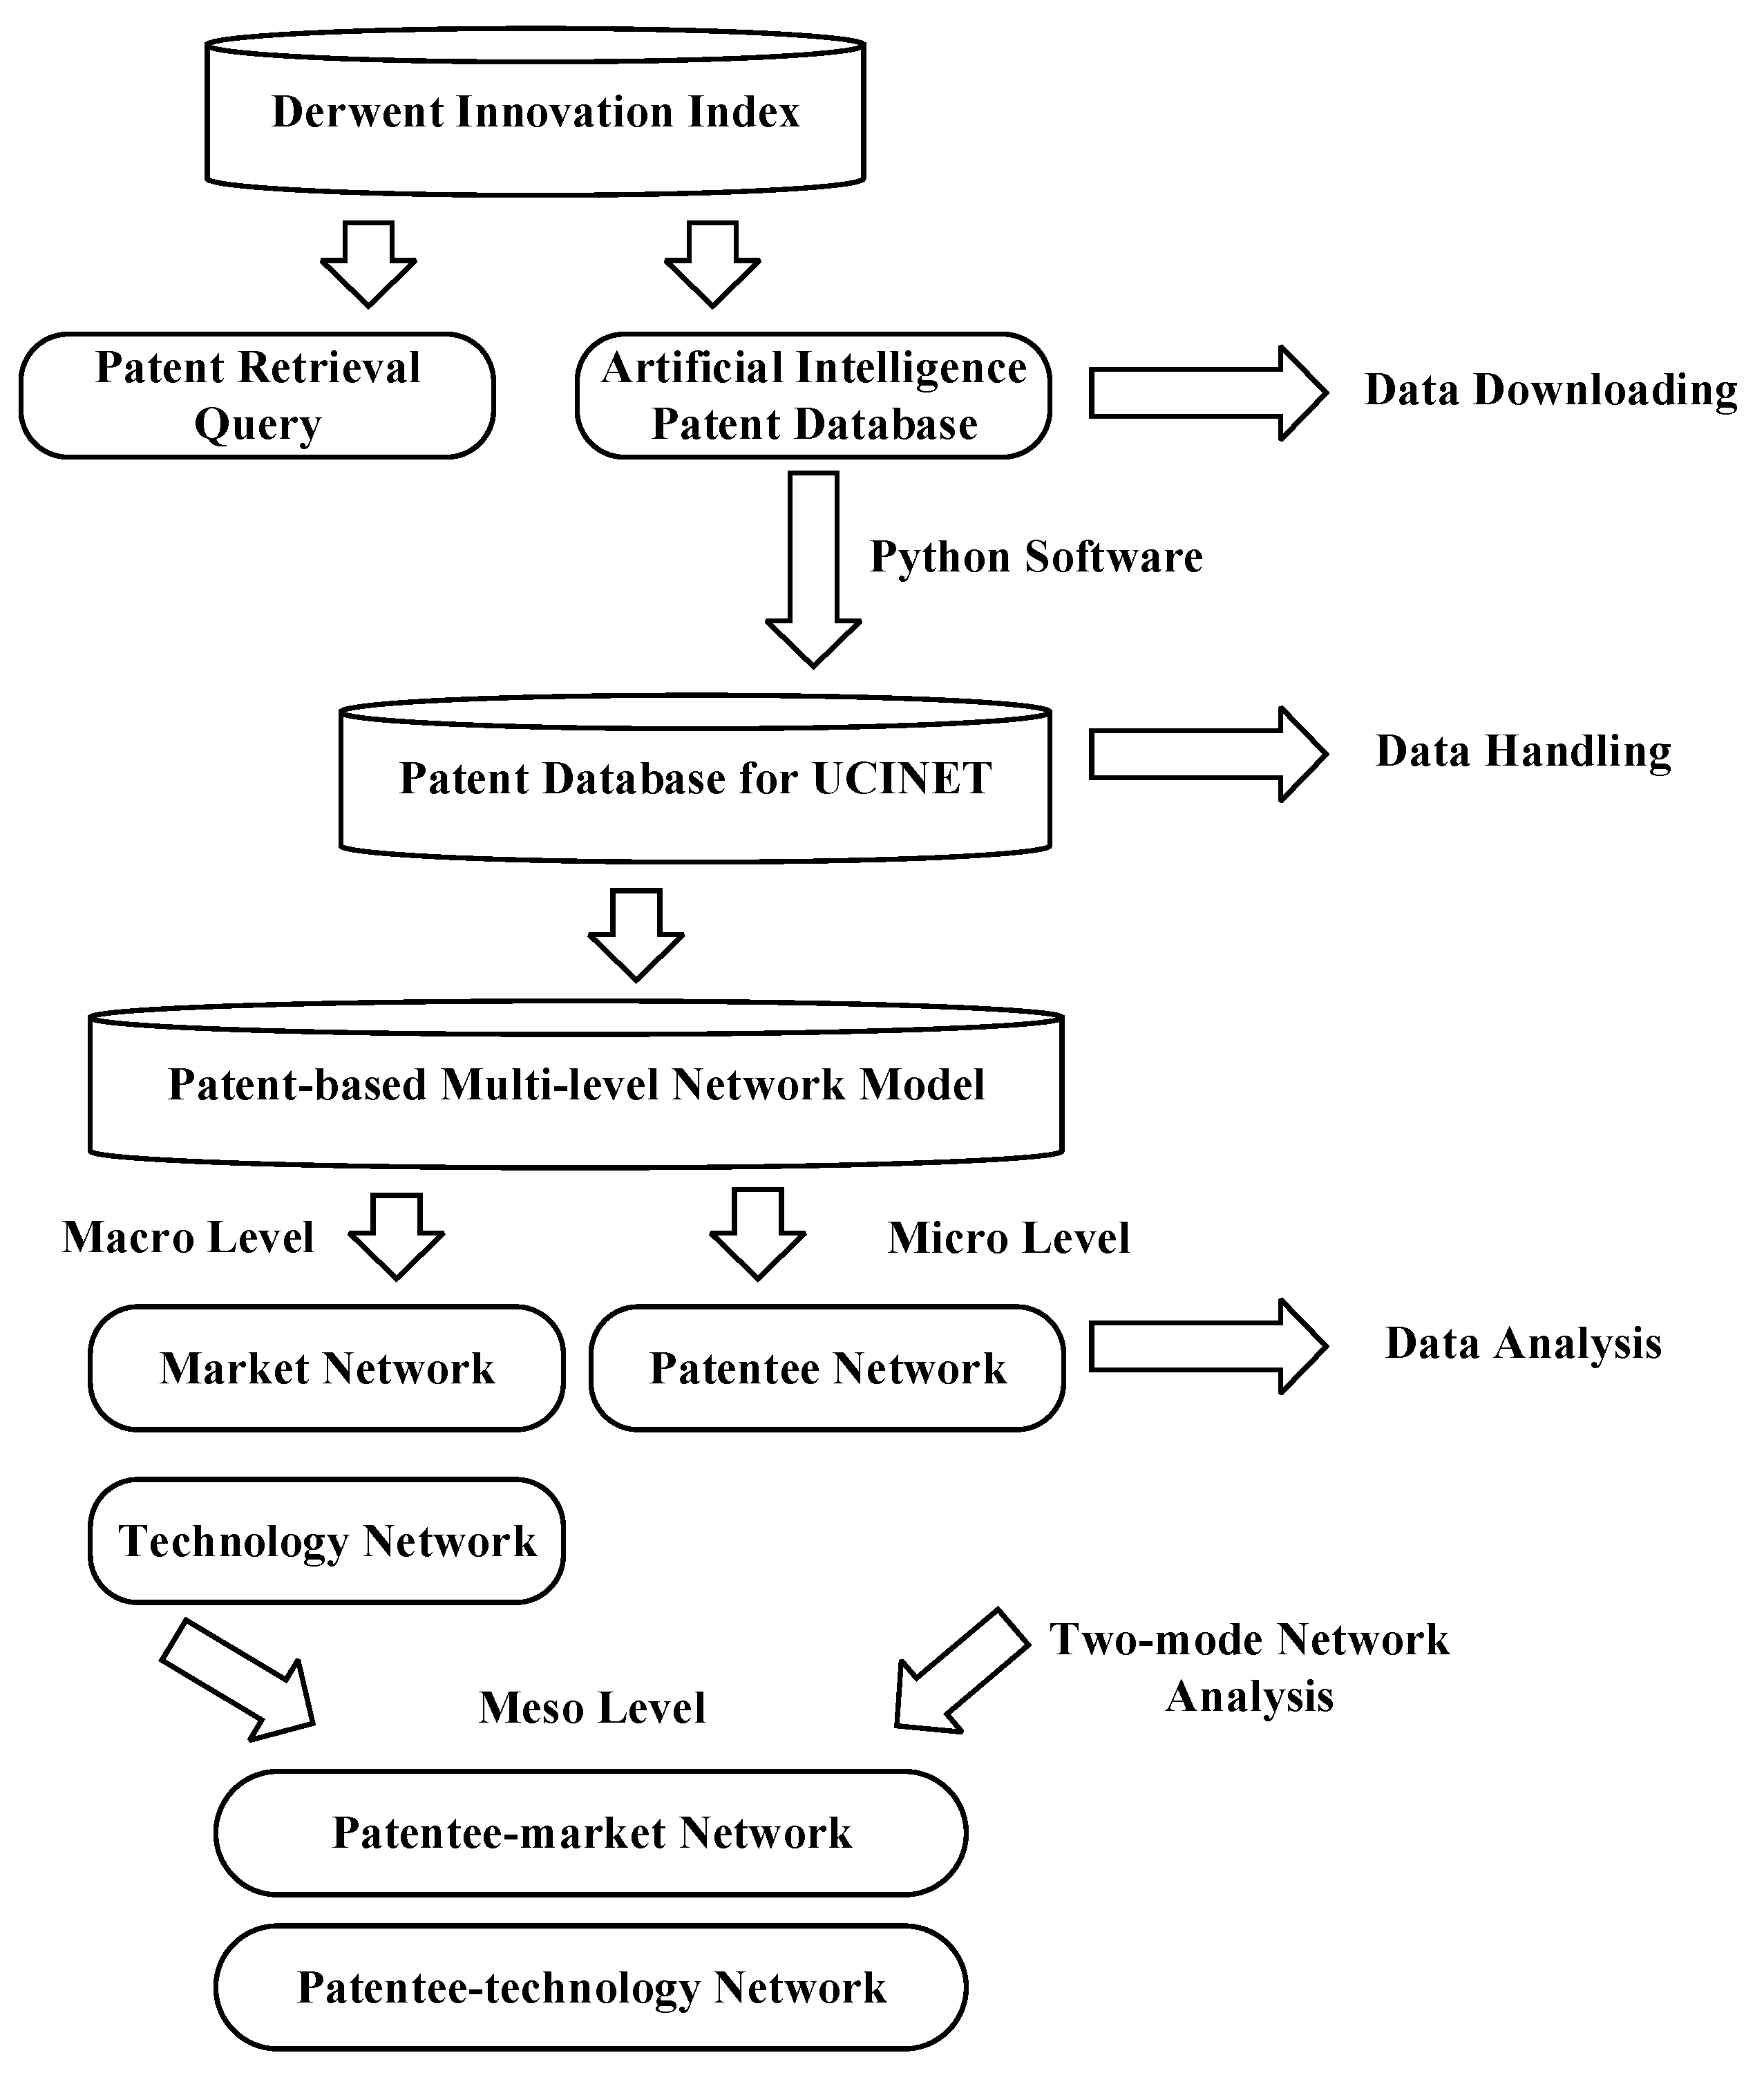
3. Research Methodology and Framework

This study represents an effort to identify patent risks from patent information. The scope of the specific technology field is based on related literature and the advice of technical experts. At first, we set up a suitable patent retrieval query and sorted patent data. Then, we handled patent data by employing Python software, and all these data were converted into the specific format to meet the requirements of the UCINET software (v6.0, Analytic Technologies, Lexington, KY, USA), which is a professional package for social network analysis [46]. In the methodology, building up the patent-based multi-level network model on patent risks was the key to the whole research process. This process was divided into two steps. First, we intended to build the market network, the technology network, and the patentee network, respectively. Second, by integrating the networks from different perspectives, a patentee–market network and a patentee–technology network were constructed by using two-mode network analysis. After the data analysis process, it was of great importance for this study to summarize and understand the results, and propose implications for stakeholders to formulate strategic planning and decision-making. Figure 1 indicates the overall process of the proposed approach for identifying patent risks.

3.1. Retrieval of Patent Information

Obtaining accurate patent data is an essential basis to build the patent-based multi-level network model proposed in this study. After setting a suitable patent retrieval query, we applied the powerful and professional patent research tool Derwent Innovation Index (DII) [47]. Taking the accuracy of our patent retrieval into account, we read related literature, including books and articles in the AI technological field, and consulted technical experts’ advice. In order to collect the core keywords for the patent search string, we followed advice from technical experts, and considered the research from Huang et al. [48]. However, we found that there are still some unrelated patents by pre-retrieval. To address this problem, we adopted the international patent classification (IPC) to refine the retrieval query and retrieve a more accurate sample. In addition, we used broader criteria for selecting the AI patents. A patent was regarded as valid if the term appeared simultaneously in abstracts, claims, and titles. The patent retrieval query was shown by combining the keywords with IPC, using the “AND” operator. TS = (“artif* intelli*” OR “comput* intelli*” OR “deep learn*” OR “machine learn*” OR “big data” OR “cloud comput*” OR “pattern recogn*” OR “neural network*” OR “data mining*” OR “natural language process*” OR “speech recogn*” OR “computer vision*” OR “gesture control” OR smart robot* OR “video recogn*” OR “image* recogn*” OR “voice translat*”) AND IP = (“G06N-003/00” OR “G06N-003/02” OR “G06N-003/04” OR “G06N-003/06” OR “G06N-003/063” OR “G06N-003/067” OR “G06N-003/08” OR “G06N-003/10” OR “G06N-003/12” OR “G06N-005/00” OR “G06N-005/02” OR “G06N-005/04” OR “G06N-007/00” OR “G06N-007/02” OR “G06N-007/04” OR “G06N-007/06” OR “G06N-007/08” OR “G06N-099/00”). The timespan was from 1998 to 2018. We retrieve 13,647 patents from DII.
Regarding the number of patents, Figure 2 illustrated a general overview and development trends of the top eight countries or regions leading the AI race. Japan and the U.S. started earlier than other countries in the field of AI technology. After the year 2016, the number of AI patents in these top eight countries or regions entered a rapid growth phase. The U.S. is a powerful leader in the AI technology field. One reason for this could be the first-mover advantages gained from entering the market earlier. China, with a steadily increasing number of patents, serves as a technology catcher and first outstripped the AI patents held by the U.S. in 2012. One practical reason for this is that China has a large market and abundant funding support. The other reason is that China’s science and technology evaluation system has had an increasing emphasis on patents [49]. The number of Korean patents experienced a rapid increase in 2018, and Korea outstripped Japan to rank third in the number of AI patents. This trend shows that Korea attaches great importance to the AI technology, and will also be a formidable competitor in this field.

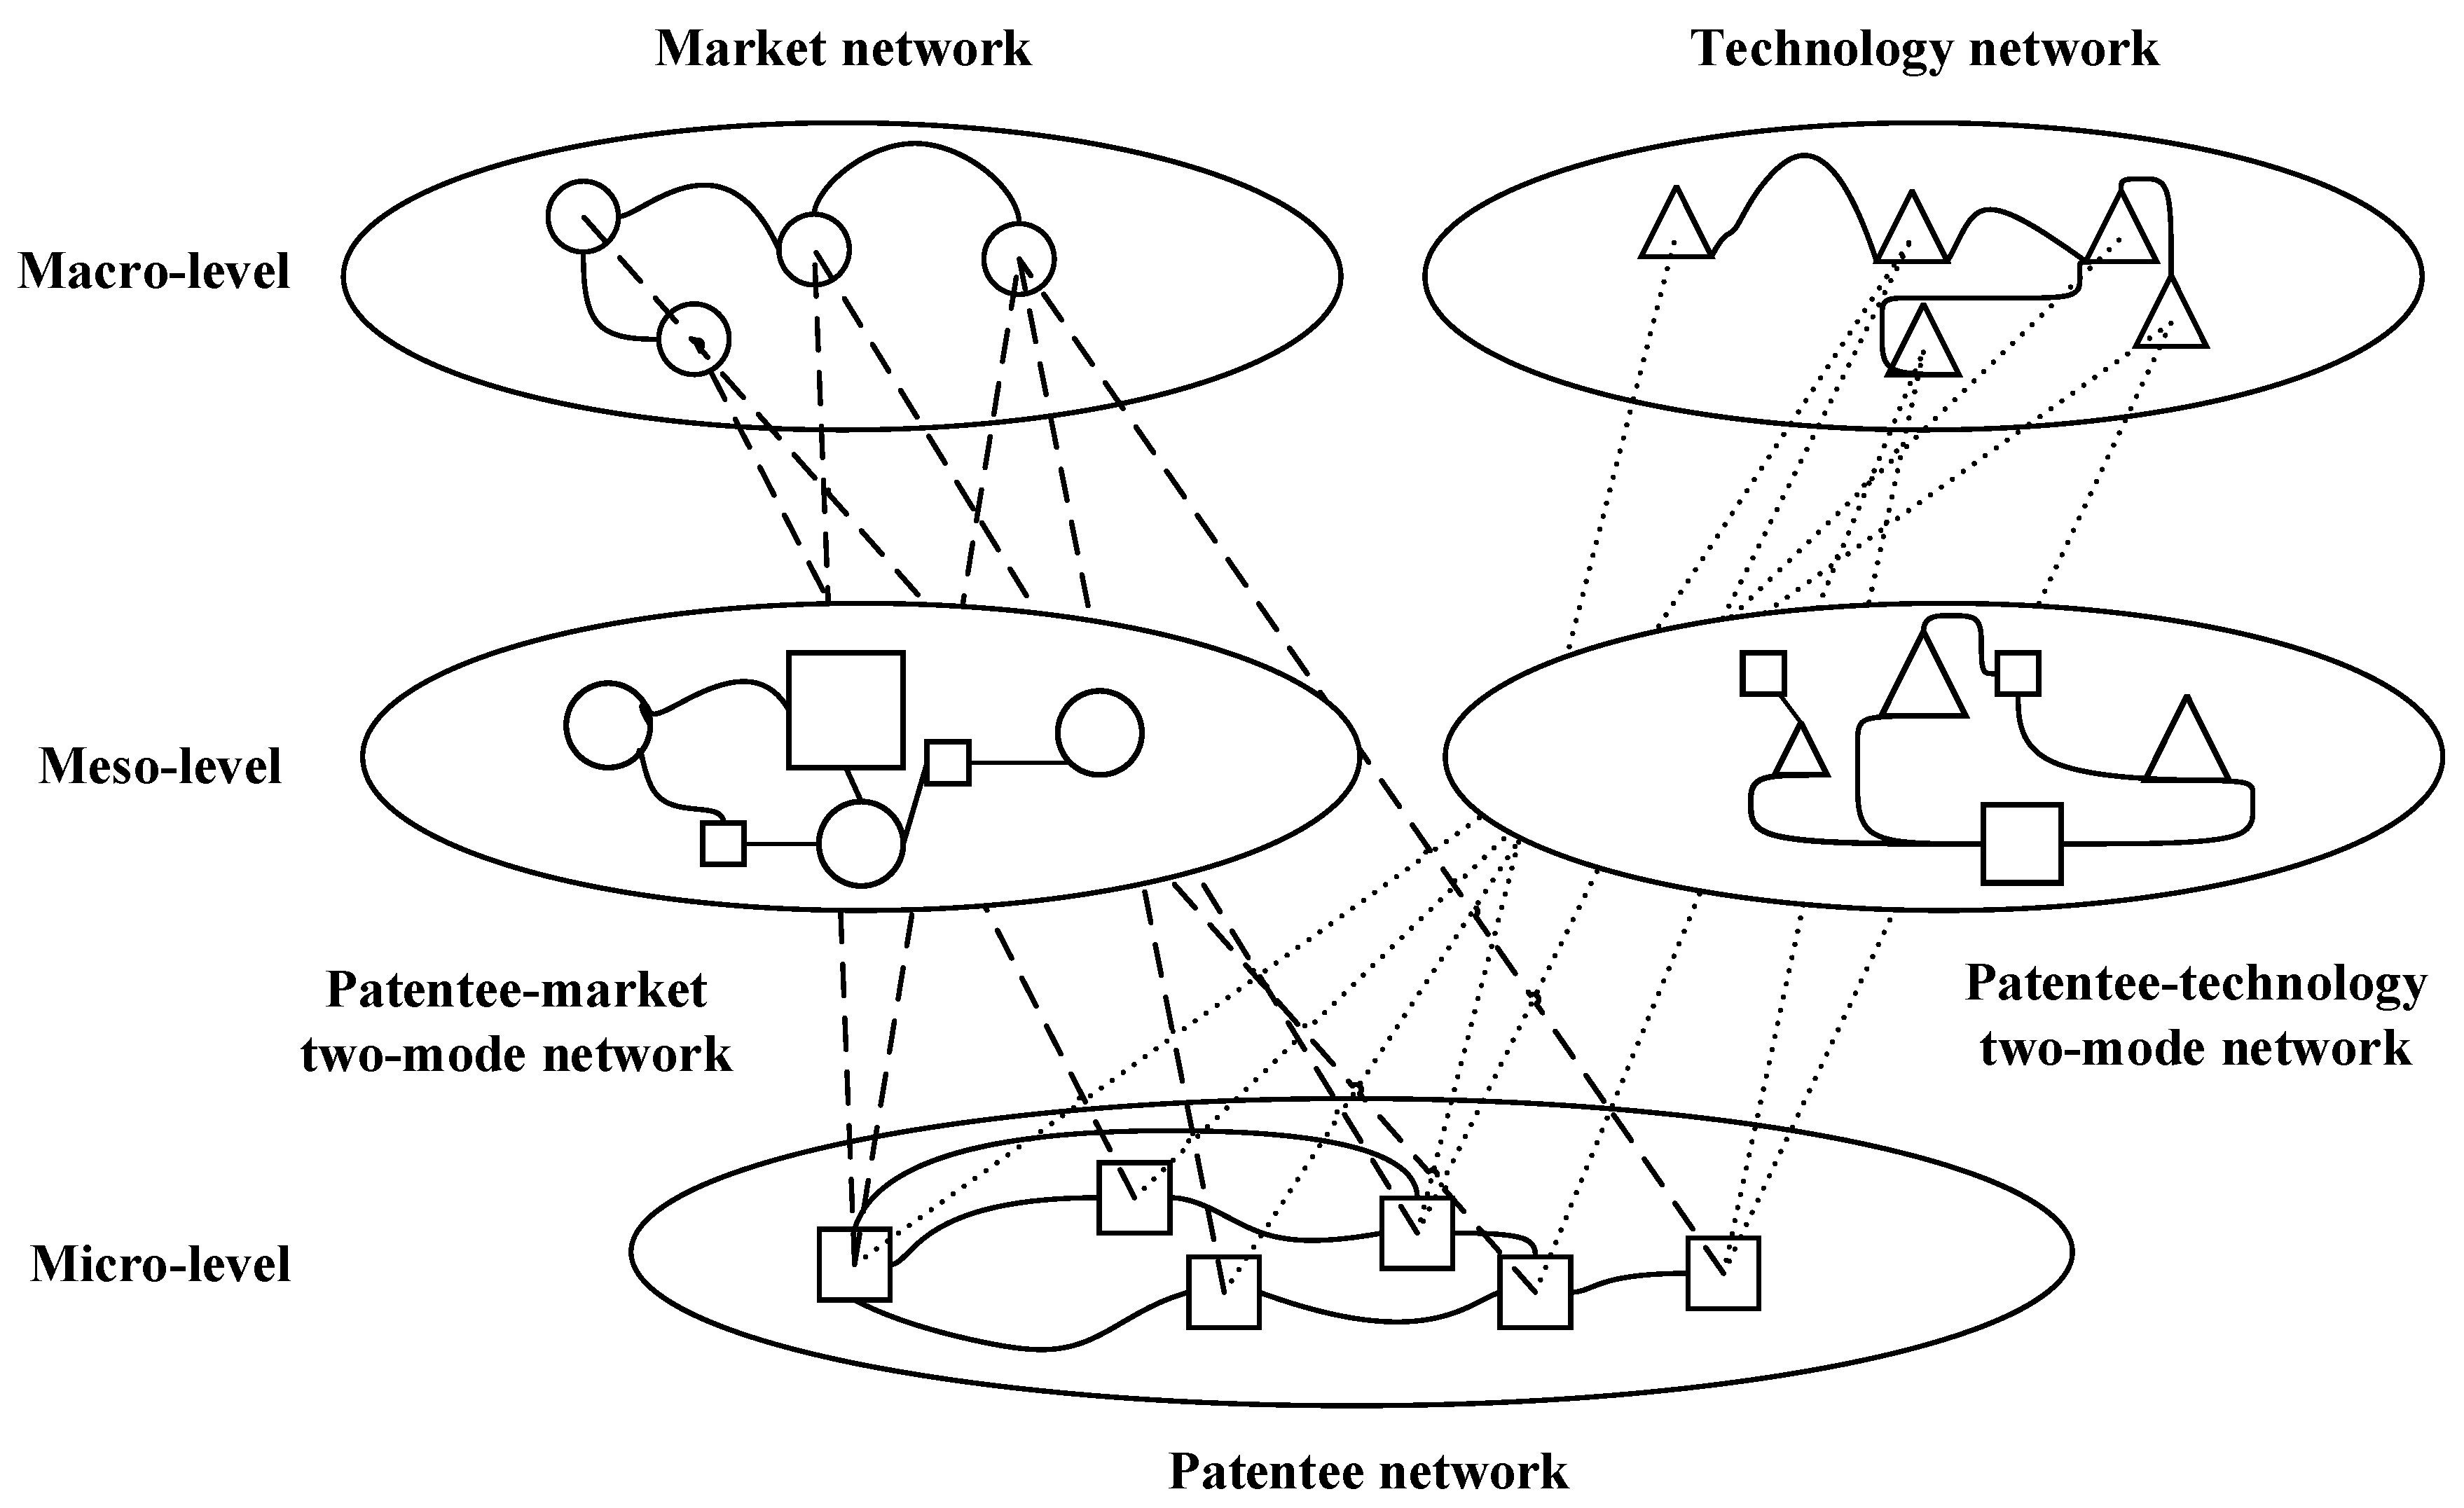
3.2. Patent-Based Multi-Level Network Model
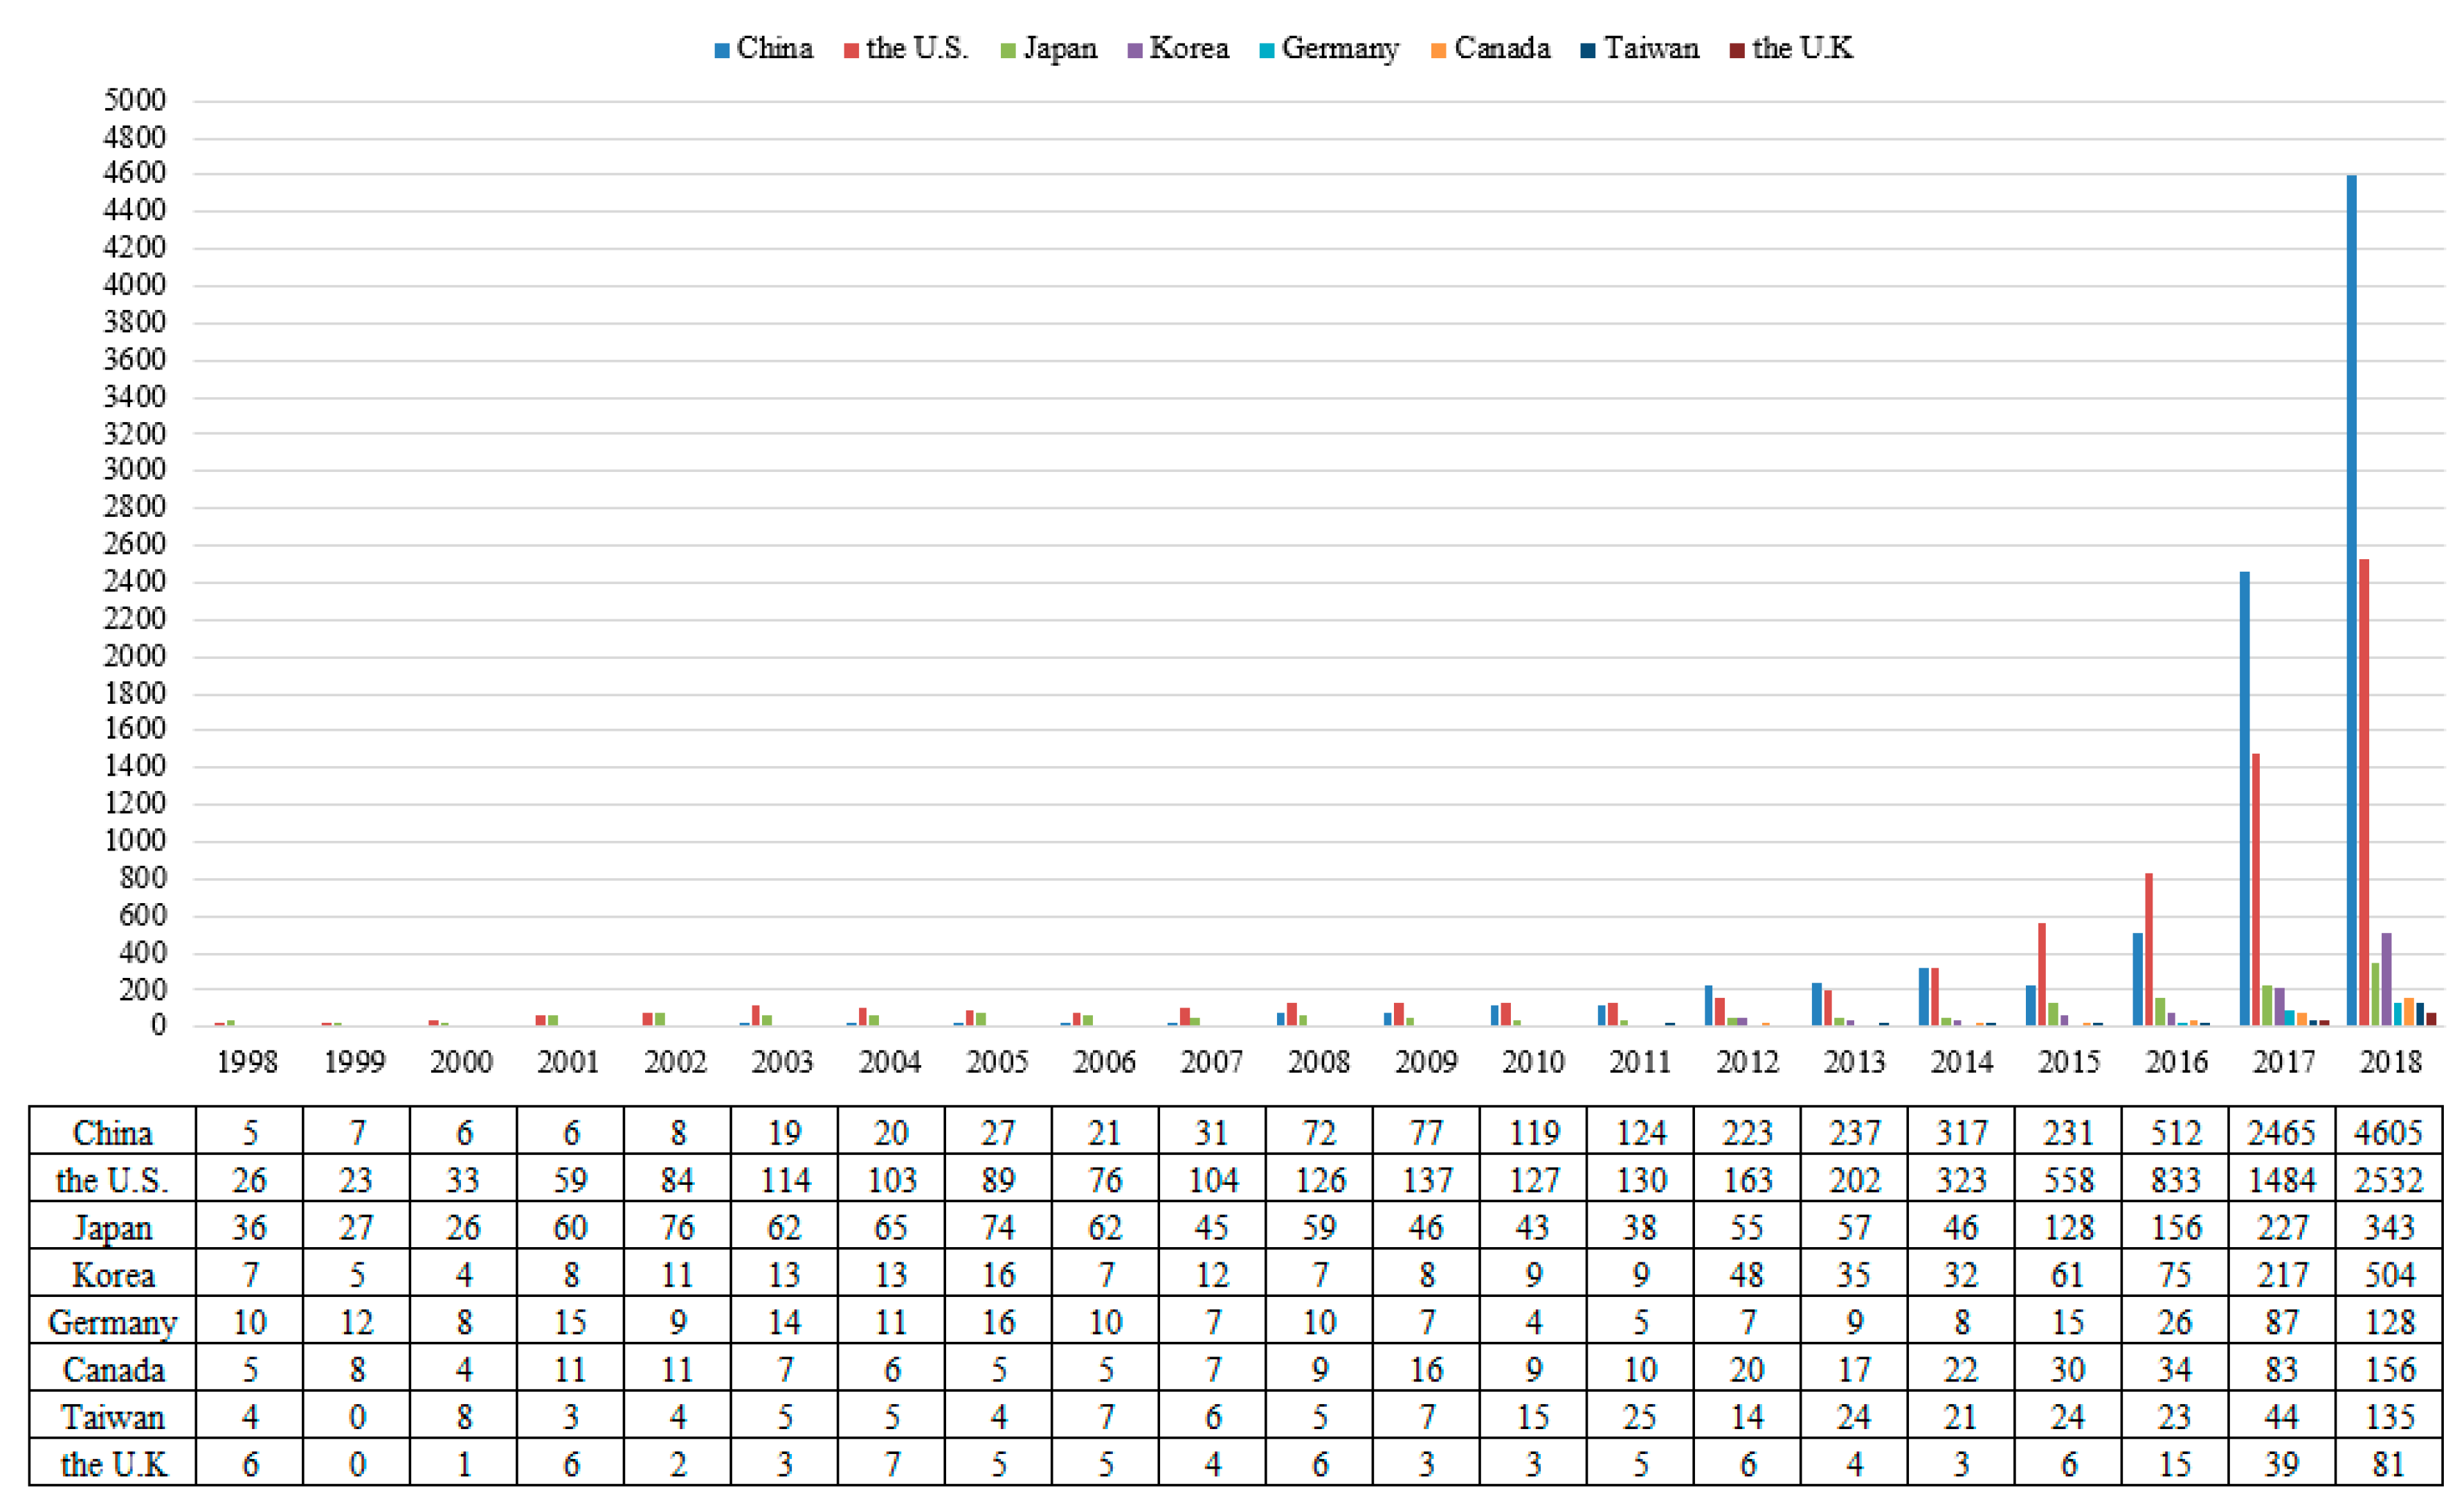
By introducing patent indicators to the previous multi-level network model, this study aims to build a new and comprehensive framework for the patent-based multi-level network, which helps stakeholders to identify patent risks in the specific technological field. The proposed patent-based multi-level network attempts to investigate patent risks through meso-level and micro-level investigation. Patent indicators are easy to choose and assess under the macro market and technology dimensions, meso patentee–market and patentee–technology dimensions, and micro patentee dimension. In addition, patent indicators include all essential factors of patent risks. Levels, dimensions, and patent indicators can be matched one by one, and can be supported by the relevant literature.
Figure 3 represents the basic schema of the patent-based multi-level network on patent risks proposed in this paper. The market network and the technology network from the macro-level, the patentee–market network and the patentee–technology network from the meso-level, and the patentee network from the micro-level jointly constitute the patent-based multi-level model. Three types of nodes are shown in the diagram, namely: (1) circle nodes, representing patent filing offices around the world; (2) triangle nodes, representing a specific technological field, based on the Derwent Class Code (DC), a patent classification code by DII; and (3) square nodes representing patentees. Nodes can be also distinguished using different colors. The upper market network represents the ties among country/region filing patents in the given technology field. Based on patent analysis, a network of patent geographic distribution with regard to the number of patents between each filing country/region appeared to be very promising for market activities [50]. The upper technology network illustrates the relations among different technological fields, which helps to dig out research hotspots by employing social network analysis, and obtain competitive advantage for stakeholders [51]. The lower patentee network represents the patent collaboration situation between assignees. Considering the patent collaboration between assignees is of fundamental importance to identify the key patentee with the highest technological innovation capability in the whole network, we needed to focus on the patent collaboration of these patent assignees [49]. By employing two-mode network analysis, the vertical lines linking nodes in the lower network with nodes in the upper network form two networks, the patentee–market network and the patentee–technology network. When investigating the patentee–market network, we explored the patent distribution of the top assignees in the popular patent filing office, and identified the patent market risks. As for the patentee–technology network, we found specific technological fields that the top assignees focus on, and identified the patent technology risks due to the lack of patent application in essential technological fields. Thus, the proposed patent-based multi-level network above could be examined separately at first, and then jointly.
Based on the constructed patent-based multi-level network, one can summarize and understand the technological competition reflected by patent data, and then identify patent risks. Employing the proposed patent-based multi-level network, the following relevant aspects of information can be revealed. (1) The list of the main distribution of patent competitive markets is suggested by circle nodes in the market network. (2) Technological hotspots and fronts are indicated by the betweenness centrality, degree centrality, and eigenvector centrality of triangle nodes in the technology network. (3) The degree centrality of square nodes in the patentee network suggests the leading assignees with high collaboration capability. Those assignees lacking cooperation with other assignees, especially industry–university–research collaboration, suffer from patent collaboration risks. (4) The patent market risks are indicated by the uncomprehensive patent application of those leading assignees in the popular patent filing markets, which can be found in the patentee–market network. (5) Based on the patentee–technology network, the lack of patent distribution of those leading assignees in essential technological fields implies patent technology risks. The above aspects can support applications as represented in Figure 3.

4. Case Study

4.1. Market Network

The distribution of the patent market is of great significance for improving the level of technological innovation capability. In order to explore the distribution of the patent market in different countries, and identify the main competition market, it is necessary to analyze the market network. Using the Netdraw visualization tool in UCINET, the market network diagram of AI technology in leading countries or regions was drawn. The blue nodes represent the top 8 leading countries or regions in this field, while the red nodes represent the top 10 most popular patent filing offices around the world. A link between a blue node and red node indicates the patent application of a leading country or region, and the thickness of the link represents the number of patents that a leading country or region filed in the target patent filing office.
As shown in Figure 4, the U.S., the WIPO (World Intellectual Property Organization), and China are the top three most popular patent distribution countries or regions in the AI field, which indicates the main competition markets around the world. Nearly all the assignees pay close attention to the U.S. market, especially those from Canada, Germany, the U.K, Taiwan, and Japan. Assignees from the U.K, Canada, Germany, and the U.S. attach great importance to the patent application at the WIPO, while assignees from Taiwan, Japan, the U.K, and the U.S. focus on the patent application at the CN (National Intellectual Property Administration, PRC). It can be clearly seen that many leading countries or regions (e.g., China, Korea, and Taiwan) had the largest numbers of AI patents filed by applicants from their own country or region, which indicate the obvious “home advantage” effect in the market network [52]. Most of the leading countries or regions, especially Asian countries or regions, lack patent applications in European markets.

4.2. Technology Network

The technology network aims to explore valuable patent information for exploring research hotspots and find technology opportunities by making a co-occurrence analysis of the given technological field. The co-occurrence analysis can be complemented by integrating the Derwent Class Code (DC), which categorized patent documents through a simple classification system for all technologies. Using the DC can significantly assist stakeholders to enhance effective and precise searching capability in a particular area of technology, and identify research hotspots and fronts.
As can be seen in Figure 5, each node represents a single DC, and the link between different nodes is used to illustrate that a patent has more than one DC. We measured the co-occurrence of the technological field three ways, using UCINET [46]. The first is betweenness centrality. The size of the node represents the betweenness centrality. A DC with a high score on this measure sits on many of the “shortest paths” connecting others and is likely to have a higher ability to control the flow of information or the exchange of resources [53]. The DC with the highest betweenness centrality represents the importance and influence power of the technology and indicates the new research front and technology opportunity in this field. The second measure we report here is degree centrality [54], which captures information on how many links to others each DC has, and reflects the hotspot of the technology. Degree centrality depends simply on the number of connections each node has. An extension is eigenvector centrality [55], which ranks DCs by how well they are connected to highly connected others. Eigenvector centrality represents the need for comprehensive distribution in the technological field. Considering betweenness centrality, degree centrality, and eigenvector centrality, the top 10 hotspots and fronts of AI technology are illustrated in Table 1.
T01 (Digital Computers) has the highest betweenness centrality, degree centrality, and eigenvector centrality in the AI field, suggesting that it plays the most important role as both a technological hotspot and front. As a crucial branch of computer science and digital computers, AI has been widely used in computer vision, natural language processing, automatic programming, and data mining in recent years. Regarding high betweenness centrality and degree centrality, as well as eigenvector centrality, T06 (Process and Machine Control), X25 (Industrial Electric Equipment), and S03 (Scientific Instrumentation) are ahead of other technological fields except for T01. The research on these three fields has been very active and plays a crucial role in the AI field. Intelligent manufacturing is an emerging area of interdisciplinary research integrating machine control theory and artificial intelligence, which can be widely applied in many fields such as engineering, agriculture, military aviation, etc. [56]. With the increasing complexity of electronic devices, computers have become imperative in electrical design. The application of AI in industrial electrical equipment is mainly embodied in electrical design, namely, the optimization involved in electrical equipment and computer aided design (CAD) technology [57]. In the coming era of artificial intelligence, scientific instruments have evolved from automation to intelligence. Scientific instruments in the fields of life sciences and medical treatments, such as the spectrometer, chromatograph, gene pulser transfection apparatus, cell fusion apparatus, and so on, have good prospects for development [58].

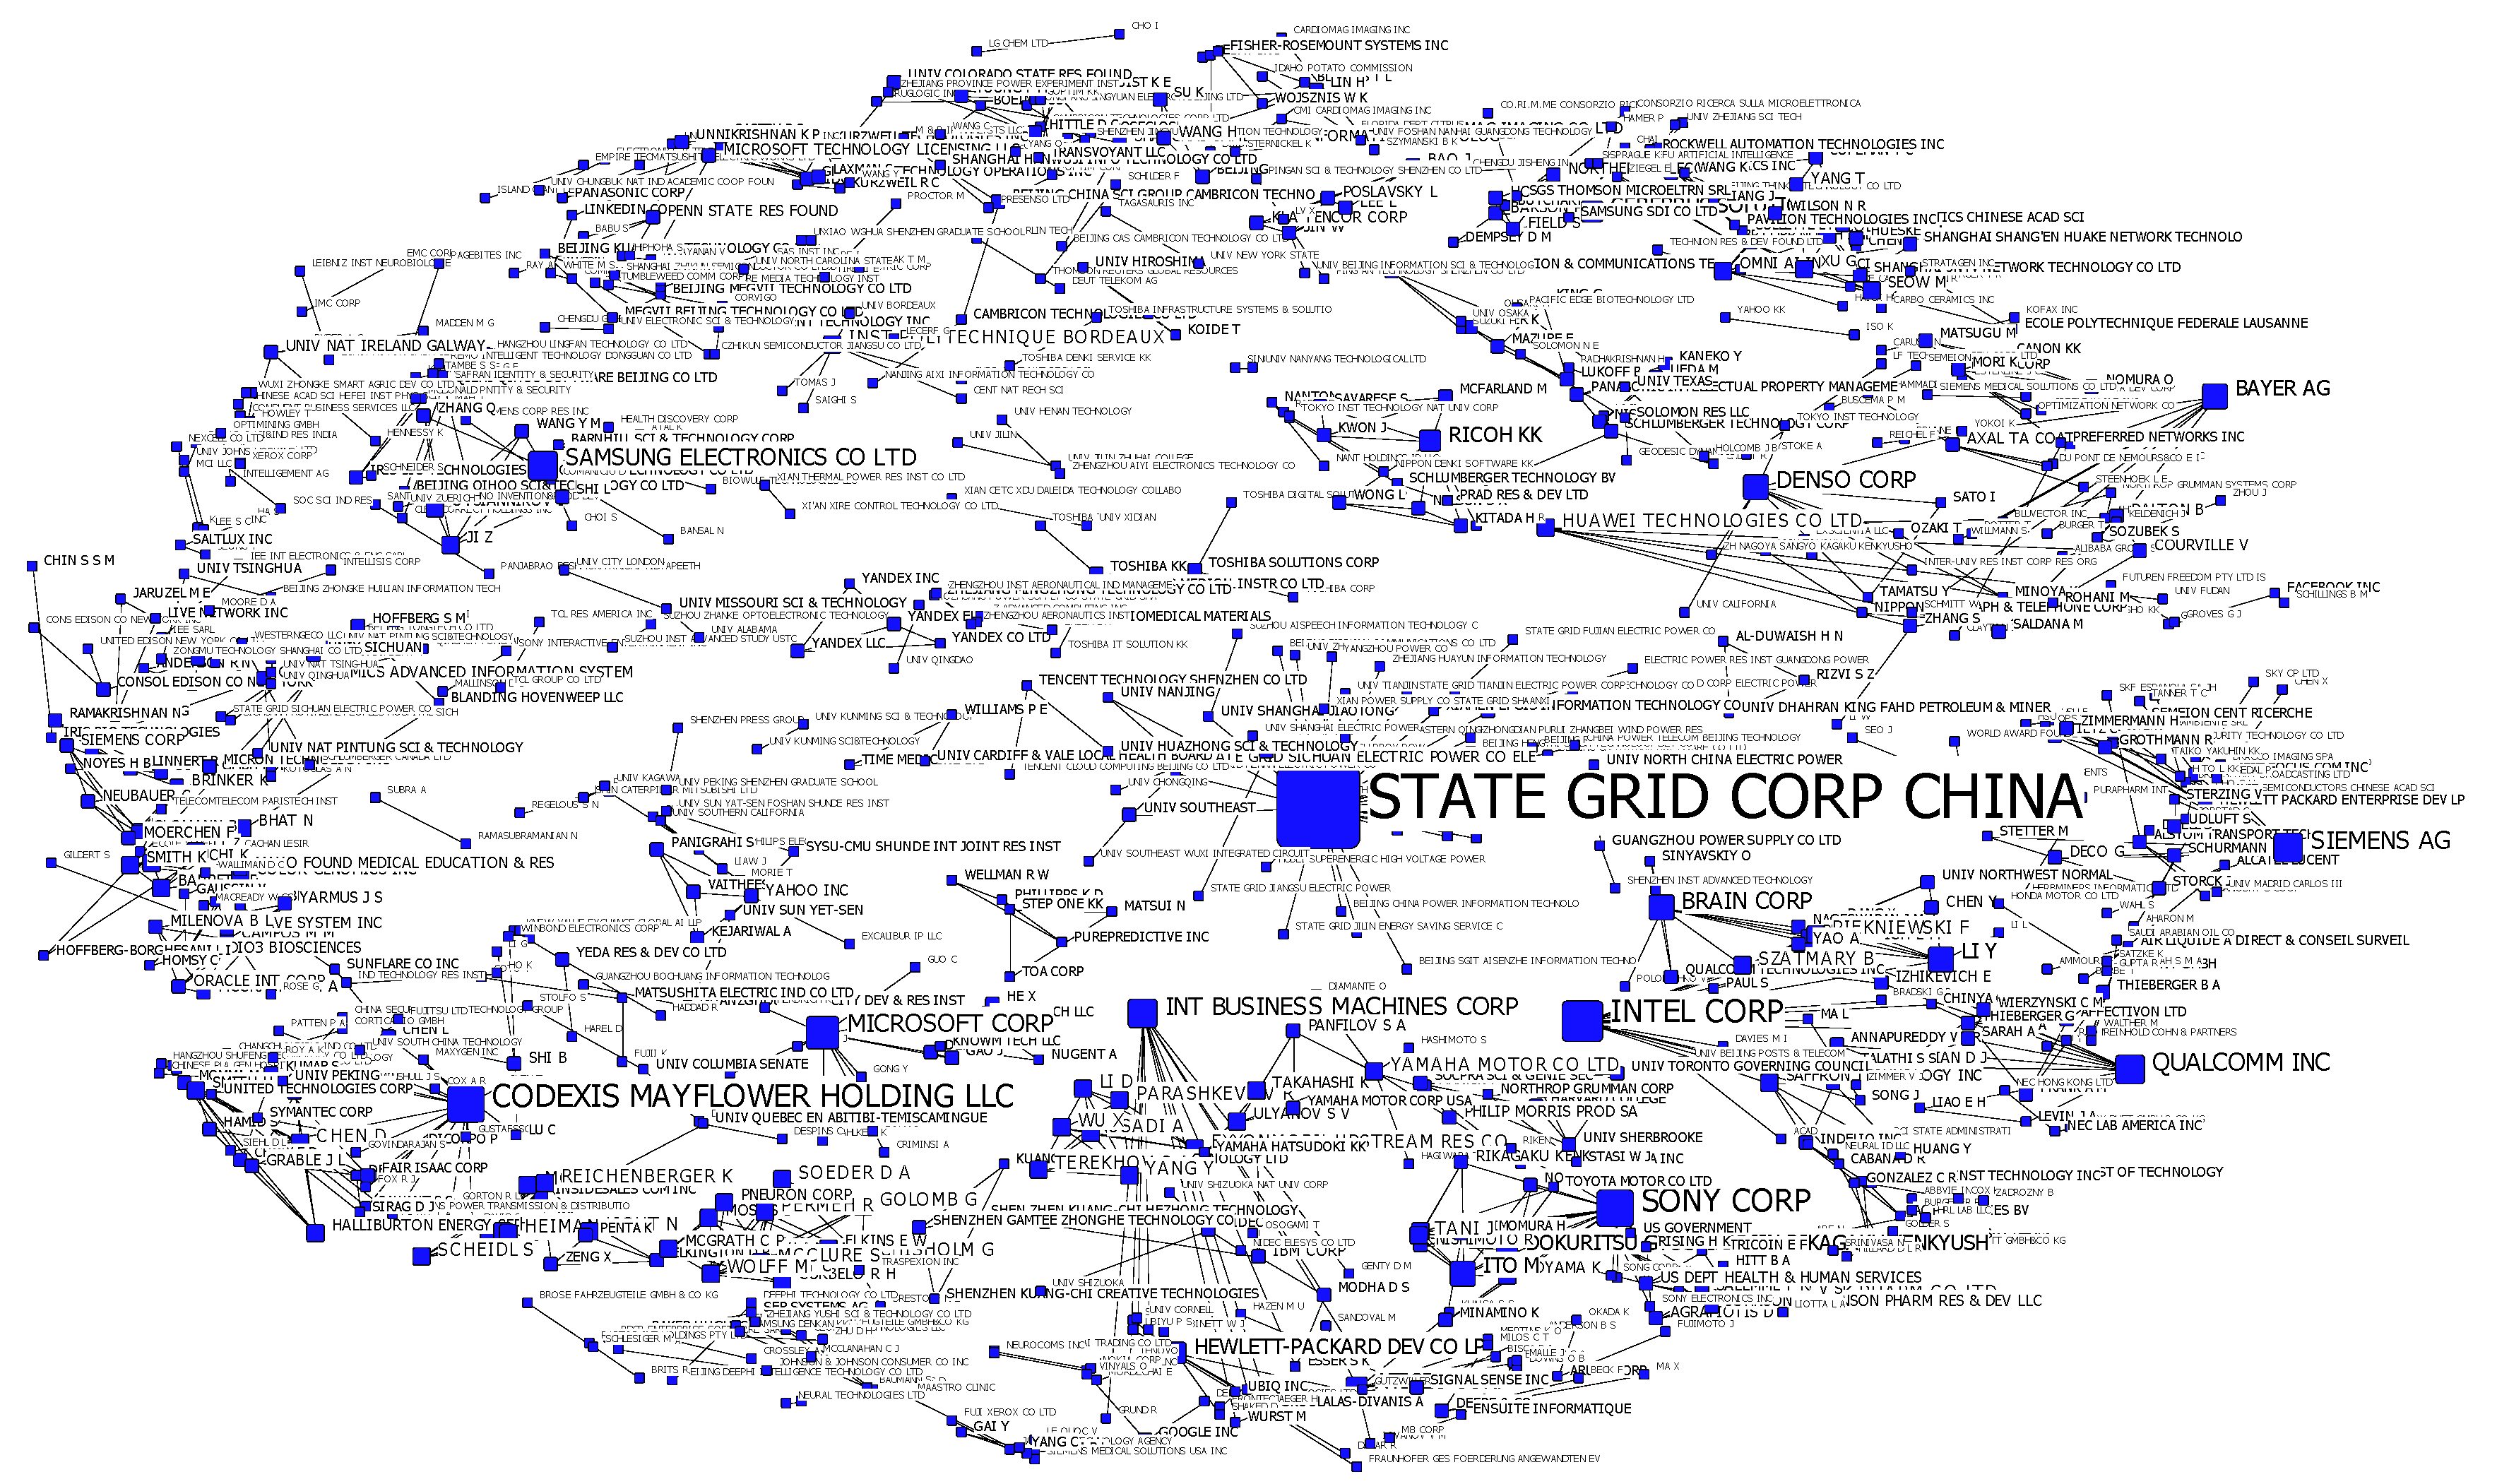
4.3. Patentee Network

The patentee network illustrates the collaborative AI patenting activity between stakeholders, and aims to identify patent collaboration risks from the perspectives of collaborative patent applications, international collaborations, and industry–university–research collaboration. We would expect that links exist between patentees for the transmission of knowledge, for the generation of a collaborative community of patentees within the network, and to further a common technologically innovative collaboration opportunity. As shown in Figure 6, each node represents an assignee, and the size of the node represents the degree centrality, i.e., assignees with higher degree centrality appear larger. The links indicate that two assignees collaborate on a patent and file a patent together. It is possible to capture the collaboration level of assignees and communities: the linkages of assignees in whichever community they operate and their collaboration with other assignees within the AI technology innovation system.
Table 2 illustrates the degree centrality of the top ten lead assignees in the AI field, which helps stakeholders to identify patent collaboration risks from the perspective of a collaborative patent application. Regarding the geographical composition, the U.S. (6 patentees) leads China (1 patentee), Japan (1 patentee), Germany (1 patentee), and Korea (1 patentee), and takes the lion’s share, suggesting its leading position of jointly applied patents in the AI industry. It is clear that compared to assignees from the U.S., the collaborative patent application levels of assignees from China, Japan, Germany, and Korea are relatively low, which leads to patent collaboration risks. In addition, all the top ten lead assignees are from enterprises. It shows that enterprise, particularly large multinational corporations, is the main technology strength of collaborative patenting activity in the AI industry. However, the collaborative patent application levels of universities are relatively low, which indicates patent collaboration risks.
Examining the network as a whole via Figure 6, we can identify patent collaboration risks from the perspective of international collaboration. As shown in Figure 6, there are nine major components that involve more than 10 partners, which appear most likely associated with jointly applied patents. The largest network with 50 patentees is largely dominated by Chinese actors. In this network, STATE GRID CORP CHINA (SGCC-C), which until now has been very active on the AI fronts, possesses a central role and appears to the driving force of commercial AI production in the power industry, especially those used in the industrial chain from power generation and transmission. There are 38 patentees from enterprises, 12 from universities or research institutes, and no partners from other countries. The second-largest network, with 23 partners, is dominated by U.S. patentees, particularly INTEL CORP (ITLC-C). Another network is dominated by 21 actors from the U.S.; the leading patentee is QUALCOMM INC (QCOM-C). It can be observed that the patentee network has yet to demonstrate any assignee that appears to have a central role connecting a large number of international assignees, and, thus, serves as an international hub or cluster. Therefore, we conclude that in the current period national collaboration still dominates. The lack of international collaborations among assignees may lead to patent collaboration risks and hinder the development speed of technological innovation process.
Table 3 presents the top twenty stakeholders leading the AI race, ranked by the number of patents. The table shows that there are thirteen patentees from enterprises and seven patentees from universities and research institutes. Among these top 20 patentees, we can see that China (10 patentees) and the U.S. (5 patentees) are major competitors in the AI industry. The patentees from the U.S., Japan, Korea, and Germany are entirely enterprises. Compared to lead assignees with high degree centrality (see Table 2 and Figure 6), most of the top 20 patentees from the U.S., Germany, and Korea, such as QCOM-C, ITLC-C, International Business Machines Corp. (IBMC-C), MICROSOFT CORP (MICT-C), SIEMENS AG (SIEI-C), and Samsung Electronics Co., Ltd. (SMSU-C), have good capability in technological innovation cooperation. It can be seen that most of the Chinese patentees are from universities, and there are only three enterprises, namely SGCC-C, BAIDU ON-LINE NETWORK TECHNOLOGY CO LTD (BIDU-C), CAS CAMBRICON TECHNOLOGY CO LTD (BEIJ-N). Except for SGCC-C, the collaborative patent application levels of Chinese patentees are low. Regarding the industry–university–research (IUR) collaboration, it will enhance the pace of industrialization of AI technology. Combining Table 3 with Figure 6, we can investigate the IUR collaboration of the top 20 assignees, and identify patent collaboration risks from the perspective of IUR collaboration. It can be seen that IBMC-C has patent collaboration with UNIV CORNELL (CORR-C), SMSU-C with UNIV ZUERICH (UYZU-C), and UNIV YONSEI (UYIA-C), NEC CORP (NIDE-C) with UNIV TOHOKU (TOHO-C), SIEI-C with UNIV JOHNS HOPKINS (UYJO-C) and UNIV BRITISH COLUMBIA (UYBR-C), and SGCC-C with UNIV HUAZHONG SCI & TECHNOLOGY (UYHZ-C) and UNIV WUHAN (UYWU-C). However, most of these top 20 assignees, especially assignees from Chinese universities lack IUR collaboration, which may lead to patent risks in technological innovation cooperation.

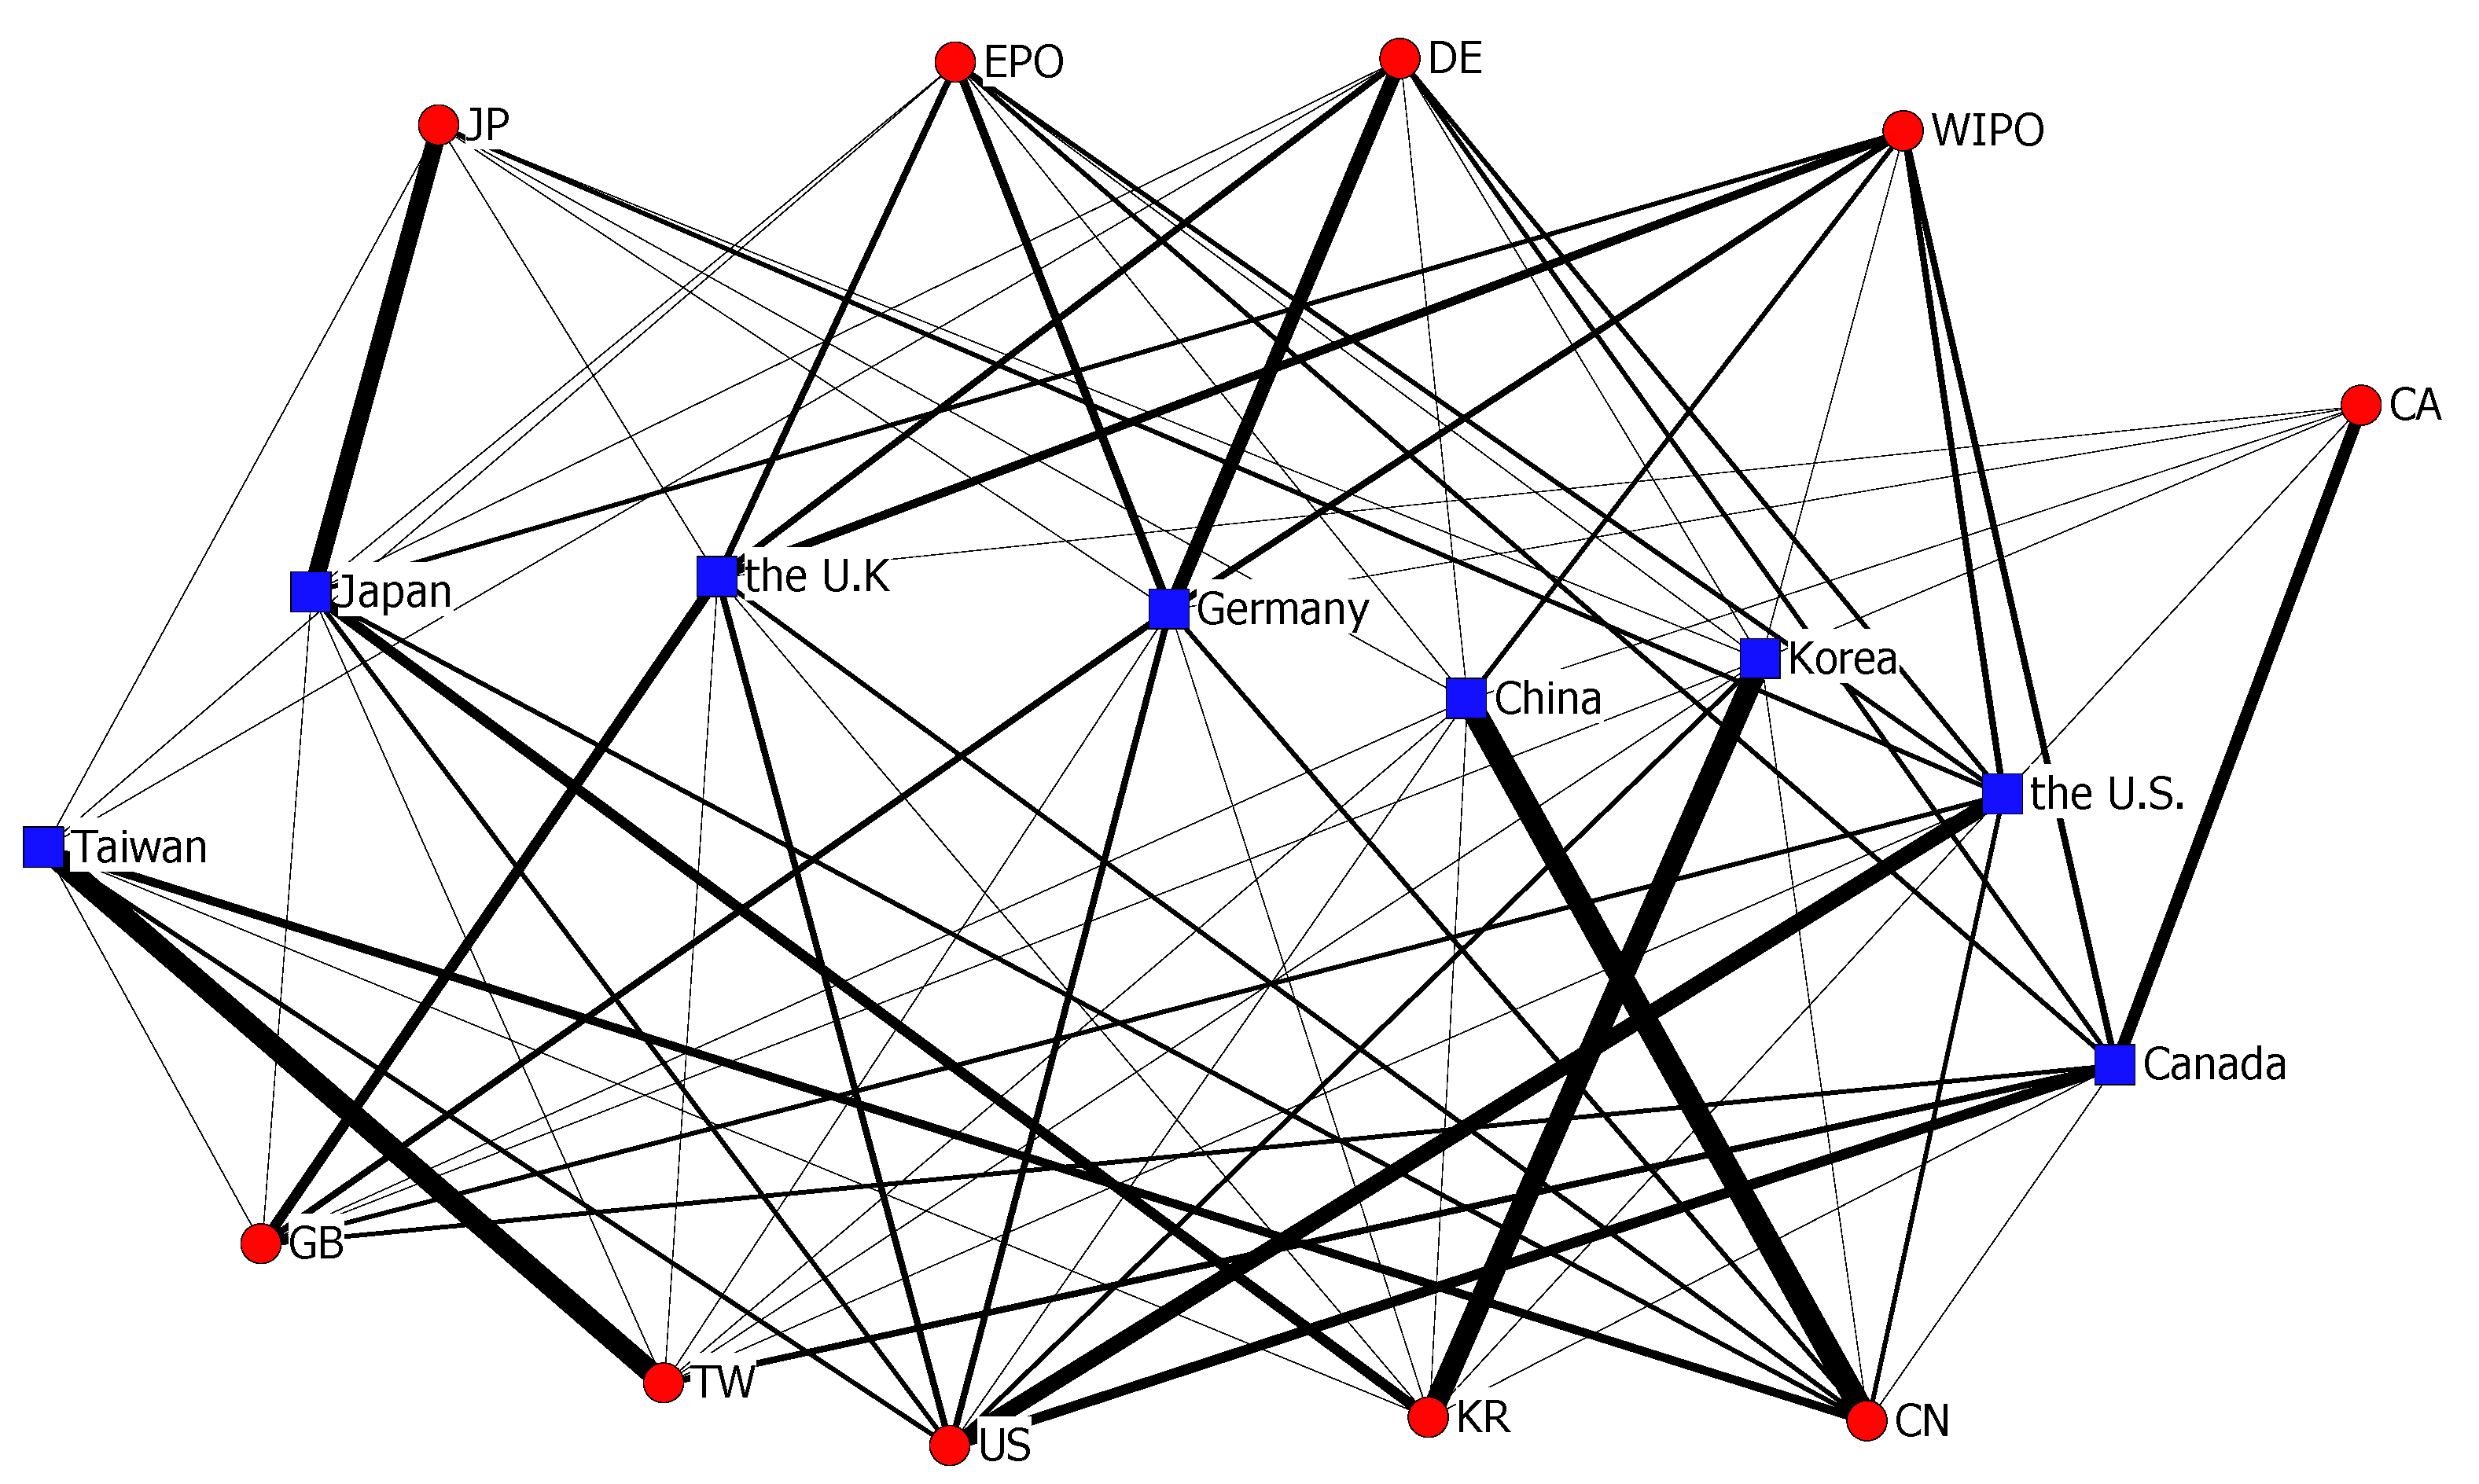
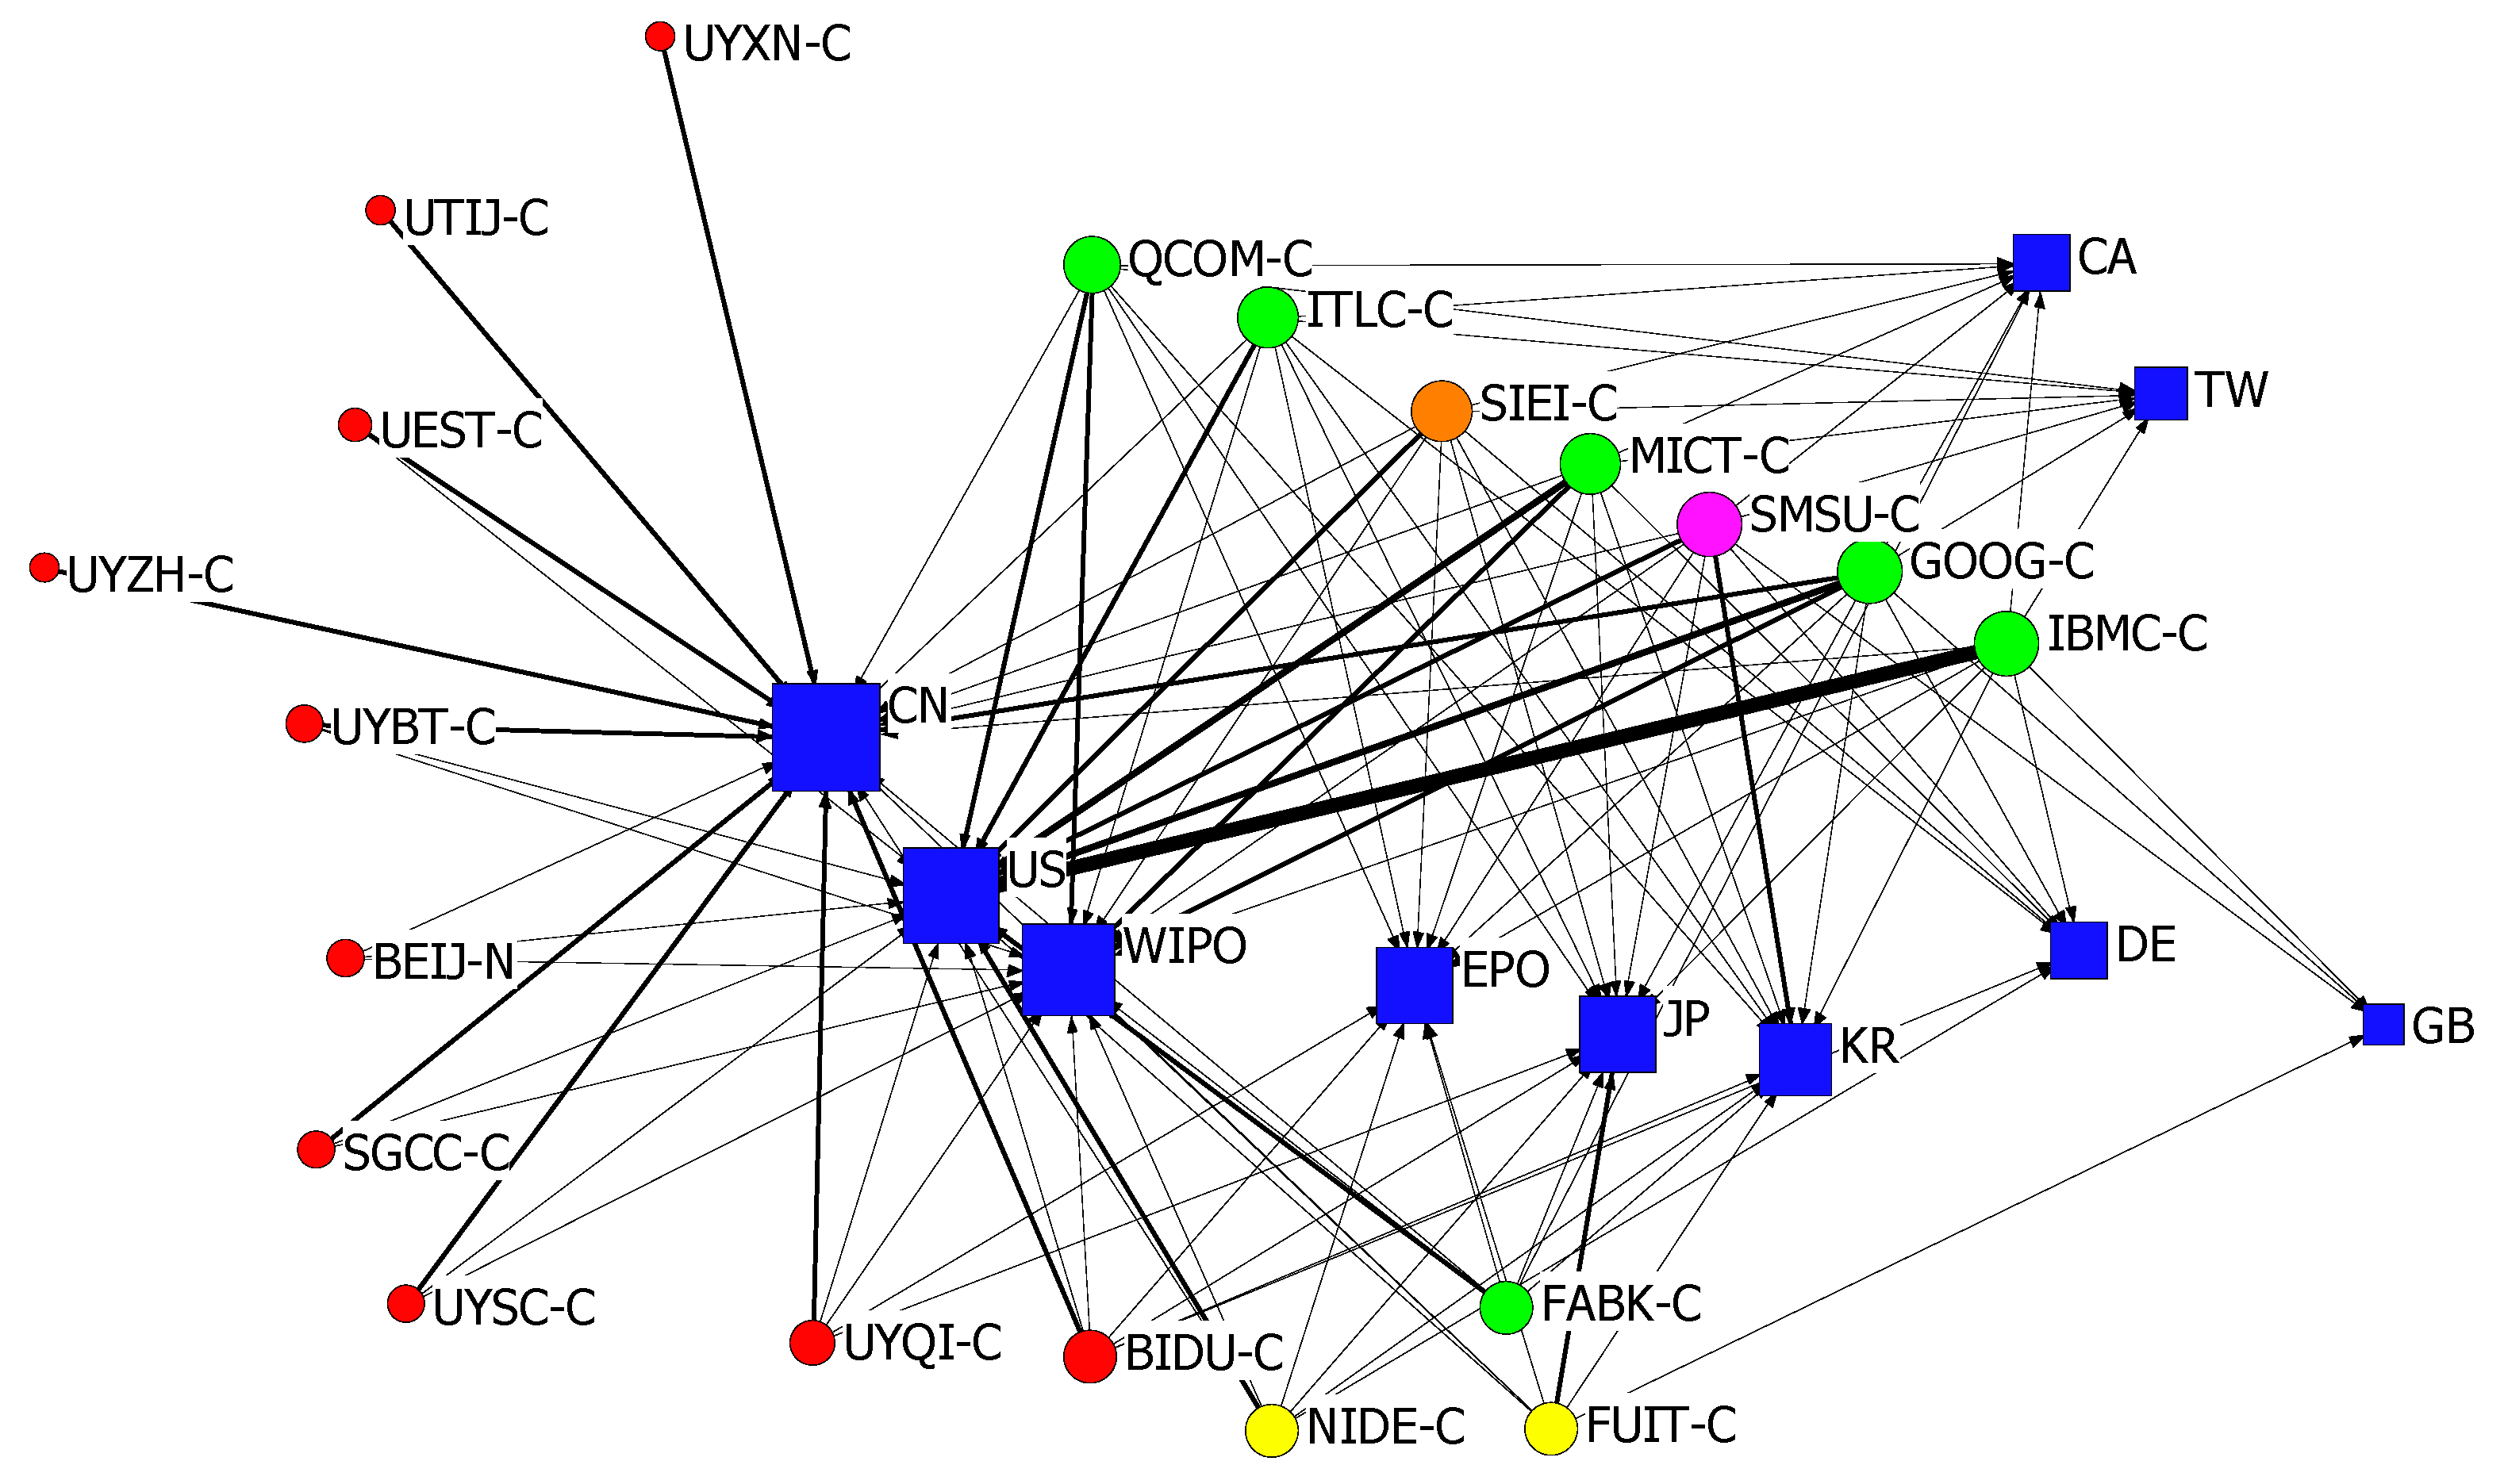
4.4. Patentee–Market Network

How do the different patentees perform in different overseas patent markets? What are the patent market risks in the AI technology field? To answer these questions, a two-mode network of patentees and patent filing offices was constructed. This diagram displays the possibility of patent market risks based on overseas patent markets of patentees from different countries. As an indicator of seeking protection in a geographical scope, the more comprehensive a patentee files its patents in global patent filing offices, the broader protection of their patent rights, and the fewer patent market risks incurred by potential patent infringement. Based on the two-mode network, we measure the connectedness between patentee and patent filing office by employing degree centrality. The degree centrality captures information on how many ties each patent filing office has to patentees, based on the two-mode patentee–market network shown in Figure 7. The square nodes represent eight patent filing offices, while the circle nodes represent the top 20 leading stakeholders in the AI field (see Table 3). The red nodes represent patentees from China, green from the U.S., yellow from Japan, pink from Korea, and orange from Germany. The sizes of the circle nodes indicate the degree centrality of the node. The larger the circle node, the more comprehensive the market distribution of the patentee in the network, which indicates higher competitive advantages for the key patentee. The link indicates how many patents each of the 20 patentees has to every patent filing office, and the thickness of the link represents the number of those patents.
As shown in Figure 7, GOOGLE INC (GOOG-C) and IBMC-C from the U.S. and SMSU-C from Korea seem to be the most central organizations, and have comprehensive layout in the whole major competitive market. MICT-C and ITLC-C from the U.S. and SIEI-C from Germany filed patents in major markets, except for the U.K. It is interesting to find that the above six organizations with better patent overseas’ layout are all from enterprises, especially large multinational enterprises with first mover advantages in resource, technology, R&D investment, etc. Therefore, assignees from the U.S., Korea, and Germany have comprehensive distribution in the major competitive market, especially the U.S., WIPO, and China. However, it can be clearly seen from Figure 7 that Chinese assignees are regarded as latecomers in this field, extremely lacking the overseas patent layout. For example, some Chinese universities, such as UNIV ZHEJIANG (UYZH-C), UNIV TIANJIN (UTIJ-C), and UNIV XIDIAN (UYXN-C) just filed patents in their domestic market. This shows that so far most of the Chinese assignees have focused on the domestic market, and have paid little attention to entering the global market. This lack of comprehensive overseas distribution of patent markets, especially in the most popular countries or regions like the U.S., WIPO, etc., will cause patent market risks when Chinese assignees face fierce global competition in the future.

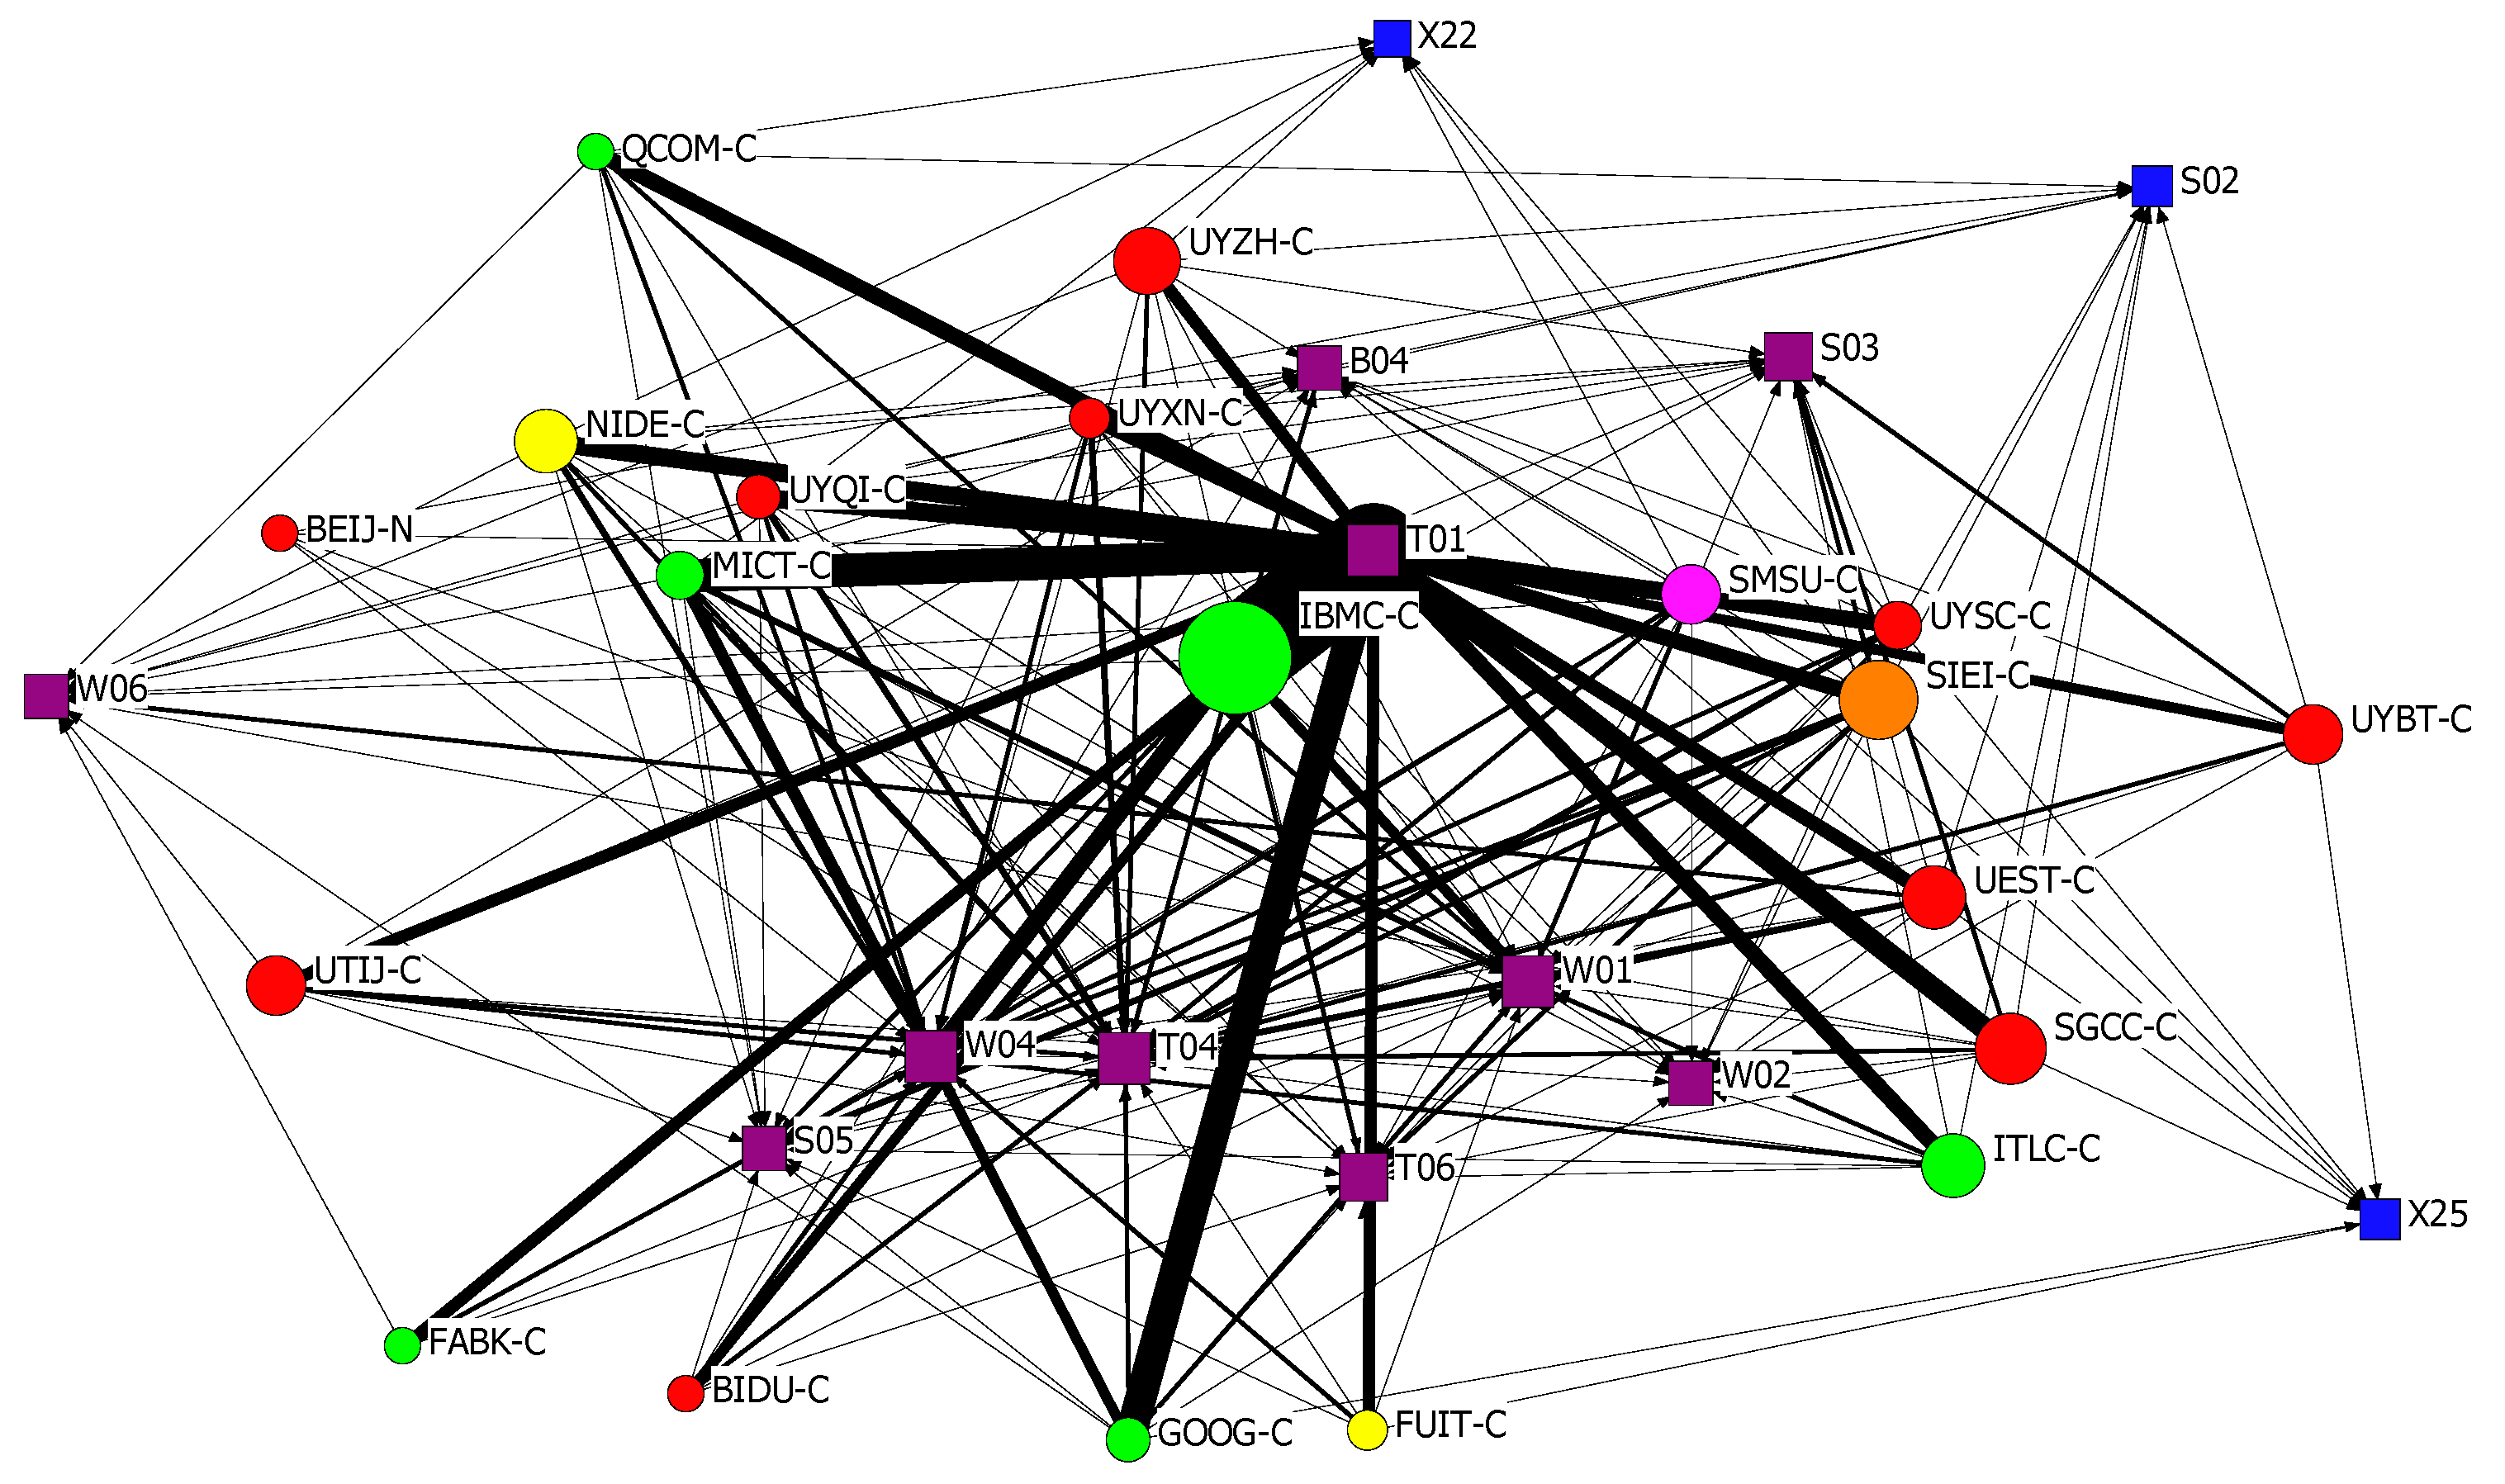
4.5. Patentee–Technology Network

To gain a general understanding of specific technological fields for patentees from different countries, the patentee–technology network is used by integrating the micro-level of patentees and macro-level technological fields. The patentee–technology network was proposed to help key patentees to explore the important technological fields, identify the potential of patent technology risks, and enhance their capability in patent distribution of technological domains. Among the key patentees, the more comprehensive patent distribution of technological domains, the higher their competitive advantages, and the fewer patent technology risks incurred by fierce technological competition. Figure 8 illustrates the patentee–technology two-mode network of AI technology. The purple squares represent the top 10 DCs in the core position (see Table 4), while the blue squares indicate other DCs at the periphery of the network. The circles represent the top 20 leading stakeholders (see Table 3), which is the same as the patentee–market network. The red color indicates assignees from China, green from the U.S., yellow from Japan, pink from Korea, and orange from Germany. The size of the circle is determined by the betweenness centrality. The larger the circles, the more important the assignee is in the network, which indicates the assignee’s competitive advantages in a given technological field. The lines represent the number of patents in the technological field that an assignee has filed; the thicker the line, the higher the frequency of filed patents between assignee and technological field. The core/peripheral positions are determined by the size of nodes and the thickness of the links. Stakeholders with more relations in the target technological field and shorter paths are positioned at the center and defined as core players in the industry.
As shown in Table 4, we measured the connectedness of the technological field three ways, as with the technology network, namely, betweenness centrality, degree centrality, and eigenvector centrality, and displayed the important technological fields in the patentee–technology network. It can be clearly seen that T01 (Digital Computers) and T04 (Computer Peripheral Equipment) are the most important technological fields for the top 20 leading stakeholders, followed by W01 (Telephone and Data Transmission Systems) and W04 (Audio/Video Recording and Systems). In addition, when comparing the important technological fields in the technology network (see Table 1) and patentee–technology network (see Table 4), those DCs in the technology network but not in the patentee–technology network indicate that the top 20 leading stakeholders lack patent application in those important technological fields. We find that X25 (Industrial Electric Equipment), S02 (Engineering Instrumentation), and X22 (Automotive Electrics) are three technological hotspots and fronts (see Table 1) rather than important technological fields in the patentee–technology network, which indicates that the patent applications of the leading stakeholders in these three fields are weak. Due to the lack of patent distribution in the technological fields of X25, S02, and X22, most of the leading assignees will encounter the patent technology risks incurred by fierce technological competition. Taking X25 as an example, currently, there are eight stakeholders owning patents in this field, and the amount of patents is very few.
As can be expected from the patentee–technology sub-network results in Figure 9, the top three most important technological fields at the center of the network include T01 (Digital Computers), T04 (Computer Peripheral Equipment), and W01 (Telephone and Data Transmission Systems), which is also in the technological hotspots and fronts of AI patents (see Table 1). In particular, IBMC-C, MICT-C, and GOOG-C are centrally located in T01 and W01, while in the case of T04, UNIV CHINA ELECTRONIC SCI & TECHNOLOGY (UEST-C), UYXN-C, and UNIV SOUTH CHINA TECHNOLOGY (UYSC-C) play central roles. Regarding the comprehensive patent distribution in the technological fields, the top five patentees from high to low rank are SIEI-C, SGCC-C, UEST-C, MICT-C, and SMSU-C, which indicates that they have greater comprehensive competitive advantages and are the key competitors in the AI industry. Compared to the enterprises from the U.S., Germany, and Korea, Chinese assignees from non-state-owned enterprises or universities lack comprehensive patent applications in key technological fields, indicating their higher possibility of patent technology risks. For example, BIDU-C is a search engine giant, aiming to focus on future-looking fundamental research in AI and lead the national lab on deep learning. However, it does not have patent applications in key technological fields, such as S03, X25, and so on, suggesting patent risks in the distribution of technological domains.

5. Discussion and Implications

This paper presents systematic research on patent risks in the AI technology field based on a new patent-based multi-level network model that integrates patent analysis with social network analysis. This study retrieved 13,647 patents within the AI technology field using the DII database, and used social network analysis to illustrate and explore the patent risks behind these networks. Furthermore, integrating the networks from market, technology, and patentee perspectives allowed us to construct a patentee–market network and patentee–technology network using two-mode network analysis, wherein the details of the patent market risks and patent technology risks can be investigated intuitively and comprehensively. Taking the AI technology field as a case study, the proposed patent-based multi-level network approach has been shown to be valid and robust. The initial effort has contributed to the AI technology field by identifying patent risks from comprehensive perspectives, not only displaying current technological development in the AI industry, but also enlightening future patent sustainable development in collaboration, market, and technology.
There are several interesting results that are worth noting. Regarding the market network, our study demonstrates that the U.S., WIPO, and China are the top three most popular patent filing countries or regions in the AI technology field, suggesting the main competition markets globally. As for the technology network, T01 (Digital Computers) dominates in the AI field, followed by T06 (Process and Machine Control), X25 (Industrial Electric Equipment), and S03 (Scientific Instrumentation). The research on the above technology fields has been very active and plays a crucial role in the AI field. When it comes to the patentee network, it is clear that compared to assignees from the U.S., the collaborative patent application levels of assignees from China, Japan, Germany, and Korea are relatively low, which leads to patent collaboration risks. In addition, we conclude that in the current period, national collaboration still dominates. The lack of international collaborations among assignees may lead to patent collaboration risks and hinder the development speed of the technological innovation process. Furthermore, most of the leading assignees, especially assignees from Chinese universities, lack industry–university–research (IUR) collaboration, which may lead to patent collaboration risks in the process of technological innovation cooperation.
Regarding the patentee-market network, assignees from the U.S., Korea, and Germany have comprehensive distribution in the major competitive market, especially the U.S., WIPO, and China, and most of them belong to large multinational enterprises with first mover advantages (e.g., GOOG-C, IBMC-C, and SMSU-C). In addition, Chinese assignees are regarded as latecomers in this field, severely lacking overseas patent applications. The lack of overseas patent applications, especially the lack of market distribution in the main competitive markets (e.g., the U.S., WIPO, etc.), will cause patent market risks when Chinese assignees face global competition in the future. As for the patentee–technology network, a great weakness is that most of the key patentees lack awareness of patent distribution in some important technological hotspots and fronts, including X25, S02 (Engineering Instrumentation), and X22 (Automotive Electrics). The lack of patent distribution in the key technological fields may cause patent technology risks incurred by fierce technological competition. Compared to the enterprises from the U.S., Germany, and Korea, most of the Chinese assignees, especially those from non-state-owned enterprises or universities, are lacking comprehensive patent distribution in key technological fields. The weakness in comprehensive patent distribution of technological domains may lead to patent technology risks, and become one reason why the AI field is not in a highly commercialized stage.
The above findings are useful for policy recommendations on preventing patent risks in the AI industry. First, we recommend strengthening international collaborations as well as IUR collaboration to confront patent collaboration risks in the process of technological innovation cooperation. Encourage patentees to actively carry out international collaborations with foreign patentees with competitive advantages. Specifically, patentees from different countries or regions can establish an international technology cooperation alliance in the AI technology field, which aims to establish international technology collaborations and working relationships, to provide potential opportunity for international patent collaboration, and to facilitate the development and industrialization of AI technology. In order to promote the transformation of AI technology from basic research to commercial application and strengthen IUR collaboration, it is necessary to build a systematic IUR collaboration platform, including three types of stakeholders, (1) universities, laboratories, and research centers; (2) technology innovation centers and spin-off enterprises of universities; and (3) technology transfer offices (TTOs). Universities should build TTOs because they are regarded as bridges to link basic research in universities and commercial applications in the market.
Second, speed up the pace of overseas patent distribution in the major competitive market, and prevent patent market risks in the competition of the global AI market. Most of the stakeholders need to pay close attention to patent distribution in European countries or regions. Considering that most of the Chinese assignees are severely lacking overseas patent applications, it is of great importance for Chinese stakeholders, especially universities, to file overseas patents in main competitive markets (e.g., the U.S., WIPO, etc.).
Third, pay close attention to important technological fields and blank spaces in the AI industry, and prevent patent technology risks. On the one hand, stakeholders should focus on the fierce technological competition in the following important technological fields: Digital Computers, Process and Machine Control, Industrial Electric Equipment, and Scientific Instrumentation. In order to avoid the duplication of R&D investment and prevent patent technology risks, stakeholders need to attach great importance to the leading patentees and their core patents in the above technological fields. On the other hand, stakeholders should seize technological opportunity and make up for the lack of patent distribution in the following technological fields: Industrial Electric Equipment, Engineering Instrumentation, and Automotive Electrics. Once an assignee has a comprehensive patent distribution in important technological fields, especially those blank spaces, this assignee will have a better capability to prevent patent technology risks and become a leading assignee in this field.
This study makes an important contribution toward identifying patent risks in the overall technological field by introducing a patent-based multi-level network model that has not appeared in the existing methodology of patent risk research. We make three contributions, inspired by recent advances in patent analysis as well as social network analysis. First, the proposed patent-based multi-level network model provides a new and comprehensive analytical framework for patent risk analysis in the overall technological field, which focuses on all the patents in the given technological field rather than those specific patents infringed by other patents. Our study also extends the research perspectives of patent risks, namely the market-level, technology-level, and patentee-level, and the patentee–market network and patentee–technology network integrating these three levels, and then identifies patent risks from comprehensive perspectives of collaboration, market, and technology. Second, it builds a patent-based multi-level networks model, which puts forward a new theoretical perspective for the existing research on patent risks. Owing to the simple process of retrieving patent data, this model offers a useful method for identifying patent risks in a target technology field. Third, this study uses a combination of methods to build the patent-based multi-level network, including data mining, patent analysis, two-mode network analysis, and social network analysis. By employing two-mode network analysis, the patentee–market network and patentee–technology network are proposed to analyze the patent market risk and patent technology risk. Furthermore, the proposed patent-based multi-level network model can be applied not only to AI, but to diverse other fields of emerging technology.
Despite the above contributions, there are still several limitations that future studies could explore. First, the research methods used in this paper still need further development. In addition to patent analysis and social network analysis, other methodologies, for instance, patent roadmap analysis, main path analysis, and patent citation analysis, would also be considered useful tools to reach the expected research goal. Specifically, patent roadmap analysis and main path analysis have been proven to be efficient approaches to illustrating and visualizing dynamic competitive advantages, and contribute to identifying patent risks in the technological innovation process. Patent citation analysis attempts to measure the qualities of patents, which can help confront patent risks more comprehensively. Second, with the rapid development of an emerging technology, the number of patents will increase rapidly, which leads to the dynamical change in the research results. Future studies could put more effort into the dynamic evolution of patent risks based on the technology life cycle (TLC).

Author Contributions

Conceptualization, X.Y. (Xi Yang); Data curation, X.Y. (Xi Yang); Formal analysis, X.Y. (Xi Yang); Methodology, X.Y. (Xi Yang); Software, X.Y. (Xi Yang); Supervision, X.Y. (Xiang Yu); Visualization, X.Y. (Xi Yang); Writing—original draft, X.Y. (Xi Yang); Writing—review & editing, X.Y. (Xi Yang) and X.Y. (Xiang Yu). All authors have read and agreed to the published version of the manuscript.

Funding

This research was supported by the 111 Project (No. B18058) and the National Natural Science Foundation of China (No. 71072033).

Acknowledgments

The first author would like to thank Martin G. Everett, the director of Mitchell Centre for Social Network Analysis, The University of Manchester. When I study at The University of Manchester, he not only provides me with very nice research conditions, but also offers me lots of valuable and constructive suggestions for my research.

Conflicts of Interest

The authors declare no conflict of interest.

References

  1. Chang, Y.W. Tracking scientometric research in Taiwan using bibliometric and content analysis. J. Libr. Inf. Stud. 2012, 10, 1–20. [Google Scholar]
  2. Choe, H.; Lee, D.H. The structure and change of the research collaboration network in Korea (2000–2011): Network analysis of joint patents. Scientometrics 2017, 111, 917–939. [Google Scholar] [CrossRef]
  3. Kim, H.; Song, J.S. Social network analysis of patent infringement lawsuits. Technol. Forecast. Soc. Chang. 2013, 80, 944–955. [Google Scholar] [CrossRef]
  4. Park, I.; Yoon, B. A semantic analysis approach for identifying patent infringement based on a product–patent map. Technol. Anal. Strateg. Manag. 2014, 26, 855–874. [Google Scholar] [CrossRef]
  5. Starr, C. Social benefits versus technological risks. Science 1969, 165, 1232–1238. [Google Scholar] [CrossRef]
  6. Haynes, J. Risk as an Economic Factor. Q. J. Econ. 1985, 9, 409–449. [Google Scholar] [CrossRef]
  7. Willett, A.H. The Economic Theory of Risk and Insurance; University of Pennylvania Press: Philadelphia, PA, USA, 1951. [Google Scholar]
  8. Knight, H.F. Risk, Uncertainty and Profit; Houghton Mifflin Company: Boston, MA, USA, 1921. [Google Scholar]
  9. Berglund, H.; Hellstrom, T. Enacting risk in independent technological innovation. Int. J. Risk Assess. Manag. 2002, 3, 205–221. [Google Scholar] [CrossRef] [Green Version]
  10. Panagopoulos, A.J. The Effect of IP Protection on Radical and Incremental Innovation Authors. J. Knowl. Econ. 2011, 2, 393–404. [Google Scholar] [CrossRef]
  11. Sandner, P.G.; Block, J. The market value of R&D, patents and trademarks. Res. Policy 2011, 40, 969–985. [Google Scholar]
  12. Hsu, P.H.; Lee, H.H.; Liu, A.Z.; Zhang, Z. Competitiveness in Technological Innovation and Its Implications for Bondholders; Social Science Electronic Publishing: Rochester, NY, USA, 2011. [Google Scholar]
  13. Russell, S.; Norvig, P. Artificial Intelligence—A Modern Approach; Upper Saddle River: Bergen, NJ, USA, 2010. [Google Scholar]
  14. Stone, P.; Brooks, R.; Brynjolfsson, E.; Calo, R.; Etzioni, O.; Hager, G.; Hirschberg, J.; Kalyanakrishnan, S.; Kamar, E.; Kraus, S.; et al. Artificial Intelligence and Life in 2030. One Hundred Year Study on Artificial Intelligence. Available online: https://ai100.stanford.edu/sites/g/files/sbiybj9861/f/ai100report10032016fnl_singles.pdf (accessed on 2 June 2020).
  15. Cath, C.; Wachter, S.; Mittelstadt, B.; Taddeo, M.; Floridi, L. Artificial Intelligence and the ‘Good Society’: The US, EU, and UK approach. Sci. Eng. Ethics 2018, 24, 505–528. [Google Scholar]
  16. The White House. American AI Initiative One Year Annual Report. Available online: https://www.whitehouse.gov/wp-content/uploads/2020/02/American-AI-Initiative-One-Year-Annual-Report.pdf (accessed on 10 June 2020).
  17. Strategic Council for AI Technology. Artificial Intelligence Technology Strategy. Available online: https://www.nedo.go.jp/content/100865202.pdf (accessed on 12 June 2020).
  18. The State Council of the People’s Republic of China. A Next Generation Artificial Intelligence Development Plan. Available online: http://www.gov.cn/zhengce/content/2017-07/20/content_5211996.htm (accessed on 15 June 2020).
  19. The State Council of the People’s Republic of China. Report on the Work of the Government (2019). Available online: http://english.www.gov.cn/premier/speeches/2019/03/16/content_281476565265580.htm (accessed on 20 June 2020).
  20. Snijders, T.A.B.; Bosker, R. Multi-Level Analysis; SAGE: London, UK, 1999. [Google Scholar]
  21. Snijders, T.A.B. The Multiple Flavours of Multilevel Issues for Networks. In Multilevel Network Analysis for the Social Sciences; Lazega, E., Snijders, T., Eds.; Springer: Berlin, Germany, 2016. [Google Scholar]
  22. Wang, P.; Robins, G.; Pattison, P.; Lazega, E. Exponential random graph models formultilevel networks. Soc. Netw. 2013, 35, 96–115. [Google Scholar] [CrossRef] [Green Version]
  23. Lazega, E.; Snijders, T.A. Multilevel Network Analysis for the Social Sciences; Springer: Heidelberg, Germany, 2016. [Google Scholar]
  24. Goeldner, M.; Herstatt, C.; Tietze, F. The emergence of care robotics—A patent and publication analysis. Technol. Forecast. Soc. Chang. 2015, 92, 115–131. [Google Scholar] [CrossRef] [Green Version]
  25. Bellotti, E. Getting funded. Multi-level network of physicists in Italy. Soc. Netw. 2012, 34, 215–229. [Google Scholar] [CrossRef]
  26. Lazega, E.; Jourda, M.T.; Mounier, L.; Stofer, R. Catching up with big fish in the big pond? Multi-level network analysis through linked design. Soc. Netw. 2008, 30, 159–176. [Google Scholar] [CrossRef] [Green Version]
  27. Snijders, T.A.B.; Lomi, A.; Torlò, V. A model for the multiplex dynamics of two-mode and one-mode networks, with an application to employment preference, friendship, and advice. Soc. Netw. 2013, 35, 265–276. [Google Scholar] [CrossRef] [Green Version]
  28. Everett, M.G.; Chiara, B.; Borgatti, S.P.; Johan, K. Measuring knowledge and experience in two mode temporal networks. Soc. Netw. 2018, 55, 63–73. [Google Scholar] [CrossRef] [Green Version]
  29. Bellotti, E.; Kronegger, L.; Guadalupi, L. The evolution of research collaboration within and across disciplines in Italian Academia. Scientometrics 2016, 109, 783–811. [Google Scholar] [CrossRef] [Green Version]
  30. Brennecke, J.; Rank, O. The firm’s knowledge network and the transfer of advice among corporate inventors—A multilevel network study. Res. Policy 2017, 46, 768–783. [Google Scholar] [CrossRef]
  31. Barnett, G.A.; Park, H.W.; Jiang, K.; Tang, C.; Aguillo, I.F. A multi-level network analysis of web-citations among the world’s universities. Scientometrics 2014, 99, 5–26. [Google Scholar] [CrossRef]
  32. Meredith, C. Connecting the Dots. A Social Network Perspective on Social-Organizational Processes in Secondary Schools; KU Leuven: Leuven, Belgium, 2017. [Google Scholar]
  33. Abbasi, A.; Hossain, L.; Uddin, S.; Rasmussen, K.J.R. Evolutionary dynamics of scientific collaboration networks: Multi-levels and cross-time analysis. Scientometrics 2011, 89, 687–710. [Google Scholar] [CrossRef] [Green Version]
  34. Blackman, M. Provision of patent information: A national patent office perspective. World Pat. Inf. 1999, 17, 115–123. [Google Scholar] [CrossRef]
  35. Reitzig, M.; Henkel, J.; Heath, C. On sharks, trolls, and their patent prey—Unrealistic damage awards and firm’s strategies of ‘being infringed’. Res. Policy 2007, 36, 134–154. [Google Scholar] [CrossRef]
  36. Wang, S. Research on the Patent Risk Assessment in Automatic Control Technology. In Proceedings of the 2012 International Conference on Computer Science and Electronics Engineering, Hangzhou, China, 23–25 March 2012. [Google Scholar]
  37. Leon, I.D.; Donoso, J.F. The Impact of IP Risk in the Development of IP Markets. In Innovation, Startups and Intellectual Property; Leon, I.D., Donoso, J.F., Eds.; Springer: Berlin/Heidelberg, Germany, 2017. [Google Scholar]
  38. Lee, C.; Song, B.; Park, Y. How to assess patent infringement risks: A semantic patent claim analysis using dependency relationships. Technol. Anal. Strateg. Manag. 2013, 25, 23–38. [Google Scholar] [CrossRef]
  39. Jun, S.; Park, S. Examining technological competition between BMW and Hyundai in the Korean car market. Technol. Anal. Strateg. Manag. 2016, 28, 156–175. [Google Scholar] [CrossRef]
  40. Wang, S.; Wang, H. Evaluation method on R&D alliance patent risk based on cloud model. In Proceedings of the Management Science and Industrial Engineering International Conference (MSIE), Harbin, China, 8–9 January 2011. [Google Scholar]
  41. Shin, J.; Park, Y. Generation and application of patent claim map: Text mining and network analysis. J. Intellect. Prop. Rights 2005, 10, 198–205. [Google Scholar]
  42. Kasravi, K.; Risov, M. Multivariate patent similarity detection. In Proceedings of the 42nd Hawaii International Conference on System Sciences, Big Island, HI, USA, 5–8 January 2009. [Google Scholar]
  43. Lee, S.; Yoon, B.; Park, Y. An approach to discovering new technology opportunities: Keyword-based patent map approach. Technovation 2009, 29, 481–497. [Google Scholar] [CrossRef]
  44. Tseng, C.Y. Technological innovation and knowledge network in Asia: Evidence from comparison of information and communication technologies among six countries. Technol. Forecast. Soc. Chang. 2009, 76, 654–663. [Google Scholar] [CrossRef]
  45. Tsai, C.Y.; An, N.N. Network Analysis of Patent Infringement Lawsuits in Pharmaceutical Industry. In Proceedings of the Fourth International Conference on Informatics & Applications, Okayama, Japan, 12–16 July 2015. [Google Scholar]
  46. Borgatti, S.P.; Everett, M.G.; Freeman, L.C. UCINET 6 for Windows: Software for Social Network Analysis; Analytic Technologies: Cambridge, MA, USA, 2002. [Google Scholar]
  47. Derwent Innovation Index. Derwent Innovation. 2020. Available online: https://clarivate.com/products/derwent-innovation/ (accessed on 20 March 2020).
  48. Huang, L.; Miao, W.; Zhang, Y.; Yu, H.Z.; Wang, K.R. Patent Network Analysis for Identifying Technological Evolution: A Case Study of China’s Artificial Intelligence Technologies. In Proceedings of the 2017 Portland International Conference on Management of Engineering and Technology, Portland, OR, USA, 9–13 July 2017. [Google Scholar]
  49. Tang, L.; Shapira, P.; Youtie, J. Is there a clubbing effect underlying Chinese research citation increases? J. Assoc. Inf. Sci. Technol. 2015, 66, 1923–1932. [Google Scholar] [CrossRef] [Green Version]
  50. Zheng, J.; Zhao, Z.Y.; Zhang, X.; Chen, D.Z.; Huang, M.H. International collaboration development in nanotechnology: A perspective of patent network analysis. Scientometrics 2014, 98, 683–702. [Google Scholar] [CrossRef]
  51. Érdi, P.; Makovi, K.; Somogyvári, Z.; Strandburg, K.; Tobochnik, J.; Volf, P.; Zal´anyi, L. Prediction of emerging technologies based on analysis of the U.S. patent citation network. Scientometrics 2013, 95, 225–242. [Google Scholar] [CrossRef] [Green Version]
  52. Criscuolo, P. The ‘home advantage’ effect and patent families. A comparison of OECD triadic patents, the USPTO and the EPO. Scientometrics 2006, 66, 23–41. [Google Scholar] [CrossRef]
  53. Freeman, L.C. A set of measures of centrality based on betweenness. Sociometry 1977, 40, 35–41. [Google Scholar] [CrossRef]
  54. Freeman, L.C. Centrality in social networks: Conceptual clarification. Soc. Netw. 1979, 1, 215–239. [Google Scholar] [CrossRef] [Green Version]
  55. Bonacich, P. Factoring and weighting approaches to status scores and clique identification. J. Math. Sociol. 1972, 2, 113–120. [Google Scholar] [CrossRef]
  56. Li, B.; Hou, B.; Yu, W.; Lu, X.; Yang, C. Applications of artificial intelligence in intelligent manufacturing: A review. Front. Inf. Technol. Electron. Eng. 2017, 18, 86–96. [Google Scholar] [CrossRef]
  57. Wurtz, F.; Bigeon, J.; Poirson, C. A methodology and a tool for the computer aided design with constraints of electrical devices. IEEE Trans. Magn. 1996, 32, 1429–1432. [Google Scholar] [CrossRef]
  58. Patel, V.L.; Shortliffe, E.H.; Stefanelli, M.; Szolovits, P.; Berthold, M.R.; Bellazzi, R.; Abu-Hanna, A. The coming of age of artificial intelligence in medicine. Artif. Intell. Med. 2009, 46, 5–17. [Google Scholar] [CrossRef] [Green Version]
Figure 1. The outline of research process.
Sustainability 12 08667 g001
Figure 2. Artificial intelligence patents by country/region.
Sustainability 12 08667 g002
Figure 3. Schema of the proposed patent-based multi-level network on patent risks.
Sustainability 12 08667 g003
Figure 4. The market network diagram of artificial intelligence technology. US—United States Patent and Trademark Office, WIPO—World Intellectual Property Organization, CN—National Intellectual Property Administration, PRC, JP—Japanese Patent Office, KR—Korean Intellectual Property Office, EPO—European Patent Office, DE—German Patent and Trademark Office, GB—Intellectual Property Office, United Kingdom, TW—Taiwan Intellectual Property Office, CA—Canadian Intellectual Property Office.
Sustainability 12 08667 g004
Figure 5. The technology network diagram of artificial intelligence technology.
Sustainability 12 08667 g005
Figure 6. The patentee network diagram of artificial intelligence technology.
Sustainability 12 08667 g006
Figure 7. The patentee–market 2-mode network diagram of artificial intelligence technology.
Sustainability 12 08667 g007
Figure 8. The patentee–technology 2-mode network diagram of artificial intelligence technology.
Sustainability 12 08667 g008
Figure 9. The patentee–technology sub-network diagram of artificial intelligence technology.
Sustainability 12 08667 g009
Table 1. Technological hotspots and fronts of artificial intelligence technology.
Derwent Class CodeTechnological FieldsBetweenness CentralityDegree CentralityEigenvector Centrality
T01Digital Computers8557.1161700.293
T06Process and Machine Control1529.0391030.243
X25Industrial Electric Equipment606.145710.187
S03Scientific Instrumentation597.972760.213
T04Computer Peripheral Equipment373.217680.207
W04Audio/Video Recording and Systems255.737630.204
S02Engineering Instrumentation220.156560.184
W01Telephone and Data Transmission Systems160.088550.193
X22Automotive Electrics155.736450.154
S05Electrical Medical Equipment130.458480.171
Table 2. Degree centrality of artificial intelligence lead assignees from jointly applied patents.
AssigneeDegree CentralityCountry Origin
SGCC-C35China
ITLC-C15the U.S.
SONY-C14Japan
CODE-Non-standard14the U.S.
MICT-C12the U.S.
SIEI-C11Germany
IBMC-C11the U.S.
QCOM-C11the U.S.
SMSU-C10Korea
BRAI-Non-standard9the U.S.
SGCC-C—STATE GRID CORP CHINA, ITLC-C—INTEL CORP, SONY-C—SONY CORP, CODE-Non-standard—CODEXIS MAYFLOWER HOLDING LLC, MICT-C—MICROSOFT CORP, SIEI-C—SIEMENS AG, IBMC-C—International Business Machines Corp, QCOM-C—QUALCOMM INC, SMSU-C—Samsung Electronics Co., Ltd., BRAI-Non-standard—BRAIN CORP.
Table 3. Top 20 assignees holding AI patents.
AssigneeNumber of PatentsCountry Origin
IBMC-C941the U.S.
MICT-C308the U.S.
GOOG-C290the U.S.
SGCC-C198China
SMSU-C160Korea
NIDE-C156Japan
UYQI-C147China
QCOM-C136the U.S.
ITLC-C131the U.S.
SIEI-C129Germany
UYSC-C125China
UEST-C120China
FUIT-C103Japan
UYZH-C103China
FABK-C101the U.S.
UTIJ-C95China
UYXN-C93China
BIDU-C90China
UYBT-C82China
BEIJ-N76China
GOOG-C—GOOGLE INC, NIDE-C—NEC CORP, UYQI-C—UNIV TSINGHUA, UYSC-C—UNIV SOUTH CHINA TECHNOLOGY, UEST-C—UNIV CHINA ELECTRONIC SCI & TECHNOLOGY, FUIT-C—FUJITSU LTD, UYZH-C—UNIV ZHEJIANG, FABK-C—FACEBOOK INC, UTIJ-C—UNIV TIANJIN, UYXN-C—UNIV XIDIAN, BIDU-C—BAIDU ON-LINE NETWORK TECHNOLOGY CO LTD, UYBT-C—UNIV BEIJING TECHNOLOGY, BEIJ-N—CAS CAMBRICON TECHNOLOGY CO LTD.
Table 4. Important technological fields in the patentee–technology network of artificial intelligence technology.
Derwent Class CodeTechnological FieldsBetweenness CentralityDegree CentralityEigenvector Centrality
T01Digital Computers271.019200.243
T04Computer Peripheral Equipment271.019200.243
W01Telephone and Data Transmission Systems237.488190.231
W04Audio/Video Recording and Systems233.145190.232
S03Scientific Instrumentation172.673140.195
T06Process and Machine Control171.000150.201
S05Electrical Medical Equipment144.910150.192
W02Broadcasting, Radio and Line Transmission Systems130.688130.180
B04Natural products and polymers110.358120.164
W06Aviation, Marine and Radar Systems107.909130.170
Publisher’s Note: MDPI stays neutral with regard to jurisdictional claims in published maps and institutional affiliations.

