1. Introduction
Numerous studies have demonstrated the importance of tourism as an instrument of economic growth. Generally speaking, scientific literature agrees that tourism contributes to the generation of income for the host country through exportations, fostering an increased GDP for said country [
1,
2,
3,
4,
5].
What is not so clear, however (and what, until recently, was considered an undisputed fact), is the role of tourism as an instrument of development. Currently, this relationship has generated increasing debate within the scientific literature, as demonstrated by some recent studies [
6,
7,
8,
9,
10,
11,
12]. In general, this role has been recognized, assuming that a series of circumstances exists that favor the transformation of tourism growth into economic development [
13]; but these circumstances do not always exist.
Scientific literature agrees that the success of a tourism destination depends not only on its growth, but also on two objectives which, although seemingly obvious, are often forgotten. On the one hand, it is necessary to ensure a sufficient income from the tourism which, through appropriate policies, will result in an increased quality of life for the local population. And, secondly, it should also generate a supply that satisfies the needs and expectations of the tourists; ultimately, it should improve the quality of the tourism experience. For this reason, in this article, the “success” of a tourism destination is understood as the efficiency in the capacity to generate tourism income and to improve the tourist experience from a given volume of tourist flows. Despite the fact these two objectives have been clearly recognized in the tourism literature, currently the main measure of success of a tourism destination is the increase in tourist flow. Indeed, in the prevailing discourse of politicians, policymakers and tourism managers, an increase in this variable is the most frequently used data to justify their actions.
Today, an increase in the volume of tourist arrivals is considered to be a clear symptom of success for tourism managers. However, an increase in this variable does not guarantee that either of the two proposed objectives will be achieved. On the contrary, there is increasing evidence that increased tourist flow may actually be a detriment to the quality of the tourism experience [
14,
15,
16], at least for the main international tourist destinations, in which the carrying capacity may be exceeded, although it would be debatable for emerging destinations, more concerned with increasing tourist flows than with the quality of the tourist experience or the income generated by these flows. Furthermore, as this article demonstrates, no direct relationship exists between the increase in tourist flow and an increase in the tourism-generated income.
Recently, this structural objective of increasing the number of tourists, to the detriment of other variables, has led to unsustainable situations in a growing number of tourism destinations [
17,
18]. It has resulted in serious debates as to how much tourism should actually increase and the need to measure success not in terms of “more” but of “better”, regardless of how this “better” may be distributed amongst the stakeholders.
Thus, the main purpose of this paper is demonstrating that the increase of generated income from international tourism has a more significant relevance than the increase of international tourists’ arrival, so that the economic growth of a territory is not directly linked to the tourism flow, which, on the contrary, can negatively affect the sustainable development of tourism in a given country.
Therefore, the hypothesis guiding this study is two-fold. First, there is the idea that, in contrast to common belief, an increase in tourism flow is not the best measure to use when assessing the contribution of tourism to a territory’s economic growth. Rather, it is more useful to consider the volume of income generated by this tourism. And, second, there is the affirmation that territories that are more efficient in generating income from tourism will be more competitive, in terms of tourism.
In this article, an international study was conducted, based on data from the United Nations’ World Tourism Organization (hereinafter UNWTO) and the World Economic Forum (hereinafter WEF) for a set of 93 countries and considering the “international tourist arrivals at frontiers” as the variable to measure the arrival of tourists—the most commonly used variable on an international level.
To test the first hypothesis, an estimation of inverse demand-income elasticity was used, based on a logarithmic regression function. The second hypothesis relied on a correlation analysis to contrast the competitiveness values provided by the WEF for each of the analyzed countries and the residual values generated from the regression model for each country.
2. Literature Review
There is consensus in the scientific literature to consider the Gross Domestic Product (GDP) as the most widely used quantitative measure of economic development [
19]. From an expenditure point of view, tourism activity directly impacts several components of GDP, such as final consumption, gross capital formation, government spending and, above all, exportations. Indeed, when international visitors spend money in another country, they are generating income from tourism for that country (international tourism receipts), which increases their volume of net exportations. Consequently, tourism always impacts economic growth, although this impact is not the same every year [
20] or in all countries.
The greater the volume of international visitors, the greater the GDP generated as a consequence of tourism. However, this relationship between visitors and GDP is neither proportional nor constant over time in all countries of the world. The reason is that the international tourism visitors’ impact on GDP depends not only on its volume but also on the average expenditure per tourist and on other non-economic factors. These factors include the origin country’s population, the origin country’s income, the cost of living of tourists in the destination country, the transport cost between origin and destination, the value of trade (exports and imports) [
21]; tourist education, security at the destination [
22]; political instability, terrorism, natural disasters [
23,
24,
25], etc.
2.1. Measuring the Economic Growth Based on Tourism Development
There is a considerable literature on the economic effects of tourism (economic revitalization through multipliers, improvement of the balance of payments, employment generation, reduction of poverty, etc.) which, as Fletcher (2008) [
26] recognized, tends to be exaggerated. As Hall and Page (2006) [
27] and Stabler et al. (2010) [
28] suggested, the lack of social recognition of tourism, with regard to the importance of its contribution to the economy, leads to an ongoing need for the tourism industry to vindicate this importance, which is more of an attempt to legitimize a political position than an attempt to seek the truth about the economic value of tourism.
Most of the studies conducted on the economic effects of tourism (including, most recently, those by [
1,
29,
30,
31,
32,
33,
34], have focused on the role of tourism as an engine of economic growth, demonstrating, in most cases, that a direct relationship exists between the growth of tourism and the economic growth of the territories where it takes place.
Dwyer et al. (2010: 222) [
35] insist that it is important to clearly differentiate between the “economic benefits of tourism”, the “economic impact of tourism” and the “economic contribution of tourism”. Along these lines, Sahli and Nowak (2007) [
11] suggest that tourism may generate economic costs that are so high that they may ultimately impoverish the host population. Along with the criticism of the popular belief and the implicit affirmation (in most of the literature) of the idea that tourism is an effective vehicle for the improvement of the wellbeing of developing countries, other contributions have begun to arise, including those of Kingsbury (2005) [
8], Intermon Oxfam (2007) [
36] and UNDP (2011) [
12].
Authors such as Hall and Page (2006) [
27] and Stabler et al. (2010) [
28] attempted to politically and socially legitimize the economic relevance of tourism and to offer their support through financial resources, laws, planning, regulation, taxation or subsidies. The prevailing discourse of politicians, policymakers and tourism managers has argued that the main measure of success of a tourism destination is an increase in tourism flows.
Thus, a sort of vicious circle is created, since, as Su and Lin (2014: 47) [
37] stated: “as the number of tourists increases, governments and private enterprises around the world have been eager to expand their tourism”. Competition is on the rise among destinations (regardless of their territorial level) to attract a larger volume of tourism flows, and more and more studies are being conducted to analyze the essential elements influencing tourism demand, as these same authors recognize.
Ultimately, this has generated a whirlpool of growth in tourism volume, placing more and more tourism destinations at risk [
17,
18], given that the reception capacity is clearly being exceeded as a result of this so-called “the more tourists, the better” strategy.
This excessive tourism flow ultimately acts as a weapon against the achievement of what should be the two basic objectives of any tourism destination: quality of life of the local population and quality of the tourist experience. Thus, it negatively affects the destination’s capacity to position itself in the market, weakening its possibilities of competing under ideal conditions.
Compared to countries or groups of countries that are increasing their receipts from tourism more than the number of their international visitors (because the average expenditure per tourist in those countries has increased), other countries are experiencing increases in their income from tourism in a less proportional way than their increases in the number of visitors, perhaps as a result of a reduction in the average cost per tourist. Furthermore, as noted by Wang and Davidson (2010) [
38], the use of tourist arrivals, which does not reflect tourist consumption and spending patterns (which depend on the demographic characteristics of the tourist, the length of the stay, the type of accommodation chosen, the purpose of the visit and many other factors), does not accurately measure the economic impact of tourism on a destination. Instead, Wang et al. (2006, p. 333) [
39] pointed out that tourism spending is “typically scrutinized by policy-makers, planning officials, marketers and researches for monitoring and assessing the impact of tourism on the local economy”.
Consequently, the volume of international travelers as a barometer of the tourist success of different countries may be valid in some cases, but not in all. According to Webster and Ivanov (2014) [
40], some tourist destinations are attracting more visitors, but this does not automatically mean that the local population is actually benefiting from the development of tourism. Therefore, tourist destinations should not only worry about attracting tourists, but also about translating these tourist flows into monetary flows (receipts) and achieving an equitable distribution of them among the local population. This is not a trivial issue, since in the tourism development of a destination it should be essential to verify that the economic benefits of tourism are resulting in a positive perception by the local population and in the belief that this activity is benefiting them economically [
41]. Local populations’ perception of tourism depends on numerous factors, including the level of tourism development, the sociodemographic characteristics of the population, the interaction between the local population and tourists and the spatial proximity to tourism attractions [
42,
43]. Nevertheless, the truth is that the number of tourists received by a tourist destination is no longer the primary barometer of tourist success, especially on the local level.
2.2. The Relationship “Tourism Flows-Tourism Receipts’ Impacts”
The uncontrolled increase of tourists in a certain destination can generate a serious problem of crowding. This massification, which may be seen in cases such as Venice [
44,
45,
46,
47], Crete [
48], Dubrovnik [
49], Ibiza [
50] or Magaluf and Lloret del Mar [
51], etc., puts personal safety and possession security at risk [
52], affects consumer perception of the quality of the service, decreases overall consumer satisfaction and behavior toward the destination [
53,
54,
55,
56] and even causes a delay in the intent to travel to the destination [
57]. It is specifically in these overcrowded tourist destinations that it makes more sense to grow in terms of tourism income, as opposed to number of visitors (where this growth should be zero and even, in some cases, negative).
According to the UNWTO Tourism Highlights report [
58], in 2017, total international tourist arrivals increased worldwide by 7% compared to 2016, while total international tourism receipts only rose by 5%, revealing a contraction of the average expenditure per tourist.
But the most striking fact from this report relates to the distribution by continents of tourism arrivals and receipts. International tourist arrivals to Europe represent 51% of the total, yet their tourism income only represents 39% of the total. Africa faces a similar situation, with 5% of world arrivals and 3% of the global tourism revenues. The Americas, however, welcome 16% of all international tourists, but generate 24% of the global tourism revenues. Meanwhile, Asia and the Pacific receive 24% of the arrivals and 29% of the revenue. These simple data reveal how the impact of tourism on the economy, if measured exclusively by the number of international tourist arrivals, may present a distorted view of reality. If, however, we relate tourism revenues to economic development, an alternative measure of tourism success would be used, and, in some cases, it would permit the quantification of tourism’s impact on the economy.
The previous idea leads us to propose a classification of countries in terms of tourist success into two large groups: efficient countries, which are those that manage to increase their tourism income as opposed to increasing their visitors; and inefficient countries, which are those whose tourism revenues grow at a slower rate than their visitor flows.
While the relationship between tourism income and the economic growth of a country has been widely analyzed [
59,
60,
61,
62,
63], the relationship between international visitors and tourism revenues has received little attention in the scientific literature. Of the few studies addressing this relationship, we refer to Popescu (2016) [
64], Turczak (2016) [
65] and Göral (2016) [
66]. Popescu (2016) [
64] quantified the Bravais–Pearson correlation coefficient for the number of international tourist arrivals and tourism receipts between 2009 and 2015 with a value of 0.925 worldwide and 0.967 for the EU. Turczak’s study (2016) [
65] defines two ratios that relate visitors and tourism income for 46 countries with data for Mexico, defining a double entry matrix with four quadrants based on high or low values of both ratios and placing the 46 countries analyzed in one of the four boxes of the matrix. Finally, Göral (2016) [
66] does not establish a direct relationship between arrivals and receipts, but it does establish one between these two figures and the Tourism Competitiveness Index (TTCI) for a total of 138 countries. The author concludes that when a country’s competitive capacity increases, the number of tourists and tourism-based income also increases. Finally, it must be noted that as competition grows between destinations, improving in terms of competitiveness has become one of the main goals of all current tourism destinations. Furthermore, over recent years, identifying and measuring the variables that condition competitiveness has become one of the major goals of tourism researchers. Indeed, over the past decade, researchers have placed a special interest on the identification, measurement and systemization of variables that condition the competitiveness of host countries, an aspect that is of great importance for management decision making, both by policymakers and destination managers, by different tourism entrepreneurs and even by the general stakeholders [
67]. In addition, the identification of variables contributing to tourists’ willingness to pay more is a key aspect for generating a larger volume of tourism receipts, while maintaining the same level of tourist flows. Sustainability, for example, is one of the most highly valued aspects by certain types of tourists, who are willing to pay more when travelling [
68,
69].
The present paper aims to contribute to completing these studies, going beyond the calculation of simple ratio or correlation coefficients. Specifically, with a methodology based on regression models and on the calculation of the residuals derived from them, the aim is to show that the relationship between tourism arrivals and tourism expenditure is not the same for all countries and that some countries have a higher capacity to generate more tourism income from a given volume of tourism arrivals than other countries.
3. Methodological Framework
To determine whether or not the volume of international travelers entering countries results in the proportional generation of income from tourism and to verify whether or not this relationship between travelers and income has changed over recent years, official data from the UNWTO (2016) [
70] has been used. Although the UNWTO offers information on the volume of international travelers for over 200 countries, the data that it provides is not completely homogeneous. Therefore, these countries are not directly comparable. For most countries, international tourist arrivals at frontiers (overnight visitors, excluding same-day visitors) are provided; in other, less common cases, international visitor arrivals at frontiers (tourists and same-day visitors) are offered. In other countries, the figures refer exclusively to international tourist arrivals at hotels and similar establishments or international tourist arrivals at collective tourism establishments. So, the count of the number of same-day visitors has been excluded, and only the figure for the international tourist arrivals at frontiers has been considered, since this is the most common magnitude of the statistics offered by the UNWTO, and also a better count of the total volume of international tourists (since it considers arrivals at frontiers).
Since the figures for international tourist arrivals at frontiers (in thousands of arrivals) are provided for the years 2010 and 2015 (for the previous years, the data series is quite incomplete, preventing us from conducting a robust statistical analysis), as well as the income from international tourism (in US$ millions in real terms, i.e. taking into account rate fluctuations and inflation), a total sample of 93 countries was used for this article.
Based on the statistical information available, the method used in this paper was an estimation of inverse demand-income elasticity, with the purpose of determining the percentage change in income generated from international tourism when the percentage change in international tourist arrivals at frontiers is 1%. Specifically, the following model is proposed:
where
represents the income from international tourism of the
i-th country, and
is the volume of international tourist arrivals at the frontiers of the
i-th country. The estimate of the previous model is as follows:
with
being the international tourist arrivals-income elasticity for tourism, that is, it quantifies the percentage change in income from tourism when a unitary percentage change takes place in the international tourist arrivals at frontiers.
So, assuming that this elasticity is always positive (given that an increase in the number of international tourist arrivals is anticipated which should result, to a greater or lesser extent, in an increase in income from tourism), its potential values should be interpreted as follows:
- (a)
If , the income from tourism is inelastic, that is, it is not sensitive to changes in international tourist arrivals, since unitary percentage increases in the latter lead to less than proportionate increases in income from tourism.
- (b)
If , the income from tourism is unitary, given that unitary percentage increases in international tourist arrivals also generate unitary percentage increases in income from tourism.
- (c)
Finally, if , the income from tourism is elastic, that is, it is very sensitive to changes in international tourist arrivals, given that in the face of unitary percentage increases in the latter, the increase in income from tourism is more than proportional.
The calculation of residuals from the estimated model is carried out according to the following expression:
It is evident that these residuals permit a comparison between the income from tourism that is anticipated for the i-th country in function of its level of international tourist arrivals (estimated) and the income from tourism that was actually generated (observed).
So, if , the income from tourism generated by the country shall exceed the income from tourism that is anticipated based on the volume of international tourist arrivals. Thus, countries with positive residuals are efficient, in terms of tourism, given that for each international tourist visiting their country, they are capable of generating more income than expected.
On the other hand, if , the income from tourism generated by the country falls below the income from tourism that is anticipated based on the international tourist arrivals received by the country. Thus, countries with negative residuals are considered to be inefficient in terms of tourism, since they are incapable of generating the anticipated income for each international tourist that they receive.
4. Results and Discussion
In an initial consideration of the two data series analyzed in this article (international tourist arrivals and income from tourism) for the 93 countries in the sample, the percentage variation for both variables has been calculated for the period between 2010 and 2015.
The results demonstrate that, while in the majority of countries (49 of the 93, or 52%) the increase in income from tourism was higher than the increase in international tourist arrivals, and a very large percentage of countries had income from tourism that increased at a lower rate than the international tourist arrivals between 2010 and 2015 (48% of the countries in the sample).
This clearly highlights the fact that, over recent years, the average income per tourist has lowered in many countries. Therefore, the evolution of both magnitudes in recent years reveals that the volume of international tourists received by each country is a variable of decreasing interest, and what is truly relevant is the volume of income generated by said tourists, given that this income results in national wealth and an improved quality of life of the resident population. That decreasing interest is one of the current signals that prompted the efforts made by the different countries to reach a balance between economic growth and sustainable development which ensures the availability and quality of the territory resources to keep generating income in a long-term run.
Therefore, the fact that a country increased its volume of international tourist arrivals by 10% over a specific period of time is not of special relevance if, during this same period, the income from tourism only increased by 3% (for example). Secondly, a country in which the volume of international tourist arrivals only increased by 1% (as compared to greater increases in other countries) does not necessarily represent a poor performance if this increase in tourists has generated an increase of, say, 5% in the volume of income from tourism. This idyllic scenario may represent the main objective of countries in which tourism activity is being developed. The sustainable development of tourism requires a management based on the premise that local resources are scarce, so sustainability dimensions must be considered as equally important to generate income and preserve natural and cultural resources. By planning tourism, tourists’ arrivals can be predicted and regulated in order to avoid prevent the carrying capacity from being overwhelmed.
So, for example, as Annex 1 reveals, in the 2010–2015 period, the United Kingdom increased its volume of international tourist arrivals by 21.7%, whereas its volume of income from tourism increased by 38.2%. Similarly, although during this same period the international tourist arrivals of the United States increased by 29.2%, its volume of income from tourism rose by 49.3%. In addition, in some countries in Europe (global tourism leaders), the evolution of these two tourism magnitudes has been quite distinct. This is the case with Spain, where international tourist arrivals increased by 29.5% between 2010 and 2015, yet income from tourism increased by only 3.5%. In Italy, a similar situation is found, with an increase of 16.3% in the number of international tourist arrivals but of only 1.71% in income from tourism. In France however, the situation is even more dramatic, given that over the last five years, the flow of tourists has grown by 8.7%, but the income from tourism has decreased by some 2.3%. Thus, France is the clearest example of the importance of the volume of income from tourism variable (as opposed to the volume of international tourism arrivals) as a reference of the evolution of the sector.
Table 1 presents the estimates of the model (1) for the years 2010 and 2015. It is evident that the model’s adjustment to the analyzed data is quite good, since the coefficient of determination is equal to 0.898 for 2010 and 0.892 for 2015. Moreover, although the constant term
is not statistically significant for either of the two years, what actually matters is that in the estimated model, the elasticity
is indeed statistically significant. Thus, in 2010, this parameter reached an estimated value of 0.964, meaning that for the set of 93 countries under study, an increase of 10% in the volume of international tourism arrivals generated an average increase of 9.64% in income from international tourism. So, in 2010, the income from tourism was slightly inelastic.
Furthermore, in 2015, the estimated value for elasticity was 0.952, meaning that the growth in international tourism arrivals of 10% in 2015 produced an average increase in income from tourism of 9.52%. Therefore, in 2015, income from tourism was somewhat less elastic than in 2010.
These results, which allow us to classify the analyzed countries as either elastic or inelastic (as shown in Annex 2), confirm that an increase in the number of tourists received by a country no longer has such a direct result on the generation of wealth. The contraction of the mean tourist expense (as a direct result of the global economic crisis of recent years) and the reduction of the mean stay in the destination (as a result of changes in tourist habits, with a preference for shorter trips every year) are factors that have led to lower increases in income from tourism, as compared to the increases in tourism flows. So, it appears to be more and more reasonable to quantify the success of a country’s tourism sector based on the volume of tourism income that is generated, as opposed to the volume of tourists that the country receives.
So, it may be suggested that the strategic objective of some countries is not the volume of international tourists, but rather the amount spent by these tourists when in the country. For example, considering the figures from 2015, Lebanon received slightly over 1.5 million tourists, resulting in an income from tourism of 6.857 billion US dollars. However, Mozambique, with a virtually identical volume of tourists, generated a tourism income of only 193 million US dollars. This notable difference may be justified by the fact that the mean expense per international tourist in Lebanon was 4517 US dollars, whereas in Mozambique it was only 124 US dollars.
Once the tourist-income elasticity has been estimated, a calculation of residuals is conducted, using expression (3) and classifying the 93 countries of the sample as either efficient or inefficient, from a tourism point of view (Annex 3). Furthermore, the calculation of these residuals for 2010 and 2015 has allowed us to conduct a dynamic analysis to determine which countries have improved their tourism efficiency and which countries have decreased in terms of efficiency. The results of this analysis appear in
Table 2.
As
Table 2 reveals, the majority of the analyzed countries (83 of the 93 countries in the sample) maintained their level of efficiency (or inefficiency) between 2010 and 2015. Specifically, 48 countries were efficient in 2010 and continued to be efficient in 2015. Additionally, 35 countries were inefficient in 2010, with this number remaining the same in 2015. Even more interesting is the fact that significant changes took place in 10 countries over these five years. So, there are three countries that considerably improved their level of tourism efficiency, being inefficient in 2010 and becoming efficient in 2015. These three countries are Azerbaijan, the Philippines and Qatar. Finally, there are seven countries that experienced a reversal of their level of tourism efficiency, going from efficiency in 2010 to relative inefficiency in 2015. These countries are Armenia, the Czech Republic, Greece, Grenada, Argentina, Reunion and Egypt.
Table 3 presents the relationship of the five countries having the most and the least residuals. Alternatively, it reflects the ranking of the more efficient and more inefficient countries, for both 2010 and 2015.
It can be seen that Lebanon, India and the United States are the three countries in the sample boasting the highest degrees of tourism efficiency. These three countries also managed to increase their residuals between 2010 and 2015. In 2010, Lebanon generated income from international tourism that was 4.4 times greater than anticipated, based on international tourism arrivals. In 2015, this relationship between real income from tourism and estimated income from tourism increased to 5.0. India and the United States reported similar situations. The real income from tourism in India was 3.1 times greater (in 2010) and 3.2 times greater (in 2015) than the anticipated incomes, based on its international tourism arrivals. Real income from tourism in the United States was 3.1 times greater (in 2010) and 3.5 times greater (in 2015) than the anticipated tourism income. In this ranking, the appearance of China and the disappearance of the Maldives in 2015 are noteworthy. In the specific case of China, its income from international tourism in 2015 was 2.7 times greater than the anticipated income based on its volume of international tourism arrivals (while in 2010 its observed income was only 10% greater than the anticipated income).
On the other hand, Ukraine, Mozambique and Laos are the three countries in the sample revealing the highest level of tourism inefficiency, since their real income from international tourism was considerably lower than expected. In Ukraine, there was a significant increase in residuals experienced between 2010 and 2015, perhaps caused by this country’s serious political instability over recent years. Specifically, in 2010, Ukraine’s real income from international tourism represented only 23% of the income that was expected based on its volume of international tourism arrivals, with this percentage dropping to 11% in 2015, revealing the tourism inefficiency of this country. Laos was found to be in a similar situation, although to a less dramatic extent, with a real income from tourism that was 27% of its anticipated income in 2010, and 22% in 2015. The case of Mozambique is different, since, unlike Ukraine and Laos, it has managed to improve its level of tourism inefficiency somewhat. In 2010, its real income represented only 7% of its anticipated income, but in 2015 the real income represented 14% of the anticipated income. However, Mozambique was the least efficient country in 2010 and the second least efficient in 2015. Finally, we also note the appearance of Tunisia and Guyana, and the disappearance of Myanmar and Suriname from the ranking of the least efficient countries of 2015, as compared to their status in 2010.
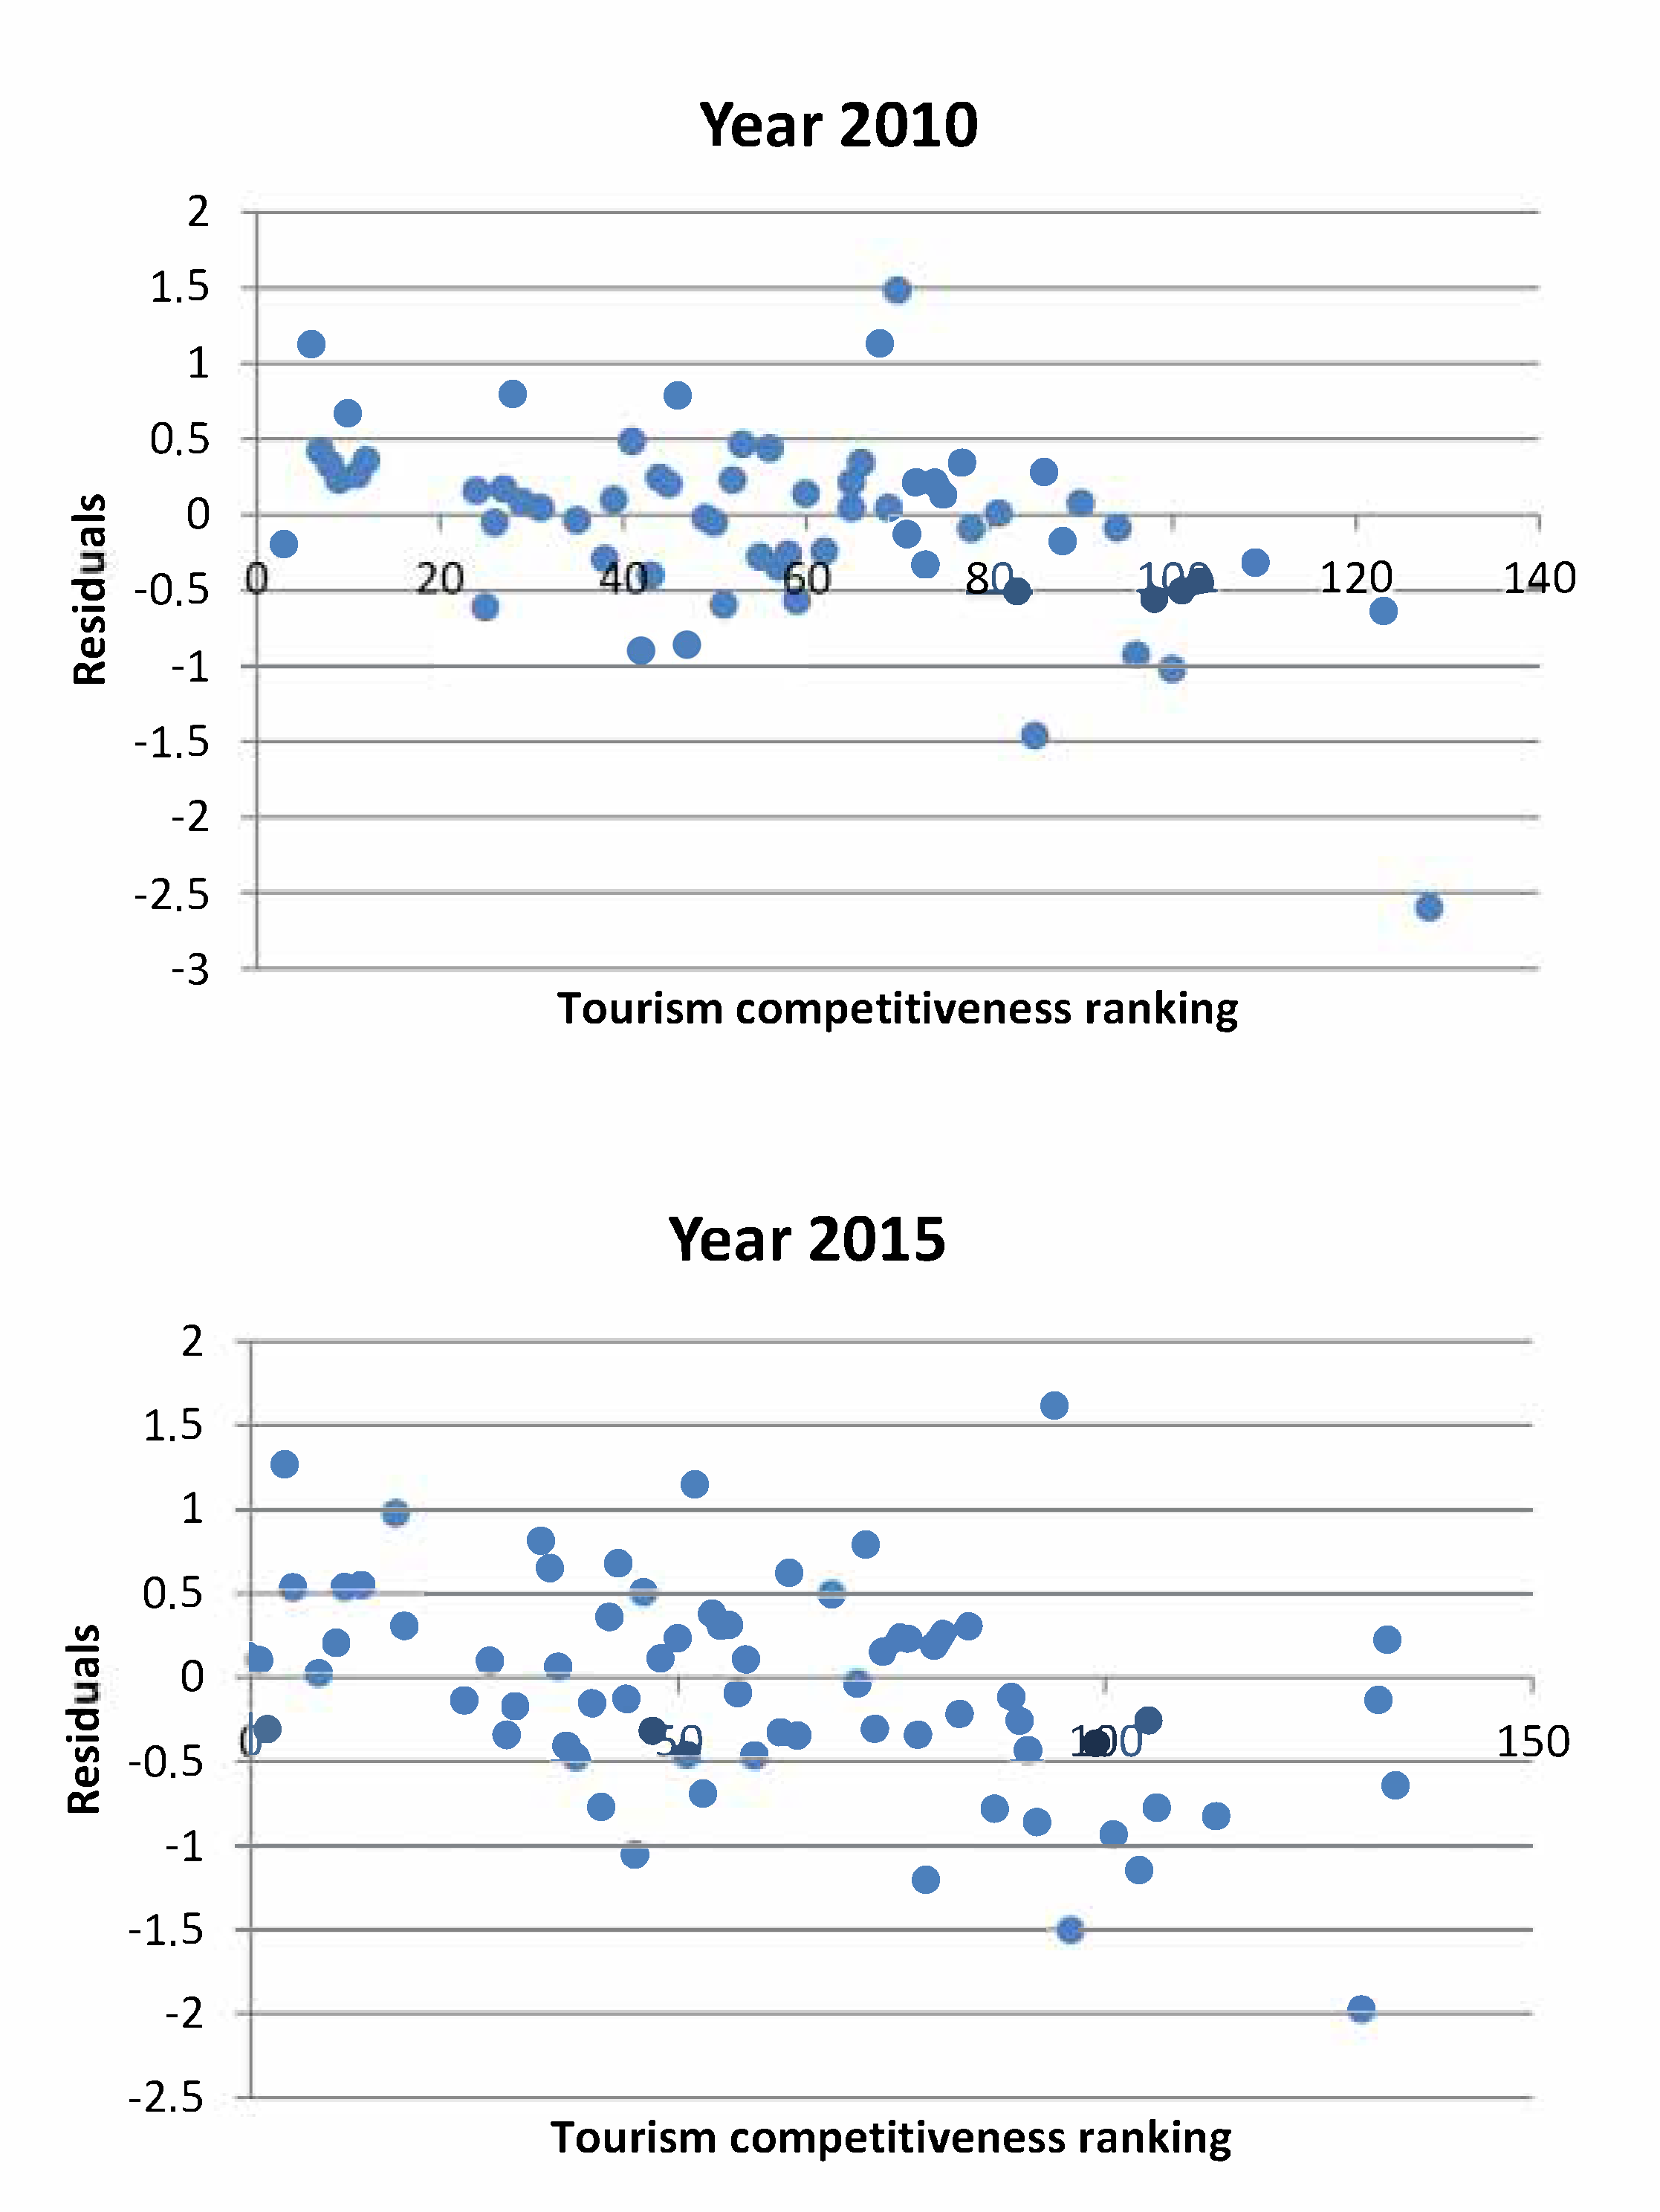
To complete the analysis conducted for this article, a relationship was established between the degree of tourism efficiency, measured by the residuals of model (1), and the level of tourism competitiveness. It is anticipated that countries with higher efficiency in generating income from tourism (higher positive values for the residuals) will be more competitive in terms of tourism (higher relative positioning in the global ranking of tourism competitiveness), and vice versa. So, it is expected that a statistically significant negative correlation will exist between these two magnitudes.
Figure 1 reveals the relationship between the tourism competitiveness ranking and the value of the residuals of the model of the analyzed countries, both in 2010 and in 2015. For this, the global indices of tourism competitiveness of the World Economic Forum (WEF, 2011, 2015) [
71,
72] were considered. It is evident that the highest positive residuals are found for the more competitive (in terms of tourism) countries, whereas, generally speaking, less competitive countries tend to have negative residuals.
If the Pearson correlation coefficient is calculated for these two magnitudes, it is found to be negative and statistically significant at 5%. Specifically, for 2010, this correlation coefficient had a value of −0.4714 (number of observations: 65; p-value: 0.0000), whereas for 2015, this coefficient reached a value of −0.4283 (number of observations: 71; p-value: 0.0000).
Therefore, it is found that the management of international tourism arrivals and the conversion of these tourism flows into international income from tourism is directly related to the country’s tourism competitiveness, since more competitive countries are better at managing the transformation of physical flows (tourists) into economic flows (millions of US dollars). It is necessary to further examine the specific aspects of tourism competitiveness that may condition this economic management of tourism. This detailed analysis will be the subject of upcoming studies carried out by the authors of this work.
5. Conclusions
The analysis carried out in this work reveals that, despite the continued growth of international tourist arrivals on a global level between 2010 and 2015, the income generated from international tourism has increased at a much slower rate in numerous countries, even decreasing in some of these countries over the same period. The following are some of the countries in which international tourist arrivals have increased but major decreases have taken place in the income generated by international tourism: the Czech Republic (−15.7%), France (−2.3%), Hungary (−5.2%), Morocco (−10.4%), the Russian Federation (−4.1%) and South Africa (−9.2%).
An estimate of the inverse demand-income elasticity to determine the percentage change in income from international tourism taking place when the percentage change in the international tourist arrivals at frontiers is 1% has allowed us to distinguish between elastic and inelastic countries. It was found that 48% of the countries from the sample are inelastic. During the analyzed period, the increase in income from international tourism in these countries was less than proportional to the increase in the number of international tourism arrivals.
These results allow us to test the first hypothesis of this work. In this case, as suggested, the receipt of tourism flows is not the best measure to assess the contribution of tourism to the economic growth of a territory. Rather, the volume of the income generated by this tourism should be used.
Furthermore, the tourism efficiency of the analyzed countries has been examined, verifying that the majority of these countries (83 out of the 93 sample countries) maintained their level of efficiency (or inefficiency) between 2010 and 2015. Specifically, 51 countries were efficient in 2015—that is, they obtained income from international tourism that exceeded the expected values, in accordance with their volume of international tourist arrivals. Special attention should be paid to the inefficient countries, including Argentina, the Czech Republic, Egypt, France, Greece, Hungary, Kenya, Malaysia, Mexico, Morocco, the Russian Federation, Tunisia and Turkey.
Once again, these data demonstrate that measuring the success of a tourism destination based on an increase in tourism flow is not appropriate and may lead to serious problems of tourism flow management in these territories, possibly overwhelming the management capacity of these destinations and jeopardizing the truly relevant objectives: the quality of life of the local population and the quality of the tourism experience. Besides, an additional problem faced by managers in inefficient countries relates to structural constraints that limit high income production. In these cases, managers should make appropriate tactical decisions (such as competition) when establishing a tourism base (“low-impact” tourism).
Therefore, although the conclusions that allow for the validation of the first hypothesis seem to be obvious, we must clarify that studies continue to be published in which an analysis of tourism-led-growth based on tourism flows is carried out, validating their hypothesis based on this information, although other variables may be included, such as interest rates and their influence on tourism flows [
73]. At the same time, certain international institutions continue to refer to economic growth when analyzing the data of international arrivals, that are increasing year after year [
74]. In addition, it has been shown that tourism receipts are more valid than tourism flows, as well as their contribution to GDP, when evaluating tourism-led-growth over time [
75]. That said, the results shown here contribute to the research line that suggests that tourism receipts are more significant for analyzing tourism-led-growth than tourism flows. This is the reason why it is important to note that seeking to increase per capita tourism expenditure should be the main objective of policymakers and managers of tourism destinations. Perhaps, in some destinations, inefficient management in terms of short-term benefits may increase the interest in attracting a high volume of tourists, potentially leading to problems of saturation, deterioration and a decline in destination value.
The second hypothesis proposed in this work states that those territories with greater efficiency in generating income from tourism are more competitive, in terms of tourism. The data obtained for this study demonstrate this, allowing us to test this hypothesis. More competitive countries are better at managing the transformation of physical flows (tourists) into economic flows (millions of US dollars).
Therefore, the contribution of this paper is significant in that it may serve to change the approach of both private and public entities, urging them to re-direct their business planning and policymaking toward the objective of increasing the level of income and not the volume of tourists.
In light of these results, governments and tourism industries should focus their attention on long-term policies that seek to increase tourism expenses through the creation and sale of products that generate value for the client, responding to their expectations and needs and limiting the short-term policies that favor growth based on volume of tourists, which have a clearly negative effect on prices and serious impacts on the resources and the population of said territories.
In this way, the countries identified as inefficient in this study should focus their tourism promotion policies on those market segments with the highest expenditure. In short, this study proposes that which Aguiló et al. (2017) [
76] call an intensive generation of income from tourism (high level of daily tourist expenditure per capita and a low volume of tourists) for inefficient countries, as compared to the more typical extensive generation of income (high volume of tourists with a reduced tourist expenditure per capita).
To achieve this, different measures can be carried out. One possibility is to raise the level of general tourist satisfaction, since, as Cárdenas-García et al. (2016) [
77] noted, the greater the tourist satisfaction, the greater the tourist expenditure. Therefore, more effective action by the public administration is necessary (especially in the improvement of infrastructure and in a more tourist-oriented governance), as well as a commitment by private companies to offer a wider range of activities and provide higher-quality tourism goods and services. More can be done by taking some factors into consideration, such as the three sustainability dimensions, which can help tourism managers to develop plans or actions to add value to the territory as they foster a higher-quality tourism in order to get higher income levels [
78] (Wans, Huang, Gong, Gao, 2020). However, there is a need for caution when suggesting management guidelines if the territory is struggling with environmental problems as water or air pollution, because making efforts to attract more tourists may entail the risk of destroying natural resources [
79].
It is also possible to promote higher tourism revenues by increasing spending on purchases, souvenirs and handicrafts per capita. Baruah and Sarma (2016) [
80] revealed that cultural and rural tourists have an average spending on purchases that is higher than other tourists, and that tourists traveling as a family spend more on souvenirs and handicrafts. Similarly, Alegre and Cladera (2012) [
81] concluded that tourists with a higher educational level, who are self-employed and who travel with children have a greater predisposition to spend more on purchases. Consequently, there are certain tourist profiles that can be sought out to attract greater tourist spending in terms of purchases and souvenirs. The type of tourist activity carried out is another factor that can contribute to improving the efficiency of the most inefficient countries. García-Sánchez et al. (2013) [
82] demonstrated that all activities carried out at the destination contribute to increasing daily tourist spending.
Additionally, certain tourist attitudes contribute to the generation of more tourism expenditure per capita. Specifically, as evidenced by Moeller et al. (2011) [
83] and Nickerson et al. (2016) [
84], the segment of sustainable tourists (geotravelers) presents a pattern of tourism spending that is significantly higher than that of other tourist segments. As defined by Boley et al. (2011: 567) [
85], a geotraveler is a tourist who “sustains or enhances the geographical characters of place-including its environment, culture, aesthetics, heritage, and the well-being of its residents”.
Therefore, work needs to be carried out to ensure a balance between tourist flow and tourism receipts, encouraging quality tourism that is supported by experiences that meet the expectations of tourists. In order to strengthen this paper’s results, future lines of research must be pursued. Variables such as overnights, average stay or even the seasonality of the type of tourism developed can be analyzed in a given country to determine its level of competitiveness.
Finally, it must be recognized that the present study has some limitations. Thus, the conclusions reached have been obtained considering only international tourist flows, without taking into account internal tourist flows (due to the unavailability of this statistical information), despite the fact that these internal flows also contribute (and, in some cases, significantly) to the development of certain tourist areas. On the other hand, this study has been carried out prior to the Covid-19 pandemic, which has drastically changed the tourism industry in general, and the composition of tourist flows in particular. In this way, the growing importance of internal tourist flows, due to the restrictions on international travel, could change the results obtained in this study. Therefore, it would be very interesting to carry out future studies to assess the impact of Covid-19 on the elasticity analyzed in this paper.


