Abstract
There are three main contradictions associated with urbanization: population growth and food demand, urban sprawl and production space, and production patterns and energy consumption. The pressure of urbanization has led to a mismatch between production and consumption in space and pattern. The current status and trends in urban food system planning illustrated that sustainable consumption and production were closely related to their spatial layout. The paper took a simulated sustainable food system in urban community as an example. It formulated a rational spatial planning strategy based on urban agriculture of different scales, technologies, and efficiencies, quantified productive community metrics to accommodate different scales of urban space, and wrote algorithms to develop a spatial model of a meta-cellular automaton that coupled consumer housing with productive surfaces. Finally, by comparing and optimizing the spatial patterns of multiple solutions, urban agriculture-oriented urban community planning was developed. The model was only a preliminary attempt at food system planning, but it explored the distribution patterns of housing and agriculture within a given territory in three steps: theoretical strategy-morphological simulation-planning design while meeting urban and productivity indicators. It demonstrated the feasibility of productive spaces and explored a planning strategy for urban communities that supports sustainable consumption and production.
1. Introduction
1.1. Challenges to Sustainable Urban Food Supply
At the current pace, the Asia-Pacific region will not be able to achieve any of the 17 Sustainable Development Goals (SDGs) by 2030, especially SDG 12—Responsible Consumption and Production, which has regressed [1]. The relationship between urbanization and the food crisis is based on the following facts.
- (1)
- Population growth and food demand. With more than half of the world’s population [2], cities consume 67–76% of the world’s energy and emit 71–76% of greenhouse gases [3], and urban problems have become a major factor in the global existential crisis. Fifty-five percent of the world’s population will live in urban areas in 2018 and the proportion is expected to be as high as 68% in 2050 [2]. By then, even after deducting some of the amount spent on biofuels, the amount of agricultural products will need to increase by 70% [4]. With nearly 690 million people currently suffering from hunger, or 8.9% of the world’s population, a figure that has been increasing year after year since 2015, breaking a decade-long slowdown, the COVID-19 pandemic is expected to worsen the overall outlook for food security and nutrition [5].
- (2)
- Urban expansion and agricultural land. Over the past 50 years, more than 20% of the world’s natural vegetation has been converted to cropland, and urban areas are expanding at an annual rate of 3–7% [6]. Urbanization will reduce the global arable land area by 1.8–2.4% by 2030, with 80% of this reduction occurring in Asia and Africa. However, even with increased crop yields, a net expansion of 70 million hectares of arable land would be required by 2050 [7].
- (3)
- Urban layout and food transportation. Excessive food miles in today’s cities are causing serious pollution and environmental damage. Food production accounts for only one-fifth of all energy consumed by urban food systems, while processing and transportation account for four-fifths [8]. The COVID-19 pandemic has swept through 186 countries between December 2019 and March 2020, and the number of people facing severe or extreme food insecurity is expected to increase from 135 million in January 2020 to 265 million by the end of 2020 [9]. Major challenges include severe disruptions in food supply chains, economic barriers that limit access to food, and food waste due to labor shortages [10].
China has the same problem. In 2011, all countries in the world food market combined traded only 81.6% of China’s food needs, and in 2019 it will be only 91.7% [11]. At the same time that food self-sufficiency has been declining year after year, arable land has been drastically reduced to 0.09 hectares per person, less than 40% of the global average, and is still declining year after year [12]. About 1% of China’s 1.4 billion people leave the land for the cities each year, and urban construction has encroached on a large amount of farmland [13]. In China, food production and processing costs account for only 30% of retail prices, while logistics costs are about 70%. The Chinese Academy of Social Sciences reports that the urbanization rate of China’s population is expected to reach 65.5% in 2025 and that there could be a food deficit of about 130 million tons [14]. By that time, China’s food supply and demand problems will be even greater, the conflict between urban development and agricultural land will be more acute, and the energy wasted in producing and obtaining food will be more serious. The imbalance between production and consumption in cities has become so pronounced that cities of the future should be more extensive and proactive in all aspects of sustainable production.
The Food and Agriculture Organization (FAO) report also reveals other pitfalls that are easy to overlook [15]: (1) The crisis is not only hunger but also obesity. If the food crisis is inefficient, “high efficiency” has “all forms of malnutrition.” (2) Efficiency brings yield but also ecological loss. The incidence of food shortages and soaring prices are important factors in the phenomenon of social unrest, but the overexploitation of land for agriculture also causes an ecological crisis. (3) In addition to the economic cost of access to food, there is an environmental cost. The current model of food production and distribution relies heavily on cheap labor, fossil fuels, and efficiency on a large scale, with a huge ecological footprint and food miles.
While the drivers behind these trends in food insecurity and malnutrition vary, exploring better spatial relationships in the planning of productive community food systems oriented towards urban agriculture could contribute to progress in mitigating crises, replenishing arable land, coping with shortages, shortening supply chains, and increasing the specialization and diversity of food supplies.
1.2. Status and Trends in Urban Food Systems Planning
Urban food systems are less visible than other urban systems such as transport, housing, employment, and even the environment, and have been overlooked by planners [16]. The reason for this invisibility is the long-standing divide between urban development and food issues [17]. The 2013 5th Annual Meeting of the AESOP Sustainable Food Planning Group in Montpellier, France adopted approaches such as Food Justice [18,19] in the United States or Food Planning [20,21] in Europe and focused on how to renew the role of agriculture in sustainable urban development.
The 2016 Urban Food Planning: the Seeds of Transformation in Developed Countries [22] has provided a comprehensive and systematic review of the intellectual, theoretical, and practical developments in the field of urban food planning in North America and Europe over the past two decades. Research work on urban food systems has been summarized in three trends [23]: (1) Analysis of the organization, flows, and spatial dynamics between urban development and food, particularly the logistics of food procurement or urban metabolism. Foodsheds [24], Foodscapes [25], and Food Deserts [26] are key concepts in these approaches. (2) Analysis of local food systems, focusing on the causal relationship between local food production and urban sustainability. Increasingly, residents and governments are participating in alternative food networks through urban gardening, shortened food chains, direct producer marketing, and food education. (3) Analysis of design approaches and public policies for integrating agriculture and food into urban planning [27,28].
The 2016 Global Food Policy Report sets out six requirements for current urban food systems: efficient, inclusive, sustainable, smart climate response, healthy nutrition orientation, and a sound business environment [29]. The 2030 Agenda for Sustainable Development also suggests that sustainable agriculture and food systems are necessarily closely related to sustainable cities and communities [30]. In addition, since the FAO’s Food for the Cities Initiative, more and more cities have joined this social movement, such as 210 cities worldwide that have signed the Milan Urban Food Police Pact; 52 cities in the UK have joined Sustainable Food Place; 25 cities in France have joined Terres en ville, and the City Region Food Systems Programme is proposed for 2019 to reinforce rural-urban linkages for climate resilient food systems.
Agronomy, ecology, and sociology were the earliest studies of food systems in China, mainly from the perspective of ecological economics to study the energy flow of agricultural ecosystems [31], the formation of logistics and its impact on economic and social development [32], as well as the supervision and regulation of social policies and regulations [33]. Urban agriculture entered the field of architecture and planning in China earlier, but the content directly related to the food system has been slightly delayed compared with other professions.
Urban agriculture has been in the field of architecture and planning in China for a long time, but the content directly related to food systems has been slightly delayed compared to other professions. The research began with the introduction of the experiences of countries such as the Netherlands [34] and the United States [35,36], with a preference for a strategic analysis with case studies. In addition, it also studied western modern urban food planning theory and attempted to analyze the problem from a food system perspective in the process of integrating urban agriculture into the planning system [37,38].
All of these studies, as described above, aim to promote the sustainability of urban food systems. Current research on food systems has evolved from city-food relationships to inclusion in urban planning and design, but food systems still seem to have a relatively low profile in terms of wanting to be supported and recognized by urban systems. Thus, urban agriculture-oriented productive community food systems were not only a concept, but also an approach that considered food issues as an important component of sustainable urban lifestyles. But how to make the spatial planning of urban communities more compatible and sustainable with food systems becomes a key question, and what would be the morphological model for achieving partial self-sufficiency?
1.3. Community Planning Proposals Related to Urban Agriculture
The history of cities and agriculture in food system planning has received increasing attention in recent years [39]. The development of urban food provisioning after the Industrial Revolution can be roughly divided into five phases [40]: (1) the reconfiguration of urban-rural relations between the 18th and early 20th centuries; (2) the modernization of cities, agriculture, and marketized food in the early 20th century; (3) the rethinking of large-scale mechanized agriculture in the mid-20th century; (3) the radical liberal development of urban farms in the 1970s; (5) urbanization and agriculture from the 1980s to the present (Table A1).
After 2005, agricultural practices have become more frequent in cities as a result of both the wave of food localization and the theme of sustainable development [41]. There are some theories of urban planning related to agriculture that focus on the problem of reconstructing urban spatial systems by improving urban agriculture, mainly including Continuous Productive Urban Landscapes (CPULs) [27], Agrarian Urbanism (or Agriculture Urbanism) [42], Food Urbanism [43], and Food-Sensitive Planning and Urban Design (FSPUD) [44] (Table A2). The main strategies of these theories all include a spatial typology of multi-scale urban agriculture aimed at matching and integrating different urban spaces and as part of a sustainable infrastructure.
There have been different perspectives on how a spatial model of a city or community should be constructed [45]. Frei Otto proposed a network of pathways driven by function and scale and used magnetic needles and rags in water basins to simulate the formation of organic communities before computer technology became widespread [46]. Richard T.T.F. developed the mosaic principle of landscape structure, which states that the basic spatial elements of any pattern on land are patches, corridors, and matrices [47]. Michael Batty’s urban agglomeration simulations using DLA (Diffuse Limited Aggregation) have been able to reproduce similar patterns of urban growth using simple computational rules [48]. Stephen Marshall deals more directly with the form of buildings and the small-scale organization of networks within cities [49]. These simulations all use population density, coverage, and floor area ratio as key indicators of urban organization generation.
In addition, by analyzing the three cases of Edible Rotterdam [50], Mapping Urban Agricultural Potential [51], and Self-Sufficient Neighborhood Prototype [52] (Table A3), the paper summarized the main approaches to planning strategies and spatial models: creating a matrix of urban agricultural types, quantifying urban spatial parameters, developing coupling rules for housing and farming, and three-dimensional visual models.
2. Materials and Methods
2.1. Spatial Planning Strategy
First, a database of multi-scale urban agriculture types was created, drawing on the methods summarized above (Table 1). Then, a matrix of community urban agriculture types would be established as a spatial planning strategy through the 3 dimensions of scale, technology, and efficiency.

Table 1.
Example of a multi-scale urban agriculture typology database.
- (1)
- Spatial scale of forms and patterns. According to the relationship between urban and rural areas and the scale, they could be roughly divided into several types: micro-agriculture, family garden or backyard, community garden or allotment, urban farm and suburban farm, and the key elements of the classification of different types were: area, location, property rights, and business model.
- (2)
- Vertical and horizontal intensification techniques. The production technologies could be divided into three categories by their difficulty and direction of expansion: (1) ecological intensification, which gave priority to urban environmental issues and increased the biodiversity of local cities; (2) vertical intensification, which increased the efficiency of space use by overlapping the vertical use of a particular site or building; (3) horizontal intensification, which increased the efficiency of time use by providing access to multiple activities or functions on a particular site.
- (3)
- The combined benefits of inputs and returns. To ensure a sustainable operating model for the planning strategy as well as economic viability, different food production required a certain scale and a minimum return, such as a minimum continuous scale to be profitable. In addition, the social and ecological benefits of urban agriculture were often the easiest to ignore and the most difficult to assess.
The three types of community food system spatial planning strategies with different emphases were coupled into a richer three-dimensional matrix of food system spatial types (Figure 1). It could provide food system planning strategies under different conditions in new cities and could be used in existing cities as a screening condition for improved food system planning.

Figure 1.
Community urban agriculture type matrix.
2.2. Quantification of Indicators
The indicators that need to be quantified for urban agriculture-oriented community planning include overall spatial parameters, proportion of growing areas, and yield per unit area.
- (1)
- Spatial characteristics of urban communities
Referring to the previously mentioned spatial modeling cases and Space Matrix [53], four descriptors of urban space were identified. The basic indicators of a productive community model included: population density (D), coverage (C), floor area ratio (FAR), and open space ratio (OSR), where OSR provided a more intuitive description of the amount of ground-level non-built space per square meter, indicating the pressure on non-built space. A higher OSR implied a relatively open urban experience, while a lower OSR indicated a highly dense environment.
- (2)
- Dwelling and production area per capita
Reviewing previous urban agriculture studies and cases, fruits and vegetables of controlled scale were suitable for introduction into the inner city, while cereals and livestock required larger contiguous plots of land to be economically viable. In order to build a productive community model, standard quantities of dwelling area per capita and fruit and vegetable growing area per capita were obtained from the Dietary Guidelines for Chinese Residents [54], the China Household Development Report [55], and the China Rural Statistical Yearbook [56] (Table 2).

Table 2.
Standard scale for calculation of basic parameters.
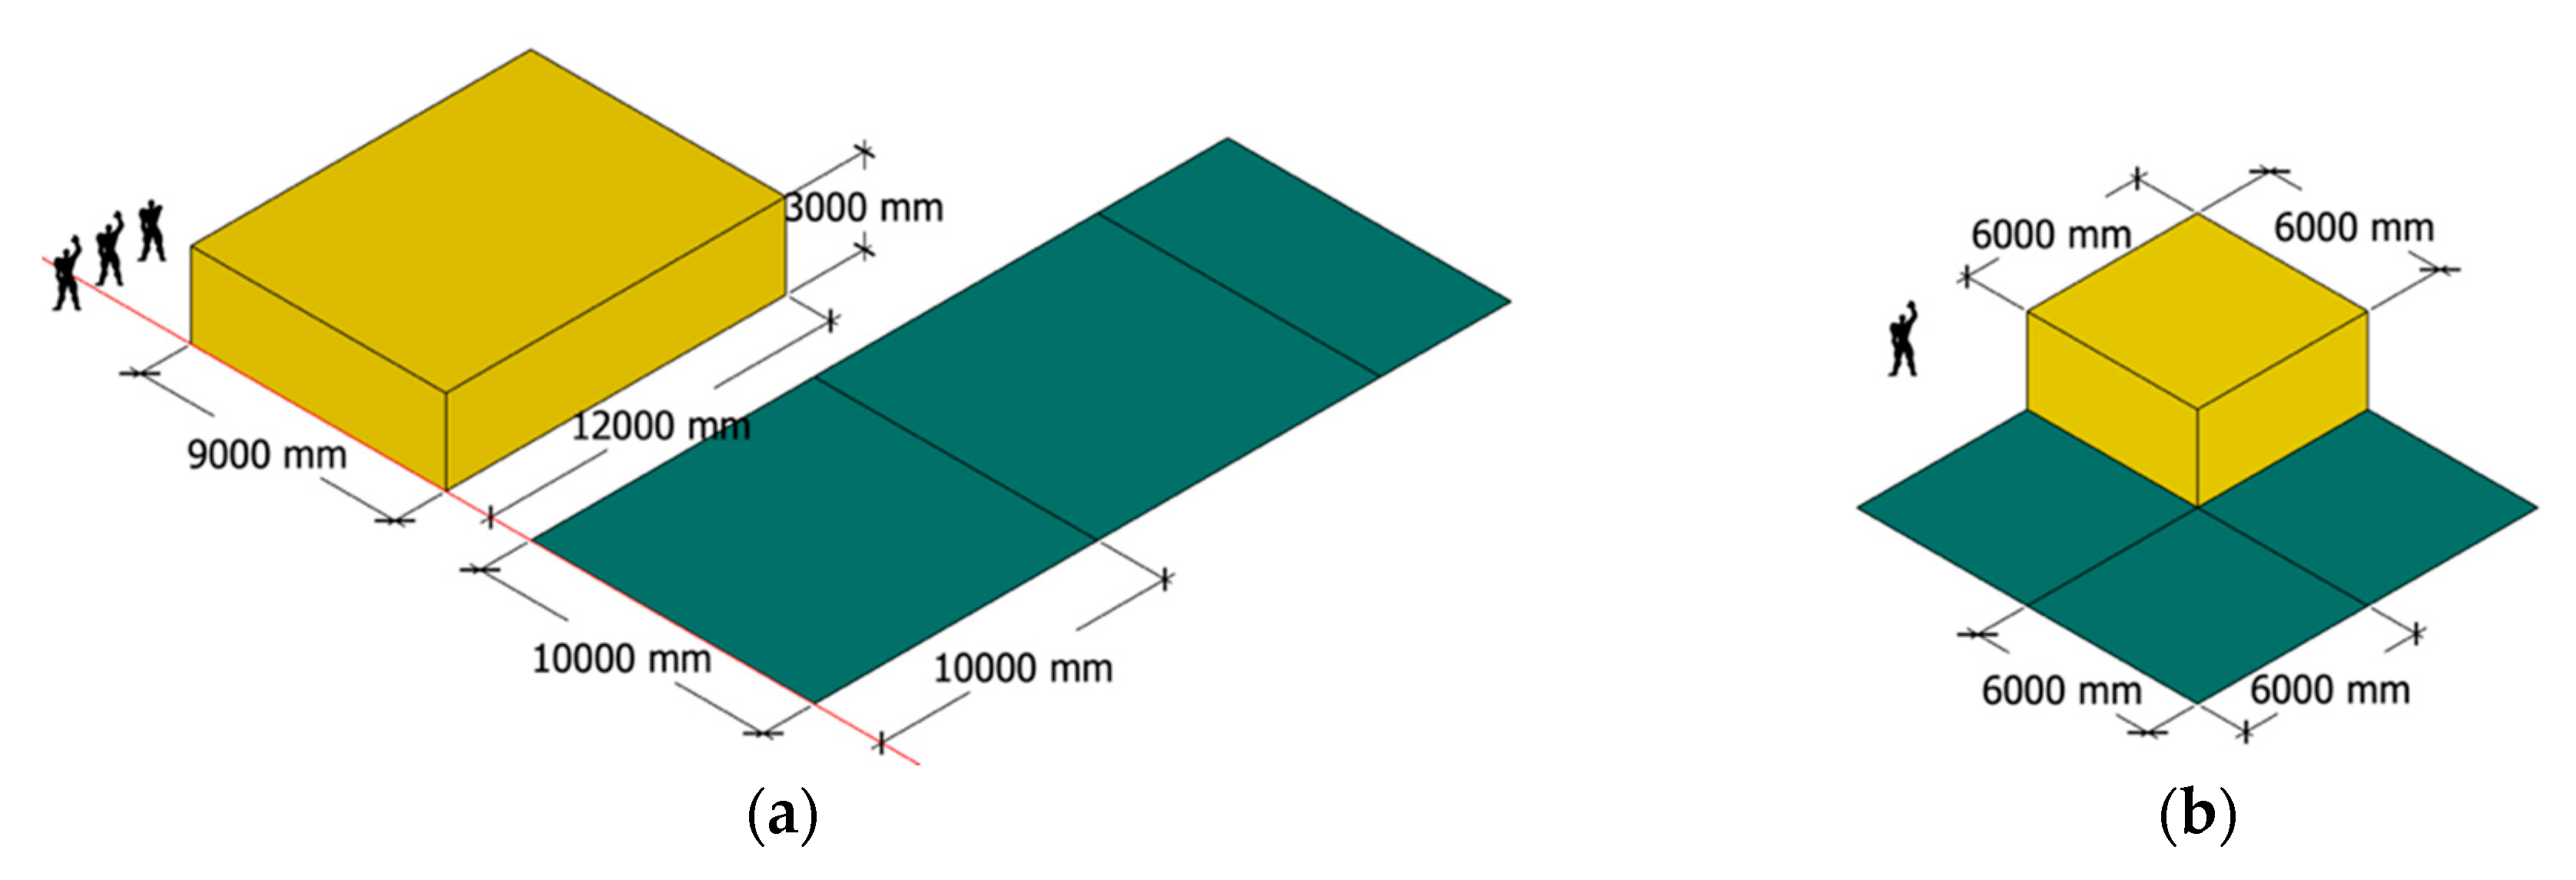
In order to simplify the simulation, the calculation criteria were approximated to standard units. Further, to make the settlement pattern more flexible and diverse, a dwelling unit would be divided into 3–4 room cells, which meant subdividing into individuals rather than households. The community food system spatial planning simulation would use the following configuration: for each person (P), one standard cell (C) will be required for dwelling: 6 m × 6 m = 36 m2 and 3 (C) = 108 m2 for vegetable and fruit cultivation (Figure 2). This figure was close to the ratio between household members and the required production area in Viljoen and Bohn’s study (i.e., 100 m2 per person) [27].
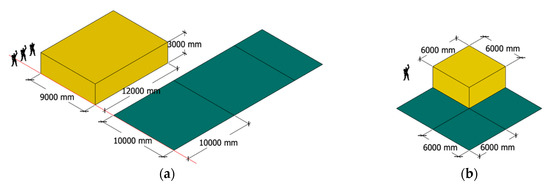
Figure 2.
Simplification of analog standard modules: (a) the average Chinese household requires at least 245.95 m2 of productive surfaces; (b) standard module to simulate living space and fruit and vegetable growing areas.
- (3)
- Productivity intensity (PI) per unit of land area
Simulated production intensity values were set based on the yields of the various types of urban agriculture in the actual cases presented in Table 1. Productivity improvement per unit of land area could be achieved in a number of ways, and while the actual productivity gradient was not linear, the growing area in the model would be idealized using a productivity gradient of 1–10 (PI), while rooftop planting was technically limited (PI = 3). PI = 1 was equivalent to a year’s supply of fruits and vegetables for 36 m2, and PI = 3 means that the 36 m2 unit would provide one year’s supply of fruits and vegetables for one person. Depending on the actual production intensity values, PI = 3 with ready-made greenhouse technology, PI = 5 with highly specialized greenhouse technology and PI = 10 with high-tech energy-intensive greenhouses (Figure 3).

Figure 3.
Illustration of different types of productivity intensity levels.
2.3. Simulation Rules
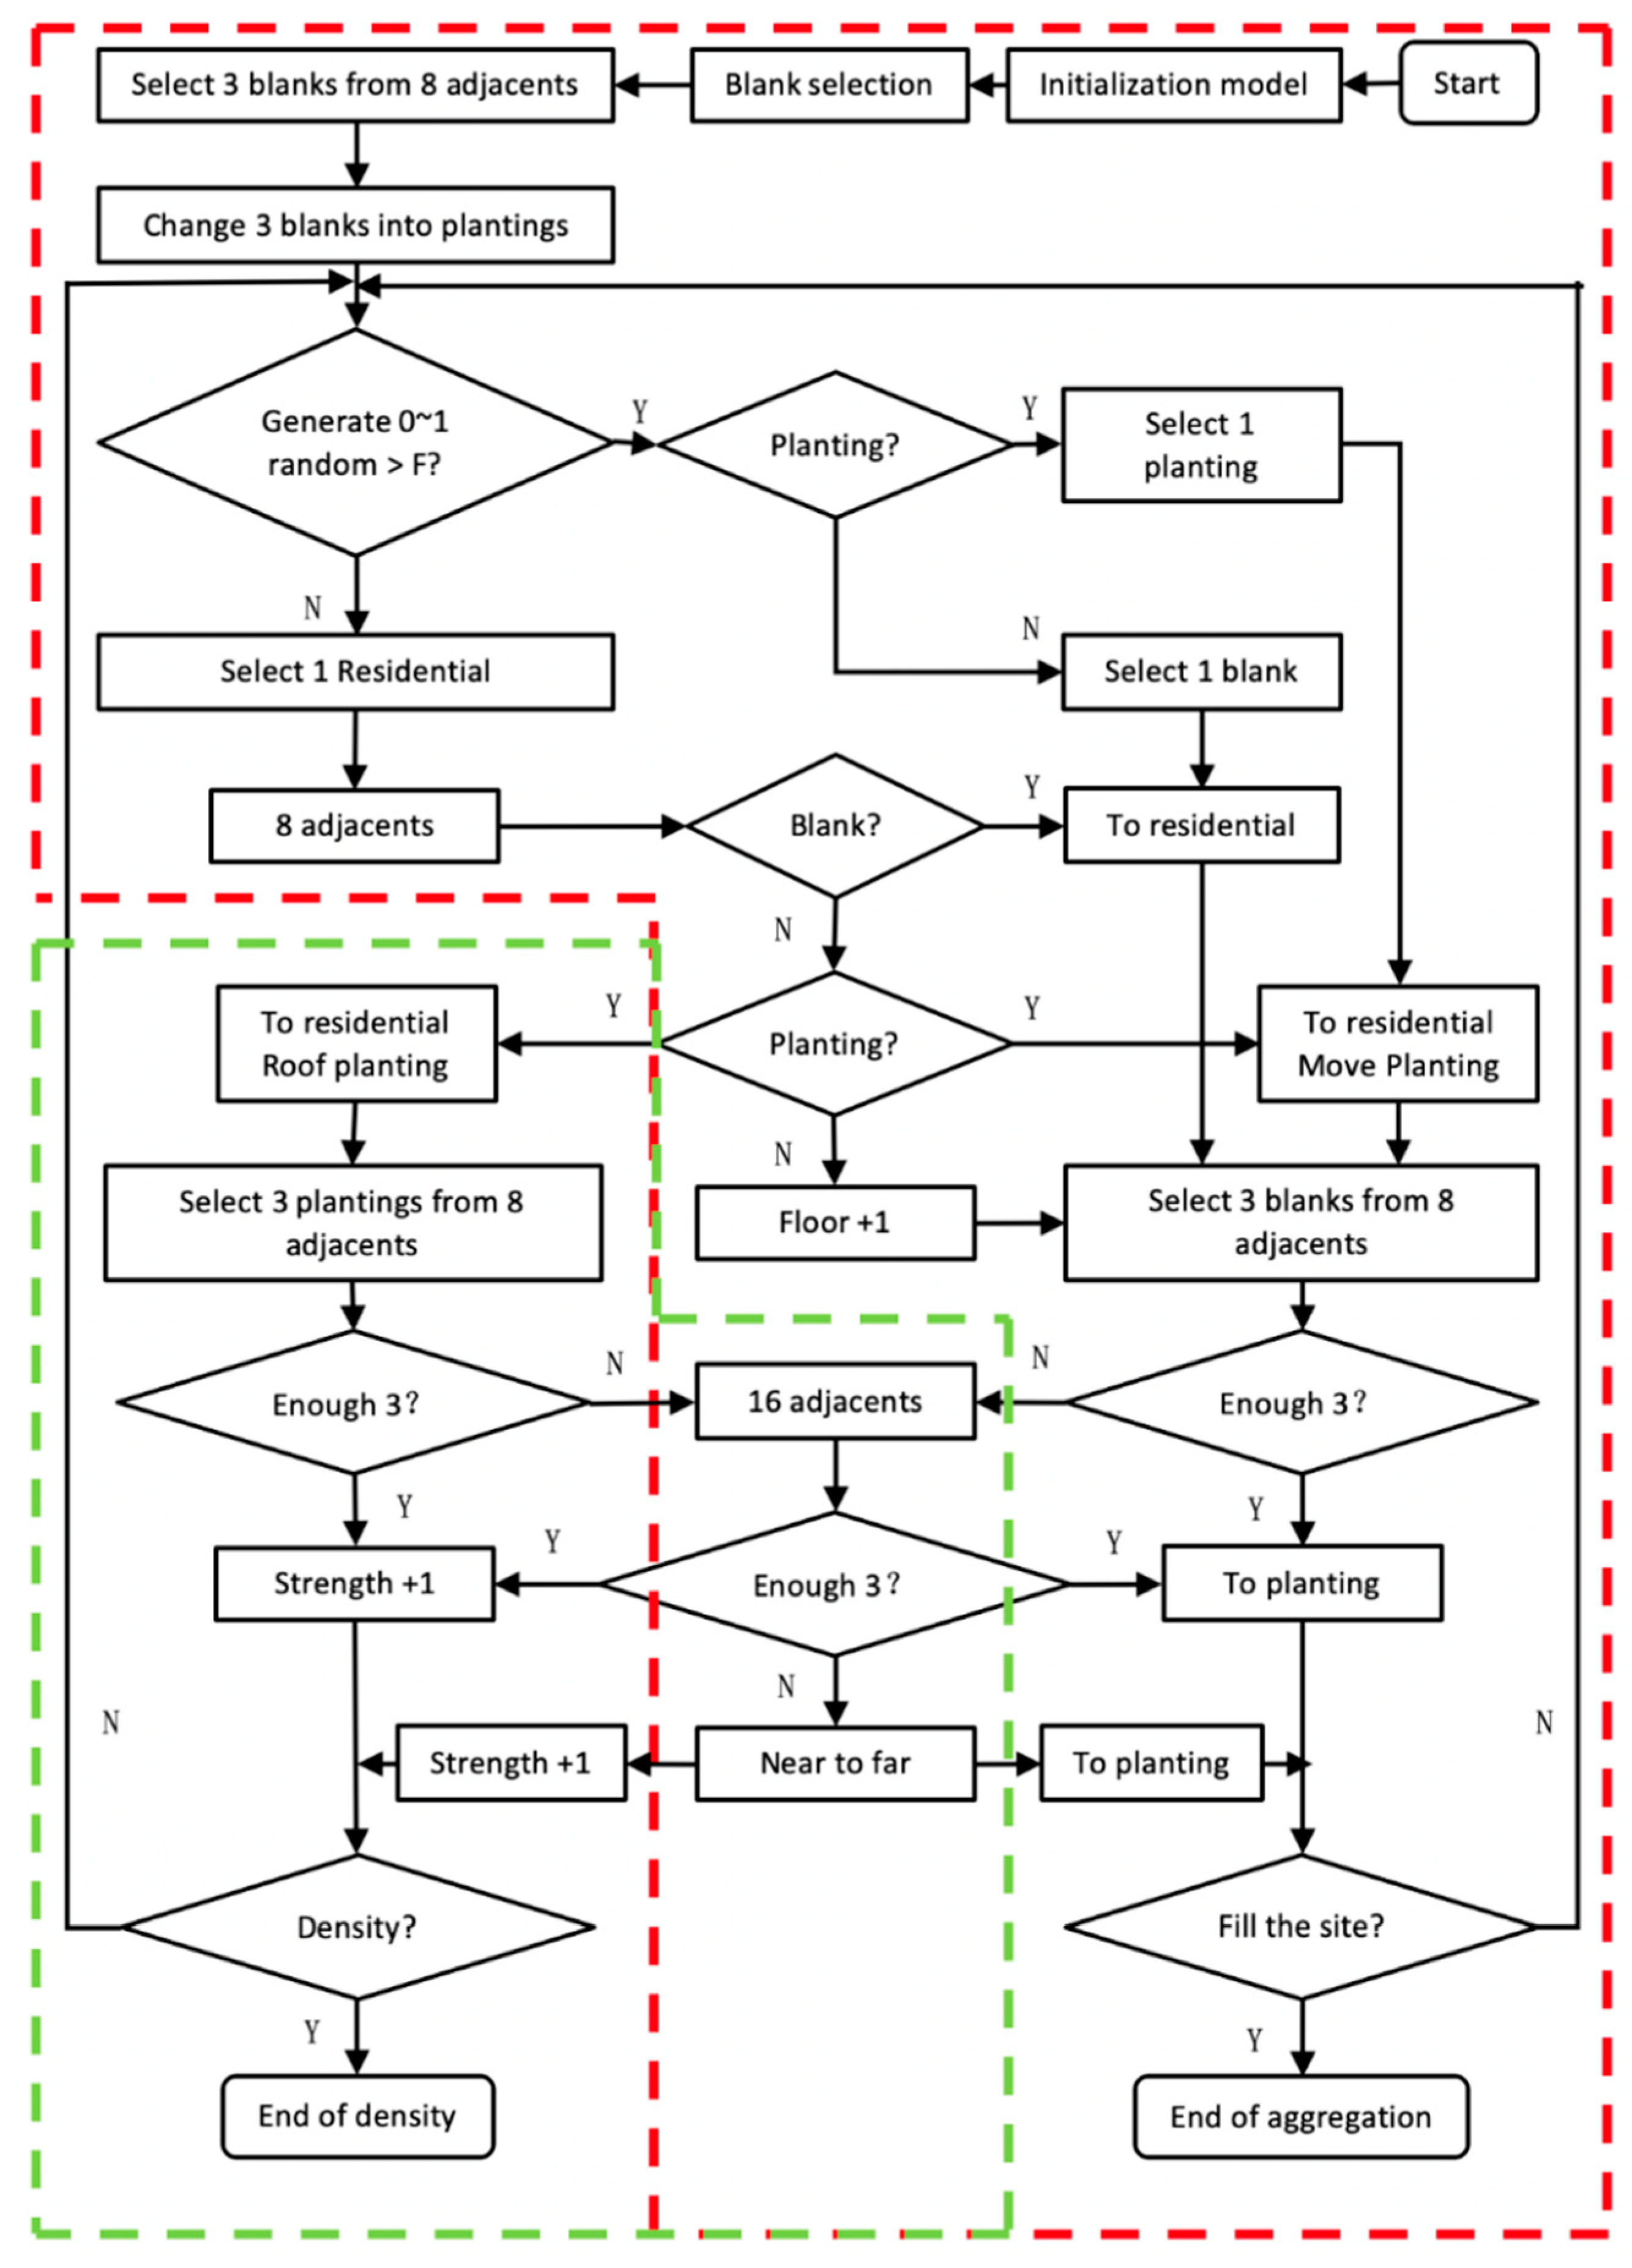
Community food system spatial planning simulations resemble meta-automated machine algorithms with three main rules for generating logic (Figure 4).

Figure 4.
Simulation rules illustrated: (a) Decomposed actions for community food system spatial planning simulations; (b) In the picture on the left, the selected dwelling unit (pink) is surrounded by only 3 neighboring dwelling units (white), and only 5 other adjacent spaces can be selected for placement of the dwelling unit (red). In the right picture, the selected dwelling unit (pink) is surrounded by 8 neighboring dwelling units (white), which meets the vertical growth condition, so the dwelling unit (red) is placed above.
- (1)
- Each dwelling unit was configured with three adjacent planting units, and each placement of a dwelling unit was selected by friendliness (F) to be adjacent to or away from other dwelling units.
- (2)
- When eight units surrounding a dwelling unit were occupied, this triggered an increase in the number of floors in that dwelling unit.
- (3)
- When the target population density (D) had not been met, the productivity intensity (PI) of existing planting units needed to be increased or the option to place planting units on the roofs of dwelling units.
Then, the program flow chart (Figure 5) was drawn based on the above simulation rules and the algorithm was written in python language (Appendix B). The input and output parameters of this simulation model were as follows.
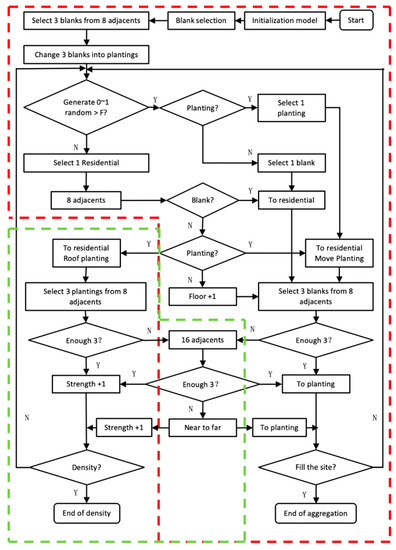
Figure 5.
Flowchart for community planning and spatial simulation.
Input parameters:
- (a, b, h) Length, width, height (6 m, 6 m, 3 m). Standard dwelling unit.
- (x, y) Rectangular site side lengths (600 m, 600 m). Standard pedestrian community size.
- (PId) Intensity of dwelling units (0–3). Preset parameters for this simulation.
- (PIp) Planted unit intensity (1–10). Preset parameters for this simulation.
- (HC) Number of permitted floors (7). Preset parameters for this simulation.
- (v) Vertical growth thresholds range from 0 to 8 for the number of surrounding dwellings required to trigger vertical growth (8). Preset parameters for this simulation.
- (D) Population density indicated the number of people living per hectare.
- (F) The friendliness factor was a variable from 0 to 1 that controlled the likelihood of dwelling unit clustering and served as a means of controlling sparsity, which in turn affected FAR, C, and OSR. F = 0 indicated that all units were away, while F = 1 indicated that all units were close. F = 0.3 indicated a 30% probability that a unit would choose to be close.
- Output parameters:
- (DN) Number of dwelling units.
- (PN) Number of planted units.
- (AF) Average number of residential floors in the site.
- (PG) Productivity gradient.
- (OSR) Open Space Ratio.
The output also included spatial morphological texture maps, productivity intensity distribution maps, and isometric maps of community simulations.
3. Results and Discussion
3.1. Sample Testing
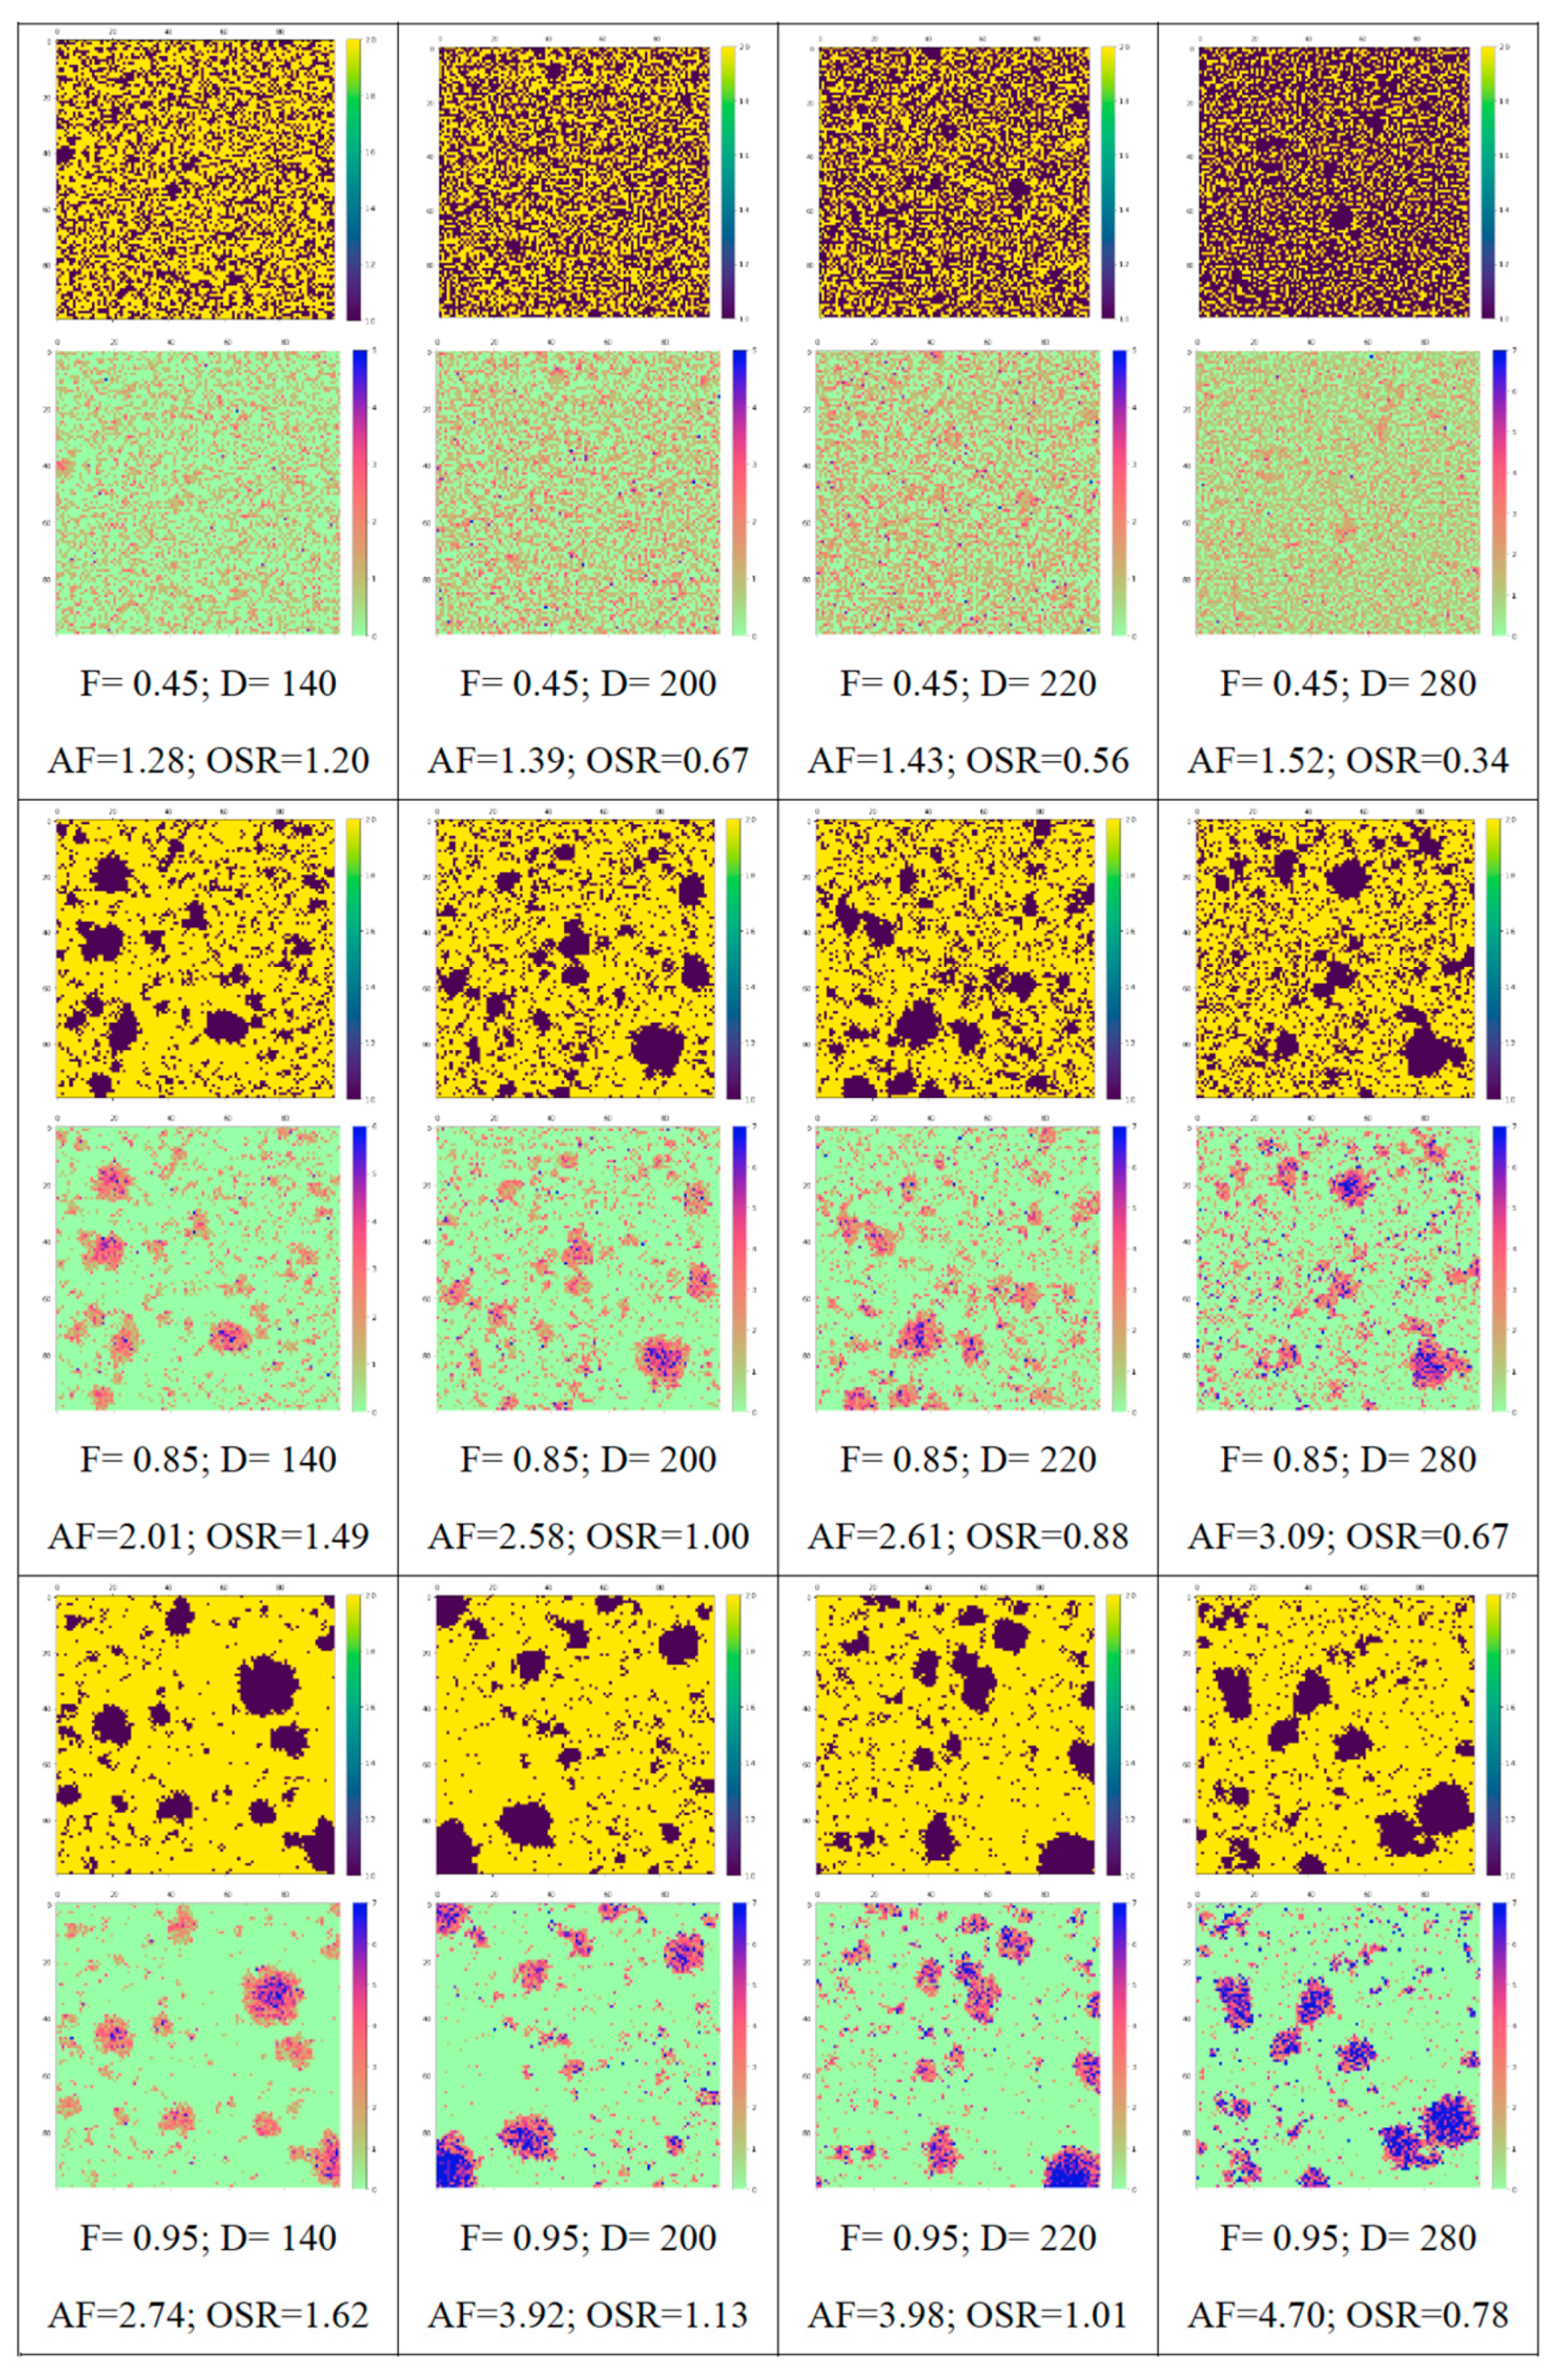
The size and distribution needs of community food systems were influenced by the interplay of production intensity (PI), population density (D) and friendliness (F), which was reflected in spatial patterns: “locally compact or evenly dispersed” horizontally and “undulating” vertically. The sample test would generate 12 results using 3 friendliness levels (F = 0.45, F = 0.85, F = 0.95) and 4 population density targets (D = 140, D = 200, D = 220, D = 280). The statistics would yield spatial morphological texture maps and productivity gradients and distributions, which would help to understand a population density threshold that was more conducive to community agriculture and distributed production and marketing, and refined the community food system model.
Observing the spatial morphological texture of the 12 sets of simulation results revealed the following (Figure 6).
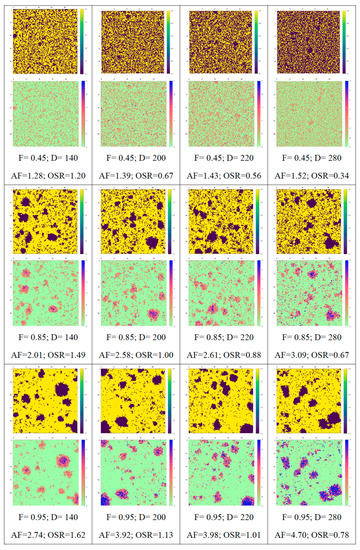
Figure 6.
Community space texture map. Above dark purple indicates residential units and yellow indicates planted units. The figure below shows the vertical height progression of the community from green-red-violet.
- (1)
- Community food systems could simulate a wide range of scenarios where population density and production intensity were within reasonable limits, but variation was still evident.
- (2)
- The current simulation factors only considered residential and planting matches, which were too homogeneous.
- (3)
- The main reasons for the “chaotic” state were the lack of components of the food system in urban communities other than production, the need to supplement the components of processing, transport, consumption, and recovery, as well as to increase basic parameters such as circulation and communication to help produce more stable results.
- (4)
- Dwelling units were not controlled in terms of lower and upper limits of fragmentation and concentration, such as sunlight pacing, fire safety distances, etc.
In summary, the problems exposed by the current sample testing were largely due to the use of only one pair of relationships (“residential-agricultural”) in the community food system model and the lack of feedback effects of other relationship conditions. The model also needed to be tested for viability in larger scale urban practice, i.e., the idealized 4 ha community model as in Section 3.2 and the 16 ha urban model planning program in Section 3.3.
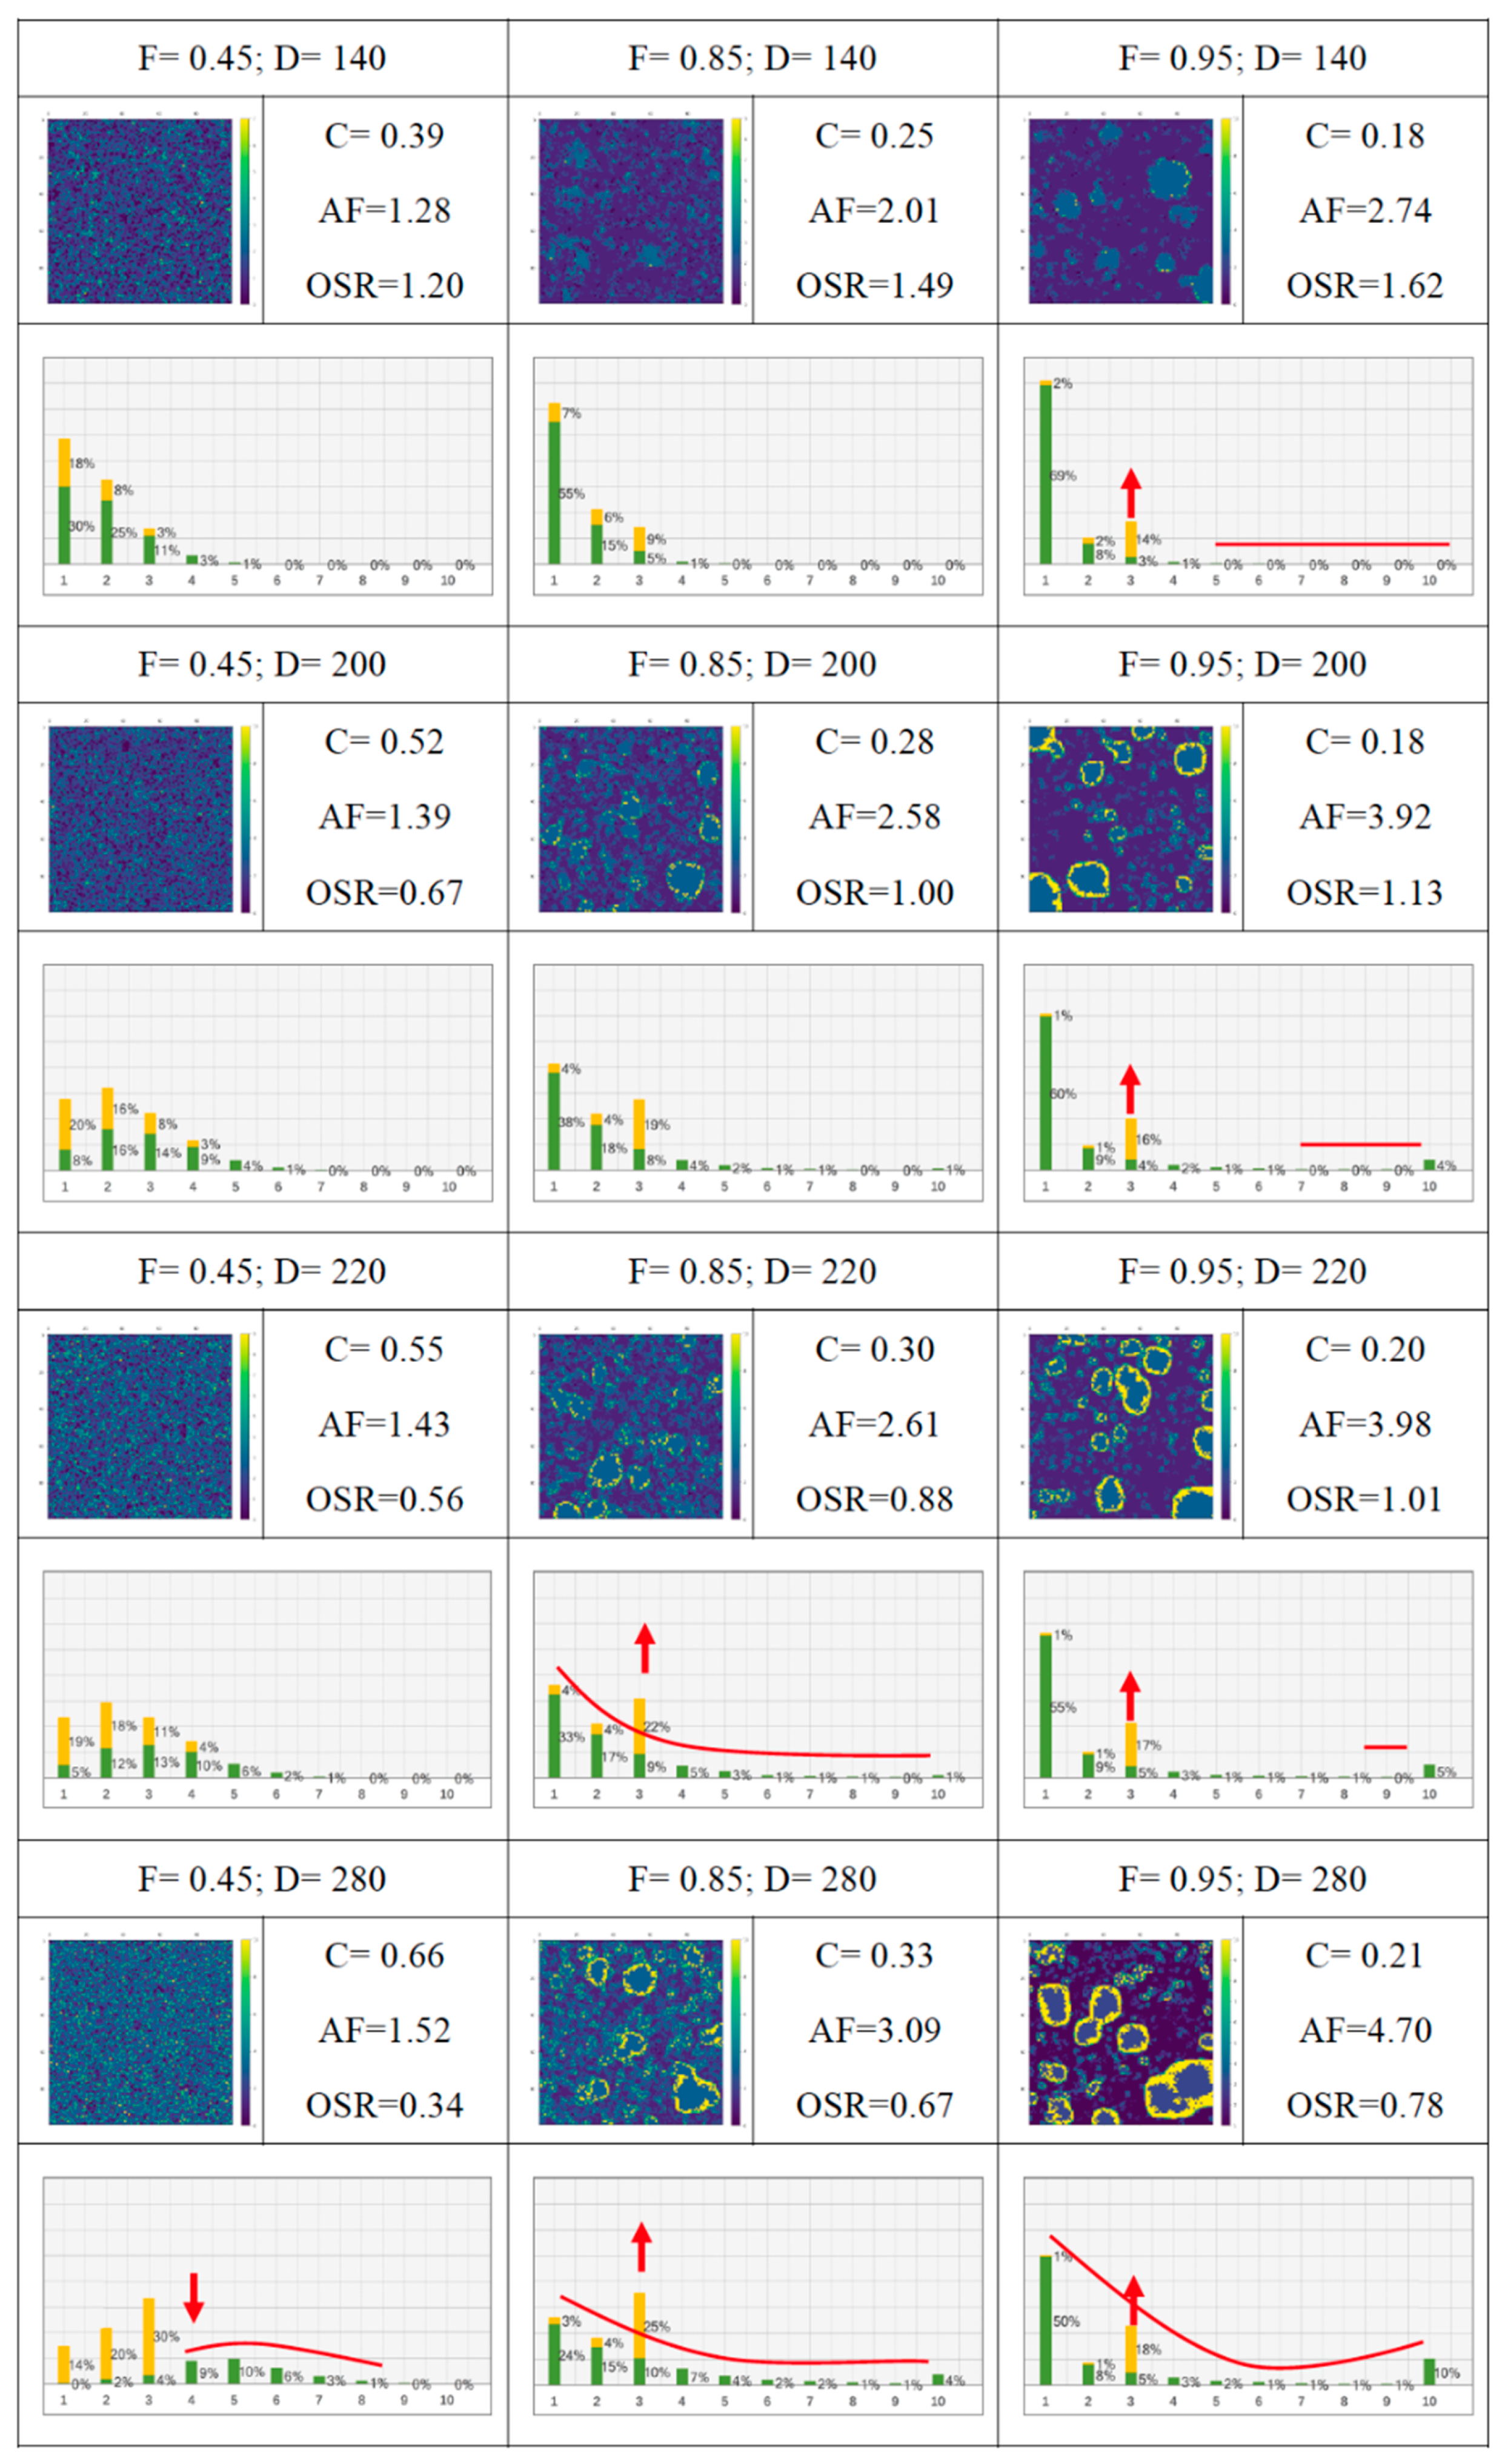
Observing the productivity intensity and distribution plots of the 12 sets of simulation results revealed the following (Figure 7).
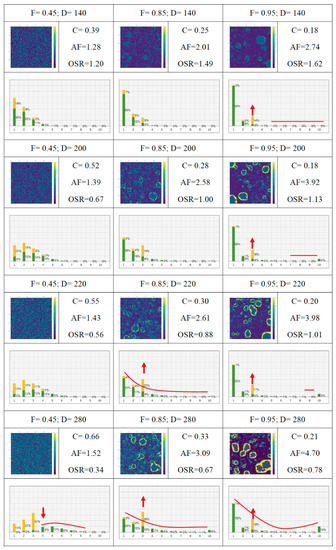
Figure 7.
Productivity intensity distribution chart, blue-green-yellow shows the intensity of production from 1–10. The gradient histogram shows the proportion of each intensity, with yellow indicating roof planting and green indicating ground planting.
- (1)
- The more evenly distributed the site, the more evenly distributed the production intensity, and the production intensity increased slowly with land shortage (first vertical column). However, at (F = 0.45, D = 280), there was a cliff in the overall production intensity gradient when the above-ground growing intensity gradient was normal. The reason was that the community was overly dependent on rooftop agriculture for food supply at high occupancy and low open rates, so the introduction of indoor facility agriculture could be considered for mitigation.
- (2)
- The site distribution was moderate, with an increase in population density converting some of the low-intensity ground cultivation to high-intensity rooftop greenhouses (second vertical column). However, at (F = 0.85, D = 220) and (F = 0.85, D = 280), with high population densities, relatively low occupancy and high open rates, a “rooftop barrier” emerged—the high production intensity of rooftop greenhouses leads to limit the increase in the production intensity of above-ground cultivation. The reason for this was the way and distance in which dwellings access food.
- (3)
- The more concentrated the site distribution, the more pronounced the barrier to rooftop planting, but it eased as population density increased (third vertical column). Mitigation options one was to construct “high intensity planting belts” to serve large collections of dwelling units, as shown in yellow area on the Figure 7, and option two was to require high intensity rooftop greenhouses on almost all buildings.
- (4)
- The more uneven distribution of sites led to greater differences between productivity gradients at the same population density (each horizontal row). However, there was a problem of uncontrolled ratios between production intensities. In practice, the more complex the spatial distribution of the community, the more diverse the food system and the more targeted the production approach (corresponding to different production intensities), rather than relying only on high-intensity planting areas (either roof or ground) to meet food needs.
- (5)
- The overall view showed a clear diagonal dividing line between “normal” and “abnormal” from top right to bottom left. On the other hand, the contrast between the two groups from the upper left to the lower right showed that when the distribution of communities was very different (and the production intensity of roof planting changed accordingly), they occupied more or less the same area (and the productivity gradient of ground planting was also similar). This could be interpreted in the context of a real planning project: by designing a number of relatively concentrated “large” buildings, it was possible to accommodate more inhabitants and food supplies on the same or even less land than in a number of separate “small” buildings.
3.2. Community Models
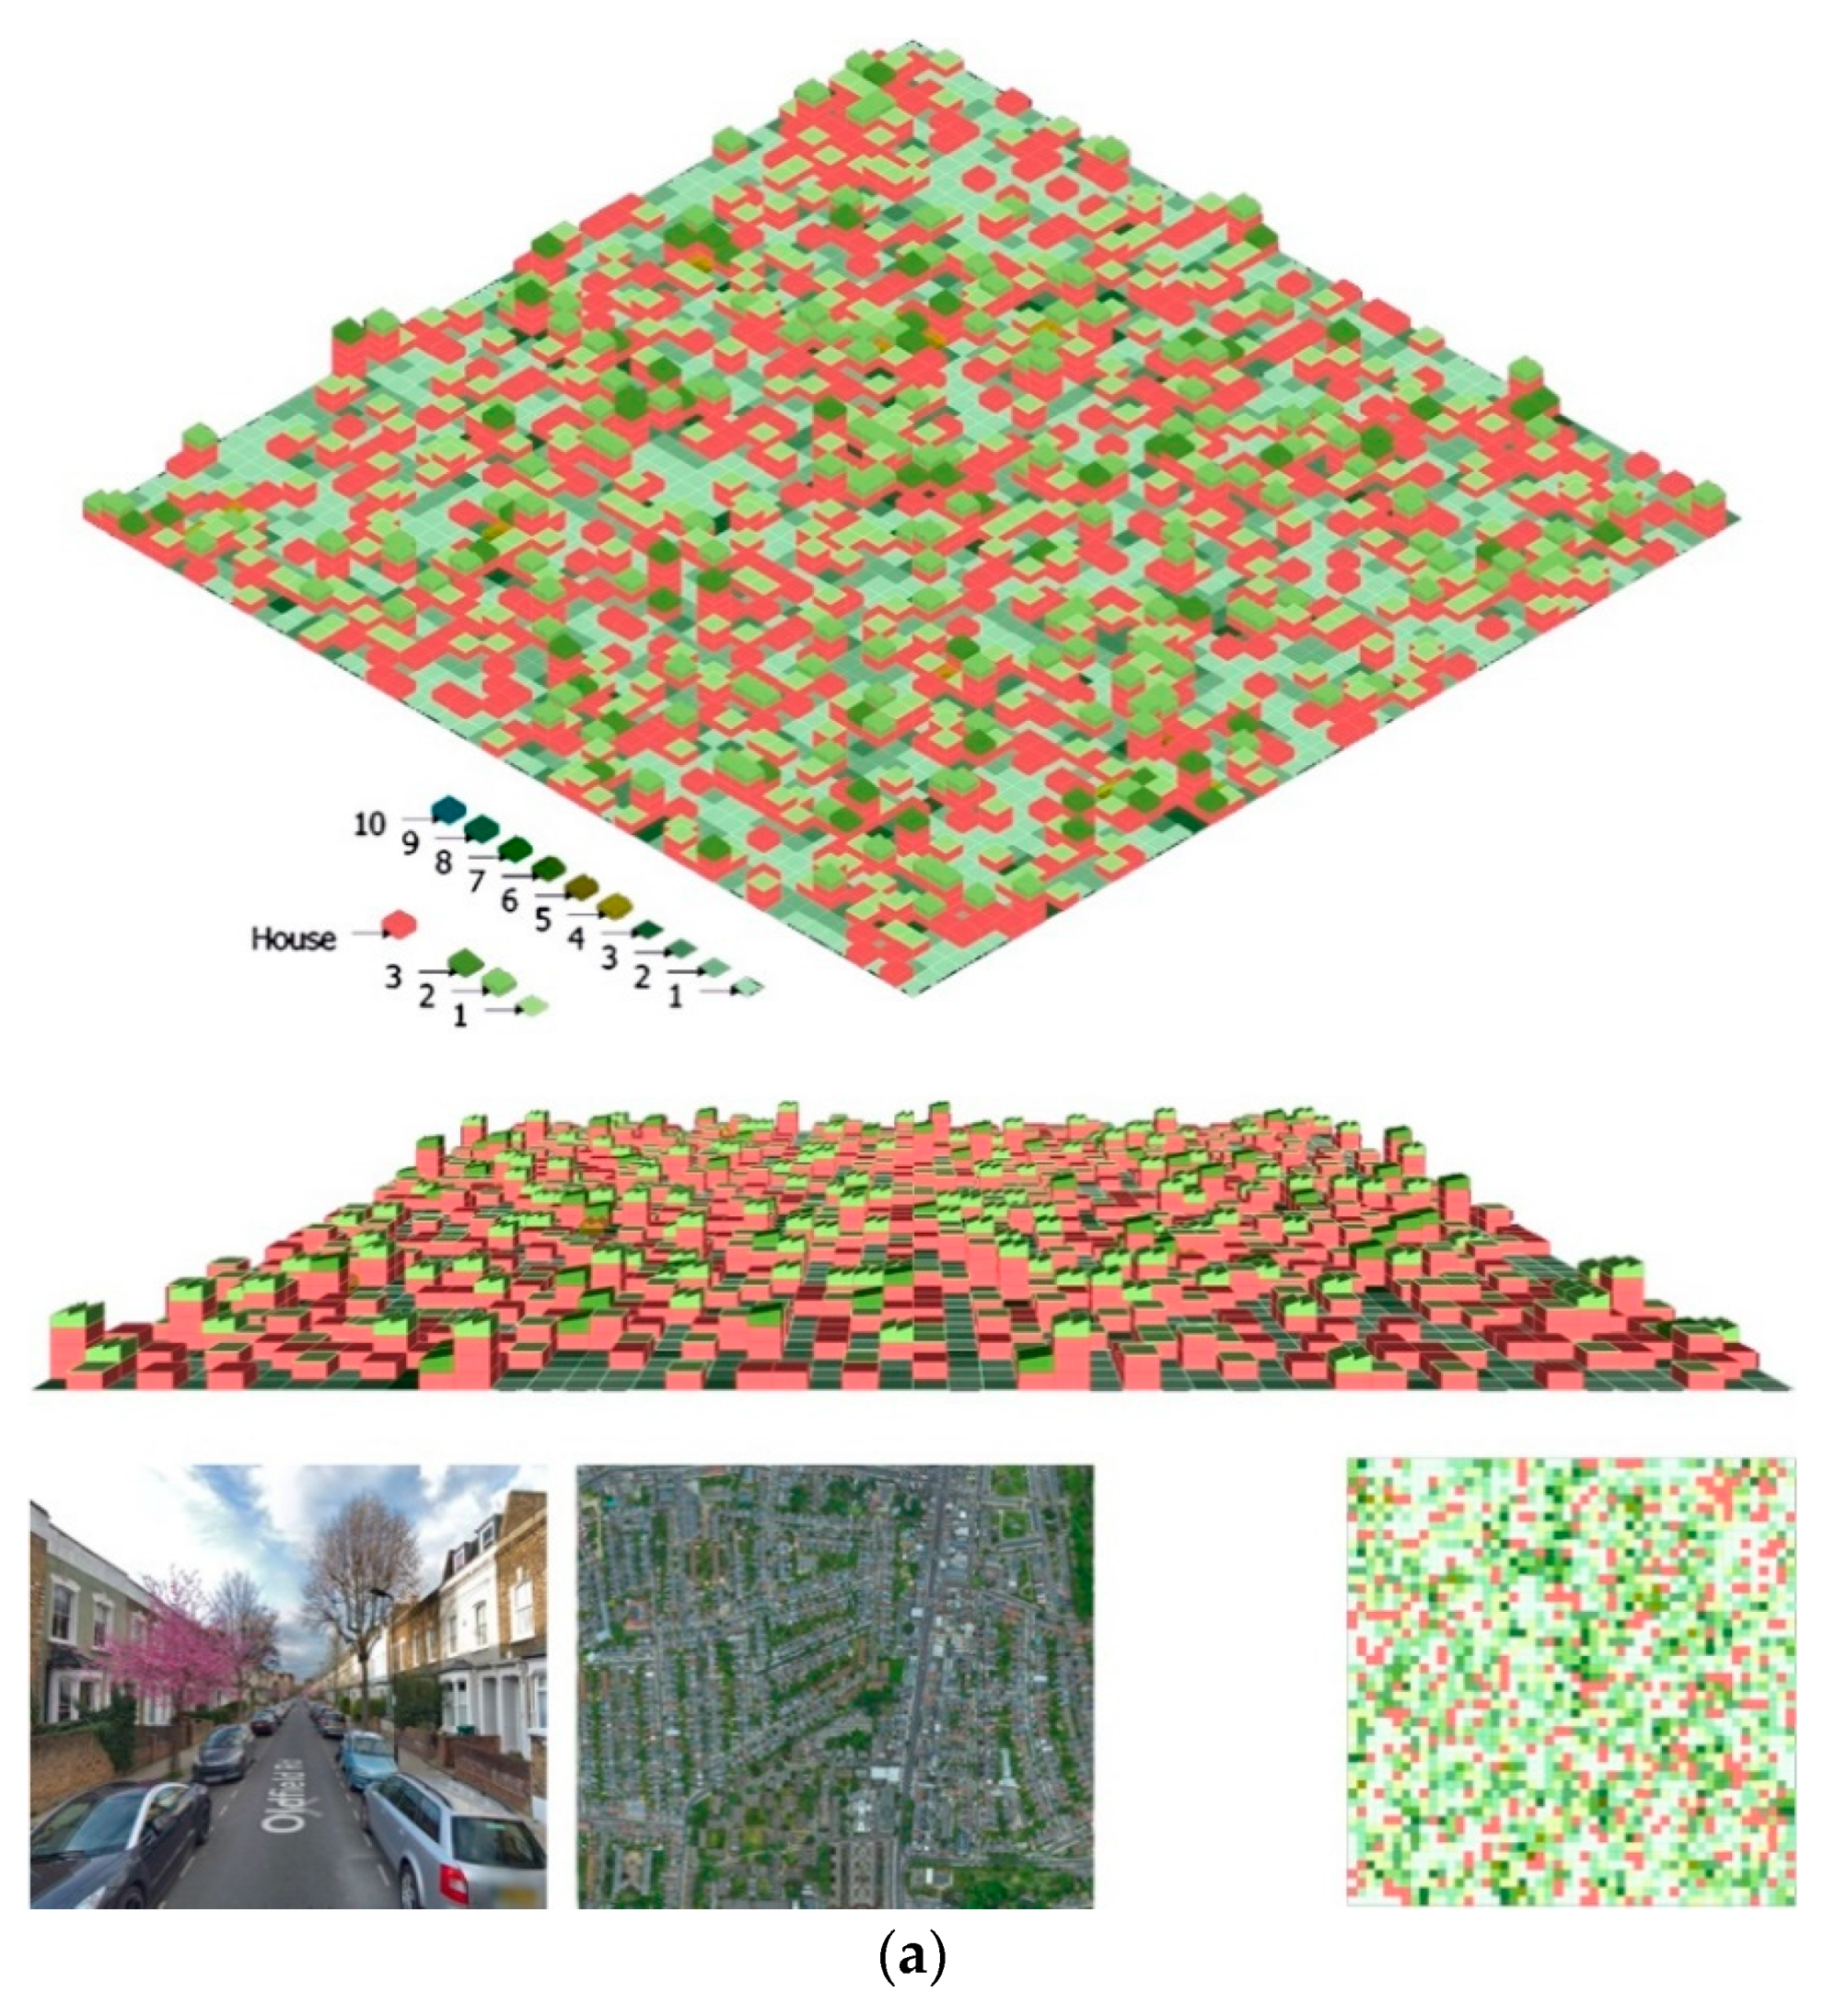
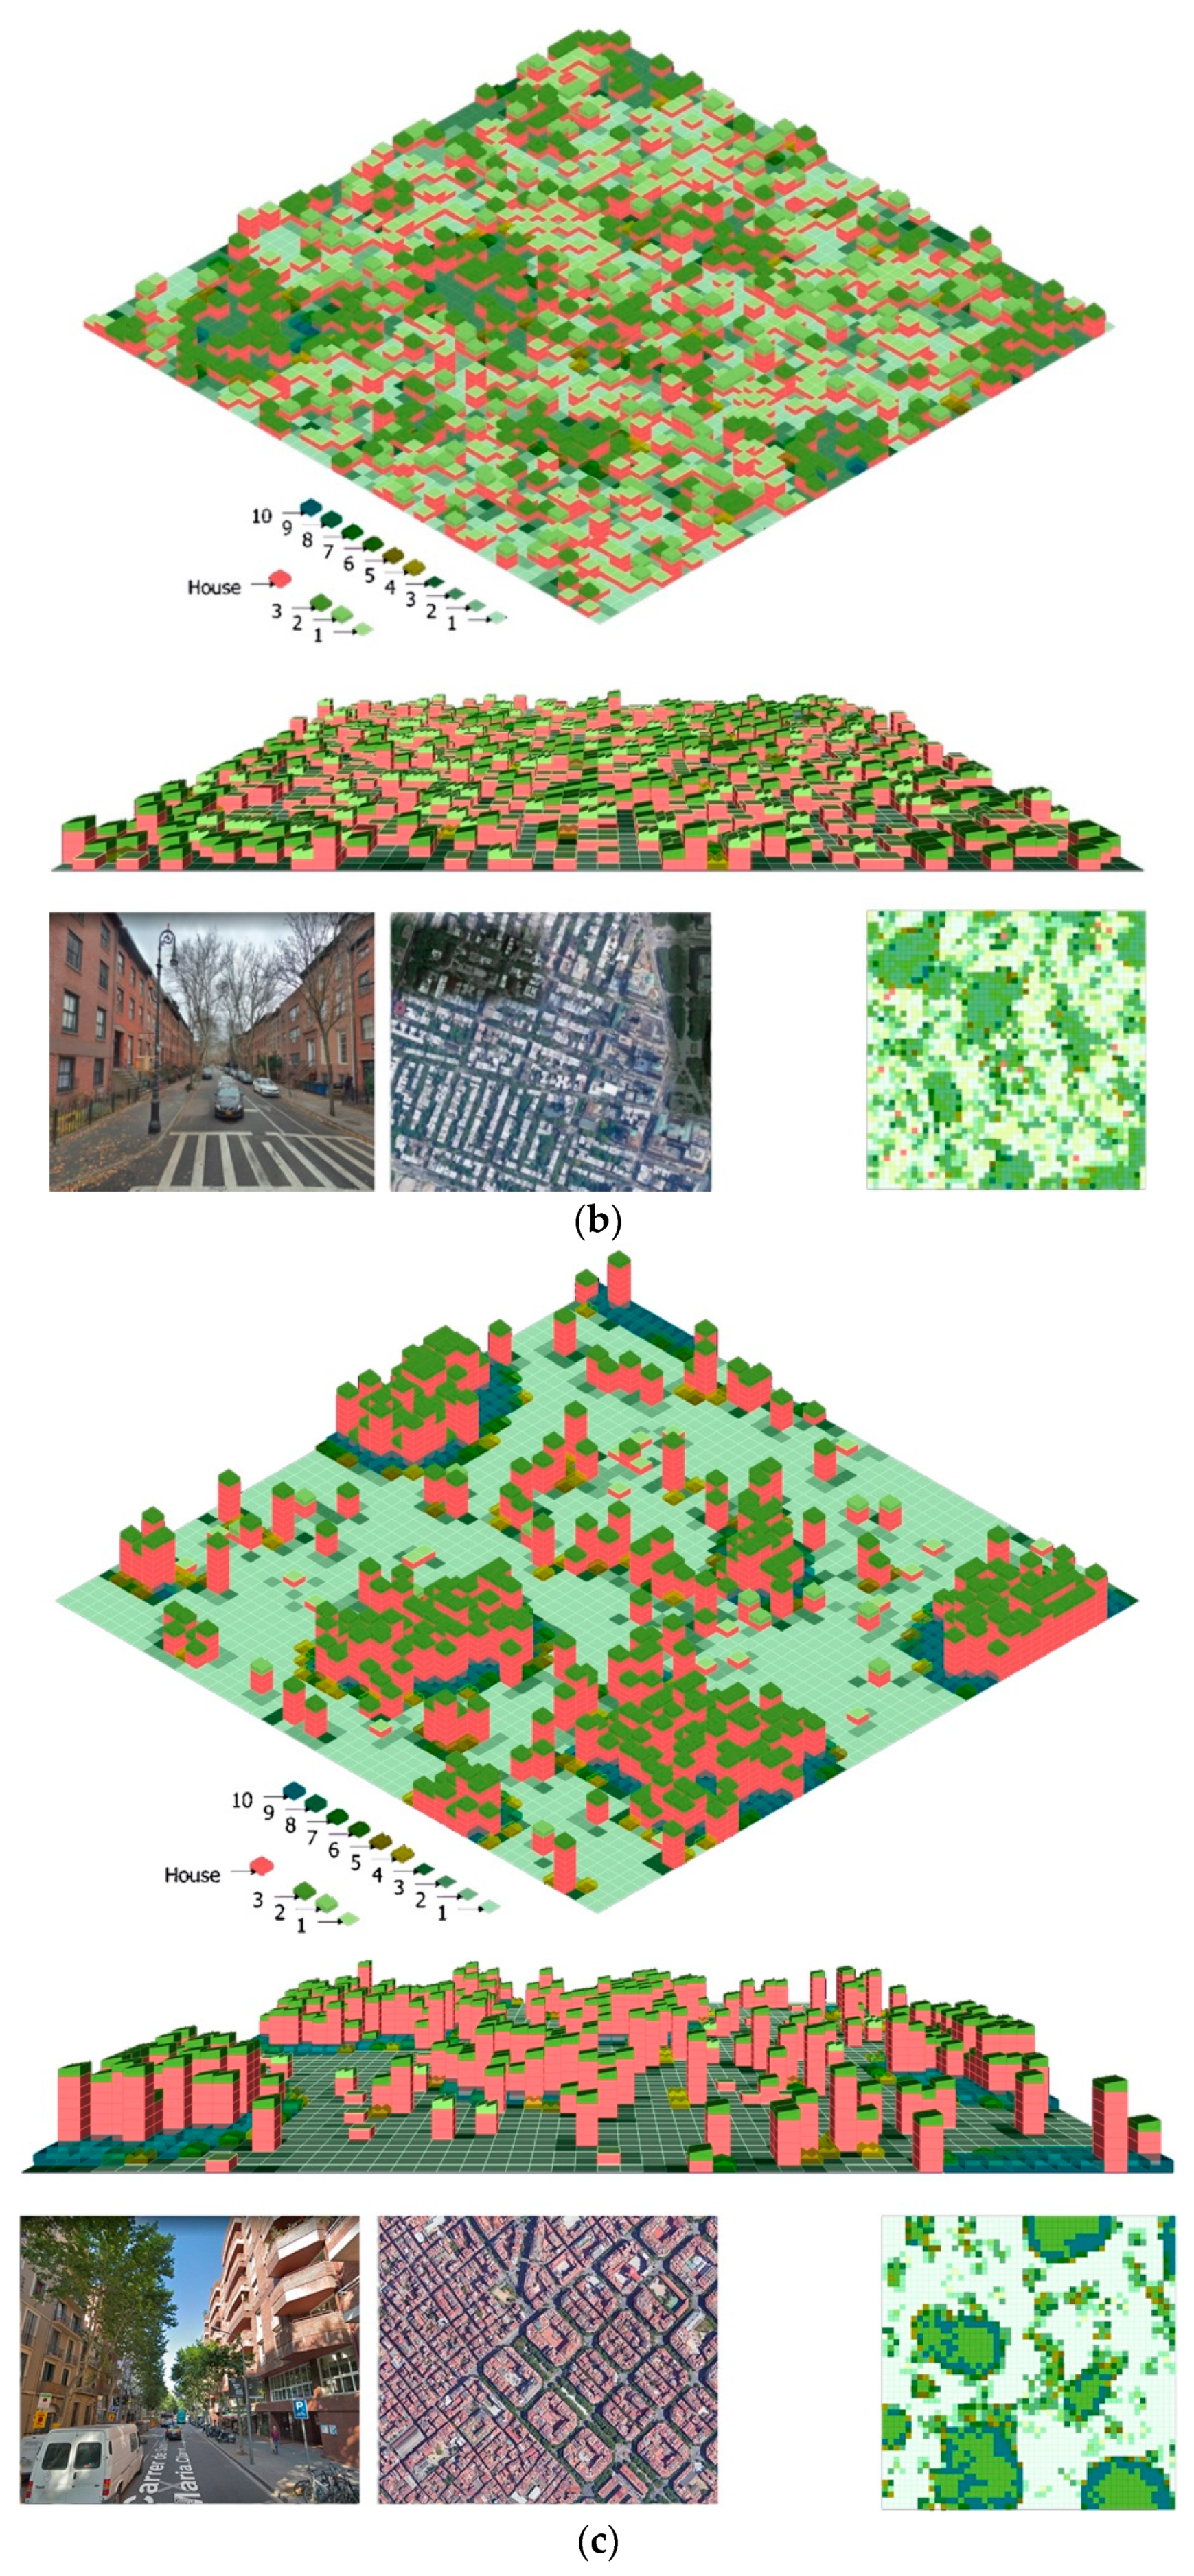
Three sets of 600m · 600m community models corresponding to Stoke Newington in London, Brooklyn Heights in New York, and Gracia in Barcelona, respectively, provided an initial indication that there was an opportunity to construct a form of distribution in urban organizations that fully integrated housing and farming by limiting the distances at which communities are allowed to move agriculture (Figure 8). Targeting actual population densities would require communities to develop vertically and increase agricultural productivity. The community model, while not quite reaching the level of a complete food system, pointed the way to subsequent research.
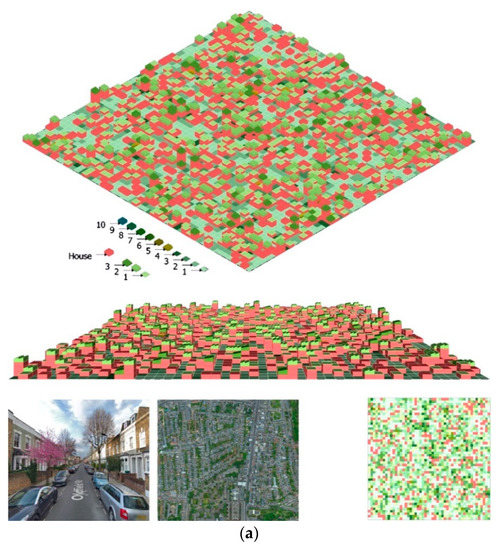
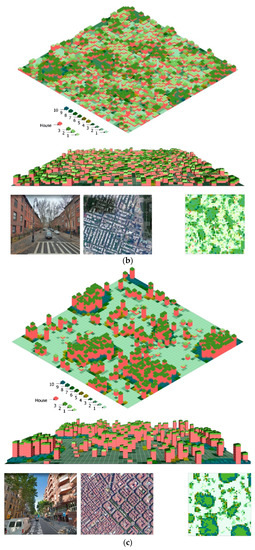
Figure 8.
Isometric diagram of community simulation: (a) Stoke Newington in London, F = 0.45, D = 140; (b) Brooklyn Hights in New York, F = 0.85, D = 140; (c) Gracia in Barcelona, F = 0.95, D = 140.
- (1)
- The current community model was only a small part of the theoretical model, and the logical rules should be more detailed according to the real situation of urban agricultural activities; for example, the intensity of cultivation should be tied to the area, location, and other spatial elements, and the spatial pattern is not sufficiently constrained.
- (2)
- Filtering and linking food supply and distribution nodes need to be applied to the topology of the food transportation network, and maximizing the value of local production and consumption need to link community public buildings, energy, water resources, social networks, etc. to form a true community food system model.
- (3)
- The algorithm was prone to misjudge the causes of the results produced, which required other methods to quantitatively evaluate the results and guarantee accurate resolution of indicators in urban space. Although the simulation model did not exactly match the real city, its functions included testing the rigor of the theoretical model, providing scale predictions for the design, or even just exploring other possibilities.
- (4)
- As a community food system simulation, although the color matrix patches could show the basic morphology, it lacked the fine three-dimensional effects to show more details. The self-organizing feedback mechanism of the system dynamics proposed by the theoretical model was inadequate, and the simulation parameters were currently modified by artificially processing the production results.
3.3. Planning Programme
This spatial simulation model was not just a neighborhood, but a prototype. The urban agriculture-oriented spatial growth algorithm could be implemented throughout the city and the larger region, and the results of each implementation would vary depending on the context of the location. As an example, an urban super-residential project had a total land area of 16 hectares, of which 230,400 m2 was residential, which translated into a population density (D) of 400 and required a coverage ratio (C) of 0.53, a floor area ratio (FAR) of 6.08, and a green space ratio of 100%.
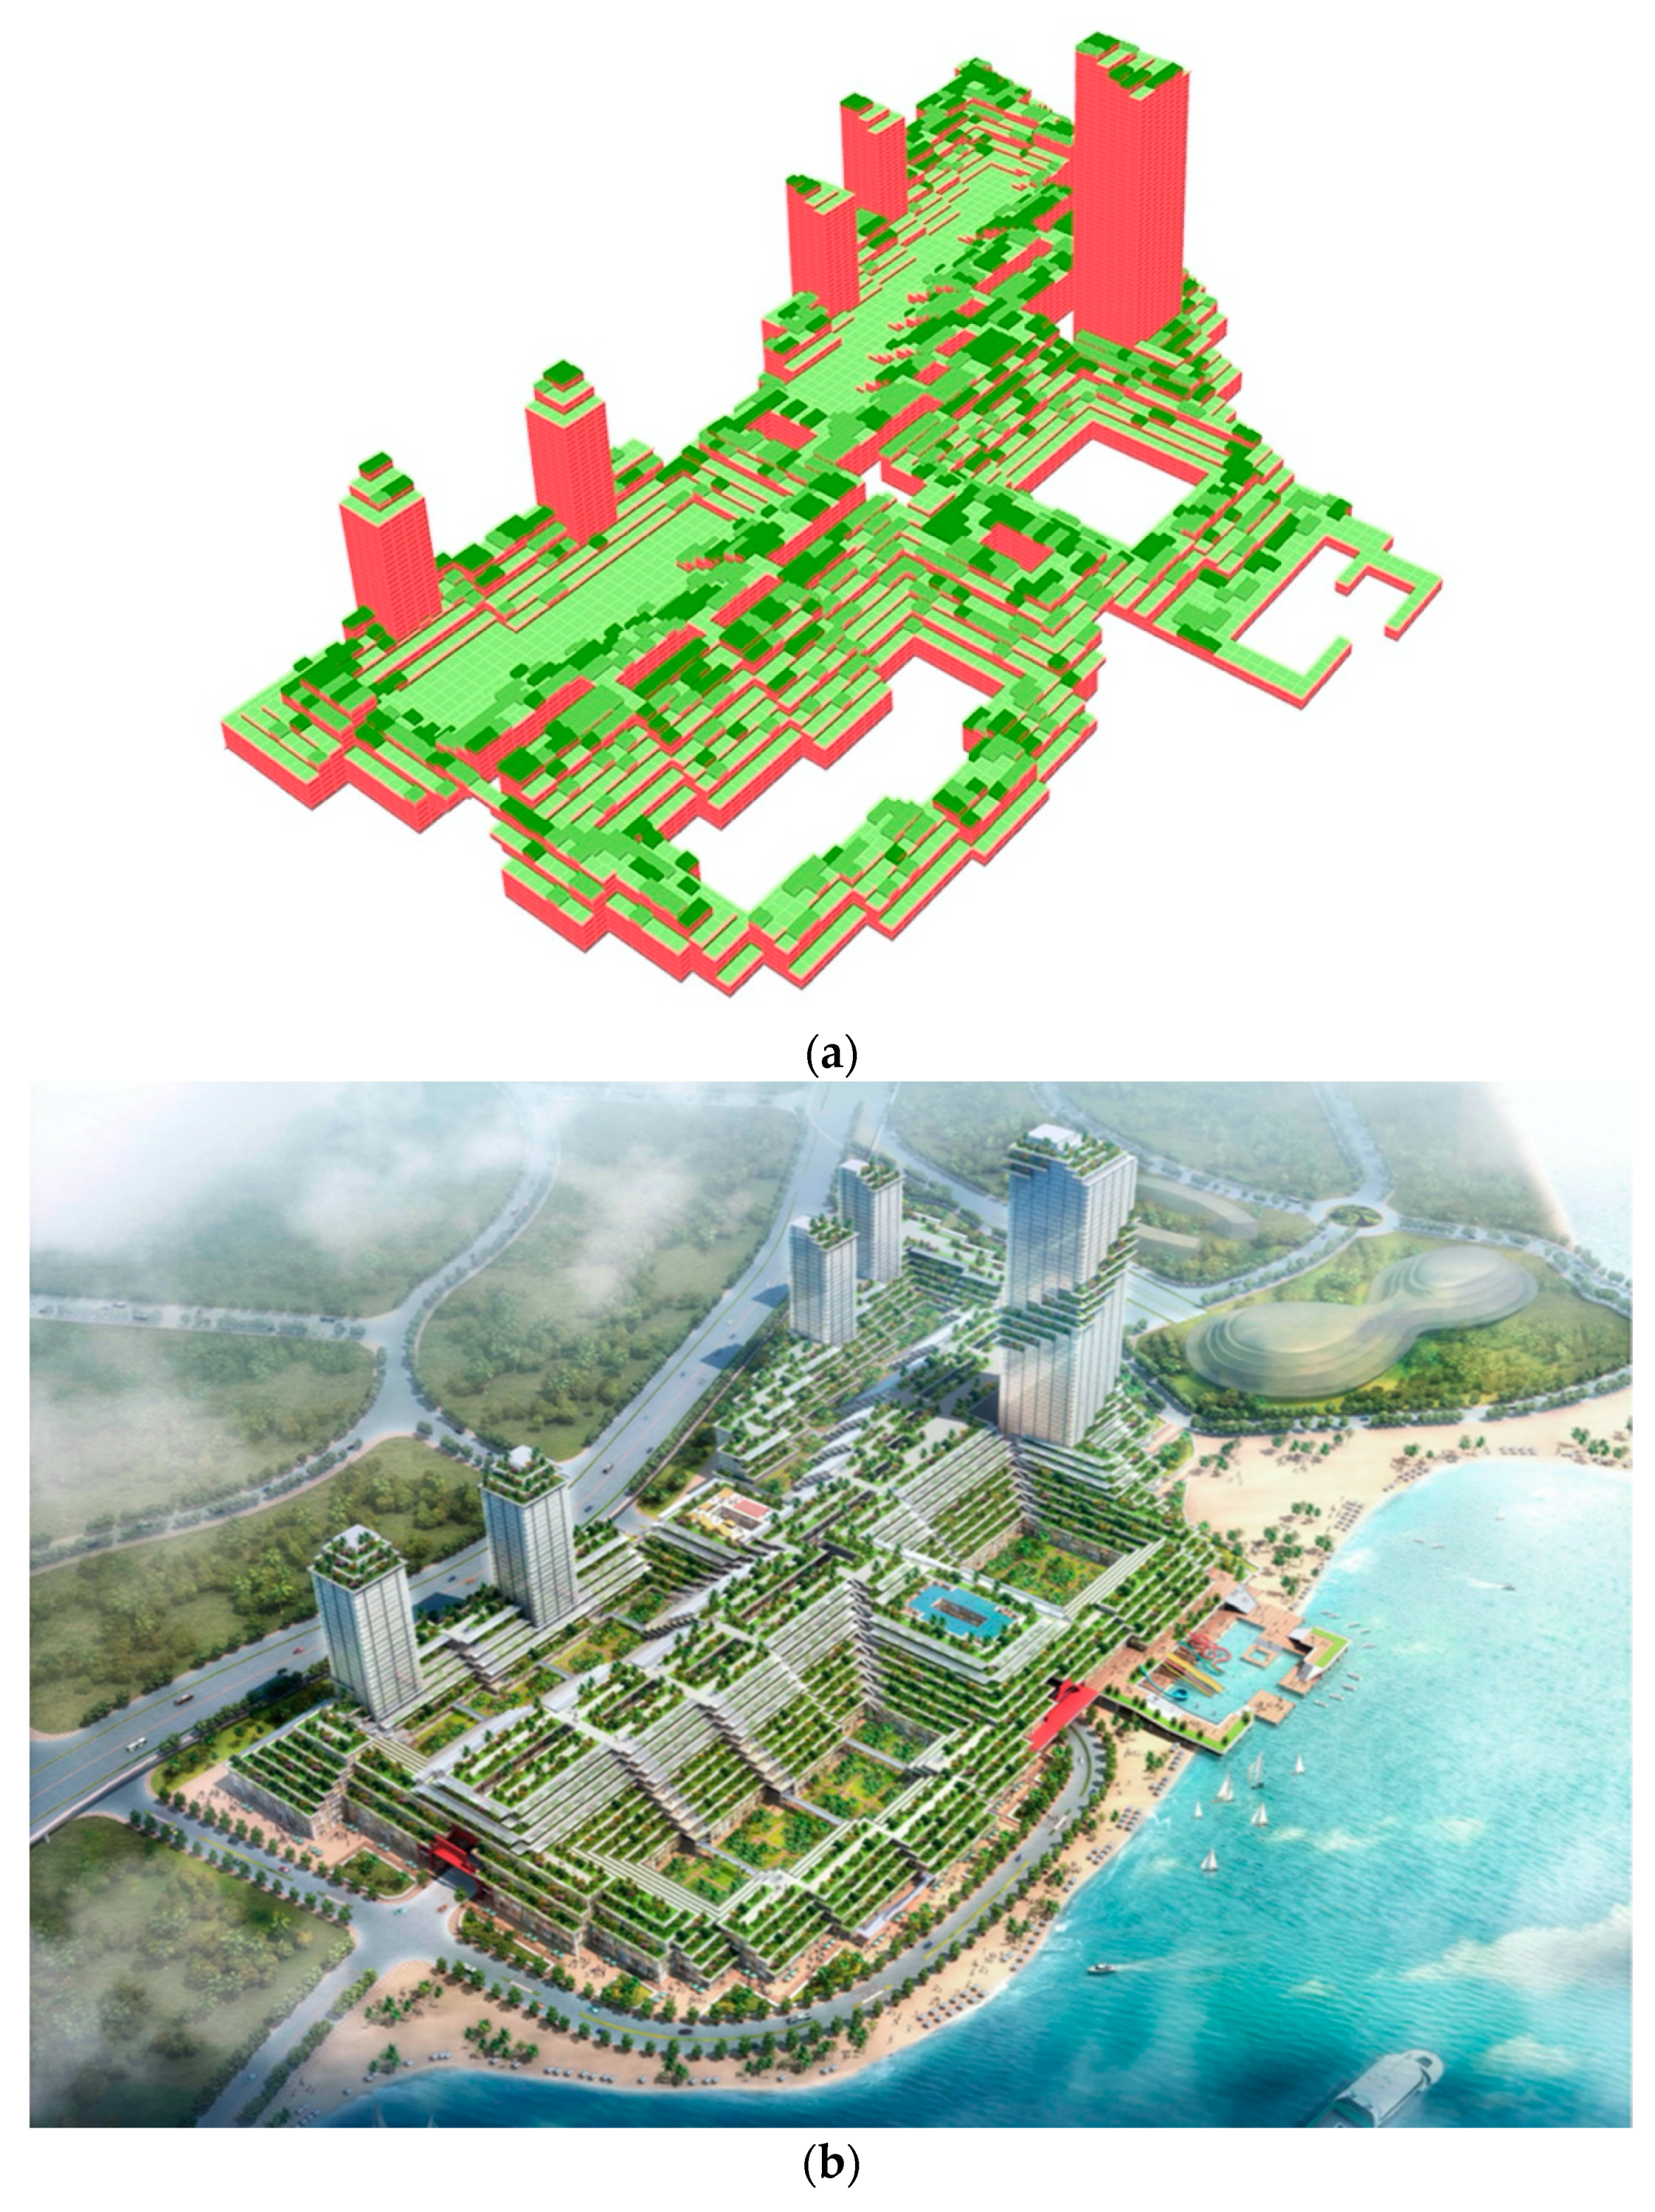
Adjusting parameters to an actual urban project, the simulation model provided design guidance for “Second Nature: Eco-reconstruction Terraced Forest Urban Ecological,” a plan for future urban food systems (Figure 9). It integrated food production (terraces and forests), food logistics (transportation), and food consumption (buildings) to recreate the urban metabolism and explored a new concept of productive cities for future sustainable development—from consumption to production, globalization to localization, centralization to distribution, singularity to integration.
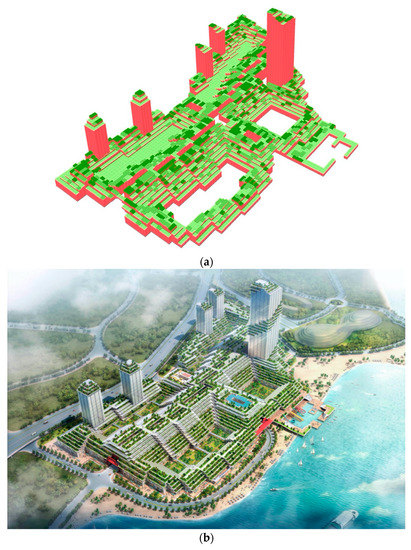
Figure 9.
Second Nature: Eco-reconstruction Terraced Forest Urban Ecological: (a) Spatial planning simulation model; (b) Aerial view of Terraced Forest City.
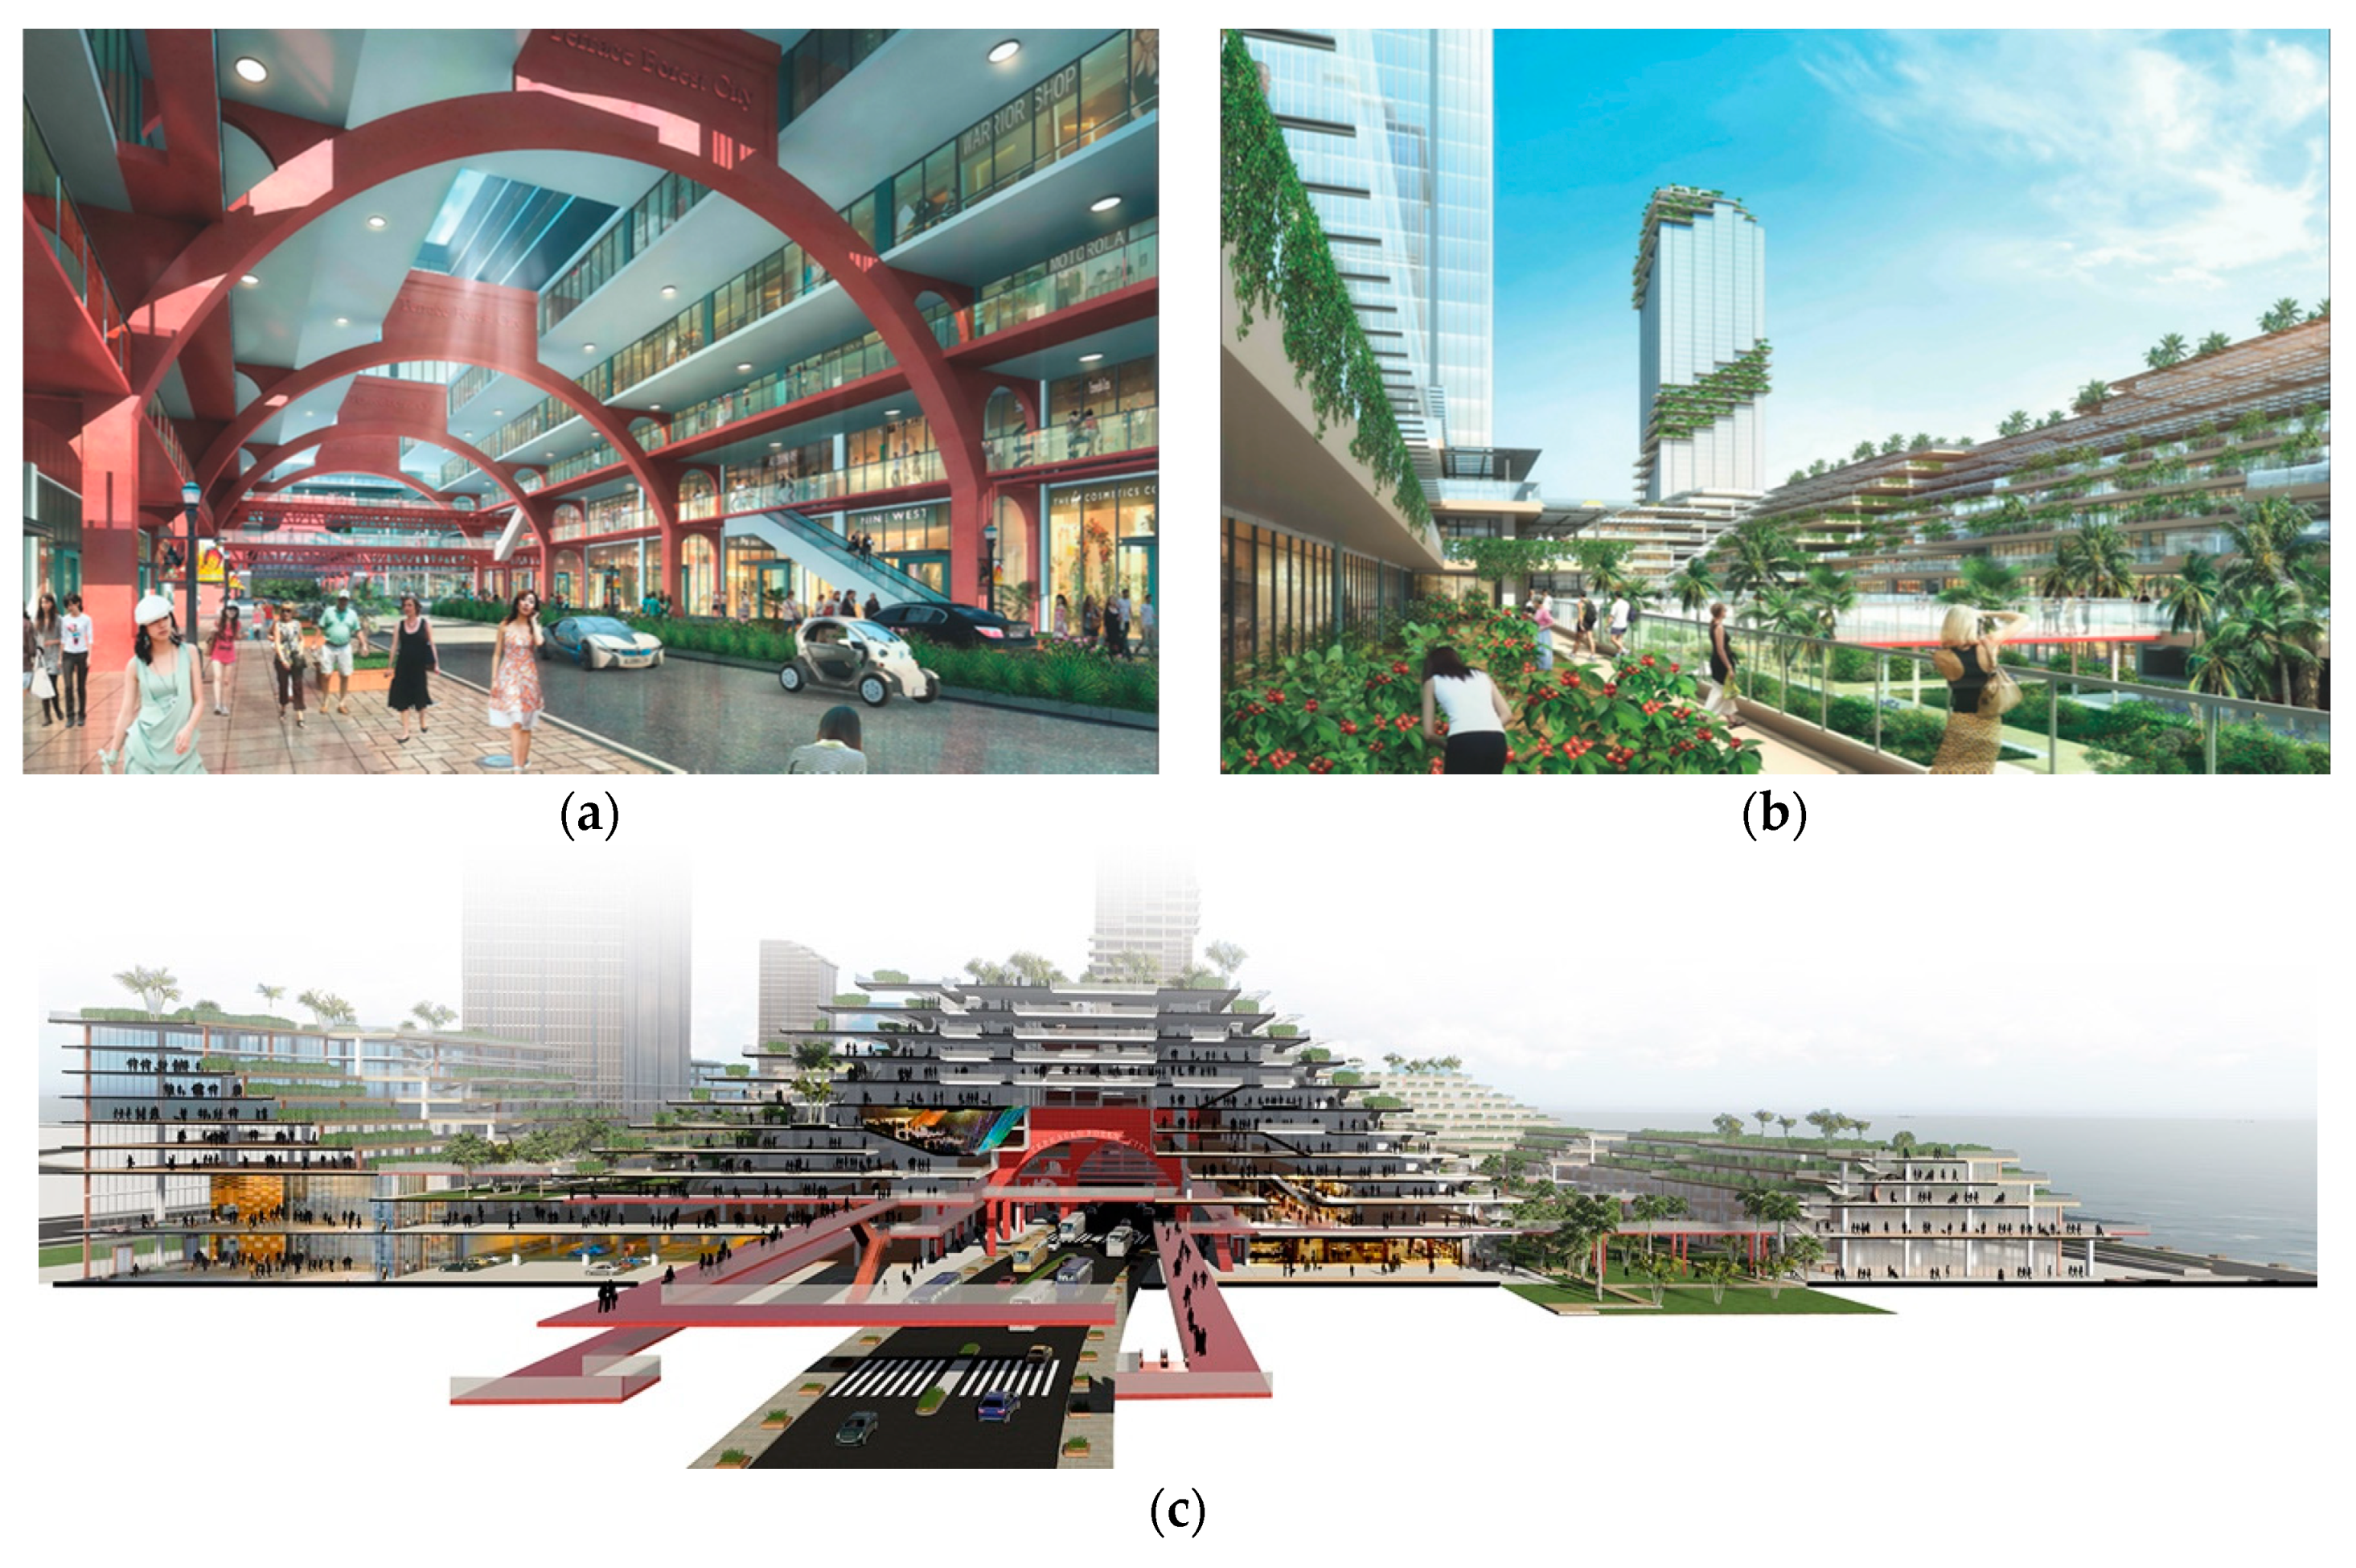
The main strategies and features of spatial planning of food systems were as follows (Figure 10).
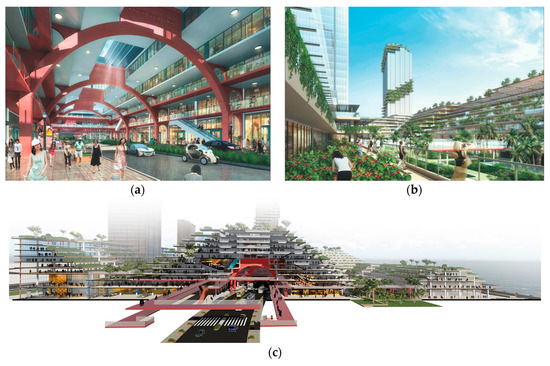
Figure 10.
Terraced forest cities based on urban agriculture orientation: (a) Internal roads for building and transport integration; (b) Planting areas such as roofs, facades, terraces, and courtyards; (c) Cross-sectional perspective view.
- (1)
- Second nature covered by food production
All large motorized roads were covered by buildings, available urban surfaces (roofs, terraces, courtyards, etc.) were planted with fruit trees and vegetables, light-transmitting photovoltaic roofs were erected on the parts with good sunlight conditions, and the sites covered with food production were integrated with the external natural environment to meet the land demand for food production.
- (2)
- Eco-building for green production
Terraced home layouts provided homes with planted front yards suitable for growing, farming, and managing fruits and vegetables. Whether for home consumption or for market, the healthy nutritional and economic benefits could also provide employment opportunities for residents and shape the community farmer in the food system.
- (3)
- Three-dimensional integrated urban form
Through the integration of terraces, transportation, and architecture, it created zero distance food miles, breaking the flat urban form and isolated monolithic buildings. Building-covered roads both saved land and shaded. The terraced agricultural landscape in the opening courtyard extended the strolling leisure space to the residents on each floor, and provided a second escape route that was not normally available in high-rise buildings.
In short, community planning oriented towards urban agriculture, which aims to “open source and reduce costs simultaneously, balance production and ecology,” if promoted, could significantly reduce the ecological footprint deficit and mitigate climate warming trends.
4. Conclusions
The tension between sustainable urban development and overstretched resource consumption called for a new sustainable food system. Research on food systems had increased significantly over the past decade, but had been limited to strategic, policy, and theoretical planning, and research on sustainable food system models in urban transformation was relatively scarce.
As Caroline Steel argues, the current food system problems are rooted in a long-standing underestimation of the economic costs of natural capital [17]. As the basic resources of the current urban food system become increasingly scarce, we could see that the underlying assumptions that led to the spatial separation of production and consumption were flawed. While historically, it seemed inevitable to consider urban land values to move agriculture within existing transport boundaries, from the perspective of the coming crisis, these economic assumptions could no longer be taken as inevitable.
Therefore, this paper proposed a food systems-based model of productive urban community planning that considered urban agriculture as an integral part of green infrastructure. In contrast to the current urban model, the productive city concept [57] was that in addition to passively reducing urban consumption, it should be more proactive in green production, including material, energy, and space resources, in an effort to maximize sustainable urban development.
Productive cities had experimented with innovation by reflecting food systems directly into spatial planning through urban agriculture-oriented community planning, from theoretical models for planning strategies, to simulation models for morphological predictions, to design models for spatial planning, paving the way for holistic productive city research and providing a reference for building urban communities that support sustainable consumption and production.
In urban agriculture-oriented community planning, agriculture and city were viewed as a system of expandable cellular units. These units were organized into an interdependent network of “cultivation units (production)” and “dwelling units (consumption).” The model took local conditions as inputs and adapted the outputs to different land-use requirements in urban, suburban, and non-urban contexts. At the macroscopic scale, the result was a gradient in production intensity that allows for a heterogeneous distribution of production surfaces and building densities, and was capable of meeting a variety of production and urban indicators.
In a comparison of these spatially competing but functionally interdependent scenarios, this paper explored opportunities for new urban spaces and typologies to address competing demands for urban land and the large surface areas needed to feed urban populations. Local food production would significantly reduce transportation costs and environmental impacts, and benefit from new food system cycles. The resulting new urban spaces would allow urban consumers to rethink their food sources and provided new opportunities for work and play.
This paper demonstrated the potential of using algorithmic design tools in planning future cities. The ability of an urban agriculture-oriented community planning model to generate various solutions (in the form of spatial patterns) based on given inputs was key to successful future implementation. So far, however, the spatial model of community planning had not resulted in a hierarchical network, and further research would differentiate road flows according to the functional needs of residents and optimized the spatial organization of the city through feedback loops.
Cities of the future would be huge systems that were interactive, holistic, organized, and more complex. It was important to introduce new concepts such as productive cities and use new technologies such as big data and artificial intelligence algorithms. However, translating these into practical urban spatial planning strategies still required more in-depth research.
Author Contributions
Conceptualization, Y.Y. and Y.Z.; methodology, Y.Y.; software, Y.Y. and S.H.; validation, S.H.; formal analysis, Y.Y.; investigation, Y.Y.; resources, Y.Z.; data curation, S.H.; writing—original draft preparation, Y.Y.; writing—review and editing, Y.Z.; visualization, S.H.; supervision, Y.Z.; project administration, Y.Z.; funding acquisition, Y.Y., and Y.Z. All authors have read and agreed to the published version of the manuscript.
Funding
This research was funded by the Natural Science Foundation of China Project, grant number 51978443; 2019 Tianjin Graduate Research and Innovation Project, grant number 2019YJSB175; the Chinese Government Scholarships.
Conflicts of Interest
The authors declare no conflict of interest.
Appendix A

Table A1.
History of planning theories affecting food systems after the industrial revolution.
Table A1.
History of planning theories affecting food systems after the industrial revolution.
| 18th to 20th Centuries | Reconfiguring Urban-Rural Linkages |
| late 18th century | Waste generated by the city of Paris can be used as a source of agricultural fertilizer |
| 1818–1826 | Thünen’s model: market value of land, agricultural prices, and transport costs lead to a concentric ring structure of urban land |
| mid-19th century | Rural and urban as interconnected ecological and economic cycles |
| 1856 | Replacement of a large French “workers’ home” farm with a small kitchen garden |
| late 19th century | The system of “citizen farms” established in Germany |
| 1903 | Howard’s Garden City consists of interconnected city-states, with 5/6 of land devoted to food production, promoting local food supplies |
| 1915 | “Evolutionary City” introduces agricultural green belts to form agricultural chains |
| 20 | Wright’s Broadacre provides agricultural self-sufficiency with one acre of living gardens per home, connected by a highway system in a low-density horizontal area |
| Early 20th Century | Modern Development of Cities, Agriculture, and Marketed Foods |
| 1924 | The agricultural market in the Soviet Union created an orderly and informative agricultural activity |
| 1922 | La Ville Radieuse |
| 1940 | First building with prefabricated curtain wall panels—Jean-Brouilly Market, France |
| World War II | Victory Gardens, USA |
| 1949 | Hilberseimer’s New Region Pattern incorporates decentralized small-scale agricultural production spaces in industrialized cities, creating an integrated layout with more efficient land use |
| late 1940s | Techniques et Architecture: New industrial farm buildings have replaced old farm buildings |
| Mid-20th century | Rethinking Large-Scale Mechanized Agriculture |
| 1956 | Mexico: modular components build Felix Candela’s Coyoacto Market |
| 1960s and 1970s | Greece: mechanized farms combined with traditional farms |
| 1960s and 1970s | Japan: climbing private land prices, arable land preserved in cities |
| 1961 | Metabolist combines traditional agriculture with modern cities |
| 1968 | Food-growing activities in “Sea Farms” can take place anywhere |
| The 1970s | Urban Farms Develop Radically and Freely |
| 1970 | New York government uses public land to fund community farmland |
| 1971 | Architectural Design: Free Commune is a self-sufficient community |
| 1972 | Architectural Design: organic food movement around the world |
| 1973 | The oil crisis has changed organic food from a radical idea to a more pragmatic survival philosophy |
| 1978 | Sustainable Agriculture is an integrated system that simulates nature |
| The 1980s to Early 2000s | Modern Farms, Buildings, and Cities |
| 1980s | The resurgence of cheap oil |
| 1986 | Six types of community agriculture emerge in Canada |
| late 1990s | Different studies on urban agriculture from various disciplinary perspectives |
| 1994 | Urban Food Production: A Survey Of Evolution, Official Support, And Significance (with special reference to Africa |
| 1995 | Theory and Policy of Urban Agriculture |
| 1999 | Planning for the Purpose of Urban Agriculture: A Review of Tools and Strategies for Planners |
| 2000 | Pig City by MVRDV (an architectural firm) puts pig farming in a skyscraper |
| 2002 | The History and Future of Community-Based Urban Agriculture |
| 2004 | Creating Edible Landscapes, an exploratory practice of embedding agriculture in lower-income communities in developing countries, has further increased academic recognition of urban agriculture |
| 2005 | CPULs: continuous open spaces and green infrastructure in cities |
| 2006 | Growing Better Cities: Urban Agriculture for Sustainable Development |
| 2009 | Hydroponic vertical planting on curtain walls of high-rise buildings |
| 2009 | Agriculture Urbanism introduces the concept of agriculture-oriented community planning |
| 2009 | Propose an urban element based on CPULs including food systems |
| 2009 | Edible Rotterdam exploration of social, spatial, and technological production strategies |
| 2010 | Why Farm in the City? Observing Urban Agriculture Through the Theory of Metabolic Breakdown |
| 2011 | Food Sensitive Planning and Urban Design (FSPUD) |
| 2011 | Carrot City: Creating Space for Urban Agriculture identifies appropriate types of agricultural space in cities based on practice |
| 2013 | Sustainable Agricultural Urbanization: Low Density Cities in the Maya and Aztecs |
| 2013 | Urban Vegetable Gardens, Agriculture and Water Management: Roots of Urban Resilience for Long-Term Urban Food Security |
| 2015 | Expo Milano: urban agriculture moves from utopia to practice |

Table A2.
Comparison of four agriculture-related urban planning theories.
Table A2.
Comparison of four agriculture-related urban planning theories.
| Theory | Summarize | Space Organization Measures |
|---|---|---|
| 2005 CPULs | A resilient approach to redefining urban open space | 1. Construction of a continuous open space network within cities and an ecological green corridor between urban and rural areas. 2. Selection of a portion of the assessed space for the introduction of a continuous edible landscape, mainly for vegetables and fruits. 3. Multifunctional, coherent and sustainable infrastructure networks for multi-scale urban agricultural production. |
| 2009 Agriculture Urbanism | Agriculture-oriented community planning model | 1. Spatial division into six zones according to geographic location (spatial integration to form an agricultural urban form). 2. Allocation of different varieties to different scales of agricultural space (technological alliances to form local food systems). 3. Agricultural production of different intensities for rural-urban exchange (integration of behaviors to form a pluralistic participatory mechanism). |
| 2009 Food Urbanism | Organization of urban spaces and people’s lives based on urban food systems | 1. A typological summary of the spaces currently available for agricultural production in cities. 2. An in-depth exploration of the people, size, layout, varieties, responsibilities, distribution, etc. of each agricultural space type. 3. To build a spatial network of urban food systems, urban roads are divided into five types of circulation. |
| 2011 FSPUD | Water Sensitive Urban Design, WSUD | 1. Reconsider the main stages of food production, processing, transportation, and distribution. 2. Pay more attention to the upgrading of the urban food infrastructure and to increasing the environmental awareness of society. 3. Organic waste from the consumption of food is recycled and rainwater and grey water are collected for use. |

Table A3.
Planning strategy and spatial modeling of cases.
Table A3.
Planning strategy and spatial modeling of cases.
| Cases | Advantages | Disadvantages |
|---|---|---|
| Edible Rotterdam | Build a matching matrix from the needs of urban agriculture and the space currently available, with high operational feasibility | The layer filtering method is imprecise and only for built-up cities |
| Mapping Urban Agricultural Potential | 1. Target groups include governments, businesses, organizations or enthusiasts; 2. A geographic database; 3. An interactive tool | No specific design strategy after screening of urban spaces |
| Self-Sufficient Neighborhood Prototype | 1. Summarize the existing urban spatial logic and dismantle it into 8 subsystems; 2. Demand forecasting—Typology induction—Neighborhood prototyping—System settlement; 3. Design goals from quantitative feedback | 1. Top-down planning limits the possibilities of the overall spatial pattern; 2. The final prototype of the neighborhood does not have any obvious “self-sufficient” spatial characteristics |
Appendix B
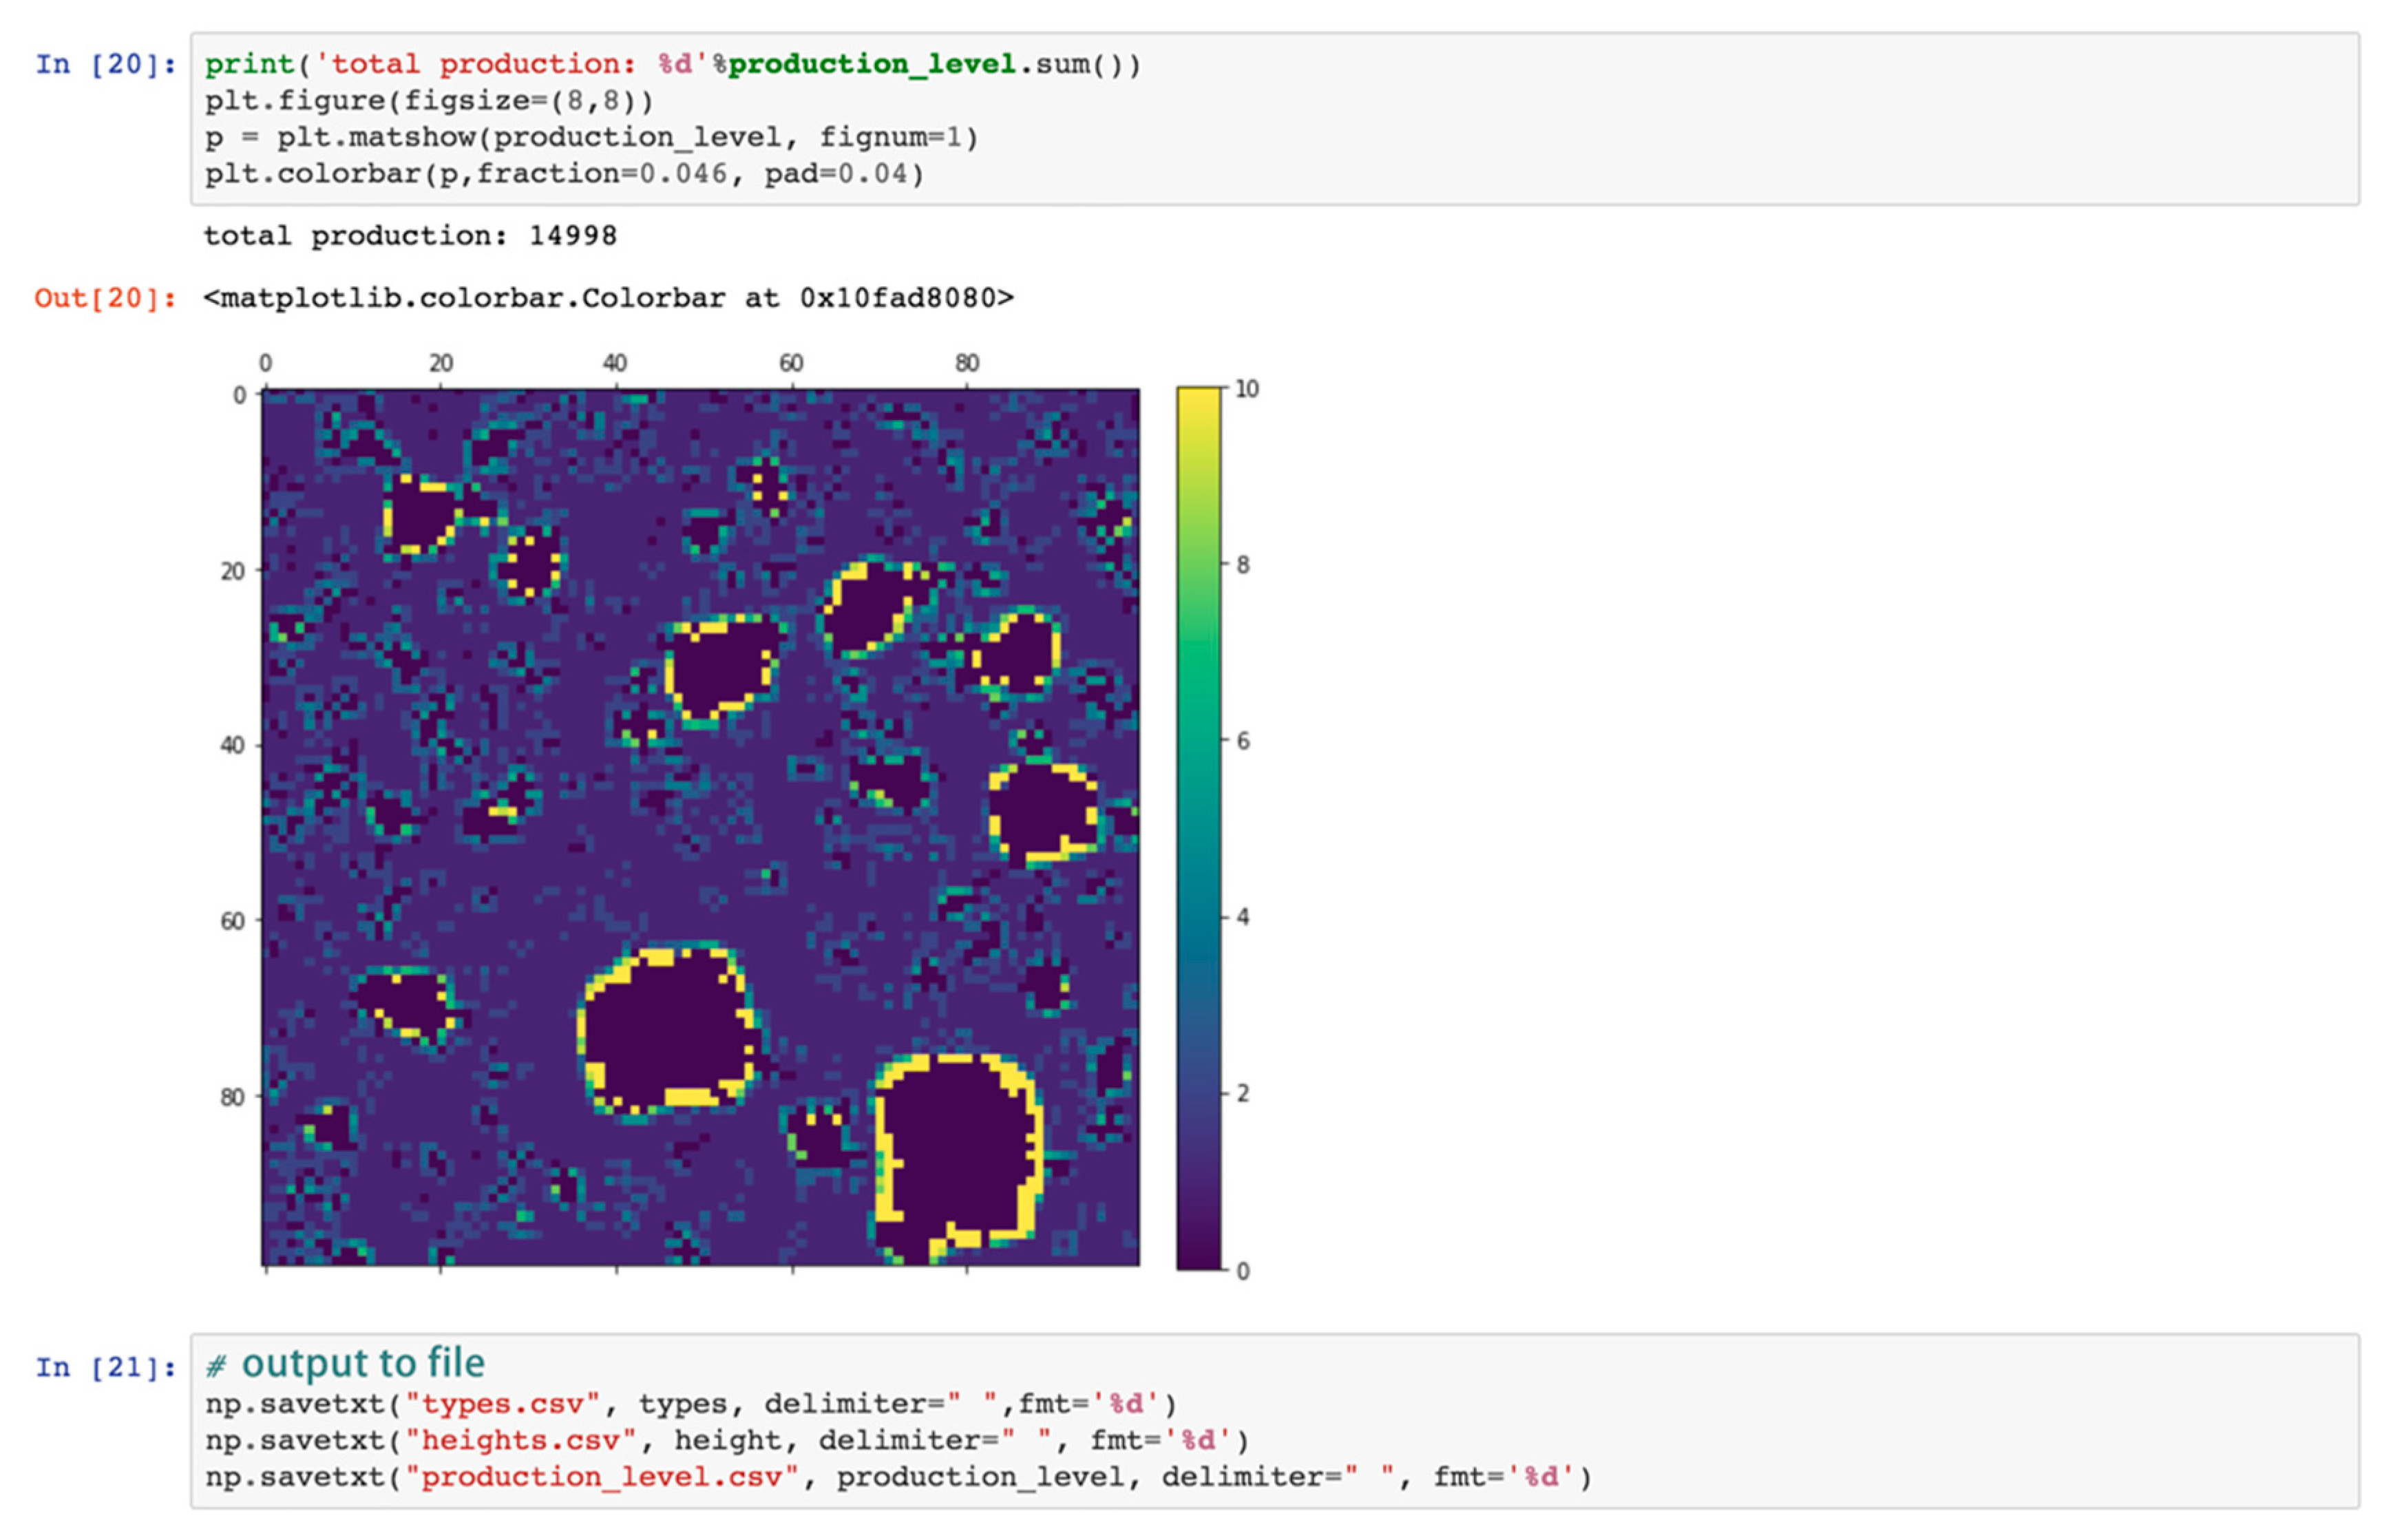
The simulation rules are written algorithm in python language as shown in the following screenshot (Figure A1, Figure A2, Figure A3, Figure A4 and Figure A5).
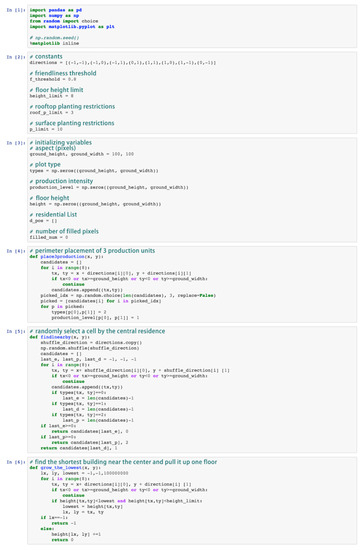
Figure A1.
Simulation algorithm part 1.
Figure A1.
Simulation algorithm part 1.
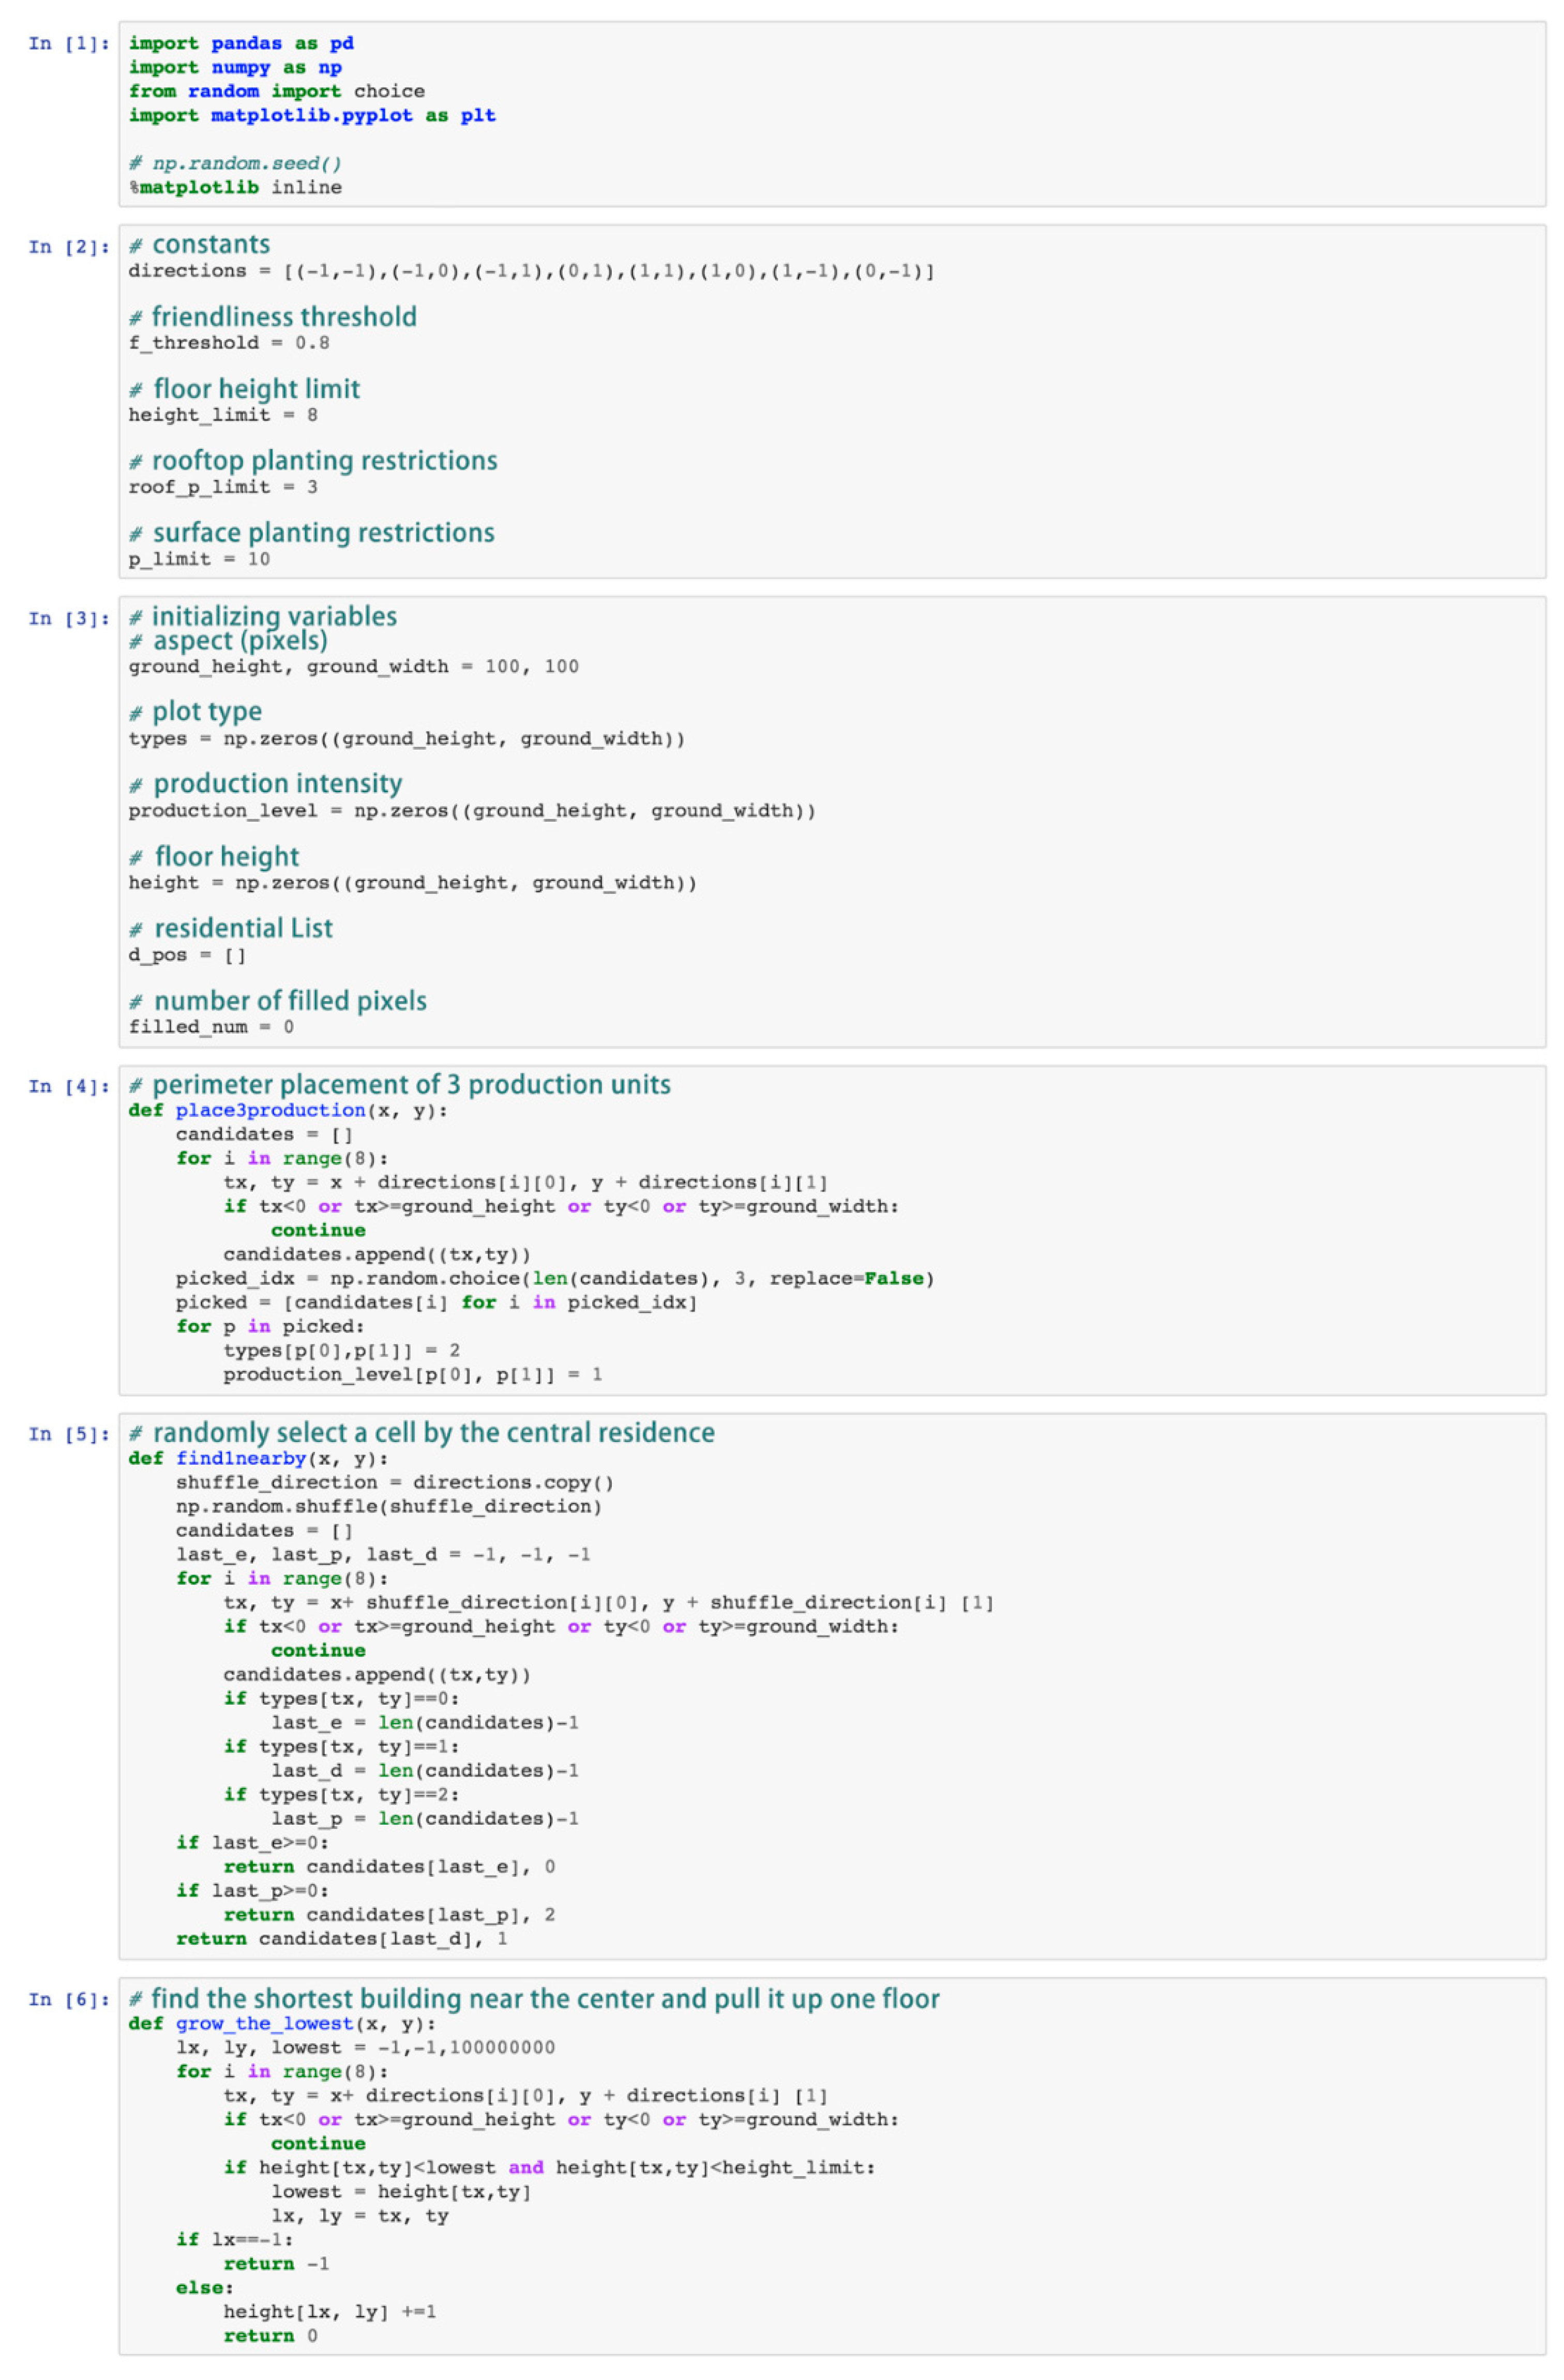
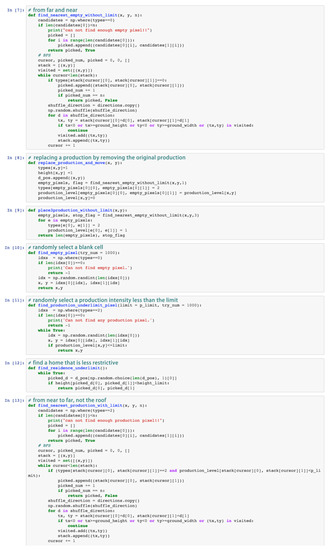
Figure A2.
Simulation algorithm part 2.
Figure A2.
Simulation algorithm part 2.
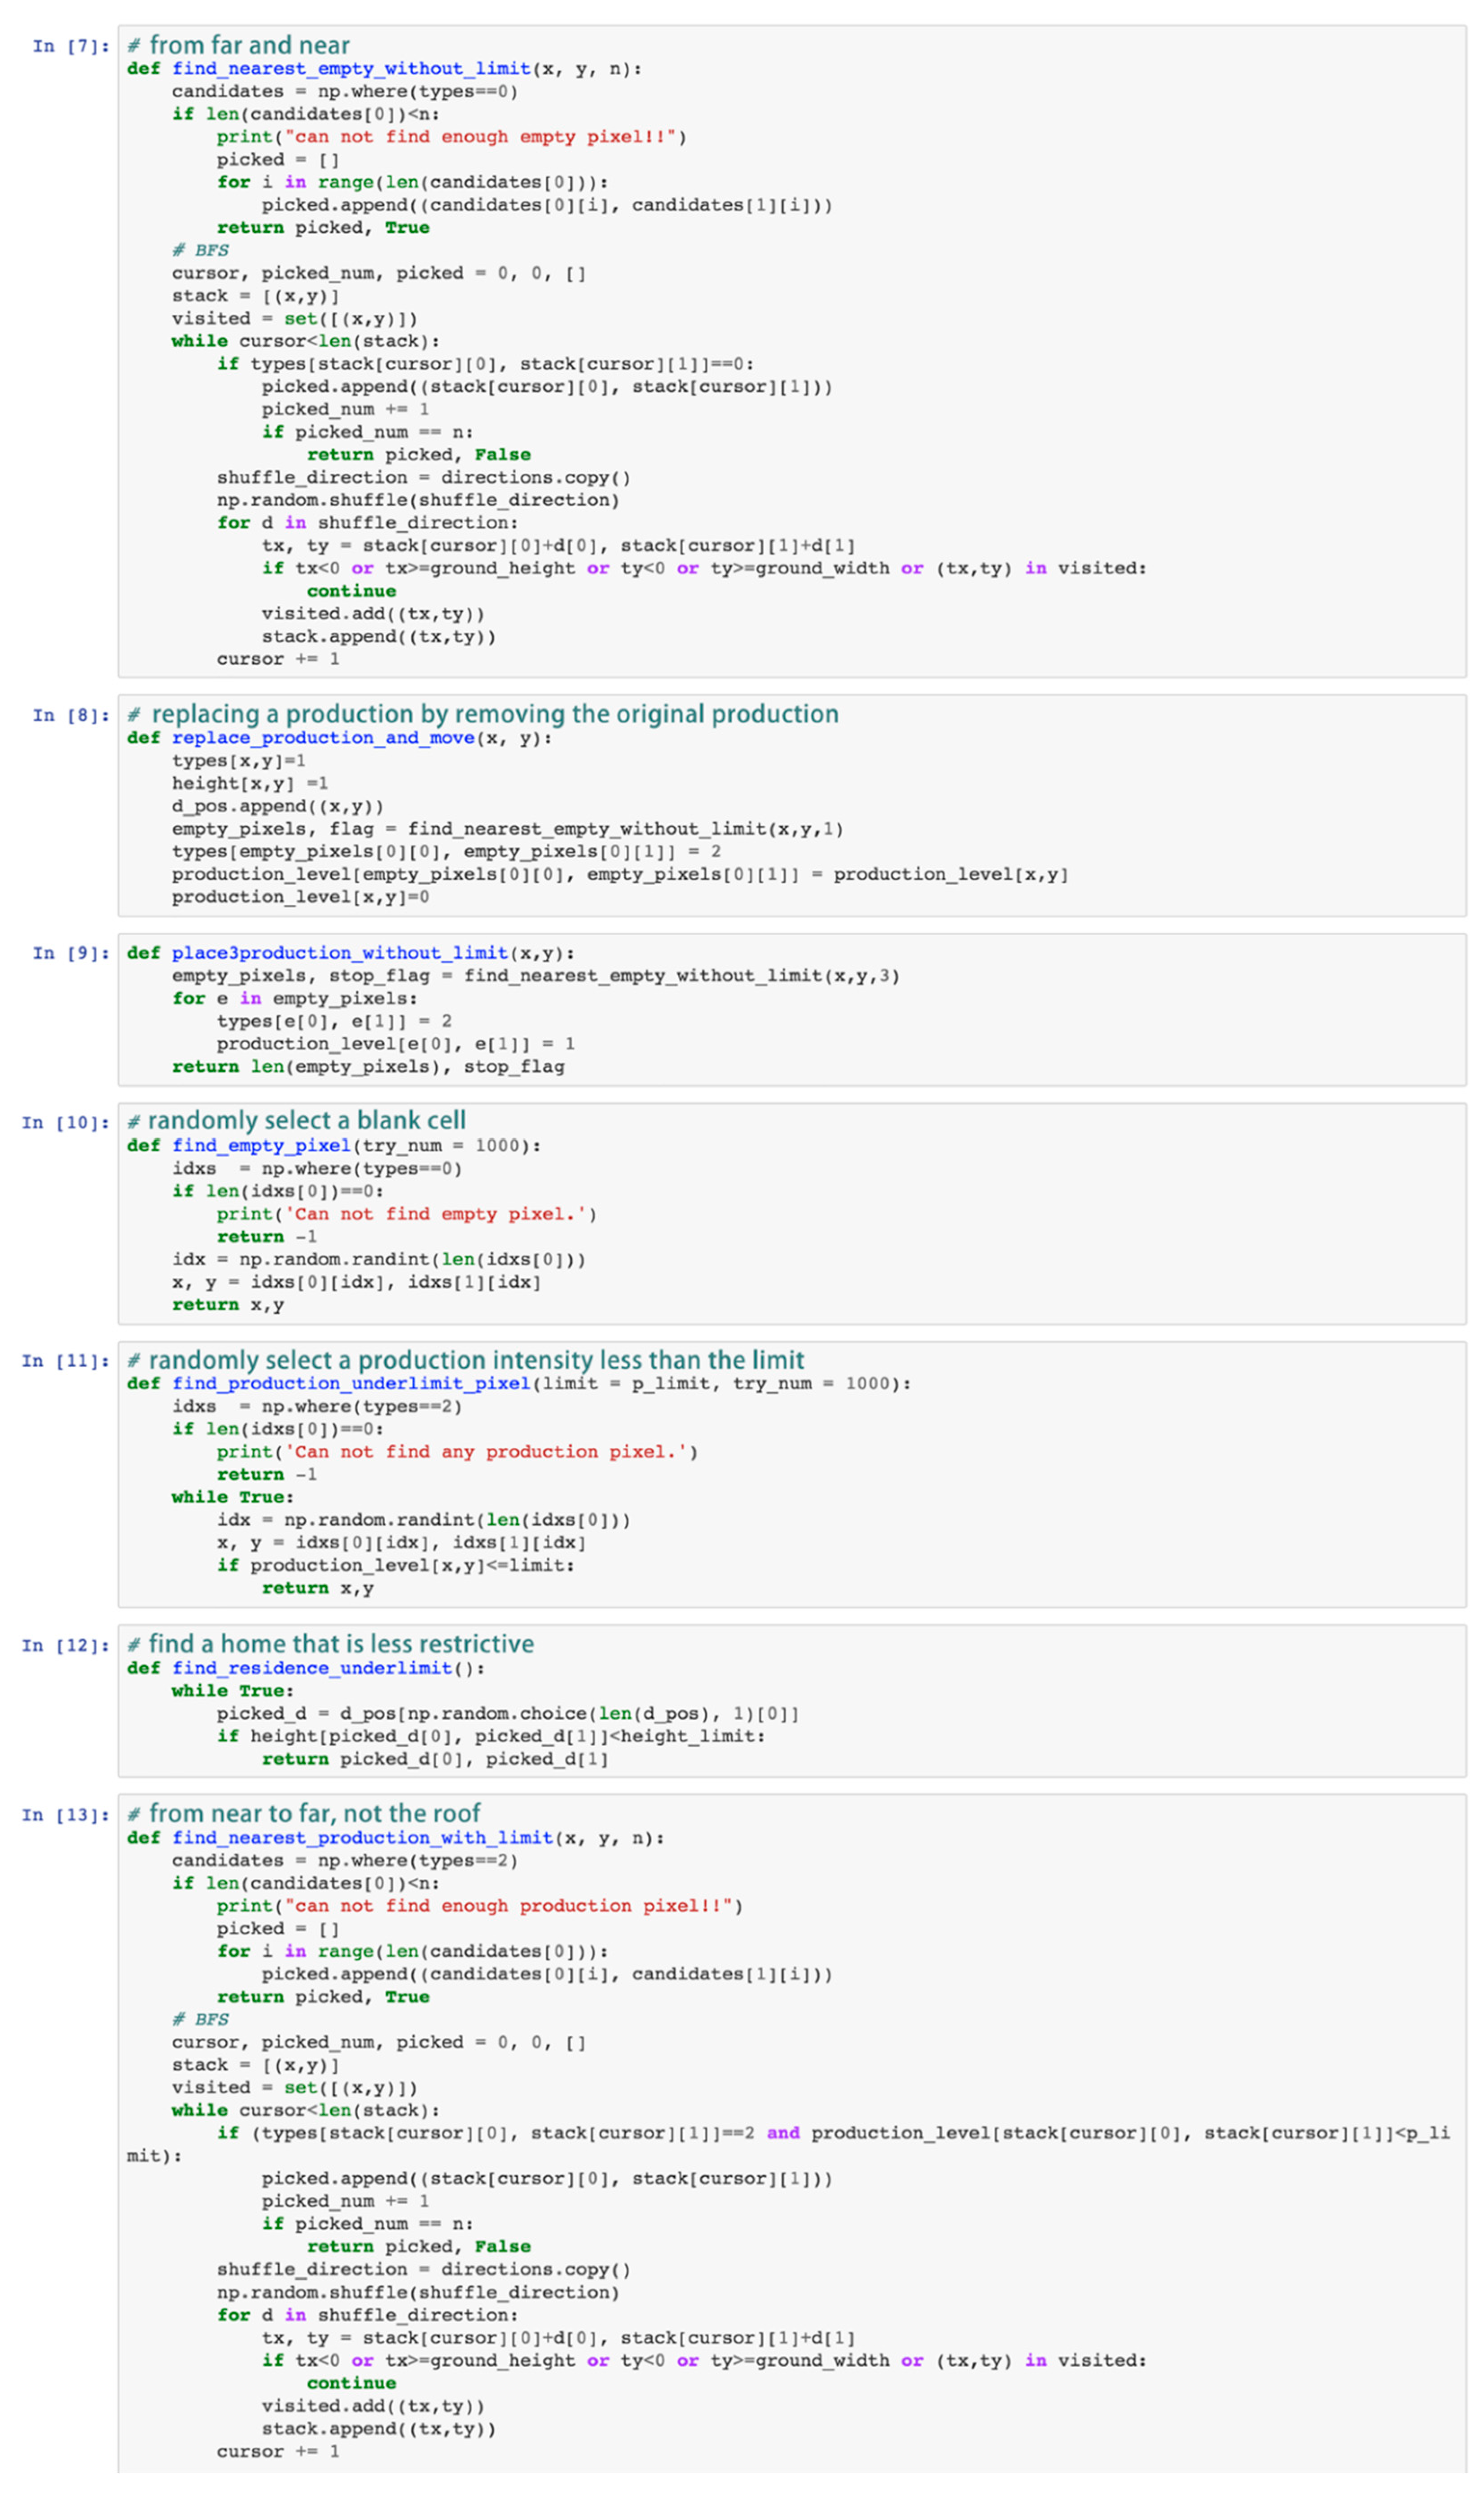
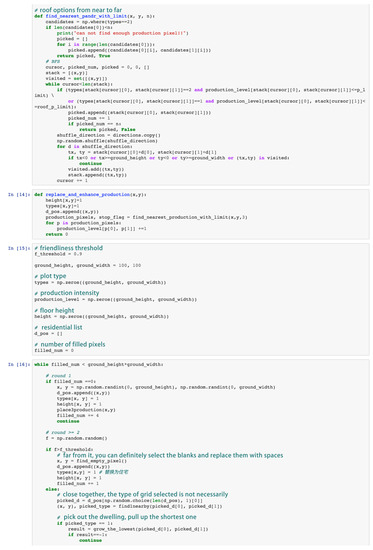
Figure A3.
Simulation algorithm part 3.
Figure A3.
Simulation algorithm part 3.
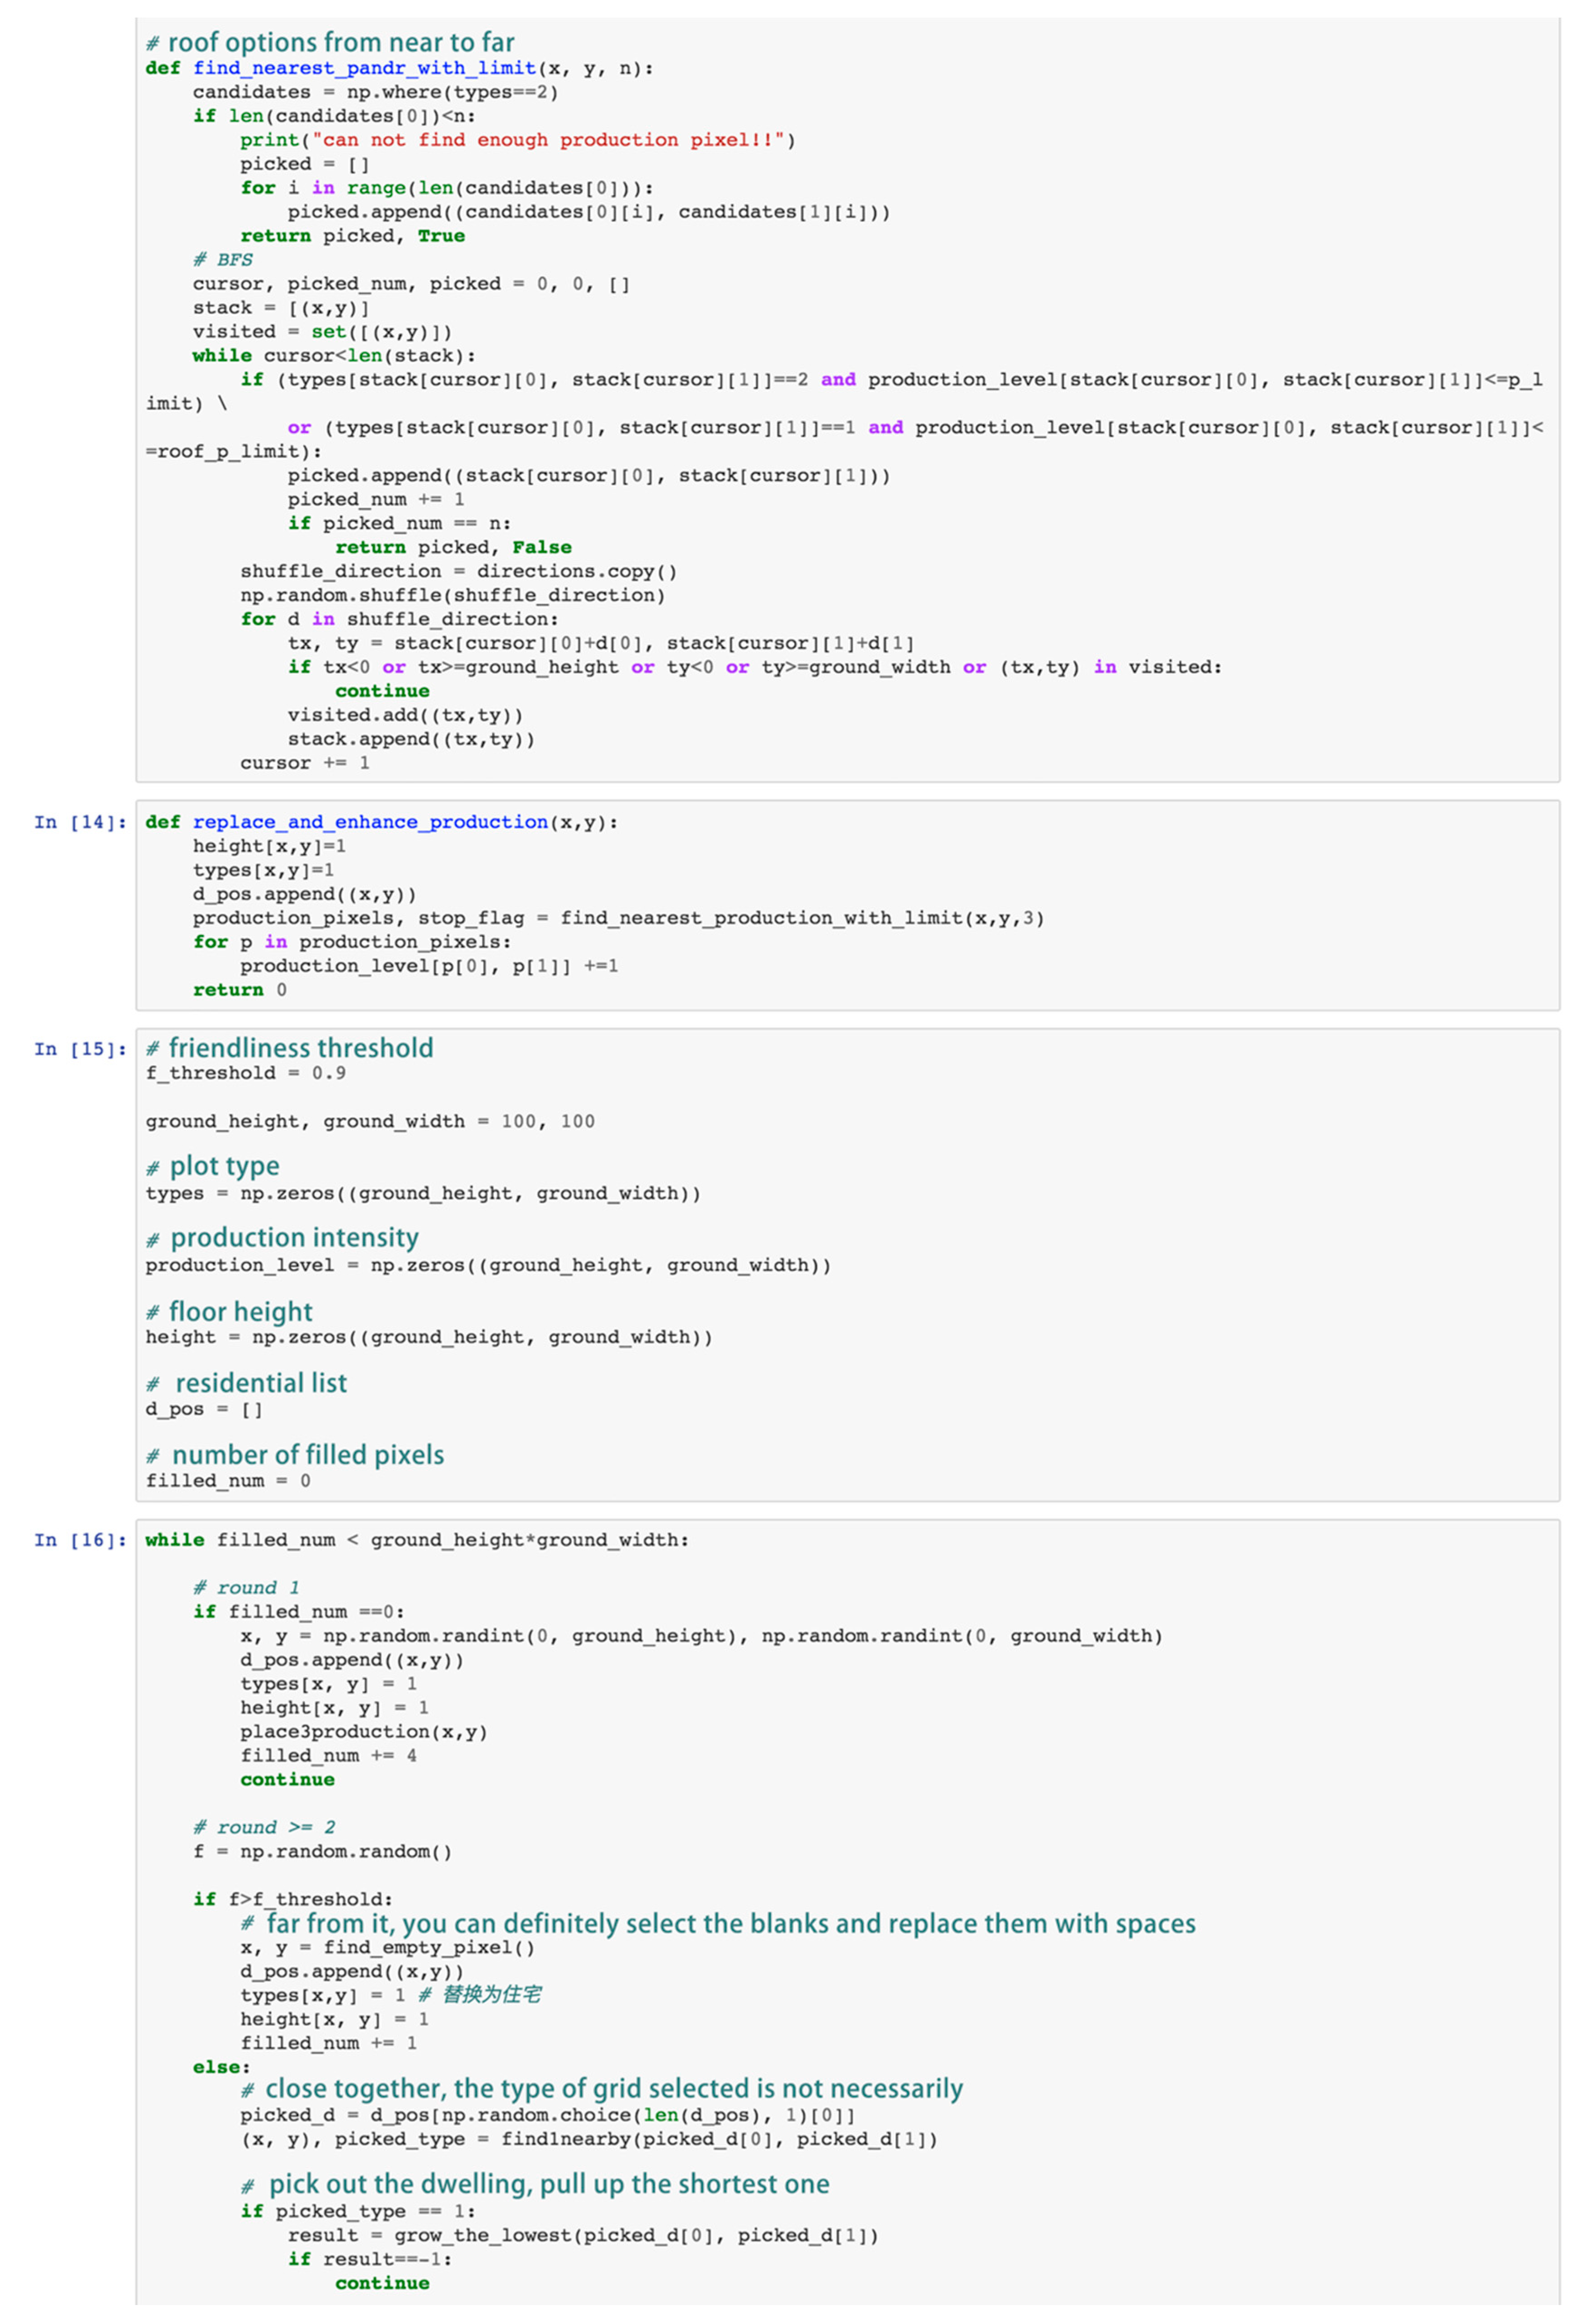
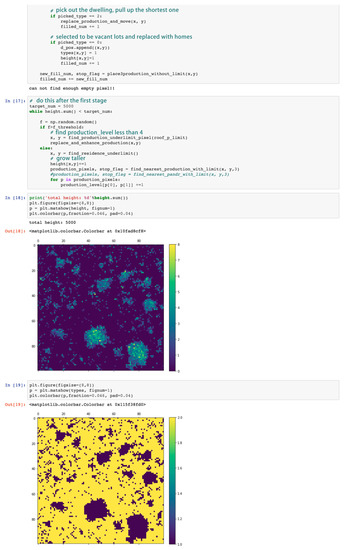
Figure A4.
Simulation algorithm part 4.
Figure A4.
Simulation algorithm part 4.
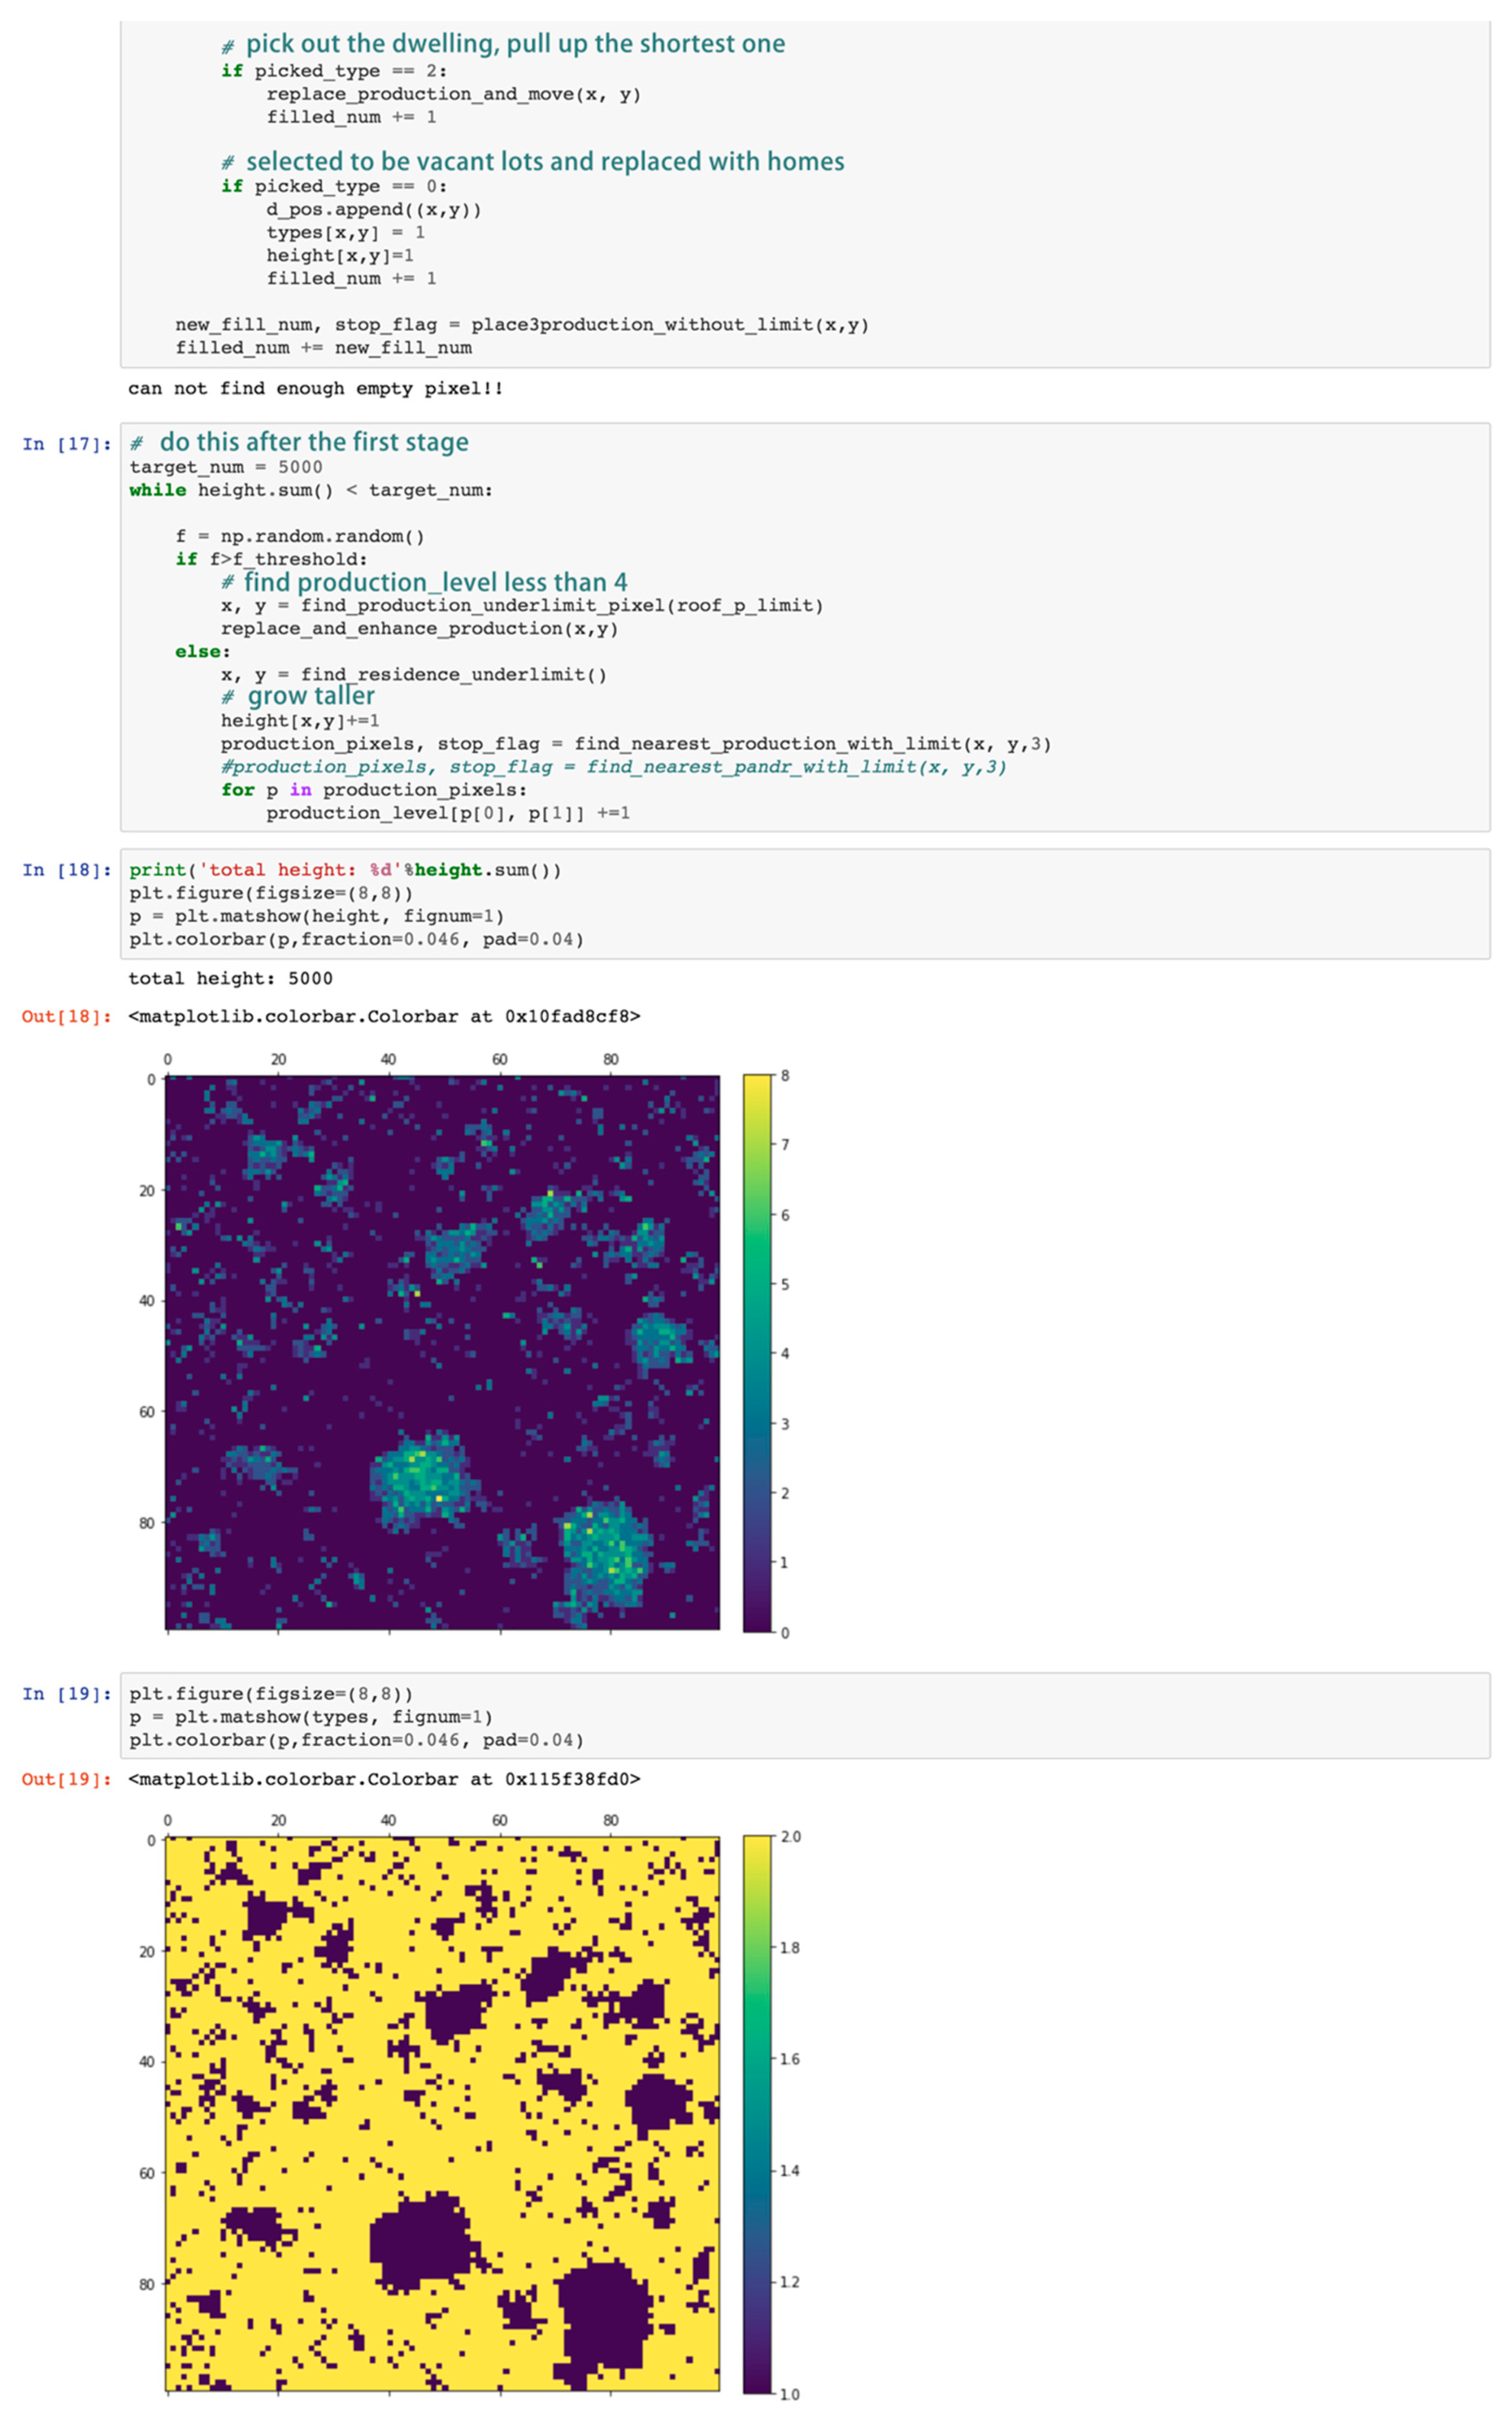
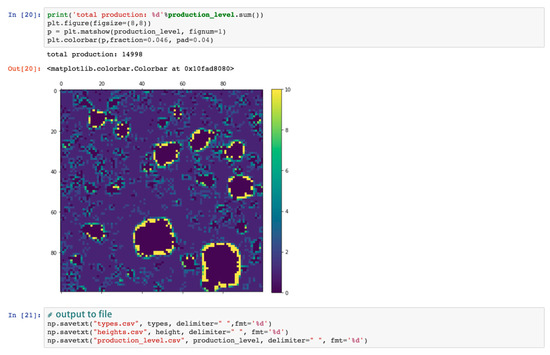
Figure A5.
Simulation algorithm part 4.
Figure A5.
Simulation algorithm part 4.
References
- UN-ESCAP. Asia and the Pacific SDG Progress Report 2019; United Nations Publication: Bangkok, Thailand, 2019; Available online: https://www.unescap.org/publications/asia-and-pacific-sdg-progress-report-2019 (accessed on 1 September 2020).
- UN-DESA. World Urbanization Prospects: The 2018 Revision; United Nations Publication: New York, NY, USA, 2018; Available online: https://www.un.org/development/desa/publications/2018-revision-of-world-urbanization-prospects.html (accessed on 1 September 2020).
- IPCC. Climate Change 2014: Mitigation of Climate Change. Contribution of Working Group III to the Fifth Assessment Report of the Intergovernmental Panel on Climate Change; Edenhofer, O., Pichs-Madruga, R., Sokona, Y., Minx, J.C., Farahani, E., Kadner, S., Seyboth, K., Adler, A., Baum, I., Brunner, S., et al., Eds.; Cambridge University Press: Cambridge, UK; New York, NY, USA, 2014; Available online: https://www.ipcc.ch/report/ar5/wg3/ (accessed on 1 September 2020).
- FAO. How to Feed the World in 2050. In Proceedings of the High-Level Expert Forum, Rome, Italy, 12–13 October 2009; Available online: http://www.fao.org/wsfs/forum2050/wsfs-forum/en/ (accessed on 1 September 2020).
- FAO; IFAD; UNICEF; WFP; WHO. The State of Food Security and Nutrition in the World 2020. Transforming Food Systems for Affordable Healthy Diets; FAO: Rome, Italy, 2020; Available online: https://doi.org/10.4060/ca9692en (accessed on 1 September 2020).
- FAO. FAO Statistical Yearbook 2013: World Food and Agriculture; FAO: Rome, Italy, 2013; Available online: http://www.fao.org/3/i3107e/i3107e00.htm (accessed on 1 September 2020).
- WWF. Living Planet Report—2018: Aiming Higher; Grooten, M., Almond, R.E.A., Eds.; WWF: Gland, Switzerland, 2018; Available online: http://www.wwfchina.org/content/press/publication/2018/LPR2018_Full%20Report.pdf (accessed on 1 September 2020).
- Metro Vancouver Planning Coalition. Securing the Farm Edge & Urban Green Fingers. Available online: http://www.plancanada.com/protecting_farm_edges.pdf (accessed on 1 September 2020).
- United Nations Security Council. Senior Officials Sound Alarm over Food Insecurity, Warning of Potentially ‘Biblical’ Famine, in Briefings to Security Council Title. Available online: https://www.un.org/press/en/2020/sc14164.doc.htm (accessed on 1 September 2020).
- Lal, R. Home Gardening and Urban Agriculture for Advancing Food and Nutritional Security in Response to the COVID-19 Pandemic. Food Secur. 2020, 12, 871–876. [Google Scholar] [CrossRef] [PubMed]
- International Grain Council. Grain Market Report. As at: GMR 512-23/07/2020. Available online: https://www.igc.int/en/markets/marketinfo-sd.aspx (accessed on 1 September 2020).
- FAO. World Food and Agriculture–Statistical Pocketbook 2019; FAO: Rome, Italy, 2019; Available online: http://www.fao.org/3/ca6463en/ca6463en.pdf (accessed on 1 September 2020).
- Yu, K.J. High yield Paddy Fields in Cities-Design of Rice Field Campus in Shenyang Jianzhu University. Landsc. Archit. 2007, 7, 18–19. [Google Scholar]
- CASS. China Agricultural Sector Development Report 2020; China Social Science Press: Beijing, China, 2020; Available online: http://iaed.caas.cn/docs/2020-06/20200605102008307704.pdf (accessed on 1 September 2020).
- FAO; IFAD; UNICEF; WFP; WHO. The State of Food Security and Nutrition in the World 2017—Building Resilience for Peace and Food Security; FAO: Rome, Italy, 2017; Available online: http://www.fao.org/3/a-i7695e.pdf (accessed on 1 September 2020).
- Pothukuchi, K.; Kaufman, J.L. Placing the food system on the urban agenda: The role of municipal institutions in food systems planning. Agric. Hum. Values 1999, 16, 213–224. [Google Scholar] [CrossRef]
- Steel, C. Hungry City: How Food Shapes Our Lives; Vintage: London, UK, 2008. [Google Scholar]
- Gottlieb, R.; Joshi, A. Food Justice; MIT Press: Cambridge, MA, USA, 2010. [Google Scholar]
- Heynen, N.; Kurtz, H.E.; Trauger, A. Food justice, hunger and the city. Geogr. Compass 2012, 6, 304–311. [Google Scholar] [CrossRef]
- Morgan, K. Local and green, global and fair: The ethical foodscape and the politics of care. Environ. Plan. A 2010, 42, 1852–1867. [Google Scholar] [CrossRef]
- Viljoen, A.; Wiskerke, J.S. (Eds.) Sustainable Food Planning: Evolving Theory and Practice; Wageningen Academic Publishers: Wageningen, The Netherlands, 2012. [Google Scholar]
- Ilieva, R.T. Urban Food Planning: Seeds of Transition in the Global North; Routledge: Abingdon, UK; New York, NY, USA, 2016. [Google Scholar]
- Chaboud, G.; Bricas, N.; Daviron, B. Sustainable urban food systems: State of the art and future directions. In Proceedings of the 5th AESOP Sustainable Food Planning Conference, Montpellier, France, 28–29 October 2013. [Google Scholar]
- Horst, M.; Gaolach, B. The potential of local food systems in North America: A review of foodshed analyses. Renew Agric. Food Syst. 2015, 30, 399–407. [Google Scholar] [CrossRef]
- Cummins, S.; Macintyre, S. A systematic study of an urban foodscape: The price and avail ability of food in greater Glasgow. Urban Stud. 2002, 39, 2115–2130. [Google Scholar] [CrossRef]
- Walker, R.E.; Keane, C.R.; Burke, J.G. Disparities and access to healthy food in the United States: A review of food deserts literature. Health Place 2010, 16, 876–884. [Google Scholar] [CrossRef] [PubMed]
- Viljoen, A.; Bohn, K. Continuous Productive Urban Landscapes (CPULs): Designing Urban Agriculture for Sustainable Cities; Architectural Press: Oxford, UK, 2005. [Google Scholar]
- Viljoen, A.; Bohn, K. Second Nature Urban Agriculture: Designing Productive Cities; Routledge: New York, NY, USA, 2004. [Google Scholar]
- IFPRI. 2016 Global Food Policy Report; IFPRI: Washington, DC, USA, 2016; Available online: https://www.ifpri.org/publication/2016-global-food-policy-report-synopsis (accessed on 1 September 2020).
- UN. Transforming our World: The 2030 Agenda for Sustainable Development, United Nations General Assembly. In Proceedings of the Seventieth Session, 4th Plenary Meeting, New York, NY, USA, 21 October 2015; Available online: https://sustainabledevelopment.un.org/post2015/transformingourworld (accessed on 1 September 2020).
- Wang, X.Q. Effects of Food Consumption Structure Changes on Income of Different Sectors of Food Systems. Chin. Rural Econ. 2001, 11, 58–63. [Google Scholar]
- Ren, J.Z.; Nan, Z.B.; Lin, H.L. Taking the Grassland Agro-system to Insure Food Security. Acta Pratacult. Sin. 2005, 3, 1–10. [Google Scholar]
- Lin, W.X.; Chen, T.; Zhou, M.M. New dimensions in agroecology. Chin. J. Eco-Agric. 2012, 3, 253–263. [Google Scholar] [CrossRef]
- Gao, N.; Hua, C.; Zhu, S.X.; Ge, D. The Exploration about Agricultural Urbanism Strategic System: A Case Study of ‘Room for Urban Agriculture in Rotterdam’. Urban Plan. Int. 2013, 1, 74–79. [Google Scholar]
- Yi, X.X. A New Issue in Western Planning: Community Food System. Planners 2012, 6, 102–106. [Google Scholar]
- Liu, J.J.; Li, B.F.; Ning, Y.F.; Born, B. A Research on American Food System Planning. Urban Plan. Int. 2013, 5, 103–108. [Google Scholar]
- Sun, L.; Zhang, Y.K.; Zhang, R.; Gong, X. Analysis on Urban Agriculture Planning Theory and its Application Case. Mod. Urban Res. 2016, 3, 46–53. [Google Scholar]
- Fu, J.S.; Zhu, W.Y. An Introduction of Rositsa T. Ilieva’s Urban Food Planning Theory and Enlightenment on Development of Urban Space in Beijing City. Urban Des. 2016, 6, 72–79. [Google Scholar]
- Flegal, K.M.; Carroll, M.D.; Ogden, C.L.; Curtin, L.R. Prevalence and Trends in Obesity among US Adults, 1999-2008. J. Am. Med. Assoc. Arch. 2010, 303, 235–241. [Google Scholar] [CrossRef] [PubMed]
- Sun, Y.B. Urban Agriculture and its Potential in Urban Development. Ph.D. Thesis, Tianjin University, Tianjin, China, 2013. [Google Scholar]
- Mendes, W.; Balmer, K.; Kaethler, T.; Rhoads, A. Using land inventories to plan for urban agriculture: Experiences from Portland and Vancouver. J. Am. Plan. Assoc. 2008, 74, 435–449. [Google Scholar] [CrossRef]
- Duany, A.; Plater-Zyberk, D. Garden Cities: Theory & Practice of Agrarian Urbanism; Prince’s Foundation: London, UK, 2011. [Google Scholar]
- Grimm, J. Food Urbanism: A Sustainable Design Option for Growing Urban Communities. Bachelor’s Thesis, Iowa State University, Ames, IA, USA, 2009. [Google Scholar]
- Donovan, J.; Larson, K.; McWhinnie, J. Food-Sensitive Planning and Urban Design: A Conceptual Framework for Achieving a Sustainable and Healthy Food System. 2011. Available online: http://www.healthyplaces.org.au/userfiles/file/Design%20elements/foodsensitive_planning.pdf (accessed on 1 September 2020).
- McGrath, B. Digital Modelling for Urban Design; Wiley: London, UK, 2008. [Google Scholar]
- Otto, F. Occupying and Connecting: Thoughts on Territories and Spheres of Influence with Particular Reference to Human Settlement; Axel Menges: Fellbach, Germany, 2009. [Google Scholar]
- Forman, R.T.T. Urban Regions Ecology and Planning Beyond the City; Cambridge University Press: Cambridge, UK, 1995. [Google Scholar]
- Batty, M.; Longley, P.; Fotheringham, S. Urban Growth and Form: Scaling, Fractal Geometry, and Diffusion-Limited Aggregation. Environ. Plan. A 1989, 21, 1447–1472. [Google Scholar] [CrossRef]
- Marshall, S. Cities, Design and Evolution; Routledge: New York, NY, USA, 2008. [Google Scholar]
- Paul de Graaf Ontwerp & Onderzoek. Ruimte Voor Stadslandbouw in Rotterdam. 2011. Available online: http://pauldegraaf.eu/portfolio/ruimte-voor-stadslandbouw-in-rotterdam-2011/ (accessed on 1 September 2020).
- Dumitresc, V. Mapping Urban Agriculture Potential in Rotterdam. 2013. Available online: https://issuu.com/vladdumitrescu9/docs/uareport_seconddraft (accessed on 1 September 2020).
- MaCT 01: Fab City Prototype. Available online: http://www.iaacblog.com/programs/courses/mact/2015-2016-mact/fab-city-prototype-mc-2015-16-1st/ (accessed on 1 September 2020).
- Pont, M.B.; Haupt, P. Spacematrix: Space, Density and Urban Form; NAi Publishers: Rotterdam, The Netherlands, 2010. [Google Scholar]
- Chinese Nutrition Society. Chinese Dietary Guideline (2016); PMPH: Beijing, China, 2016. [Google Scholar]
- Population Monitoring and Family Development Division. China Family Development Report (2016); CPPH: Beijing, China, 2016; p. 4. [Google Scholar]
- Rural Socio-Economic Surveys Division. China Rural Statistical Yearbook; China Statistics Press: Beijing, China, 2017; pp. 178–181. [Google Scholar]
- Zhang, Y.K.; Zheng, J. A Call for New Spirit A Centurial Turn of the Contemporary Cities and Buildings. Archit. J. 2016, 10, 114–119. [Google Scholar]
Publisher’s Note: MDPI stays neutral with regard to jurisdictional claims in published maps and institutional affiliations. |
© 2020 by the authors. Licensee MDPI, Basel, Switzerland. This article is an open access article distributed under the terms and conditions of the Creative Commons Attribution (CC BY) license (http://creativecommons.org/licenses/by/4.0/).


