Abstract
In order to reduce the pressure on urban road traffic, multi-modal travel is gradually replacing single-modal travel. Park and ride (P + R) and kiss and ride (K + R) are effective methods to integrate car transportation and rail transit. However, there is often an imbalance between supply and demand in existing car occupant transfer facilities, which include both P + R and K + R facilities. Therefore, we aim to conduct a research on P + R and K + R facilities’ collaborative decision. It first classifies car occupant transfer facilities into types and levels and sets the service capacity of each category. On the premise of ensuring the occupancy of parking spaces, our model aims to maximize the intercepted vehicle mileage and transfer utility and establishes an optimal decision model for car occupant transfer facilities. The model collaboratively decides the facilities in terms of location selection, layout arrangement, and overflow demand conversion to balance the supply and demand. We choose Chengdu as an example, apply the multi-objective optimization model of car occupant transfer facilities, give improved schemes, and further explore the influence of the quantity of facilities on the optimization objectives. The results show that the scheme obtained by the proposed model is significantly better than the existing scheme.
1. Introduction
In the rapid process of urbanization, a phenomenon of the separation of work and residence in large cities has become more and more obvious. Therefore, the commuting cost of residents is increasing. In order to meet residents’ needs and improve travel efficiency, urban supply is also developing from single road transportation network to multi-modal transportation network. At the same time, some large cities in the world have implemented vehicle access restrictions. Laws and regulations related to driving include limits on car use based on certain criteria, such as emission levels, days of the week, time of the day, area (usually a city center), license plate number, and so on [1]. Therefore, for restricted travelers and cars, multi-modal transportation is also a way to circumvent vehicle access restrictions.
As a typical combined travel method, the car + rail transit mode is usually embodied as two forms: park and ride (P + R) and kiss and ride (K + R). Both of them limit the traffic flow of cars to the periphery of the city through the conversion of passenger flow between the road network and the rail transit network. As a result, they are able to reduce traffic congestion in downtown [2,3], upgrade transportation network service level, decrease traffic pollution, and promote transportation sustainability [4,5]. Commuters are able to save costs by participating in the combined travel method [6]. P + R facility is built for providing parking space for private cars, bicycles, etc. and guides travelers to park their vehicles outside the city center and transfer to public transportation. K + R is a temporary stop-and-ride method, which means that traveler take a taxi or online ride-sourcing service, etc. to reach a metro station and transfer to public transportation. Since ride-sourcing + rail transit mode accounts for the highest proportion among all K + R modes, the “K + R” mentioned below in this article refers to the ride-sourcing + rail transit mode.
Through an investigation of the existing P + R facility operation, it was found that the operation quality of such facilities is uneven, and many of them have a phenomenon of mismatch between supply and demand. On the whole, even the rapid growth of urban infrastructure construction is far behind the growth rate of urban car ownership and travel demand [7]. The primary reason for this phenomenon is the unreasonable location of facilities. Inappropriate location selection will only increase the burden on the transportation system and cause waste of resources [8]. In addition to the location of facilities, the reason for the mismatch between supply and demand also encompasses a lack of multi-mode integration and flexible supply. More importantly, once built, transport infrastructures are hard to change and probably show a lack of adaptive capacity [9]. As of now, P + R facilities have not yet had a scientific system of hierarchical standards and specifications. It is difficult to match different levels of demand while setting up appropriate parking facilities. Based on the above analysis, we argue that K + R facilities can be used as a kind of supplementary alternative to P + R facilities, and these two forms should be collaboratively planned as a car occupant transfer facility, which includes both P + R and K + R facilities. Furthermore, elastic changes of parking and transfer demand should be fully considered for establishing a scientific and reasonable layout decision model. The perspectives above are of great significance for guiding a transportation mode conversion and improving the efficiency of multi-modal transportation systems.
At present, there is a comprehensive evaluation model of preliminary station selection for facility location decision. This can initially select a batch of stations that are suitable for setting up car occupant transfer facilities from the perspective of geographic space, in order to reduce the amount of data for the final decision model. In addition, there is a logit model that provides demand prediction for the optimization model, which can provide P + R and K + R demand prediction for corresponding stations. This will be one of the important basic data in the layout decision model.
We firstly aim to classify and grade car occupant transfer facilities. With the demand forecasting as the basic data and on the premise of ensuring occupancy, our model takes the maximization of intercepted vehicle mileage and the maximization of transfer utility as goals to establish a P + R and K + R collaborative layout decision model. This model is able to give a reasonable scheme as a reference for improving the operational efficiency of multi-modal transportation networks and meanwhile provides theoretical support for improving the effectiveness of urban transportation planning.
2. Literature Review
The research of optimization theory on car occupant transfer facility is relatively rich. According to the difference of city form, road traffic network structure, and traffic policy, the research objectives and methods are also different [10,11]. The optimization goals of some scholars are to maximize economic benefits and minimize social costs. Wang et al. [12], established a P + R facility location and parking cost optimization model. The research object of this model was the traffic corridor of a strip in a city. The research results showed that with the goal of maximizing economic benefits, setting P + R facilities in the Central Business District (CBD) and charging 9–11 HKD for parking fees was the optimal strategy. However, with the goal of minimizing social costs, P + R facilities should be set up far away from the CBD and the parking fee should be reduced. Song et al. [13] also aimed to minimize social costs and proposed a collaborative planning method for park-and-ride and bus services. Sargious and Janarthanan [14] suggested a process for locating one or more P + R stations in a way that the cost of the system to the commuters and the community is minimized. Zhang [15] analyzed the influencing factors of location decision for P + R facilities and established the final location decision-making model with maximum utility as the objective function.
Some scholars established a P + R facility layout model with the goal of maximizing intercepted traffic volume. Horner and Groves [16] established a location selection model with the goal of maximizing the amount of online passenger flow. Fang and Wu [17] referred to the achievement of Horner and Groves and established a P + R discrete location selection model with the maximization of intercepted network vehicle mileage as the location goal. Liu and Yan [18] calculated the candidate stations’ attraction range of passenger flow, accessibility of public transportation network, and other indicators and derived a Geographic Information System based (GIS-based) optimization method for the transfer facility layout decision. Gong [19] established a bi-level programming multi-objective optimization location model for P + R based on the traffic flow interception level along with accessibility and cost-effectiveness ratio of the transportation system. Cheng [20] incorporated a variety of goals into the layout decision-making model, including the maximization of intercepted traffic volume, network cost-effectiveness ratio, and commuters’ benefits. Zhao [21] comprehensively considered the factors of the attraction range, the accessibility, and the convenience of transfer and believed that the maximization of intercepted vehicle mileage is the main goal for facilities’ location selection.
There are also some scholars who proposed that other influencing factors or goals should be used to determine the layout of P + R facilities. Holguín-Veras et al. [22] aimed to maximize the impact area, while Farhan and Murray [10] established a multi-objective optimization model to optimize the location of P + R facilities. He [23] formed the P + R facility location selection model from four different aspects, including the public transit network, road network, the distance between P + R facility and downtown, and the land type of P + R facility. Bos et al. [24] proposed that the reliability of public transportation connected to transfer stations is an important factor affecting P + R facilities’ layout, including commuters’ travel time and travel costs. Pei and Liu [25] established a transfer intensity model from the aspects of the density of the urban road network and the accessibility of the bus network and used it as an important reference for planning P + R facilities. Fan et al. [26] developed a bi-level programming model to locate P + R facilities, combining the maximization of social welfare and a stochastic user equilibrium. Wang [27] considered travel time, currency cost, and comfort level as factors and constructed a P + R facility layout decision model under urban multi-modal traffic conditions. Hamid [28] proposed that the accessibility from a P + R transfer station to the city center should be one of the main considerations during the P + R station’s location selection.
In recent years, research on K + R is not as common and focused as those on P + R. Schank [29] took different commuter railway stations near New York City as an example and believed that K + R was an effective means to help reduce parking problems while enabling an increase in ridership. At the same time, the author believed that the 15 min or 1 h short-term parking spaces for K + R should be set up, respectively, through parking spaces’ type conversion, in order to separate K + R from P + R traffic.
Weiss and Habib [30] established a spatially weighted error correlation discrete choice model to analyze the difference between K + R and P + R. The author believed that K + R and P + R were two cases or choices that combined private cars and transit and that they had different characteristics. Based on a survey in the Greater Toronto and Hamilton Area (GTHA), they believed that the generation of K + R travel mode was particularly related to the variables on a household level. In addition, the author also analyzed the advantages of the K + R method over those of the P + R, including simple parking search process, low requirements for parking spaces, short walking distance for passengers to transfer, and so on.
3. Methods
Our P + R and K + R collaborative layout decision-making method mainly includes a division of car occupant transfer facility’s type and hierarchy and a multi-objective programming model. Transfer facilities are divided into categories according to their ability to meet different types of demand. For the objective programming model, we decide to use two optimization objective functions along with constraints and demand conversion equations listed from various aspects.
3.1. Division of Car Occupant Transfer Facility’s Type and Hierarchy
The main body of the collaborative decision of car occupant transfer facilities includes P + R facilities and K + R facilities, and the characteristics of different facilities will directly affect the optimization strategies. P + R and K + R have similarities and differences in the factors that influence their method selection, their facilities’ space occupancy characteristics, layout characteristics, and service scope. This is the premise for improving the accuracy and pertinence of facility configuration. This research believes that the collaborative decision of these two types is the key to giving play to their respective advantages, avoiding limitations, and improving system transportation efficiency. Therefore, car occupant transfer facilities can be divided into two types:
- P + R facility. This type of facility mainly serves P + R demand, supplemented by K + R demand. It is suitable for stations with a high level of car occupant transfer demand. In this facility, when the P + R demand exceeds the service capacity and a demand overflow occurs, the P + R demand can be transferred to the K + R parking spaces in the facility.
- K + R facility. This type of facility only serves the needs of K + R. It is suitable for locations where the car occupant transfer demand reaches a certain level, but the P + R parking lot cannot be built due to the space resource limitation or the inadequate demand to build the P + R facility.
At the same time, from the current status of P + R construction, it can be seen that the service capability provided by P + R facilities in diverse locations are different. With the change of locations, the needs of K + R are also different. Therefore, in order to make the collaborative layout decision more detailed, this research divides the above two types of facilities into two levels (Figure 1). According to the passenger flow survey data and the existing P + R facility plan and after getting the opinions and suggestions of the decision makers and planners from the municipality, different facility service capabilities were set for each level. The specific classification methods and level thresholds are shown in Table 1.
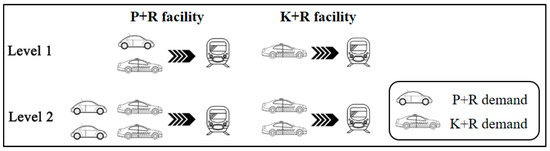
Figure 1.
The classification structure of car occupant transfer facilities. P + R, park and ride; K + R, kiss and ride.

Table 1.
The service capacity of car occupant transfer facilities (Unit: vehicles/day).
The table lists the maximum number of vehicles served per day by the two types and two levels of facilities. It can be converted to the quantity of parking spaces according to the turnover rate. The service level of the facilities in the table is represented as , where C represents the service capacity of the facility, k represents the type of facility (k = 1 is P + R facility, k = 2 is K + R facility), j represents the level of the facility, and m represents the type of demand (m = 1 is P + R demand, m = 2 is K + R demand).
3.2. Establishment of Multi-Objective Optimization Model
In order to reasonably plan car occupant transfer facilities and improve the matching degree of supply and demand, it is necessary to establish a multi-objective optimization model to obtain the location and corresponding types and levels of car occupant transfer facilities.
3.2.1. Model Assumptions
In order to facilitate the construction and solution of the model and make it match the actual situation, some assumptions and simplifications need to be made to the problem.
- The attraction range of each station’s transfer facility is the same fixed value. The attraction range refers to the geographical distribution range of travelers who live near the car occupant transfer facility and at the same time, have transfer demand and are willing to come to the station for transfer.
- The transfer demand attracted by any station will remain unchanged after this station’s car occupant transfer facility is completed, at least for a short period of time.
- The high-level facilities are able to offer the functions provided by the lower-level facilities.
- Candidate stations that fail to set high-level facilities can become low-level candidates for low-level facilities.
- For type 1 facilities (P + R facilities), in the case that the service capacity for P + R of the facility at a certain station is insufficient, travelers who originally have the need for P + R transfer at this station can unconditionally adopt the K + R method. However, travelers who originally have the need for K + R are not able to accept the P + R method.
3.2.2. Symbol Description of Some Parameters
In subsequent formulas, many parameter symbols will be used repeatedly. Therefore, they are explained here while the explanation will not be repeated below. Please refer to the instructions in this section when reading the subsequent formulas.
- m represents the type of demand (m = 1 is P + R demand, m = 2 is K + R demand);
- k represents the type of facility (k = 1 is P + R facility,
- k = 2 is K + R facility);
- j represents the level of the facility;
- represents the type m demand of candidate station i (vehicles/day);
- represents the type m demand of candidate station i under the supply capacity limitation (vehicles/day);
- represents the distance from station i to city center (km);
- is the decision variable in optimization model and represents whether to set a car occupant transfer facility of type k and level j at station i.
3.2.3. Decision Variable and Optimization Objective Functions
The decision variable of this model is whether to set a certain type and level of car occupant transfer facility at a certain station. Therefore, the decision variable is . Its value of 1 means that a type k level j facility is should be set up at candidate station i, while its value of 0 means that the facility should not be set up.
The two optimization objectives of this model are as follows:
1. Maximization of intercepted vehicle mileage
The transfer demand starts from the user’s starting point of travel. After encountering the car occupant transfer facility, they may choose to change their travel mode and transfer to public transportation. According to the functions of the transfer facility, the main purpose of the facility is to intercept the cars outside the CBD and avoid them entering the city center by letting the travelers complete the transfer earlier. In this way, the intercepted vehicle mileage in the network is maximized.
The mechanism of the existing flow interception model is that if a car occupant transfer facility is constructed at a station, all transfer traffic flow around it will disappear. That is to say, the transfer demand can be fully satisfied, which is inconsistent with the actual situation. In fact, the transfer facility has a limitation of service capacity, and the overflow demand will not be satisfied. Therefore, in this model, the intercepted traffic volume should consider the constraint of facility supply. The objective can be expressed as
where Z represents the total intercepted vehicle mileage.
2. Maximization of transfer utility
When deciding the layout of facilities, in addition to the intercepted vehicle mileage at the level of traffic network, it is also necessary to reflect the guiding role of the facilities for mode conversion from the perspective of travelers, which is named as transfer utility. Therefore, the second optimization goal is to maximize the transfer utility. The objective can be expressed as
where U represents total transfer utility, represents the single utility of transfer demand of type m. According to Liu’s study on Logit model for car occupant transfer [31], the formulas for single utility of P + R and K + R demand are
where distance is the distance from between transfer station and CBD (km), and are the duration on car and train (min), is the duration required for transfer at the station (min), are the levels of traveler’s personal income (thousand RMB/year), representing 101~150, 151~200, 201~300, and >300, respectively.
3.2.4. Restrictions
1. Thresholds for constructing car occupant transfer facilities at candidate stations
Due to the high construction cost of P + R facilities, if there is a surplus of parking spaces several years after completion, the economic benefits will not be optimistic. This will show the unreasonable layout of the facilities. Therefore, the construction of P + R facilities needs to be restricted by the threshold. The specific value of the threshold can be determined according to local actual conditions and the expectations of the authorities. Only when the demand of the station is greater than this threshold, there is the possibility of constructing P + R facilities. Otherwise the setting is not considered. This condition can be expressed as
where is the threshold for constructing P + R facility, taking 500 (vehicles/day, about 60% of Level 1 P + R facility’s max capacity for P + R demand).
In the same way, when K + R demand is insufficient, there is no need to carry out special management control and parking spaces for K + R transfer vehicles. The constraint is expressed as
where is the threshold for constructing K + R facility, taking 100 (vehicles/day, about 60% of Level 1 K + R facility’s max capacity).
2. Service capacity constraints of car occupant transfer facilities
This model needs to consider the service capacity of different types and levels of car occupant transfer facilities. The demand that the facilities are able to meet should not exceed the facilities’ capacity, while the overflow demand should be converted or unsatisfied. The constraints are expressed as
3. Quantity constraint of facilities
The quantity of car occupant transfer facilities decided to be built is determined. The model should meet the limit of quantity p. The constraint is expressed as
4. Value constraint for decision variables
According to the definition of decision variables, one variable’s value should be 0 or 1.
5. Conditions of demand conversion
For type 1 facilities (P + R facilities), when P + R demand overflows and there is still room for K + R at this station, P + R demand can be converted into K + R demand (as the model assumption No. 5 in Section 3.2.1).
4. Results and Further Analysis
Based on the theoretical methods of car occupant transfer facilities’ layout decision mentioned above, we selected Chengdu as the research application example and tested the proposed model.
Chengdu is a densely populated city with a complete rail transit network. However, due to the large daily traffic volume in the central city and huge travel demand of residents outside the city, Chengdu is promoting the construction of car occupant transfer facilities. The currently completed P + R facilities are located at Jincheng Square Station, Shengxian Lake Station, Xipu Station, Chengdu Administration Institute Station, and Dayuan Station (Figure 2).
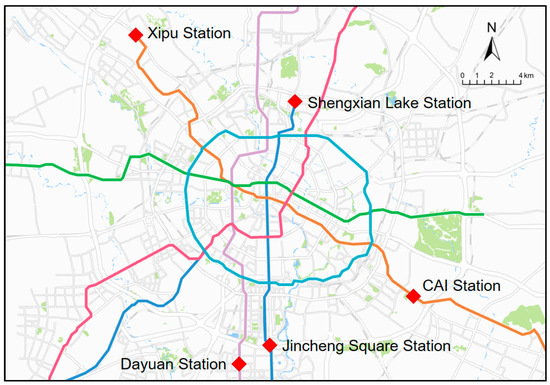
Figure 2.
Existing P + R facilities in Chengdu.
At the same time, as the Internet has changed the lives of residents, the proportion of smart travel in urban residents’ transportation is increasing day by day. At present, the K + R travel mode in Chengdu is also welcomed by many travelers. More and more people choose to travel by ride-sourcing service to metro stations and transfer to rail transit in order to reduce commuting time.
4.1. Data Preparation
The quantity of rail transit stations in Chengdu is huge, we cannot take all stations into the calculation of the proposed decision-making model. In addition, some of the required input data cannot be directly obtained through investigation and measurement. Therefore, we need a process for data preparation, including the selection of candidate stations and the forecast of transfer demand.
4.1.1. Selection of Candidate Stations
According to Liu’s preliminary selection model of car occupant transfer facilities based on spatial analysis theory [31], combined with the actual situation of Chengdu metro network, a comprehensive evaluation model was solved. As a result, 20 stations were preliminarily determined as the candidates for the proposed multi-objective optimization model. Their locations are shown in Figure 3.

Figure 3.
The preliminarily selected 20 candidate stations.
4.1.2. Car Occupant Transfer Demand Forecasting for Each Candidate Station
With reference to the population data of Chengdu and the proportion of travel modes of Chengdu residents [31], the passenger volume of cars was calculated. By identifying car travelers as potential users of car occupant transfer facilities, the all-day demand for each candidate station could be obtained. According to Liu’s multiple Logit models and parameter calibration results based on the choosing willingness of car transport, P + R method, and K + R method in Chengdu [31], the P + R and K + R all-day demand for each candidate station was forecasted and listed in Table 2.
Table 2.
Prediction of car occupant transfer demand.
4.2. Optimization Results Based on Existing Quantity of Facilities
Through data preparation, we can take the Chengdu case into the P + R and K + R collaborative layout decision-making method described previously and get a layout scheme. By comparing this scheme with the existing facility layout scheme in Chengdu, we can observe the effect of the method proposed in this article.
4.2.1. Optimization Results of Layout Decision
Aiming at the current situation and problem, we adopted the car occupant transfer facility hierarchical decision model for location selection. Considering that the quantity of P + R facilities that have been built in Chengdu is 5, we set 5 as the quantity of facilities set up for the optimization model. The model was run, and it converged after 40 iterations. The following results were obtained (Table 3 and Figure 4).
Table 3.
Optimization results.
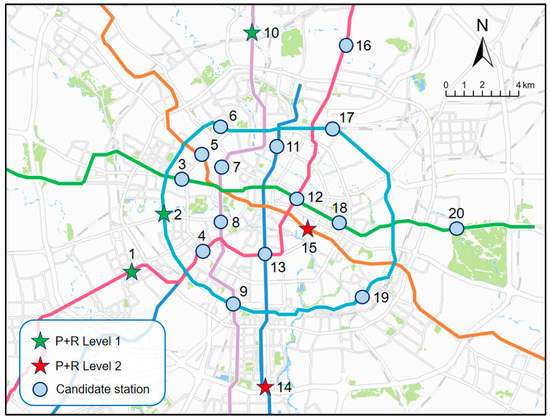
Figure 4.
Facility layout scheme based on existing demand and facility quantity.
The quantity of parking spaces in the car occupant transfer facility can be calculated from the P + R and K + R demand met in the table above. The formula for calculating the quantity of P + R parking spaces is as follows:
where represents the quantity of P + R parking spaces, represents the P + R demand met by the car occupant transfer facility, represents the parking space utilization, represents the parking turnover rate. Considering the actual situation of P + R behavior and parking lot, is 0.95 here, while is 1.
The formula for calculating the quantity of K + R parking spaces is as follows:
where represents the quantity of K + R parking spaces, represents the K + R demand met by the car occupant transfer facility. Here is 1, while is 40.
From the results above, each station’s parking space scheme of the optimization model based on existing demand and facility quantity can be obtained as shown in Table 4.
Table 4.
Each station’s parking space scheme based on existing demand and facility quantity.
It can be seen from the calculation results that the Level 1 P + R facilities are set up at station No. 1, 2, and 10, and the Level 2 P + R facilities are set up at station No. 14 and 15.
In terms of spatial location, the locations of the five proposed facilities are mainly at the periphery of the city center. This result is more consistent with the existing layout situation in Chengdu, that is, the five constructed car occupant transfer facilities are mainly located in suburbs.
From the perspective of the matching degree of facility settings and demand, the P + R demand levels of these five stations are all relatively high. This indicates that the facilities are set up in high-demand locations first to meet the needs of users in high-demand areas. It can be concluded that the layout of these facilities are well matched to the demand, which can ensure the continuous and effective operation of the car occupant transfer facilities.
From the optimization results, this layout decision reduces the number of vehicle-kilometers to 49,700, increases the transfer utility to 68,299, and meets 65% of the P + R overflow demand. This scheme achieves a certain purpose of intercepting the flow of cars and digesting the overflow of P + R demand.
4.2.2. Comparison of Optimization Results and Current Situation
In order to further explore the characteristics of the model, this section compares the optimization results with the effects of the current car occupant transfer facilities in Chengdu.
Compared with the existing car occupant transfer facilities in Chengdu, the location of station No. 14 is the same as that of the existing stations. The reason may be that the area where station No. 14, Jincheng Square Station, is located has gathered a large number of high-tech industries and has obvious commuting characteristics. At the same time, it is also a commercial gathering area. The integrated construction of commercial buildings and transfer facility will help enhance the attractiveness of the traffic hub.
Table 5 illustrates the comparison results of the traffic flow interception effect and transfer utility between the existing and optimization schemes. The results show that compared with the current layout scheme, the optimization plan obviously improves the efficiency and positive influence of car occupant transfer facilities.
Table 5.
Comparison between current layout scheme and optimized layout scheme.
Compared with the traditional P + R layout model, the optimization model has two advantages:
- The optimization layout scheme has the distribution of facilities both in the city center and at the edge of the urban area. It not only provides services for commuters in the suburb but also meets the needs of travelers in the urban area.
- The optimization model adopts the collaborative decision of P + R and K + R, which meets the requirements of elastic supply. When P + R demand overflows, the overflow demand can be transferred to the K + R facility. In this case, an additional 58 K + R parking spaces meet 65% of the P + R transfer demand overflow, greatly expanding the carrying capacity of the car occupant transfer facility at a low cost and improving the transfer efficiency.
However, the optimization scheme based on existing demand and facility quantity still has a few problems. In terms of the quantity of facilities, the number of 5 with reference to the current situation is not reasonable enough, and the satisfaction rate for overflow demand is only 65%. In terms of facility scale, it can be seen that in the result scheme, the facilities set in station No. 2 and 10 have reached the upper limit of the capacity of their own type. The reason for this phenomenon may be the insufficient number of facilities. Therefore, it is necessary to analyze the influence of the quantity of facilities on the optimization effect to be able to balance transfer supply and demand better.
4.3. The Influence of the Quantity of Facilities on the Optimization Results
Since the construction of facilities may be constrained by various conditions such as space resources, construction costs, etc., the decision on the quantity should be carefully considered.
In order to analyze the influence of the quantity of facilities on the optimization results, this section calculates the optimization effects under different quantities of facilities and summarizes the law of change. The specific steps were as follows: setting the K + R facility’s quantity constraint value to 0, adjusting the P + R facility’s quantity limit, running the model repeatedly, and recording the result. In this research, the optimization effect values with the P + R facility’s quantity of 5 to 12 were calculated, respectively. The results are drawn in Figure 5.
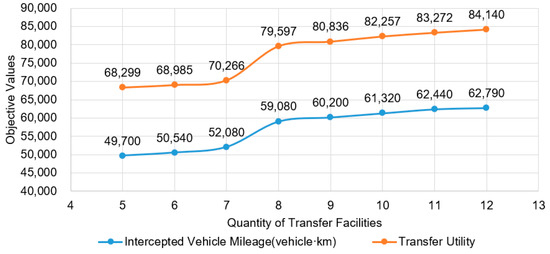
Figure 5.
The relationship between the objective values and the quantity of facilities.
It can be seen from the figure that the two objective values are positively correlated with the quantity of P + R facilities. As the quantity grows, the objective values of optimization model all reveal a trend of “slow growth”–“rapid growth”–“approximative stabilization”.
4.4. Optimization Results after Adjusting the Quantity of Facilities
From the analysis in the previous section, it can be seen that under the current situation of traffic network and transfer demand, the optimal interval for planning and constructing P + R facilities is [8,10]. In this interval, the optimization effect’s growth rate is the fastest and has reached a high level. Outside this optimal interval, the decrease in facility’s quantity will cause the demand to be unsatisfied, while the marginal utility of the system will be very limited if we continue increasing the quantity.
Therefore, the new scheme set the quantity of transfer facilities to 10. At the same time, in order to meet the car occupant transfer demand in the network to the greatest extent, the remaining candidate stations were all planned as stations with K + R facilities. The model converged after 40 iterations. The results showed that both P + R and K + R demands of station No. 3 and 19 could not reach the lower limit to construct transfer facilities, so these two stations were excluded. In the end, 18 facilities were set up, of which 10 were P + R facilities and 8 were K + R facilities.
Table 6.
Optimization results after adjusting the quantity of facilities.
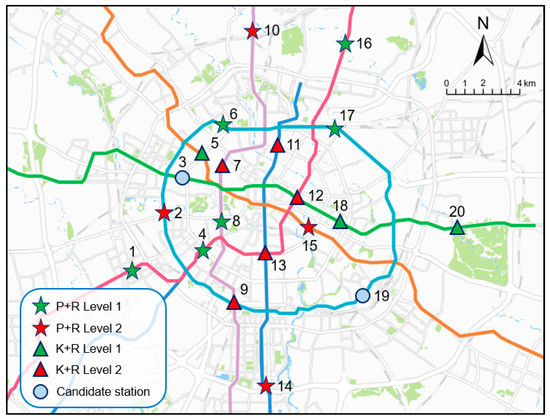
Figure 6.
Facility layout scheme after adjusting the quantity of facilities.
Compared with the initial optimization scheme, the optimization scheme after adjusting the quantity of facilities has obvious improvement from all three aspects (Table 7).
Table 7.
Comparison with the initial optimization scheme in Table 4.
In terms of the facilities’ structure, the improved scheme adds K + R facilities, which provide a new travel option for stations with low car occupant transfer requirements and not enough to build a P + R facility. K + R facilities can guide commuters to adopt this way to complete the act of car occupant transfer.
Regarding the setting of P + R facilities, it is found that the P + R stations of the improved scheme cover the P + R stations of the initial scheme. This shows the continuity and stability of the decision model, that is, the model can give priority to meeting the requirements of high-demand stations. There will be no excessive changes in the layout scheme as the quantity of facilities increases.
The difference between the improved scheme and the initial scheme is that the improved plan upgrades the Level 1 P + R facilities No. 2 and No. 10 to Level 2 P + R facilities, which solves the previously mentioned problem of capacity saturation. In the improved scheme, there is only one station that reaches the upper limit of service capacity.
In terms of the overflow of P + R demand, it was found that the P + R demand of seven P + R facilities (No. 2, 4, 6, 8, 10, 14, and 15) overflowed, but the overflow demand was met in the K + R facilities. For station No. 4, 6, and 8, although the P + R demand of each station overflowed, the K + R demand had not reached the max capacity of level 1 facility yet. Therefore, it is not necessary to upgrade these stations’ transfer facilities to level 2. The scheme shows that P + R and K + R’s collaborative layout model can indeed realize the flexible supply of parking spaces and improve the service level of the entire car occupant transfer system. That is in line with the original intention of this research.
5. Discussion and Future Work
Through the Chengdu case cited and analyzed in previous sections, we find that regardless of whether the city authorities have determined the number of P + R and K + R facilities to construct in advance, the proposed model can provide a set of reasonable and excellent layout schemes. Existing layout decision models usually only choose whether one type of facility is constructed at some station or not, while the scheme solved by our method can also tell the quantity of parking spaces each facility needs to contain. The obtained solution can meet the demand for car occupant transfer as much as possible while ensuring the utilization of parking spaces, that is, to achieve a balance between supply and demand within the city. Of course, in this article we are not able to list the investigation and processing process of some preliminary input data. Many parameters and standards may only be applicable to certain cities such as Chengdu. At the same time, due to the limited amount of surveys and calculations, we have made some assumptions from the aspects of geographic space and traveler behavior. These assumptions do not affect the expression of our concepts and methods. During practical applications, planners need to extensively investigate and analyze local characteristics and make appropriate corrections to some details in the model.
There is also some room for improvement and future work on the proposed method.
- Regarding the capacity constraints of car occupant transfer facilities, the values in this research refer to field survey data. Due to the limited amount of survey data, only a preliminary division result was obtained. With the support of sufficient data, the accuracy of matching between supply and demand can be enhanced according to the situation of different cities.
- Car occupant transfer is not only a parking behavior in the road transport system but is also related to rail transit. This research only studies the car traffic before transfer, however, the impact of the rail transit network on the supply and demand of transfer is also of high research value.
- The assumption for travelers’ demand conversion (as assumption No. 5 in Section 3.2.1) is not exactly in line with reality. It will be of great value to make a more detailed and systematical research on the law of demand conversion between P + R and K + R.
6. Conclusions
In this research, we take the layout optimization decision of the car occupant transfer facilities as the research object and establish a scientific system of multi-objective optimization model. An example of Chengdu is also carried out as a verification analysis.
The establishment of the hierarchical structure of car occupant transfer facilities is the first achievement of this research. These facilities can satisfy two kinds of transfers, including P + R and K + R. They can be divided into two types and two levels according to their service categories and capacities.
Secondly, a multi-objective optimization model for P + R and K + R facilities’ collaborative layout decision is established. The model aims to maximize the interception of vehicle mileage and the transfer utility, takes into account the construction thresholds and service capabilities of different types and levels of transfer facilities, implements collaborative planning of P + R and K + R facilities, and gives a layout scheme. The proposed method can alleviate the problem of demand conversion when transfer demand overflows. Under the constraints of the quantity and scale of construction, the proposed method strives to balance the supply and demand of car occupant transfer demand at rail transit stations.
By selecting Chengdu as one case, the proposed method reveals its excellent effect. The result shows that if the facilities were replanned with the same quantity as the present situation, the layout scheme obtained by the proposed model is significantly better than the existing scheme. If the quantity of facilities to plan is appropriately increased to 10 P + R facilities and 8 K + R facilities, the site selection plan given by the model can significantly improve the overall service level of these car occupant transfer facilities while ensuring the occupancy rate of parking spaces.
In the future, by investigating the actual situation in more cities, more appropriate facility classification standards can be formulated. It is also possible to join the research on the supply and demand of rail transit and the demand conversion of travelers, so that the car occupant transfer facilities can integrate into the multi-modal transportation network more realistically and improve the efficiency of the entire transportation system.
Author Contributions
The authors confirm contribution to the paper as follows: study conception and design: W.W.; data collection: J.C.; analysis and interpretation of results: Z.S. and Y.L.; draft manuscript preparation: Z.W. All authors have read and agreed to the published version of the manuscript.
Funding
This research is supported by National Natural Science Foundation of China, grant number 71971059 (Spatial–Temporal Characteristics Analysis of Parking Supply and Demand and Methods for Service Efficiency Improvement in Urban Large-Scale Complex at the Parking Space Level).
Conflicts of Interest
The authors declare no conflict of interest.
References
- Pojani, D.; Stead, D. Sustainable urban transport in the developing world: Beyond megacities. Sustainability 2015, 7, 7784–7805. [Google Scholar] [CrossRef]
- Faghri, A.; Lang, A.; Hamad, K.; Henck, H. Integrated knowledge-based geographic information system for determining optimal location of Park-and-Ride facilities. J. Urban Plan. Dev. 2002, 128, 18–41. [Google Scholar] [CrossRef]
- Olaru, D.; Smith, B.; Xia, J.; Lin, T. Travellers’ attitudes towards Park-and-Ride (PnR) and choice of PnR station: Evidence from Perth, Western Australia. Procedia Soc. Behav. Sci. 2014, 162, 101–110. [Google Scholar] [CrossRef]
- Gan, H.; Wang, Q. Emissions impacts of the Park-and-Ride strategy: A case study in Shanghai, China. Procedia Soc. Behav. Sci. 2013, 96, 1119–1126. [Google Scholar] [CrossRef]
- Clayton, W.; Ben-Elia, E.; Parkhurst, G.; Ricci, M. Where to park? A behavioural comparison of bus Park and Ride and city centre car park usage in Bath, UK. J. Transp. Geogr. 2014, 36, 124–133. [Google Scholar] [CrossRef]
- Chen, Z.; Xia, J.; Irawan, B.; Caulfied, C. Development of location-based services for recommending departure stations to Park and Ride users. Transp. Res. Part C Emerg. Technol. 2014, 48, 256–268. [Google Scholar] [CrossRef]
- Wang, J.; Chi, L.; Hu, X.; Zhou, H. Urban traffic congestion pricing model with the consideration of carbon emissions cost. Sustainability 2014, 6, 676–691. [Google Scholar] [CrossRef]
- Buchari, E. Transportation Demand management: A Park and Ride system to reduce congestion in Palembang City Indonesia. Procedia Eng. 2015, 125, 512–518. [Google Scholar] [CrossRef]
- Zhao, P.; Ralph, C.; Edward, R.; Philippa, H.C. Understanding Resilient Urban Futures: A Systemic Modelling Approach. Sustainability 2013, 5, 3202–3223. [Google Scholar] [CrossRef]
- Farhan, B.; Murray, A.T. Siting Park-and-Ride facilities using a multi-objective spatial optimization model. Comput. Oper. Res. 2008, 35, 445–456. [Google Scholar] [CrossRef]
- Cornejo, L.; Perez, S.; Cheu, R.L.; Hernandez, S. An approach to comprehensively evaluate potential Park and Ride facilities. Int. J. Transp. Sci. Technol. 2014, 3, 1–18. [Google Scholar] [CrossRef]
- Wang, J.Y.T.; Yang, H.; Lindsey, R. Locating and pricing Park-and-Ride facilities in a linear monocentric city with deterministic mode choice. Transp. Res. Part B Methodol. 2004, 38, 709–731. [Google Scholar] [CrossRef]
- Song, Z.; He, Y.; Zhang, L. Integrated planning of Park-and-Ride facilities and transit service. Transp. Res. Part C Emerg. Technol. 2017, 74, 182–195. [Google Scholar] [CrossRef]
- Sargious, M.A.; Janarthanan, N. Forecasting demand for the Park-and-Ride mode and determining the optimal location of stations. Can. J. Civ. Eng. 2011, 10, 695–702. [Google Scholar] [CrossRef]
- Zhang, Y. Research on Demand Forecasting and the Site Selection Model of P&R Facilities. Master’s Thesis, Jilin University, Changchun, China, 3 June 2015. [Google Scholar]
- Horner, M.W.; Groves, S. Network flow-based strategies for identifying rail Park-and-Ride facility locations. Socio-Econ. Plan. Sci. 2007, 41, 255–268. [Google Scholar] [CrossRef]
- Fang, Q.; Wu, Z. Study on the model of the location of urban Park-and-Ride lots. Hebei Jiaotong Sci. Technol. 2009, 6, 52–55. [Google Scholar]
- Liu, Y.; Yan, K. A GIS-based study on the optimum location of urban Park & Ride facilities. Transp. Sci. Technol. 2003, 4, 85–87. [Google Scholar]
- Gong, Y. Research on Site Selection of Park and Ride Facilities along with Subway. Master’s Thesis, Southeast University, Nanjing, China, 29 October 2015. [Google Scholar]
- Cheng, H. Method and Model of P&R Location Based on Urban Rail Transit Network. Master’s Thesis, Beijing Jiaotong University, Beijing, China, 1 June 2018. [Google Scholar]
- Zhao, Y. Research on the Model of the Location of Urban Park-and-Ride Lots Based on Complex System Theory. Master’s Thesis, Huazhong University of Science and Technology, Wuhan, China, 1 May 2011. [Google Scholar]
- Holguín-Veras, J.; Yushimito, W.F.; Aros-Vera, F.; Reilly, J. User rationality and optimal Park-and-Ride location under potential demand maximization. Transp. Res. Part B Methodol. 2012, 46, 949–970. [Google Scholar] [CrossRef]
- He, B. Study on Planning Methods of Park-and-Ride Facility. Ph.D. Thesis, Southeast University, Nanjing, China, 22 June 2006. [Google Scholar]
- Bos, I.; Molin, E.; Timmermans, H.; Rob, V.D.H. Cognition and relative importance underlying consumer valuation of Park-and-Ride facilities. Transp. Res. Rec. 2003, 1835, 121–127. [Google Scholar] [CrossRef]
- Pei, Y.; Liu, C. Park-and-ride station location and its demand predicting. J. Chang. Univ. (Nat. Sci. Ed.) 2005, 1, 60–63. [Google Scholar]
- Fan, W.; Khan, M.B.; Ma, J.; Jiang, X. Bilevel programming model for locating Park-and-Ride facilities. J. Urban Plan. Dev. 2014, 140, 04014007. [Google Scholar] [CrossRef]
- Wang, Q. Research on Location Optimization of Park and Ride Facilities Under Multi-Modal Traffic Conditions. Master’s Thesis, Beijing Jiaotong University, Beijing, China, 4 June 2018. [Google Scholar]
- Hamid, N.A. Utilization patterns of Park and Ride facilities among Kuala Lumpur commuters. Transportation 2009, 36, 295–307. [Google Scholar] [CrossRef]
- Schank, J.L. Encouraging kiss-and-ride at commuter railroad stations. Transp. Res. Rec. 2002, 1793, 7–14. [Google Scholar] [CrossRef]
- Weiss, A.; Habib, K.N. Examining the difference between park and ride and kiss and ride station choices using spatially weighted error correlation (SWEC) discrete choice model. J. Transp. Geogr. 2017, 59, 111–119. [Google Scholar] [CrossRef]
- Liu, Y. Study on Optimization and Configuration of P+R and K+R Facility Location Under Multi-Mode Transportation Network. Mater’s Thesis, Southeast University, Nanjing, China, 31 May 2020. [Google Scholar]


Publisher’s Note: MDPI stays neutral with regard to jurisdictional claims in published maps and institutional affiliations. |
© 2020 by the authors. Licensee MDPI, Basel, Switzerland. This article is an open access article distributed under the terms and conditions of the Creative Commons Attribution (CC BY) license (http://creativecommons.org/licenses/by/4.0/).