Article

Investigation on the Coupling Coordination Relationship between Electric Power Green Development and Ecological Civilization Construction in China: A Case Study of Beijing

1
School of Economics and Management, North China Electric Power University, Beijing 102206, China
2
Beijing Key Laboratory of New Energy and Low-Carbon Development, North China Electric Power University, Beijing 102206, China
3
Public Administration School, East China Normal University, Shanghai 200062, China
*
Author to whom correspondence should be addressed.
Sustainability 2020, 12(21), 8845; https://doi.org/10.3390/su12218845
Submission received: 21 September 2020 / Revised: 21 October 2020 / Accepted: 22 October 2020 / Published: 24 October 2020

Abstract

:
In the context of ecological civilization construction (ECC) and energy revolution strategy, there are many studies on ECC or electric power green development (EPGD). However, EPGD and ECC influence each other and are closely related, and there are few studies on the development relationship of EPGD and ECC. Therefore, this paper aims to study the coupling coordination relationship between EPGD and ECC to make them develop in harmony. Firstly, an evaluation index system of EPGD and ECC for their coupling coordination relationship is proposed. Then, this paper combines the coupling coordination degree model (CCDM), improved analytic hierarchy process (AHP) based on cloud model, and regression model to propose a coupling coordination relationship analysis model for EPGD and ECC. The improved AHP based on cloud model can fully reflect the will of decision-makers and effectively deal with the ambiguity and randomness of weight judgment. Finally, this paper conducts an empirical study on Beijing and verifies the applicability of the model proposed in this study. Policy recommendations to promote EPGD and ECC are proposed based on weight analysis, coupling coordination degree (CCD) analysis and regression analysis. This paper provides tools for the study on policies related to power development and ecological civilization.

1. Introduction

The rapid economic development of China has brought negative effects on resources, environment, habitat and other aspects. Due to increasing ecological pressure, the Chinese government has successively put forward two national strategies: ecological civilization construction (ECC) and energy revolution. Therefore, establishing the relationship between the two strategic systems to promote ecological civilization and energy transformation is beneficial to facilitating the comprehensive green and sustainable development of China.
From its formal proposal in 2007 to its inclusion in the Constitution in 2018, the ECC is increasingly important in national development and governance system. ECC is to promote economic and social development, premised on protecting or improving the ecological environment [1]. It requires human beings to follow the objective laws of nature while using nature [2]. Thus, the ecosystem can reach a balanced state of sustainable development [3]. ECC is an important task for China’s sustainable development.
The current literature on ECC mainly includes practice paths and evaluation studies. In terms of practice paths, Liu et al. [4] discussed China’s sustainable development path in combination with the ECC. Jiang et al. [5] took the ecological red line policy as an example to study the implementation of specific policies in China’s ecological civilization plan. In the view of ecological civilization evaluation, Lai et al. [6] took Jiangsu province as an example to evaluate and analyze the efficiency of urban ECC. Some scholars have comprehensively evaluated China’s ECC from time and space dimensions. Liu et al. [7] set indicators from the three aspects of resources, environment and economy. Wang and Chen [3] set indicators from the five aspects of resources, environment, economy, society and culture. The indicators in most studies included the four aspects of resources, environment, economy and society [1,8,9,10,11]. Therefore, this paper sets ECC indicators from the four aspects of resources, environment, economy and society.
The energy revolution strategy was proposed in 2014. Suzhou Consensus pointed out that the nature of the energy revolution can be summarized as the replacement of the main energy and the change of the development and utilization methods [12]. As an indispensable part of the modern energy system, the electric power green development (EPGD) is the main support for achieving the energy green development and promoting the energy revolution. Green development focuses on strengthening resource environmental protection when developing the economy. The EPGD mainly refers to clean, efficient and low-carbon development of the power industry [13,14].
Regarding the green development of energy and power, some scholars argued that government policies need to shift to the green energy economy and introduce energy-saving technology and green technology to develop a green energy economy [15,16]. Other scholars believed that the realization of low-carbon energy requires the standardization of technology markets and the improvement of policy systems [17,18]. Given the power industry, some literature has analyzed the significance of clean coal technology, clean energy utilization and cogeneration for the power generation industry green development [19,20,21]. Some scholars have explored the impact of power plants on the environment and human health [22,23,24,25,26]. Peters et al. [27] studied the evaluation and deployment of smart grids. Wu et al. [28] made a multi-scenario forecast of China’s power substitution potential and proposed development suggestions. There are also some studies that have evaluated the EPGD, mainly for the sustainability of the power industry. Ren and Dong [29] evaluated the sustainability and security of electricity supply. Botelho et al. [30] studied the social sustainability of renewable energy sources. Life cycle sustainability evaluation of the electricity in Turkey and Spain was also conducted [31,32].
To sum up, most of the current literature conducted separate research on the EPGD or the ECC. There is little research on the development relationship of EPGD and ECC. However, the EPGD is closely related to the ECC. On the one hand, EPGD is an important content to promote the ECC of China. On the other hand, the ECC is conducive to stimulating the demand for electric power and creating conditions for the EPGD. Therefore, this study focuses on the coupling coordination relationship between the two subsystems of EPGD and ECC, so as to establish a connection point for the two strategic systems of ECC and energy revolution to realize coordinated development.
Most of the research on the coupling coordination relationship has used the coupling coordination degree model (CCDM) [33,34]. Some scholars combined CCDM with other methods, such as system dynamics [35,36] and regression analysis [37]. This paper uses the CCDM and regression model. When using the CCDM, most studies adopt the entropy method (EM) to determine the index weight, which cannot reflect the wishes of decision makers. In response to this problem, this paper introduces the improved analytic hierarchy process (AHP) based on cloud model [38].
This paper has three main contributions as follows: (1) The main elements of EPGD and ECC in China are analyzed, and the evaluation index system of the coupling coordination relationship between EPGD and ECC is constructed based on the elements mentioned above. (2) This paper combines the CCDM, improved AHP based on cloud model, and regression model to propose a coupling coordination relationship analysis model for EPGD and ECC. The improved AHP based on cloud model can fully retain the will of decision makers and effectively manage the ambiguity and randomness of weight judgment. (3) Policy recommendations to promote EPGD and ECC in Beijing are proposed based on weight analysis, coupling coordination degree (CCD) analysis and regression analysis. Taking Beijing as an example, this paper identifies the indicators with larger weight, poorer performance, and greater impact on the other party in the development of EPGD and ECC in 2004–2017, and puts forward recommendations for the identified indicators.
The arrangement of the rest is as follows: After the Introduction, a coupling coordination relationship evaluation index system for EPGD and ECC is proposed in Section 2. Section 3 introduces research methods, including improved AHP based on cloud model, CCDM, and regression model. An empirical study is carried out with Beijing as an example in Section 4, and suggestions for the EPGD and ECC in Beijing are put forward. Section 5 summarizes this article.

2. Evaluation Index System of EPGD and ECC

2.1. Main Elements of EPGD and ECC

Through the analysis of relevant policy documents, the research of domestic and foreign representative enterprises and literature research, the main elements of EPGD and ECC are summarized.

2.1.1. Main Elements of EPGD

In China, the electric power industry chain is mainly composed of the power generation side, grid side and user side. The main elements of EPGD are analyzed from the three parties mentioned above [25,27,30,39,40,41]. The elements are shown in Figure 1, and the details are as follows:
  • Power generation side: This part includes cleanliness of power generation and power generation equipment utilization efficiency. The cleanliness of power generation includes cleanliness of power generation structure and cleanliness of thermal power.
  • Grid side: This part includes grid transmission efficiency and harmony between the power grid and the urban landscape. Among them, the grid transmission efficiency is embodied in the energy saving in the power transmission process and the power transmission line utilization efficiency.
  • User side: This part includes the contribution of electricity to production and living and the efficiency of industrial electricity consumption. The contribution of electricity to production and living is to reflect the importance of electricity as an energy source in production and life. The efficiency of industrial electricity consumption is to reflect the efficiency of electricity consumption. The contribution of electricity to production and living is reflected in the electricity proportion in energy consumption of terminal, and the electricity consumption of people’s lives.

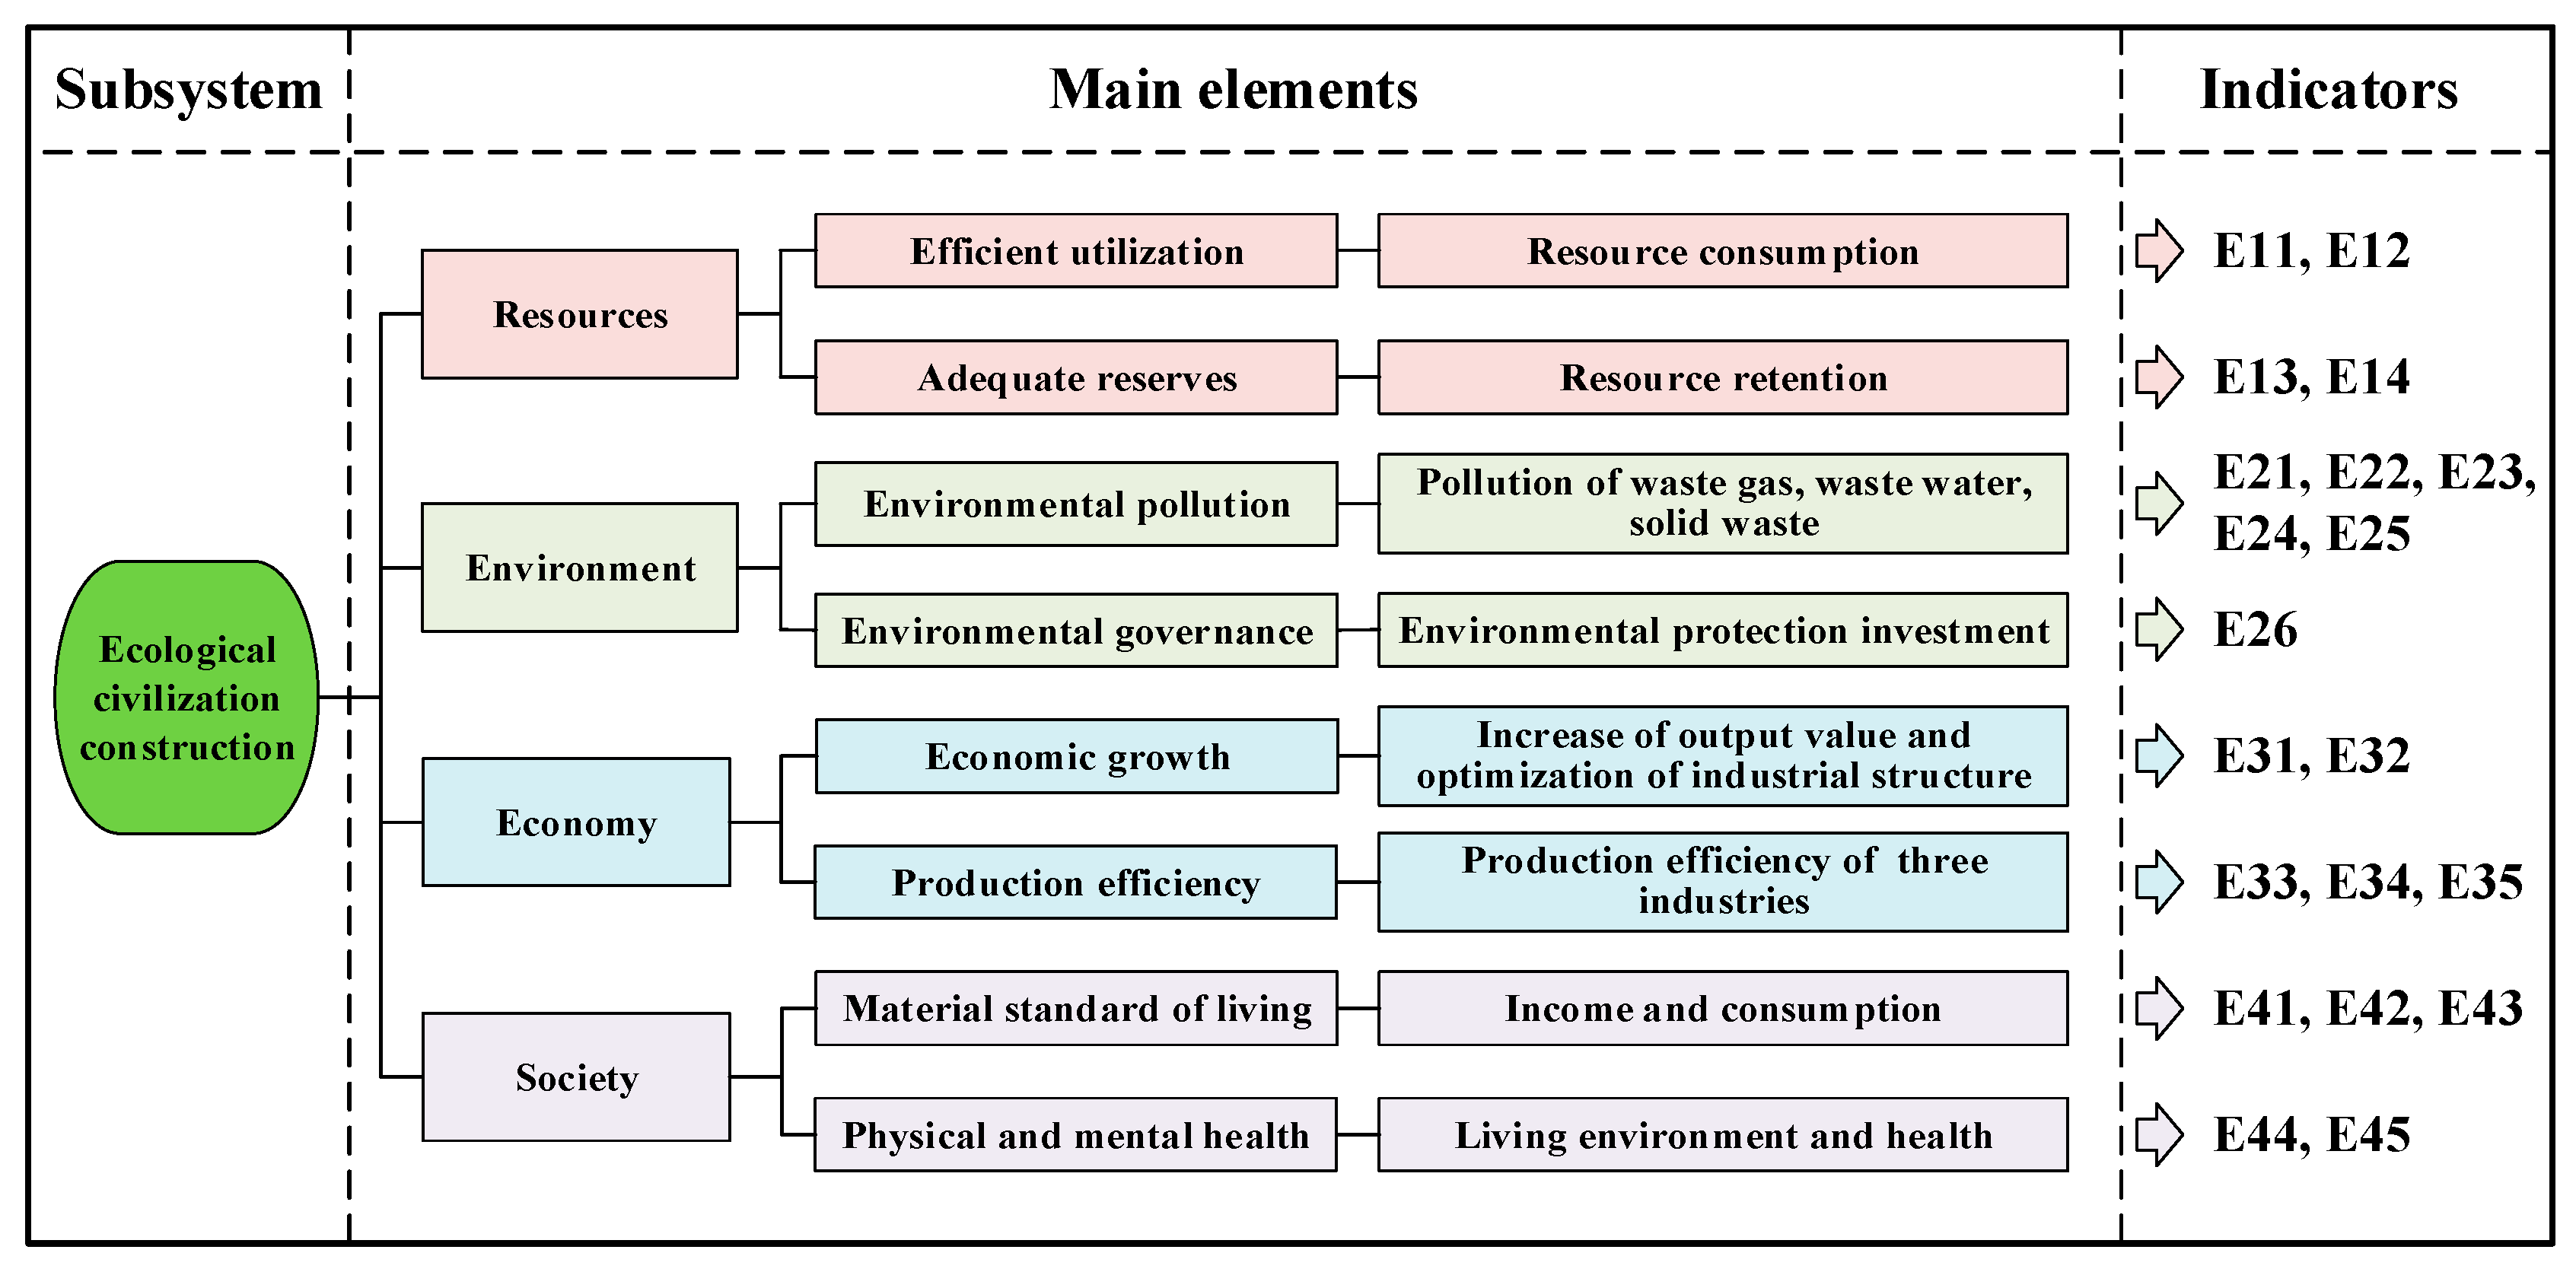
2.1.2. Main Elements of ECC

The ECC involves all aspects of social development, including resources, environment, economy and society [1,3,7,8,42,43]. The main elements of ECC are analyzed from four aspects, as shown in Figure 2.
  • Resources: This part includes efficient utilization and adequate reserves of resources. It is mainly reflected by the level of resource consumption and the level of resource retention.
  • Environment: This part includes environmental pollution and governance level. That is to maintain a good environmental condition by reducing the emission of various forms of pollutants and increasing the investment of environmental protection.
  • Economy: This part includes economic growth and production efficiency. Economic growth reflects the results of industrial development, and production efficiency measures the process of industrial development. Specifically, it includes the increase of the overall output value, the industrial structure optimization, and the production efficiency improvement of various industries.
  • Society: This part refers to the happiness of people’s lives mainly. On the one hand, it is reflected in the material standard of living, including the levels of income and consumption; on the other hand, it is reflected in the physical and mental health, including the living environment and health status.

2.2. Construction of Index System

The coupling system includes the EPGD subsystem and the ECC subsystem. According to the main elements of the two subsystems above, the index system is constructed combined with the index selection in relevant literature [1,3,7,8,20,25,27,28] and data availability, as shown in Table 1. The EPGD subsystem includes three first-grade indices and thirteen second-grade indices. The ECC subsystem includes four first-grade indices and twenty second-grade indices.

2.3. Explanation of the Index System

2.3.1. Index System of EPGD

The corresponding relationship between each index and the main elements of the EPGD is shown in Figure 1.
  • On the power generation side, the cleanliness of the power generation structure is measured by G11–G13, where clean energy refers to power generation from energy sources other than thermal power; the thermal power cleanliness is measured by G14; the utilization efficiency of power generation equipment is measured by G15. In particular, in the cross-regional transmission of power, the pollution caused by power production will be detrimental to the environment in the power output area, but it will not affect the environment in the power input area. So, the proportion of external power received can reflect the cleanliness of the power generation of the power input area to a certain extent.
  • On the grid side, energy saving in the transmission process, the utilization efficiency of transmission lines, and harmony between the power grid and urban landscape are measured by G21, G22, and G23, respectively. Among them, laying power lines underground can reduce the occupation of land and space by overhead lines, which is conducive to improving the aesthetics of urban landscapes. At the same time, it is protected from adverse weather conditions and has a relatively low failure rate, which is conducive to improving the reliability of power transmission.
  • On the user side, the degree of electric power substitution is measured by G31; the electricity consumption of people’s lives is measured by G32; the efficiency of industrial electricity consumption is measured by G33–G35.

2.3.2. Index System of ECC

The corresponding relationship between each index and the main elements of ECC is shown in Figure 2.
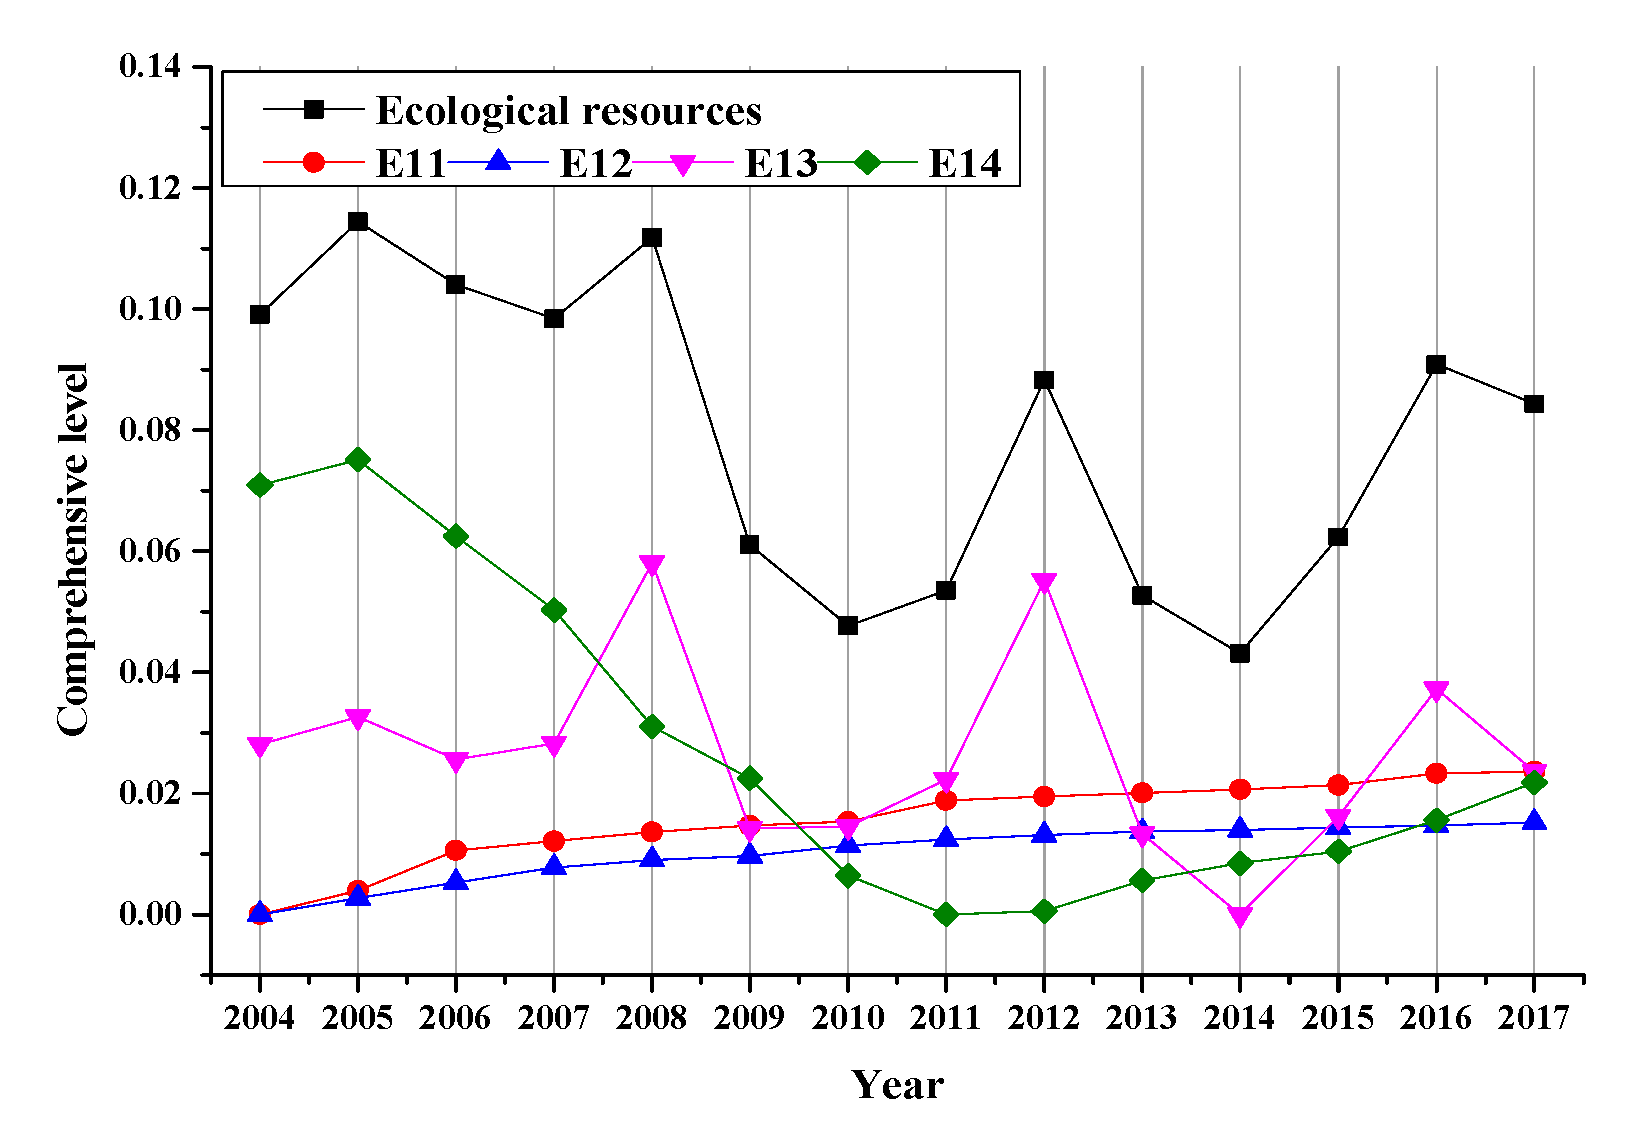
  • In terms of resources, resource consumption is measured by E11 and E12; resource retention is measured by E13 and E14.
  • In terms of environment, gas waste, liquid water and solid waste pollution are measured by E21–E25, respectively; environmental protection investment is measured by E26.
  • In terms of economy, the increase of output value is measured by E31; the industrial structure optimization is measured by E32; the production efficiency of the three industries is measured by E33–E35. In particular, the relationship between the tertiary industry and consumption is the most direct, and consumption is a reliable force for sustained economic growth. Therefore, the proportion of the added value of the tertiary industry is used to measure the effect on the economic growth of the optimization of industrial structure.
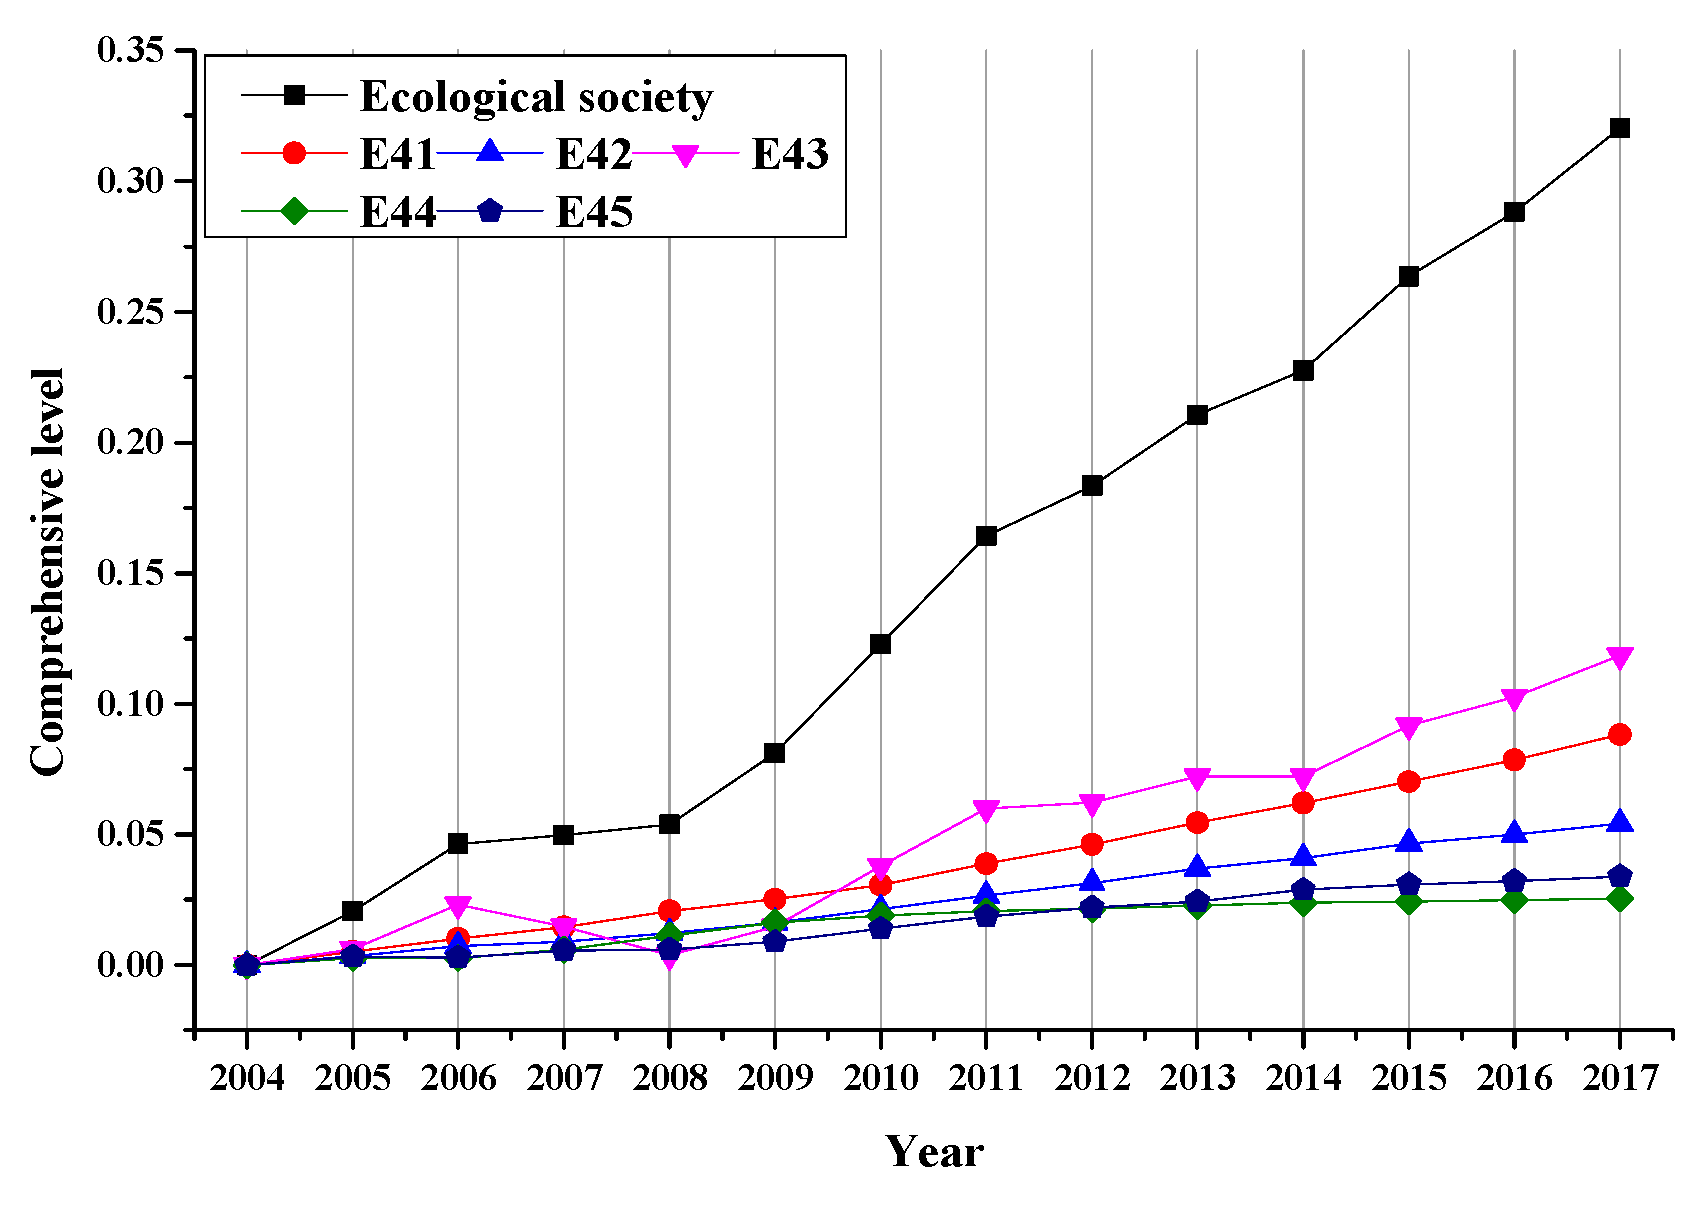
  • In terms of society, income and consumption are measured by E41–E43; living environment and health are measured by E44 and E45.

3. Research Methods

3.1. Coupling Coordination Degree Model

The coupling includes coupling degree (CD) and CCD. CD mainly measures the interaction degree among the systems. CCD focuses on the harmonious degree among the systems, reflecting the actual development level of the systems [44,45,46]. The CCDM is often used to research the coupling coordination relationship of multiple subsystems [35]. Therefore, the CCDM is used to research the coupling coordination relationship between EPGD and ECC.

3.1.1. Data Pre-Processing

To make the results comparable, this paper needs to standardize the original data. The extreme standardization is widely used to standardize original data in CCDM [33,35,36,37]. The equations are as follows:
A i j = ( X i j X min j ) / ( X max j X min j ) , X i j   i s   t h e   p o s i t i v e   i n d i c a t o r
A i j = ( X max j X i j ) / ( X max j X min j ) , X i j   i s   t h e   n e g a t i v e   i n d i c a t o r
where i denotes the year; j denotes the sequence of the index; A i j and X i j are the standardized value and original value of index j , respectively; X max j denotes the maximum value of index j in all years; X min j denotes the minimum value of index j in all years.

3.1.2. Improved AHP Based on Cloud Model for Weight Determination

In the CCDM, EM is widely used in determining index weights [33,36]. However, EM is based on the degree of variation of the indicator [47], and cannot reflect the emphasis of decision makers on different indicators, or even violates general cognition. In the subjective weighting methods, AHP is the most widely used. AHP is also applicable to the index system with a clear hierarchical structure in this paper.
Although AHP has a greater advantage than EM in determining weights based on the intention of decision makers, it has relatively poor objectivity. The uncertainty of the research object is generally represented by ambiguity and randomness. In the traditional AHP, the judgment matrix uses integer values and its reciprocal to express the relative importance of elements, and it is difficult to reflect the ambiguity and randomness of the importance judgment [48]. Fuzzy AHP was proposed. It considered the ambiguity of subjective judgment but did not reflect randomness.
The cloud model proposed by Deyi Li can convert qualitative concepts and quantitative values [49], which fully expresses the ambiguity and randomness of qualitative concepts, and has greater objectivity [50]. Therefore, this paper adopts the improved AHP based on cloud model and uses the cloud model to represent the scale of the judgment matrix, which can better deal with the ambiguity and randomness of the judgment matrix, and improve the objectivity of AHP [38].

Basic Concept of the Cloud Model

T is a qualitative concept on a universe D . x ( x D ) is a random instance of T . x satisfies E n ~ N ( E n , H e 2 ) , x ~ N ( E x , E n 2 ) , and the membership function of x belonging to T is represented by η T ( x ) [49]:
η T ( x ) = e ( x E x ) 2 2 ( E n ) 2
x represents a cloud drop in D , and many cloud drops make up a cloud. In the cloud model, the quantitative attribute of a qualitative concept is described by three numerical features, expectation ( E x ), entropy ( E n ) and hyper entropy ( H e ), as shown in Figure 3. E x represents the center value of the cloud. E n reflects the ambiguity of the qualitative concept. H e reflects the dispersion of cloud drops and the randomness of samples.
Qualitative concepts and quantitative data are transformed by cloud generators. As shown in Figure 4, through the forward cloud generator, the cloud digital features ( E x , E n , H e ) are transformed into a cloud composed of a large number of cloud drops, while the backward cloud generator is the opposite.
Steps of improved AHP based on cloud model:
• Step 1: Construct a judgment matrix based on cloud model scale.
1. Define the cloud model scale of the judgment matrix.
The cloud model scale of the judgment matrix is represented by ( E x , E n , H e ) , as shown in Table 2 [38]. The schematic diagram of cloud model scale is shown in Figure 5.
2. Each decision maker gives a judgment matrix A k .
A k = ( a 11 k      a 12 k           a 1 n k a 21 k      a 22 k           a 2 n k                a n 1 k      a n 2 k           a n n k ) = ( A 11 k ( E x 11 k , E n 11 k , H e 11 k )    A 12 k ( E x 12 k , E n 12 k , H e 12 k )       A 1 n k ( E x 1 n k , E n 1 n k , H e 1 n k ) A 21 k ( E x 21 k , E n 21 k , H e 21 k ) A 22 k ( E x 22 k , E n 22 k , H e 22 k ) A 2 n k ( E x 2 n k , E n 2 n k , H e 2 n k ) A n 1 k ( E x n 1 k , E n n 1 k , H e n 1 k ) A n 2 k ( E x n 2 k , E n n 2 k , H e n 2 k ) A n n k ( E x n n k , E n n n k , H e n n k ) )
a j i = A j i ( E x j i , E n j i , H e j i ) = 1 a i j = 1 A i j ( E x i j , E n i j , H e i j ) = A j i ( 1 E x i j , E n i j ( E x i j ) 2 , H e i j ( E x i j ) 2 )
where n indicates the number of indicators for comparison; a i j k ( i , j = 1 , 2 , , n ) indicates the importance of index i to index j judged by decision maker k ; A i i ( E x i i , E n i i , H e i i ) = ( 1 , 0 , 0 ) .
3. Calculate the integrated cloud.
Calculate the integrated cloud based on the judgment matrices given by K experts, and the group judgment matrix that combines the opinions of all experts is obtained. The calculation equations for synthesizing K clouds are as follows [51]:
E x i j = σ 1 E x i j 1 + σ 2 E x i j 2 + + σ K E x i j K
E n i j = σ 1 E x i j 1 E n i j 1 + σ 2 E x i j 2 E n i j 2 + + σ K E x i j K E n i j K σ 1 E x i j 1 + σ 2 E x i j 2 + + σ K E x i j K
H e i j = ( H e i j 1 ) 2 + ( H e i j 2 ) 2 + + ( H e i j K ) 2
where σ 1 , σ 2 , , σ K are undetermined coefficients, and k = 1 K σ k = 1 . In this study, the weights of the experts are the same, that is, σ 1 = σ 2 = = σ K .
By Equations (6)–(8), the group judgment matrix is obtained, as follows:
A = ( a 11      a 12           a 1 n a 21      a 22           a 2 n              a n 1      a n 2           a n n ) = ( A 11 ( E x 11 , E n 11 , H e 11 )    A 12 ( E x 12 , E n 12 , H e 12 )       A 1 n ( E x 1 n , E n 1 n , H e 1 n ) A 21 ( E x 21 , E n 21 , H e 21 ) A 22 ( E x 22 , E n 22 , H e 22 ) A 2 n ( E x 2 n , E n 2 n , H e 2 n ) A n 1 ( E x n 1 , E n n 1 , H e n 1 ) A n 2 ( E x n 2 , E n n 2 , H e n 2 ) A n n ( E x n n , E n n n , H e n n ) )
• Step 2: Test the consistency of the group judgment matrix.
Test the consistency of E x i j in the group judgment matrix [38].
C R = λ max t ( t 1 ) × R I
where C R is the matrix consistency ratio; t indicates the order of the matrix composed of E x i j ; λ max indicates the maximum eigenvalue of the matrix composed of E x i j ; R I is the random index, its value can refer to Table 3 [52].
The consistency test is passed when C R 0.1
• Step 3: Calculate the relative weight vector of the indicator.
Use the square root method to calculate the relative weight vector of indicator i , W i 0 ( E x i 0 , E n i 0 , H e i 0 ) .
E x i 0 = E x i E x i = ( j = 1 n E x i j ) 1 n i = 1 n ( j = 1 n E x i j ) 1 n
E n i 0 = E n i E n i = ( ( j = 1 n E x i j ) j = 1 n ( E n i j E x i j ) 2 ) 1 n i = 1 n ( ( j = 1 n E x i j ) j = 1 n ( E n i j E x i j ) 2 ) 1 n
H e i 0 = H e i H e i = ( ( j = 1 n E x i j ) j = 1 n ( H e i j E x i j ) 2 ) 1 n i = 1 n ( ( j = 1 n E x i j ) j = 1 n ( H e i j E x i j ) 2 ) 1 n
• Step 4: Calculate the final weight.
The final weight of indicator i , W i ( E x i , E n i , H e i ) , is calculated as follows [38]:
E x i = E x g 0 × E x i 0
E n i = E n g 0 × E n i 0
H e i = H e g 0 × H e i 0
where g is the previous level indicator of indicator i .
• Step 5: Rank the importance of indicators.
The greater the expectation in the weight vector of the indicator, the more important the indicator is. When the expectations are the same, the importance of indicators can be further compared based on entropy and hyper entropy. Indicators with smaller entropy and hyper entropy are more important.
In the improved AHP based on cloud model, the ambiguity and randomness of the evaluation language participate in the calculation, which provides a further reference standard for decision making.

3.1.3. Evaluation of EPGD and ECC

The comprehensive level of subsystem X in year i :
S i j = W j × A i j ,   P ( X ) = j = 1 n S i j
where S i j refers to the evaluation value of index j in year i ; W j refers to the weight of index j ; A i j denotes the standardized value of index j in year i ; P ( X ) represents the comprehensive level of subsystem X in year i ; n refers to the number of indicators in subsystem X .

3.1.4. Evaluation of the CCD

Let C denote the CD:
C = ( 2 f ( X ) × g ( Y ) ) / ( f ( X ) + g ( Y ) )
where f ( X ) and g ( Y ) are calculated by Equation (17), representing the comprehensive level of the subsystems.
Let D denote the CCD:
D = C × T ,   T = α × f ( X ) + β × g ( Y )
where α , β represent the undetermined coefficients, α + β = 1 , and in this paper, α = β = 1 / 2 [53,54]. T represents the comprehensive evaluation index of the two-dimensional system.
The division of the development stages according to CCD is as shown in Table 4 [36].

3.2. Regression Model

As a statistical analysis method, regression analysis is widely used in the study of the quantitative relationship between variables [37,55,56,57]. The regression model is used in this paper for analysis of the relationships between the ECC subsystem and the EPGD subsystem’s first-grade indicators, and the relationships between the EPGD subsystem and the ECC subsystem’s first-grade indicators [37]. This paper uses the parametric goodness of fit ( R 2 value) for the checking of the model’s adaptability [55]. It is judged that the relationship studied in this paper showed a linear relationship. The linear regression model expression is as follows:
y = γ × x + ξ
where x and y are the independent and dependent variables; γ , ξ are the model coefficients. γ represents the influence of x on y , which is called the regression coefficient.

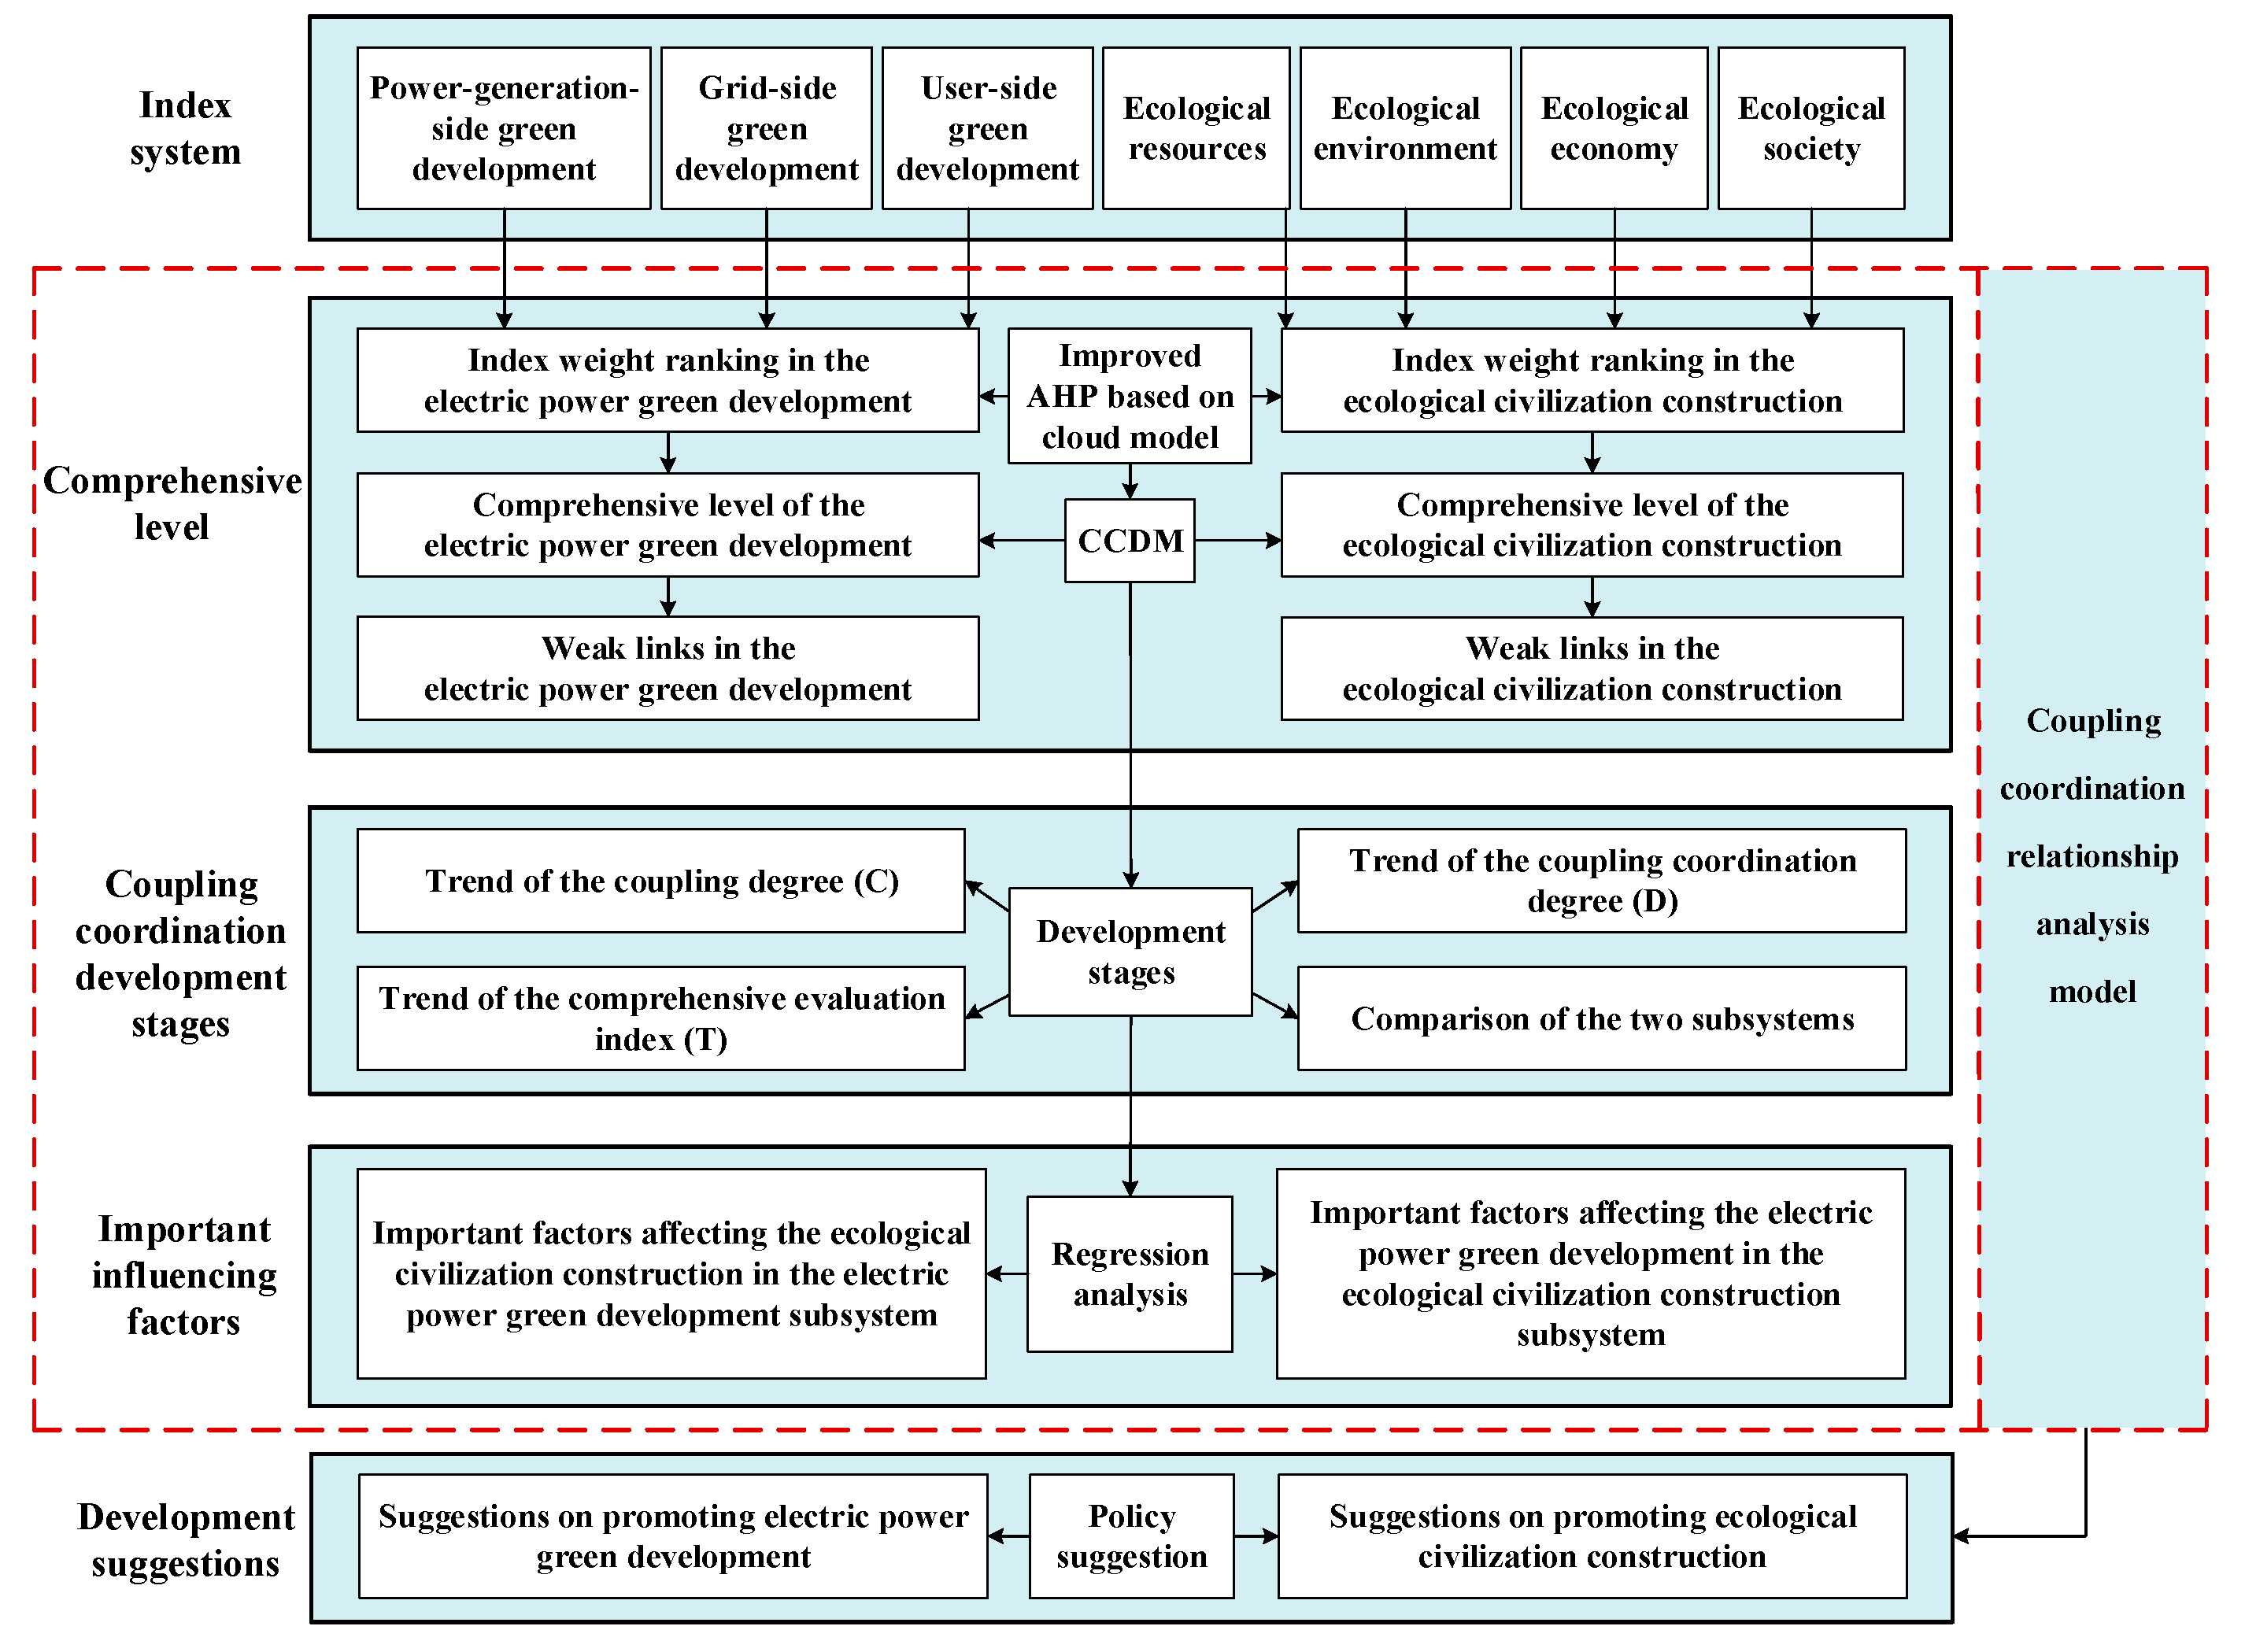
3.3. Research Framework

The logic diagram of this paper is shown in Figure 6.
(1) Construct the index systems of two subsystems: EPGD and ECC. (2) Evaluate the comprehensive level of each subsystem and identify the more weighted indicators and weak links. (3) Explore the coupling coordination development stages of EPGD and ECC. (4) Carry out regression analysis to analyze the important factors that affect each other between the two subsystems. (5) Put forward development suggestions.

4. Case Study

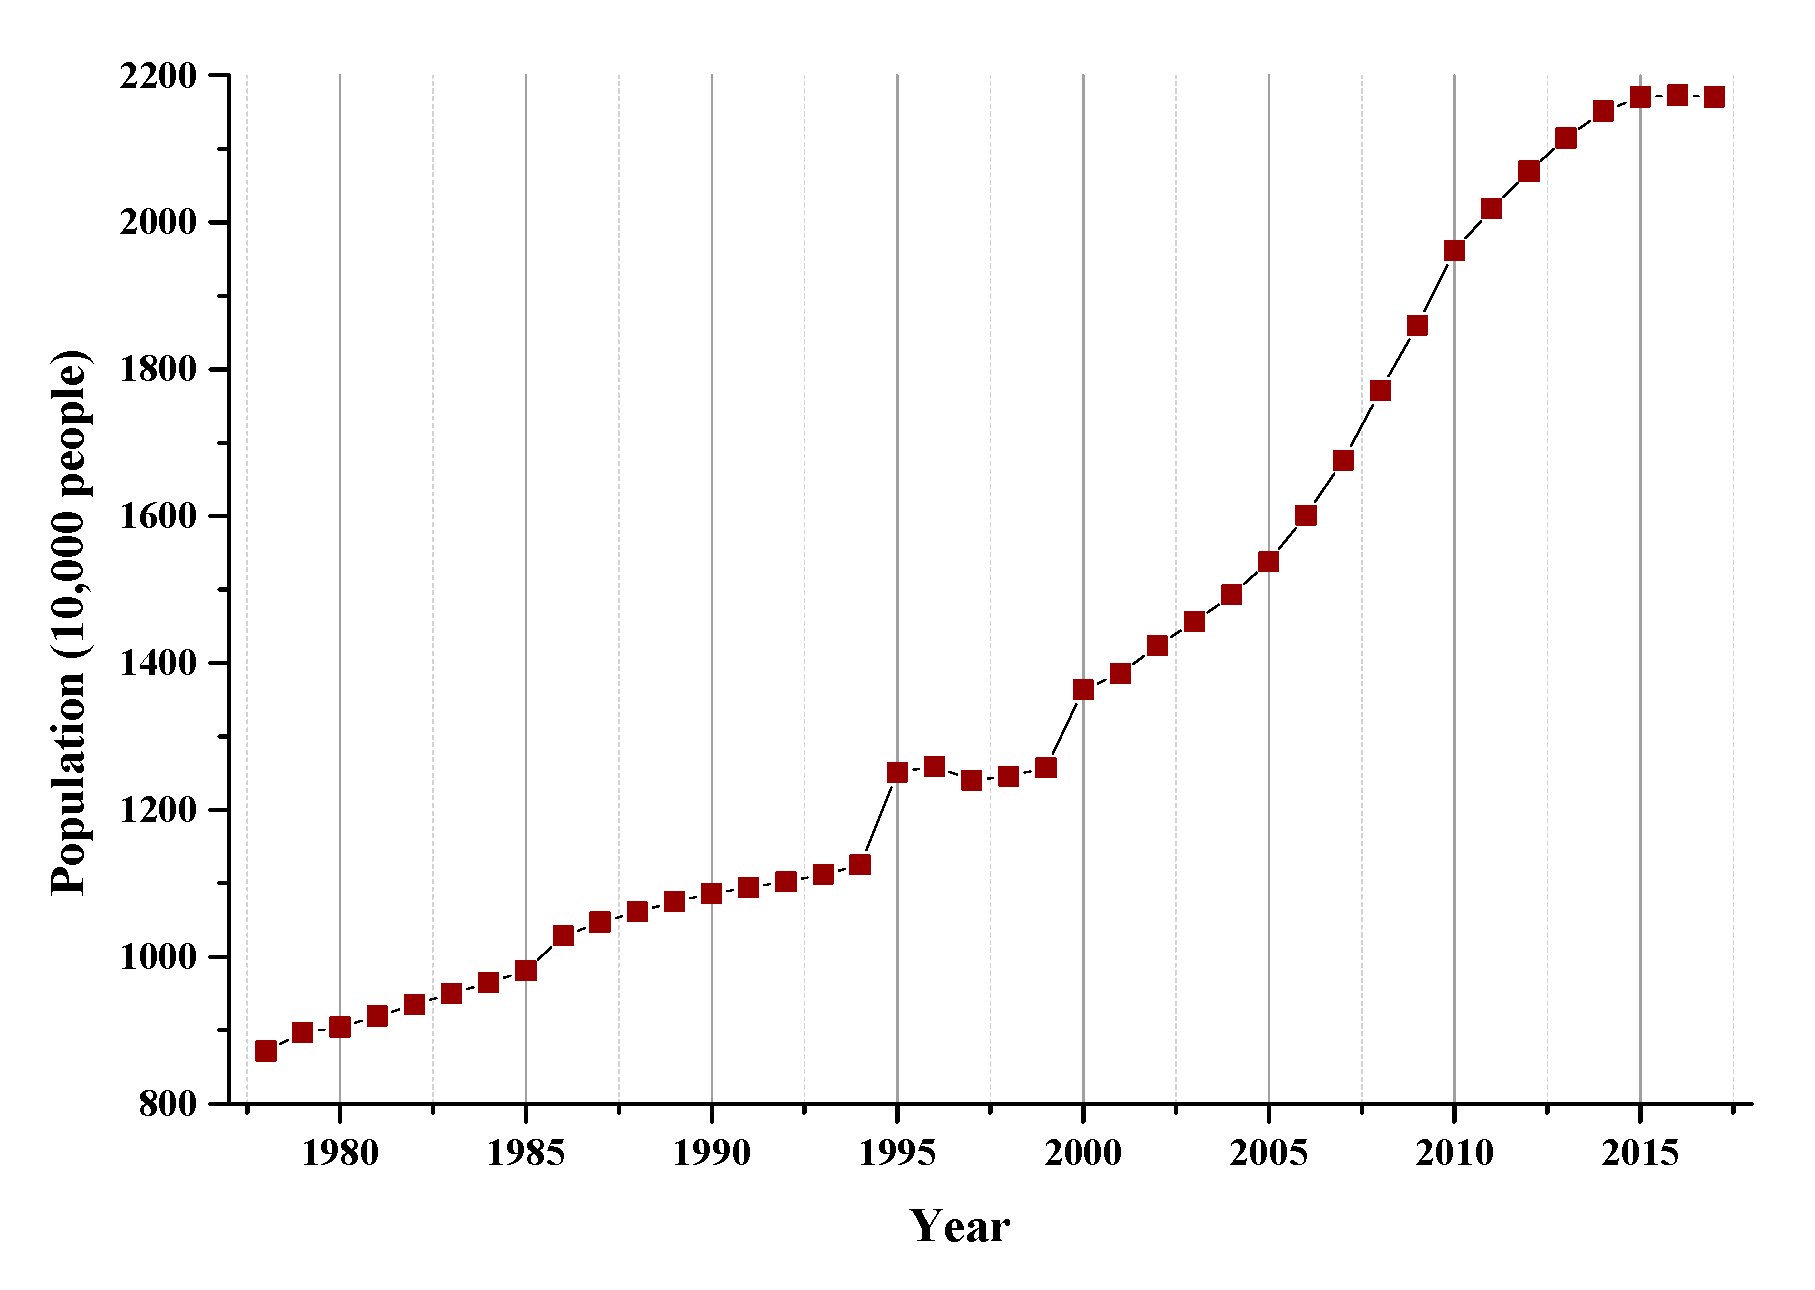
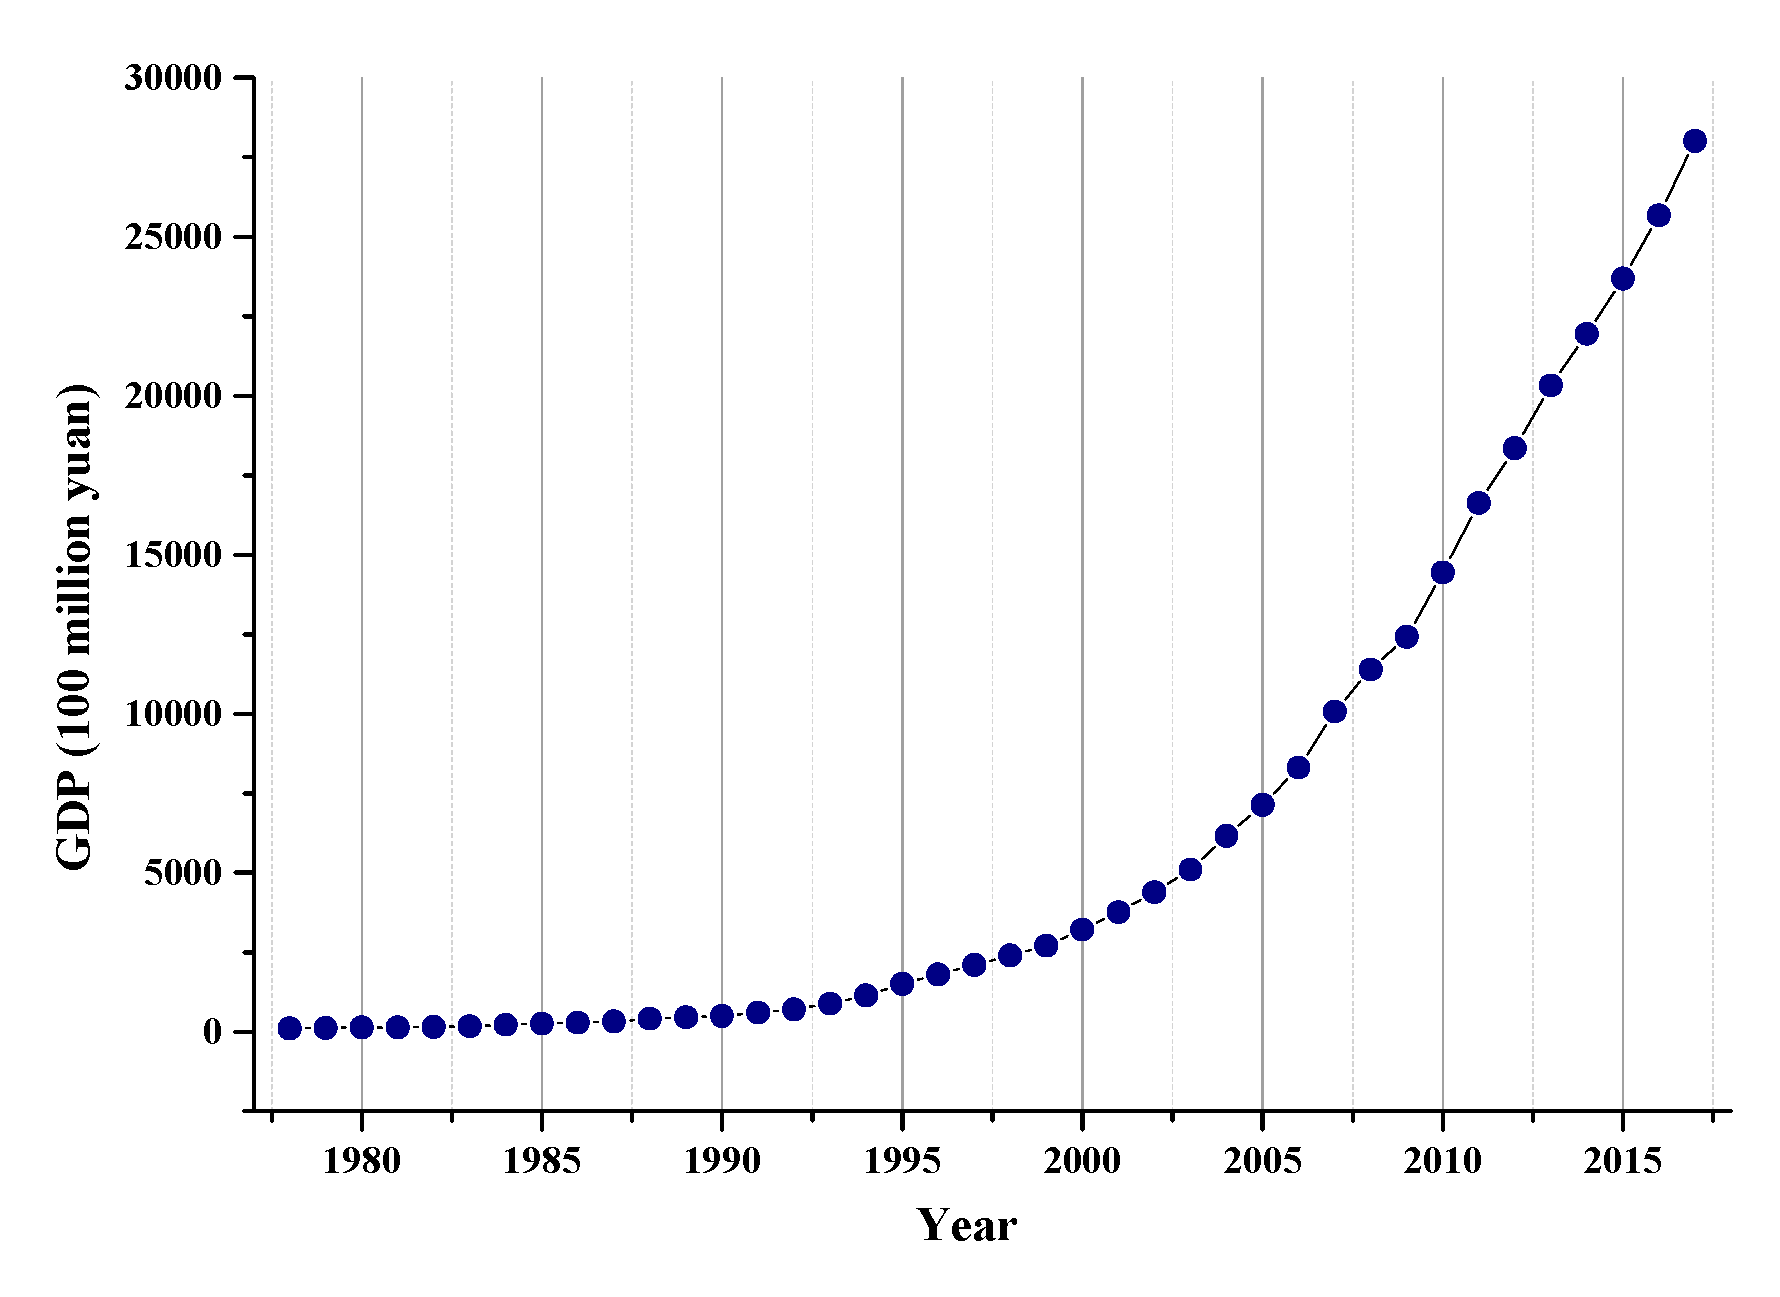
4.1. Study Area and Data Sources

This paper selects Beijing, the capital of China, for empirical research. On the one hand, since the reform and opening up in 1978, Beijing has achieved rapid development. As shown in Figure 7 and Figure 8, the resident population increased from 8.715 million to 21.707 million in 1978–2017, and the GDP increased from 10.88 billion yuan to 2801.49 billion yuan in 1978–2017. Beijing faces severe conflicts in population, resources and environment in its development. It is very important to place ECC in a prominent position in Beijing’s development. On the other hand, the Beijing municipal government has actively promoted the EPGD through some measures for the past few years, such as implementing the “coal-to-electricity” project to promote electric heating and encouraging the development of electric vehicles, and achieved some results. Studying the coupling coordination relationship of EPGD and ECC in Beijing is conducive to clarifying the development process and current situation of the EPGD and the ECC in Beijing, as well as clarifying the focus of work and proposing suggestions for the next development.
The data mainly come from Beijing Statistical Yearbook [58], China Electric Power Yearbook [59], China Energy Statistical Yearbook [60] and literature. Consequently, the data used in this paper are credible.

4.2. Results and Discussion

4.2.1. Analysis of the Important Factors Based on Weight

Three experts were invited to form a decision-making committee, and all gave a judgment matrix. By Equations (6)–(9), the opinions of all experts are combined to get the group judgment matrix, as shown below. The group judgment matrix overall passed the consistency test.
(        G 1               G 2               G 3               G 1 ( 1.00 , 0.00 , 0.00 ) ( 2.33 , 0.59 , 0.18 ) ( 1.33 , 0.57 , 0.16 ) G 2 ( 0.44 , 0.14 , 0.04 ) ( 1.00 , 0.00 , 0.00 ) ( 0.50 , 0.18 , 0.05 ) G 3 ( 0.83 , 0.38 , 0.11 ) ( 2.00 , 0.71 , 0.20 ) ( 1.00 , 0.00 , 0.00 ) ) C I = 0.0248 ; C R = 0.0427
(        G 11               G 12               G 13               G 14               G 15               G 11 ( 1.00 , 0.00 , 0.00 ) ( 0.83 , 0.38 , 0.11 ) ( 3.67 , 0.44 , 0.13 ) ( 2.33 , 0.59 , 0.18 ) ( 4.00 , 0.53 , 0.16 ) G 12 ( 1.33 , 0.57 , 0.16 ) ( 1.00 , 0.00 , 0.00 ) ( 4.00 , 0.53 , 0.16 ) ( 2.33 , 0.59 , 0.18 ) ( 4.00 , 0.53 , 0.16 ) G 13 ( 0.29 , 0.04 , 0.01 ) ( 0.26 , 0.04 , 0.01 ) ( 1.00 , 0.00 , 0.00 ) ( 0.36 , 0.11 , 0.03 ) ( 1.17 , 0.55 , 0.14 ) G 14 ( 0.44 , 0.14 , 0.04 ) ( 0.44 , 0.14 , 0.04 ) ( 3.00 , 0.62 , 0.18 ) ( 1.00 , 0.00 , 0.00 ) ( 3.33 , 0.71 , 0.20 ) G 15 ( 0.26 , 0.04 , 0.01 ) ( 0.26 , 0.04 , 0.01 ) ( 1.17 , 0.55 , 0.14 ) ( 0.33 , 0.11 , 0.03 ) ( 1.00 , 0.00 , 0.00 ) ) C I = 0.0611 ; C R = 0.0546
(        G 21               G 22               G 23               G 21 ( 1.00 , 0.00 , 0.00 ) ( 0.67 , 0.31 , 0.08 ) ( 2.33 , 0.59 , 0.18 ) G 22 ( 1.67 , 0.65 , 0.18 ) ( 1.00 , 0.00 , 0.00 ) ( 3.67 , 0.58 , 0.18 ) G 23 ( 0.44 , 0.14 , 0.04 ) ( 0.32 , 0.11 , 0.03 ) ( 1.00 , 0.00 , 0.00 ) ) C I = 0.0503 ; C R = 0.0868
(        G 31               G 32               G 33               G 34               G 35               G 31 ( 1.00 , 0.00 , 0.00 ) ( 2.00 , 0.71 , 0.20 ) ( 3.00 , 0.44 , 0.13 ) ( 3.33 , 0.55 , 0.16 ) ( 2.67 , 0.50 , 0.16 ) G 32 ( 0.50 , 0.18 , 0.05 ) ( 1.00 , 0.00 , 0.00 ) ( 2.33 , 0.59 , 0.18 ) ( 2.33 , 0.59 , 0.18 ) ( 1.67 , 0.65 , 0.18 ) G 33 ( 0.33 , 0.05 , 0.01 ) ( 0.44 , 0.14 , 0.04 ) ( 1.00 , 0.00 , 0.00 ) ( 0.83 , 0.38 , 0.11 ) ( 0.67 , 0.31 , 0.08 ) G 34 ( 0.31 , 0.05 , 0.01 ) ( 0.44 , 0.14 , 0.04 ) ( 1.33 , 0.57 , 0.16 ) ( 1.00 , 0.00 , 0.00 ) ( 0.67 , 0.31 , 0.08 ) G 35 ( 0.39 , 0.10 , 0.03 ) ( 0.67 , 0.31 , 0.08 ) ( 1.67 , 0.65 , 0.18 ) ( 1.67 , 0.65 , 0.18 ) ( 1.00 , 0.00 , 0.00 ) ) C I = 0.0354 ; C R = 0.0316
(        E 1               E 2               E 3               E 4               E 1 ( 1.00 , 0.00 , 0.00 ) ( 0.44 , 0.14 , 0.04 ) ( 1.67 , 0.65 , 0.18 ) ( 0.50 , 0.18 , 0.05 ) E 2 ( 2.33 , 0.59 , 0.18 ) ( 1.00 , 0.00 , 0.00 ) ( 3.00 , 0.62 , 0.18 ) ( 1.33 , 0.57 , 0.16 ) E 3 ( 0.67 , 0.31 , 0.08 ) ( 0.36 , 0.11 , 0.03 ) ( 1.00 , 0.00 , 0.00 ) ( 0.39 , 0.10 , 0.03 ) E 4 ( 2.00 , 0.71 , 0.20 ) ( 0.83 , 0.38 , 0.11 ) ( 2.67 , 0.50 , 0.16 ) ( 1.00 , 0.00 , 0.00 ) ) C I = 0.0335 ; C R = 0.0372
(        E 11               E 12               E 13               E 14               E 11 ( 1.00 , 0.00 , 0.00 ) ( 2.00 , 0.53 , 0.16 ) ( 0.39 , 0.10 , 0.03 ) ( 0.29 , 0.04 , 0.01 ) E 12 ( 0.61 , 0.30 , 0.08 ) ( 1.00 , 0.00 , 0.00 ) ( 0.29 , 0.04 , 0.01 ) ( 0.22 , 0.03 , 0.01 ) E 13 ( 2.67 , 0.50 , 0.16 ) ( 3.67 , 0.44 , 0.13 ) ( 1.00 , 0.00 , 0.00 ) ( 0.83 , 0.38 , 0.11 ) E 14 ( 3.67 , 0.44 , 0.13 ) ( 4.67 , 0.51 , 0.16 ) ( 1.33 , 0.57 , 0.16 ) ( 1.00 , 0.00 , 0.00 ) ) C I = 0.0447 ; C R = 0.0497
(        E 21               E 22               E 23               E 24               E 25               E 26               E 21 ( 1.00 , 0.00 , 0.00 ) ( 1.67 , 0.65 , 0.18 ) ( 1.67 , 0.65 , 0.18 ) ( 2.67 , 0.50 , 0.16 ) ( 2.67 , 0.50 , 0.16 ) ( 0.50 , 0.18 , 0.05 ) E 22 ( 0.67 , 0.31 , 0.08 ) ( 1.00 , 0.00 , 0.00 ) ( 1.33 , 0.57 , 0.16 ) ( 2.33 , 0.59 , 0.18 ) ( 2.33 , 0.59 , 0.18 ) ( 0.39 , 0.10 , 0.03 ) E 23 ( 0.67 , 0.31 , 0.08 ) ( 0.83 , 0.38 , 0.11 ) ( 1.00 , 0.00 , 0.00 ) ( 2.00 , 0.71 , 0.20 ) ( 2.00 , 0.71 , 0.20 ) ( 0.36 , 0.11 , 0.03 ) E 24 ( 0.39 , 0.10 , 0.03 ) ( 0.44 , 0.14 , 0.04 ) ( 0.50 , 0.18 , 0.05 ) ( 1.00 , 0.00 , 0.00 ) ( 1.83 , 0.51 , 0.14 ) ( 0.26 , 0.04 , 0.01 ) E 25 ( 0.39 , 0.10 , 0.03 ) ( 0.44 , 0.14 , 0.04 ) ( 0.50 , 0.18 , 0.05 ) ( 0.94 , 0.54 , 0.12 ) ( 1.00 , 0.00 , 0.00 ) ( 0.26 , 0.04 , 0.01 ) E 26 ( 2.00 , 0.71 , 0.20 ) ( 2.67 , 0.50 , 0.16 ) ( 3.00 , 0.62 , 0.18 ) ( 4.00 , 0.53 , 0.16 ) ( 4.00 , 0.53 , 0.16 ) ( 1.00 , 0.00 , 0.00 ) ) C I = 0.0542 ; C R = 0.0437
(        E 31               E 32               E 33               E 34               E 35               E 31 ( 1.00 , 0.00 , 0.00 ) ( 2.17 , 0.42 , 0.11 ) ( 6.00 , 0.50 , 0.16 ) ( 4.67 , 0.55 , 0.16 ) ( 4.00 , 0.48 , 0.16 ) E 32 ( 0.89 , 0.54 , 0.12 ) ( 1.00 , 0.00 , 0.00 ) ( 5.33 , 0.54 , 0.16 ) ( 4.00 , 0.53 , 0.16 ) ( 3.00 , 0.44 , 0.13 ) E 33 ( 0.18 , 0.03 , 0.01 ) ( 0.19 , 0.02 , 0.01 ) ( 1.00 , 0.00 , 0.00 ) ( 0.44 , 0.14 , 0.04 ) ( 0.34 , 0.10 , 0.03 ) E 34 ( 0.23 , 0.03 , 0.01 ) ( 0.26 , 0.04 , 0.01 ) ( 2.33 , 0.59 , 0.18 ) ( 1.00 , 0.00 , 0.00 ) ( 0.61 , 0.30 , 0.08 ) E 35 ( 0.30 , 0.11 , 0.03 ) ( 0.33 , 0.05 , 0.01 ) ( 3.33 , 0.49 , 0.16 ) ( 2.00 , 0.53 , 0.16 ) ( 1.00 , 0.00 , 0.00 ) ) C I = 0.1007 ; C R = 0.0899
(        E 41               E 42               E 43               E 44               E 45               E 41 ( 1.00 , 0.00 , 0.00 ) ( 2.00 , 0.71 , 0.20 ) ( 0.67 , 0.31 , 0.08 ) ( 3.33 , 0.55 , 0.16 ) ( 2.67 , 0.50 , 0.16 ) E 42 ( 0.50 , 0.18 , 0.05 ) ( 1.00 , 0.00 , 0.00 ) ( 0.44 , 0.14 , 0.04 ) ( 2.33 , 0.59 , 0.18 ) ( 2.00 , 0.71 , 0.20 ) E 43 ( 1.67 , 0.65 , 0.18 ) ( 2.33 , 0.59 , 0.18 ) ( 1.00 , 0.00 , 0.00 ) ( 4.00 , 0.53 , 0.16 ) ( 3.33 , 0.55 , 0.16 ) E 44 ( 0.31 , 0.05 , 0.01 ) ( 0.44 , 0.14 , 0.04 ) ( 0.26 , 0.04 , 0.01 ) ( 1.00 , 0.00 , 0.00 ) ( 0.67 , 0.31 , 0.08 ) E 45 ( 0.39 , 0.10 , 0.03 ) ( 0.50 , 0.18 , 0.05 ) ( 0.31 , 0.05 , 0.01 ) ( 1.67 , 0.65 , 0.18 ) ( 1.00 , 0.00 , 0.00 ) ) C I = 0.0302 ; C R = 0.0269
According to Equations (11)–(16), the final weights of the indicators in the EPGD subsystem and ECC subsystem are shown in Table 5 and Table 6, respectively.
Indicators are sorted according to the expectation, entropy and hyper entropy in the weight vector. For the first-class indicators, there are G1 > G3 > G2 and E2 > E4 > E1 > E3. The ranking of the second-class indicators is shown in Figure 9 and Figure 10. The five most important indicators in the EPGD subsystem are G12 > G31 > G11 > G22 > G32, distributed in G1, G2 and G3. The five most important indicators in the ECC subsystem are E26 > E43 > E41 > E21 > E14, distributed in E1, E2 and E4. “Proportion of clean energy power generation (G12)” refers to the proportion of power generation other than thermal power in total power generation. It is closely related to resource use and pollutant emissions in the power generation process and is the most important indicator for EPGD. “Proportion of energy saving and environmental protection expenditure (E26)” refers to the proportion of energy conservation and environmental protection expenditure in general public budget. This indicator reflects the government’s emphasis on the entire environmental protection business including multiple fields, and is the most important indicator for ECC.

4.2.2. Analysis of the CCD between the EPGD and the ECC

The performance of indicators at all levels and the CCD is shown in Figure 11, Figure 12, Figure 13, Figure 14, Figure 15, Figure 16, Figure 17, Figure 18, Figure 19, Figure 20, Figure 21 and Figure 22. The comprehensive level of indicators shown in the figures is the value of the standardized value multiplied by the weight.

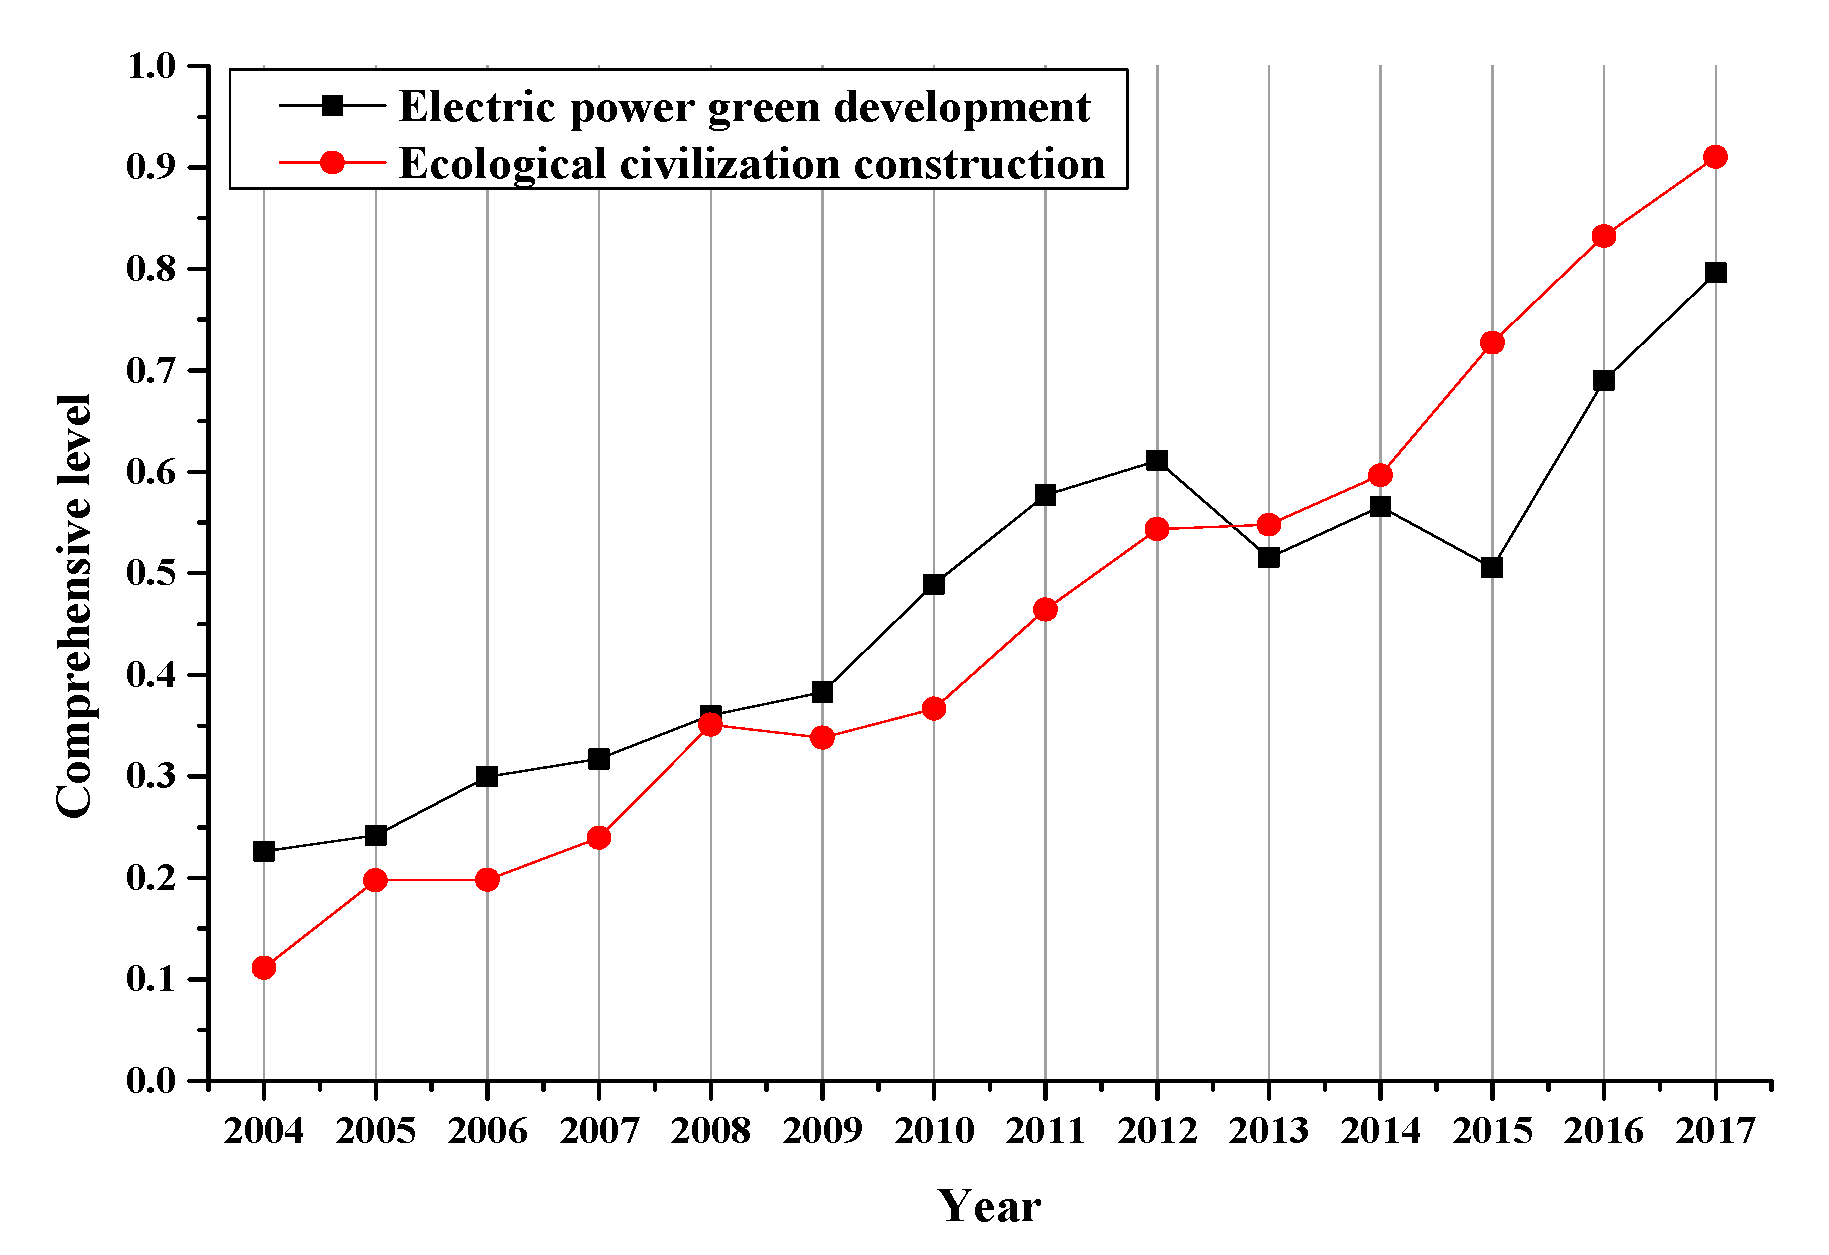
Comprehensive Evaluation of EPGD

From the perspective of the EPGD subsystem, as shown in Figure 11, its comprehensive level rose from 0.2261 to 0.7961 in 2004–2017, showing an upward trend. Among them, it kept growing from 2004 to 2012, fluctuated from 2012 to 2015, and continued to grow at a faster rate from 2015 to 2017.
Judging from the first-class indicators, as shown in Figure 12, Figure 13 and Figure 14, the assessment value of the power-generation-side green development fluctuated greatly from 2004 to 2017, and it showed a slight upward trend as a whole. The assessment value of the grid-side green development showed an overall upward trend with some fluctuations of 2007–2009 and 2013–2015. The assessment value of the user-side green development increased year by year. The three first-level indicators continued to grow from 2015 to 2017.
As for the second-class indicators, as shown in Figure 12, Figure 13 and Figure 14, from 2004 to 2017, the indicators showing an overall upward trend include G12, G14, G21, G22, G23, G31, G32, G33, G34 and G35; only G11, G13 and G15 showed a downward trend as a whole. The indicators of sustained growth from 2015 to 2017 include G12, G13, G14, G22, G23, G31, G32, G34 and G35.
From 2004 to 2017, especially in 2005–2017, the green development level of electric power in Beijing has been roundly and significantly improved. In contrast, the performance of power-generation-side green development (G1) is not satisfactory. Under index G1, as G11 and G15 showed an overall downward trend and declined in 2017, the proportion of clean energy installed capacity (G11) and the annual utilization hours of power generating equipment (G15) are identified as weak links. The government should pay special attention to the above two indicators.
Known from the calculation results, the proportion of clean energy installed capacity has decreased as a whole, while the proportion of clean energy power generation has increased overall. This shows that the annual utilization hours of clean energy power generating equipment were increased compared to thermal power. However, the annual utilization hours of total power generating equipment were reduced, which indicates that the annual utilization hours of thermal power equipment were reduced at a relatively rapid rate. In other words, the utilization efficiency of thermal power equipment is low. At present, Beijing has entered the era of coal-free power generation. The four major coal-fired thermal power centers in Beijing have been replaced by the four major gas-fired thermal power centers. Due to the high natural gas prices, many gas-fired thermal power plants are not fully operating. This is the main reason for the inefficient use of gas-fired thermal power plants, that is, the main reason for the poor performance of G15.

Comprehensive Evaluation of ECC

From the perspective of the ECC subsystem, as shown in Figure 15, except for a slight decrease in 2009, its comprehensive level increased from 0.1114 to 0.9103 in 2004–2017.
From the perspective of the first-class indicators, as shown in Figure 16, Figure 17, Figure 18 and Figure 19, the evaluation value of ecological resources fluctuated greatly from 2004 to 2017 and it showed a downward trend as a whole. The evaluation value of the ecological environment showed an upward trend. The evaluation values of the ecological economy and ecological society increased year by year.
From the perspective of second-class indicators, as shown in Figure 16, Figure 17, Figure 18 and Figure 19, the indicators showing a downward trend overall from 2004 to 2017 were only E13 and E14. The other indicators were on the rise as a whole.
From 2004 to 2017, the comprehensive level of ECC in Beijing improved significantly. In contrast, the performance of ecological resources (E1) is poor. Under index E1, the performance of water resources per capita (E13) and forest area per capita (E14) is relatively unsatisfactory. Therefore, the Beijing municipal government should further protect water resources and improve the forest coverage rate, particularly.

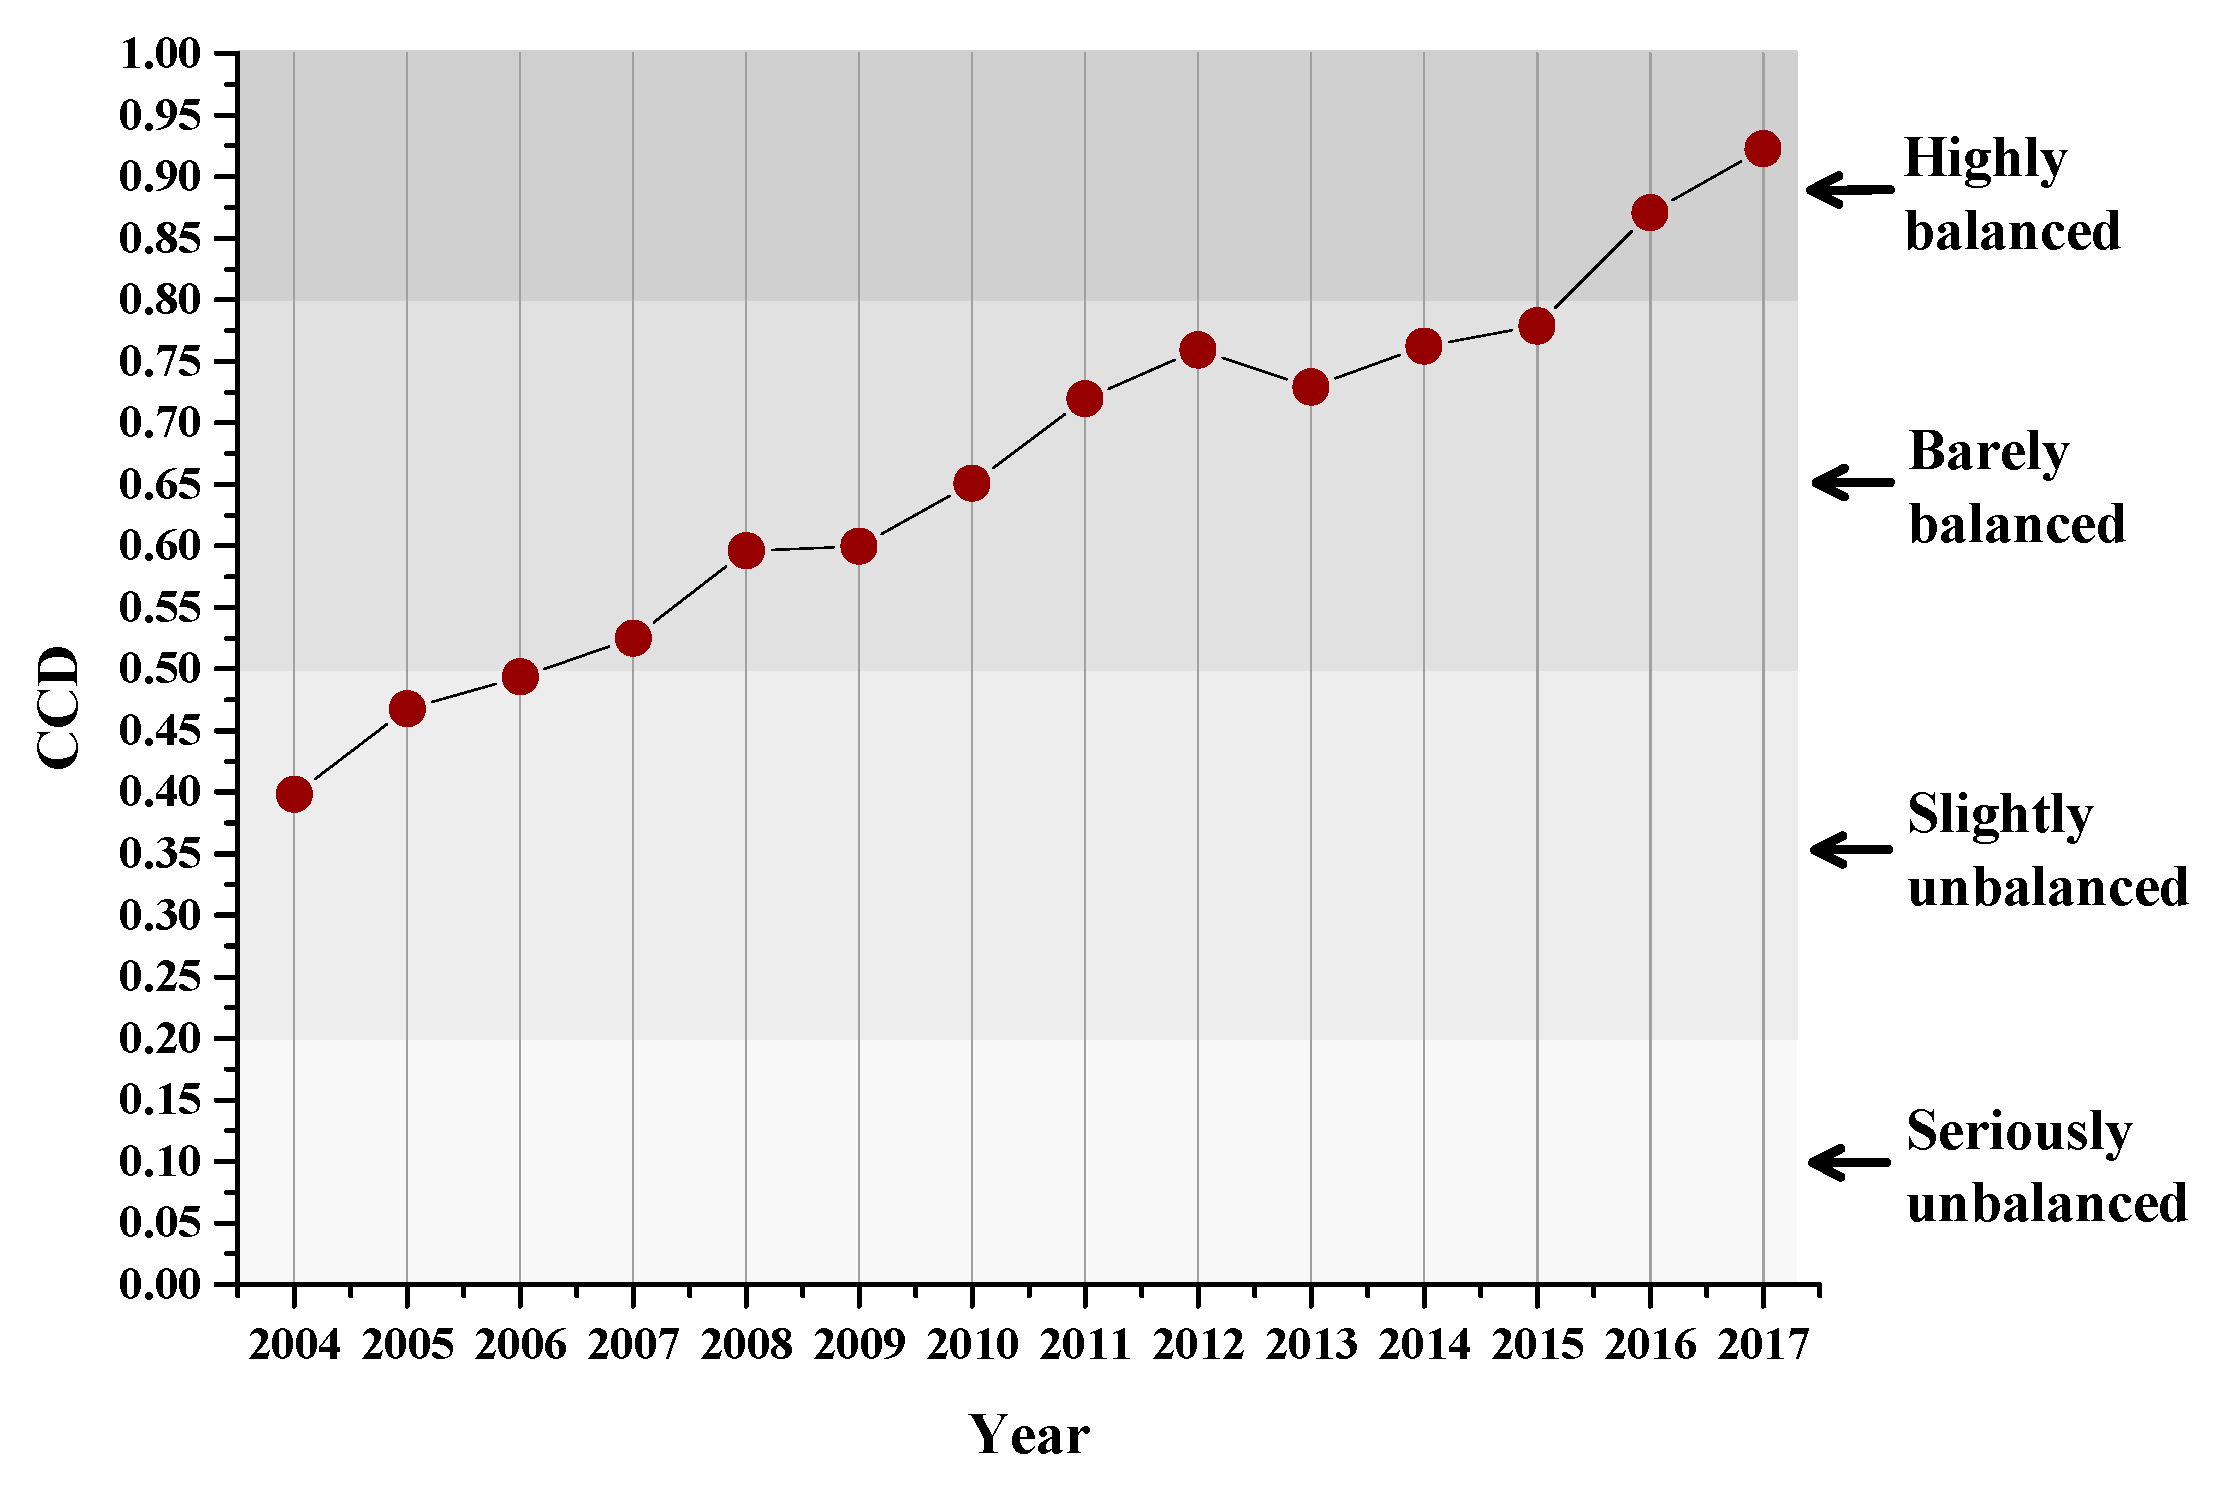
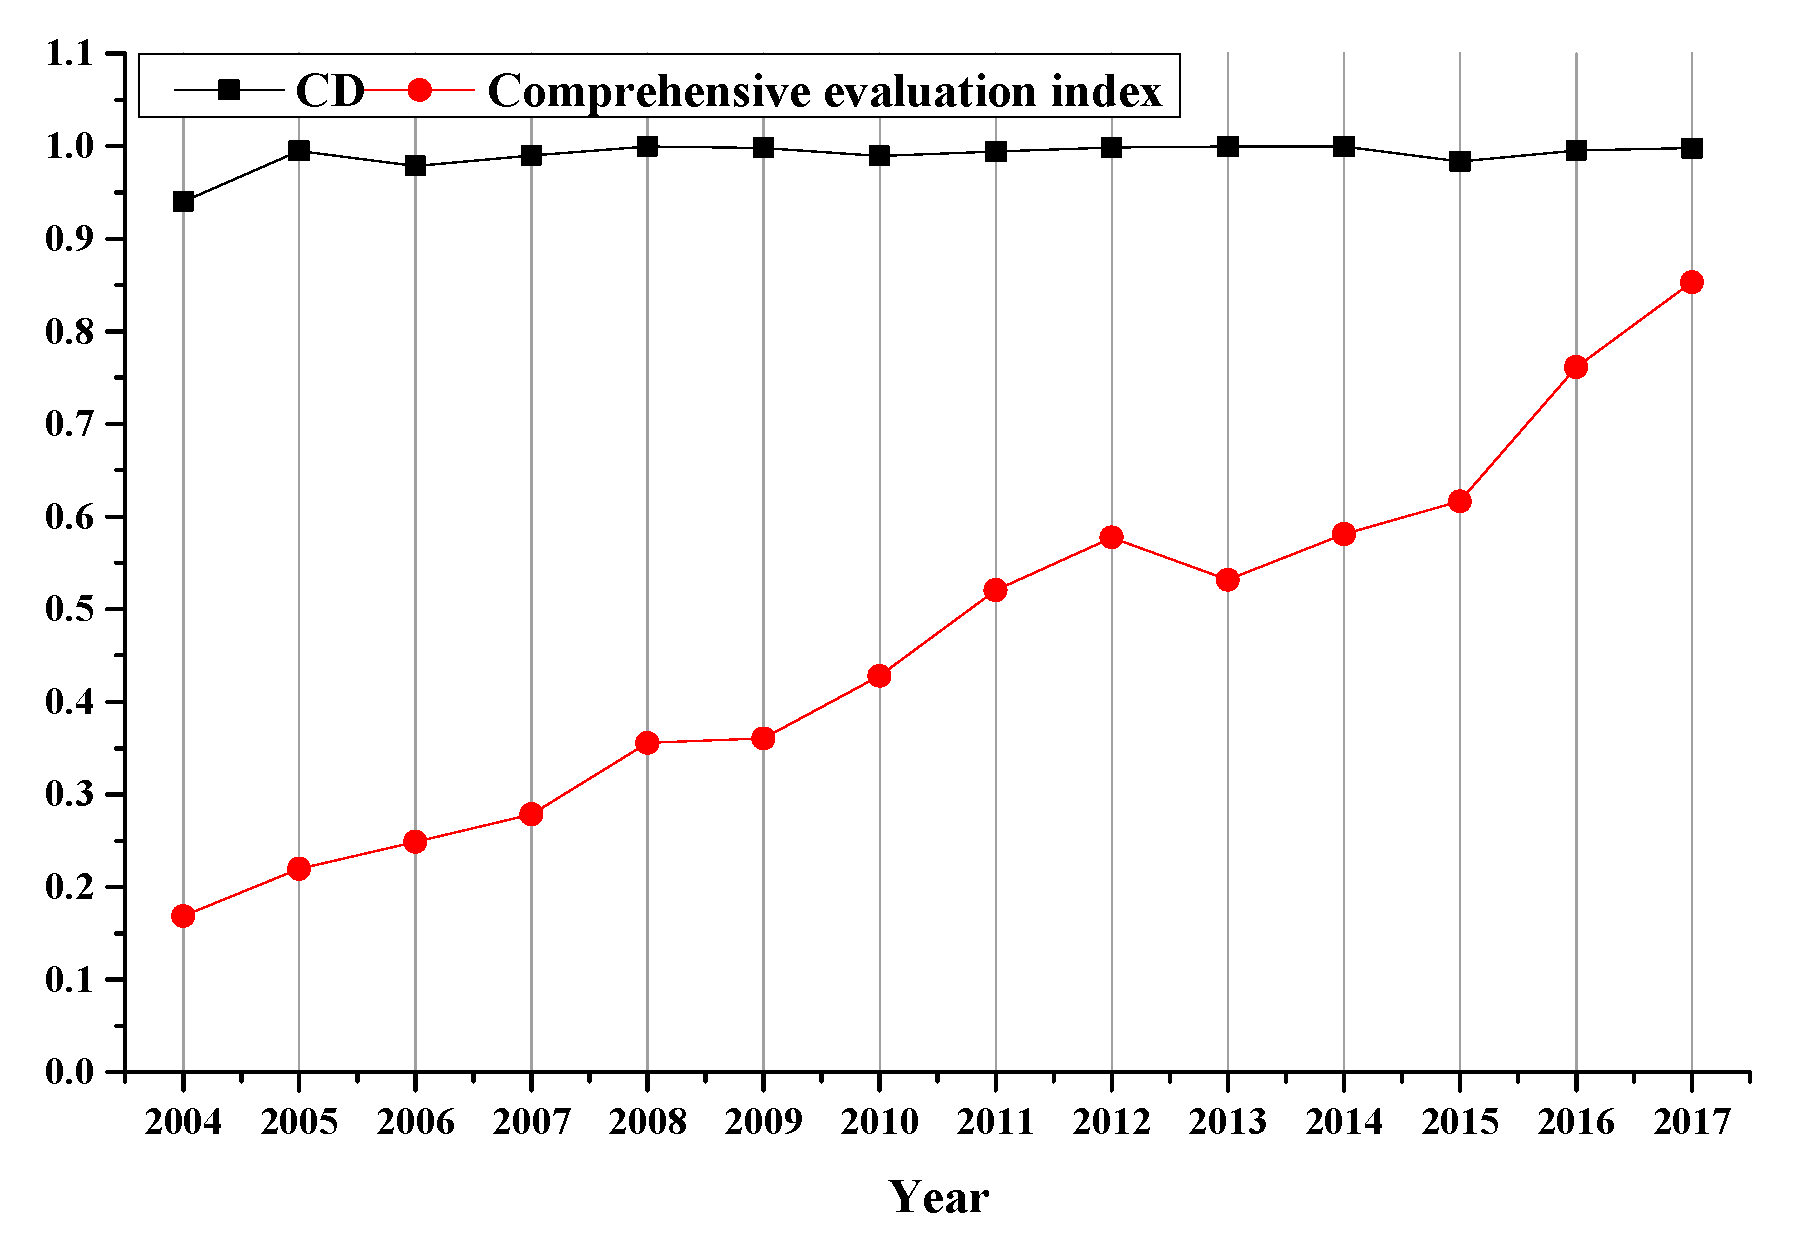
Performance of CCD Between EPGD and ECC

As shown in Figure 20, in Beijing, the coupling coordination relationship between EPGD and ECC has experienced three stages in 2004–2017: from “slightly unbalanced” to “highly balanced”, which was not in the stage of “seriously unbalanced”. As shown in Figure 21, the CD of EPGD and ECC has always maintained a high state, showing that the interaction degree between EPGD and ECC is high. Because the comprehensive evaluation index ( T ) has experienced a change from 0.1687 to 0.8532, the CCD has also changed from low to high, which shows that the two subsystems are promoting each other and developing together. Figure 22 compares the comprehensive levels of the two subsystems.
1.
2004–2006: the two subsystems were in the “slightly unbalanced” stage. At this stage, the comprehensive level of EPGD was higher than the comprehensive level of ECC, so the two subsystems were in a slightly unbalanced phase with lagging ECC.
At this stage, the goal of ECC has not been formally put forward, and the government attached less importance to the ECC. However, the development of clean energy was better, the proportion of clean energy installed capacity and the power generation equipment utilization efficiency were higher, so the level of EPGD was better than the ECC as a whole.
2.
2007–2015: the two subsystems entered the “barely balanced” stage. From 2007 to 2012, the comprehensive level of EPGD was greater than that of ECC, so the two subsystems were in a barely balanced stage with lagging ECC. From 2013 to 2015, the comprehensive level of ECC was greater than that of EPGD. So, the two subsystems were in a barely balanced stage with lagging EPGD.
In 2007, the Party’s Seventeenth Congress Report formally proposed the goal of ECC [61], and the level of ECC continued to rise. The EPGD showed a slight downward trend with fluctuations in 2012–2015, mainly due to the continuous decline in the level of the power-generation-side green development. Therefore, the level of ECC has surpassed the EPGD since 2013.
3.
2016–2017: The two subsystems achieved the “highly balanced” status. At this stage, the comprehensive level of ECC was greater than that of EPGD, so the two subsystems were in a highly balanced phase with lagging EPGD.
In 2016, as the Beijing municipal government vigorously promoted the implementation of electric vehicle projects and integrated energy systems, the comprehensive level of EPGD began to rise at a rapid rate after a period of downturn. However, it still lagged behind the ECC. In recent years, with the ECC, clean-power-generation substitution on the power generation side and electric power substitution on the user side have been paid increasing attention, it is expected that the two systems will continue to develop in a coordinated and rapid manner in Beijing.

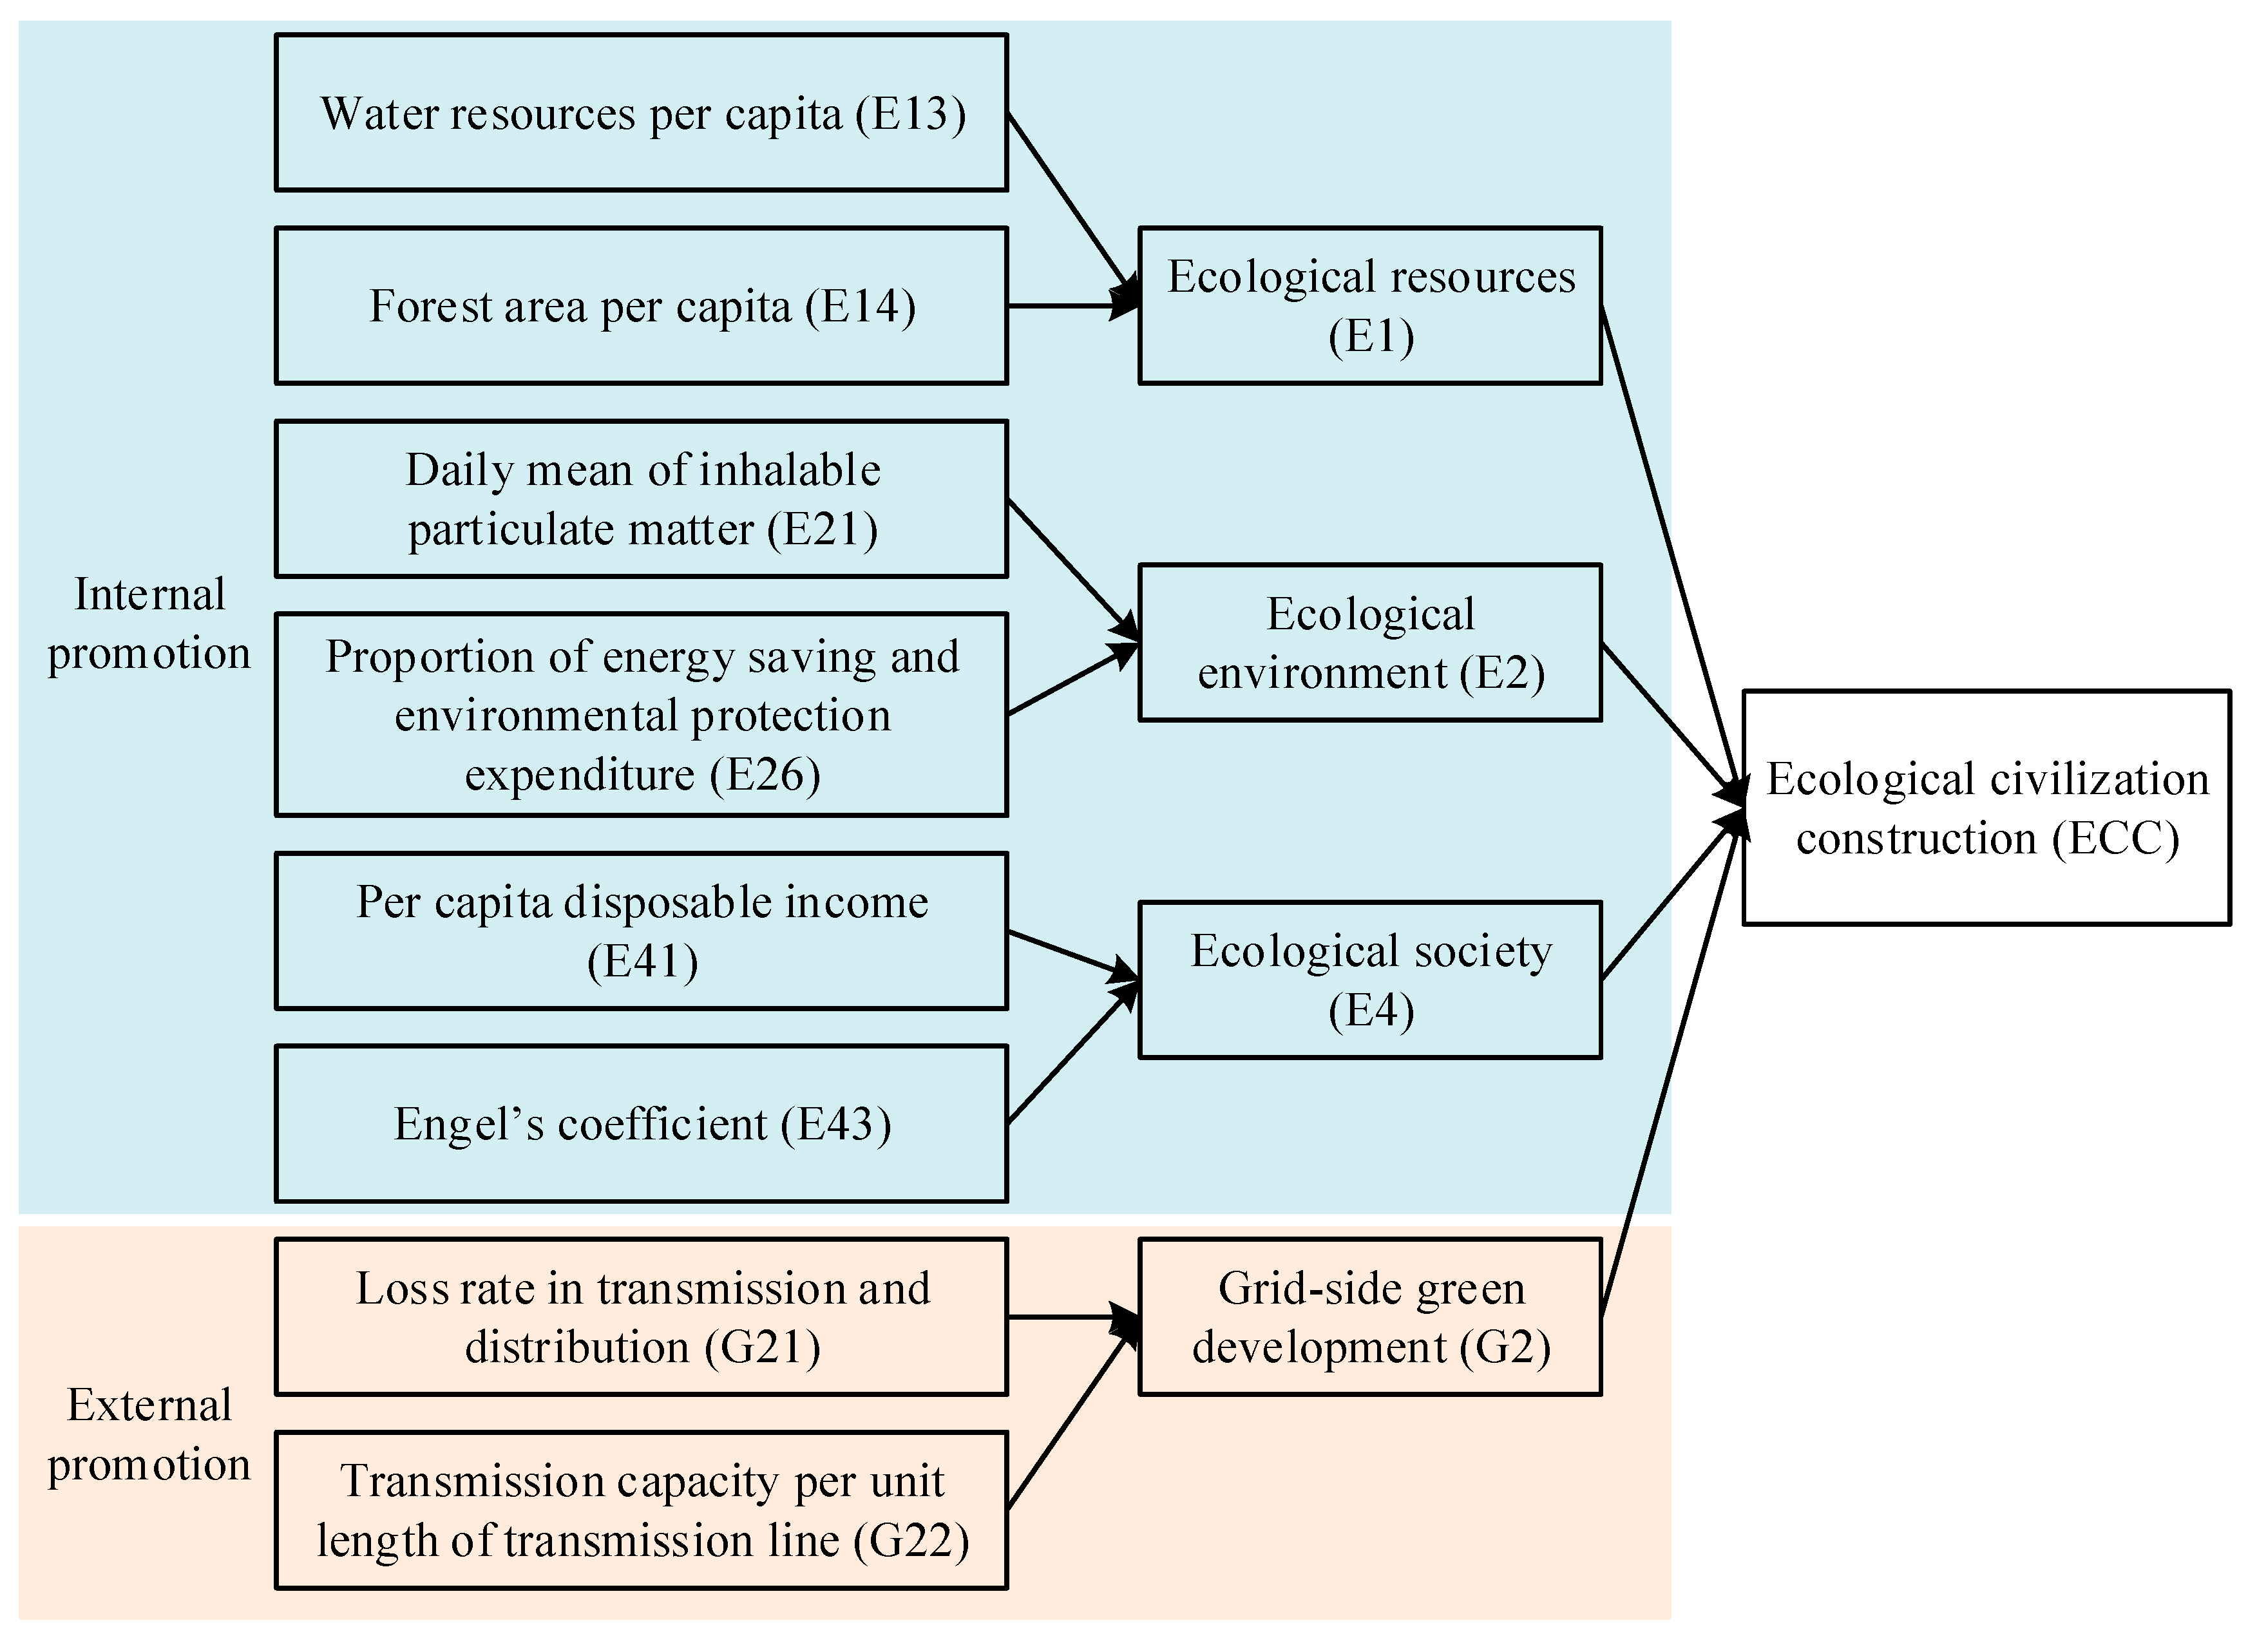
4.2.3. Analysis of the Important Factors According to the Regression Analysis

The influence relationship between one subsystem and the first-level indicators of the other subsystem is analyzed quantitatively by the linear regression model. As shown in Figure 23b,c and Figure 24b,d, the minimum R 2 of the regression equation is 0.8464, and all of them pass the significance test, indicating that the regression effect is desirable.

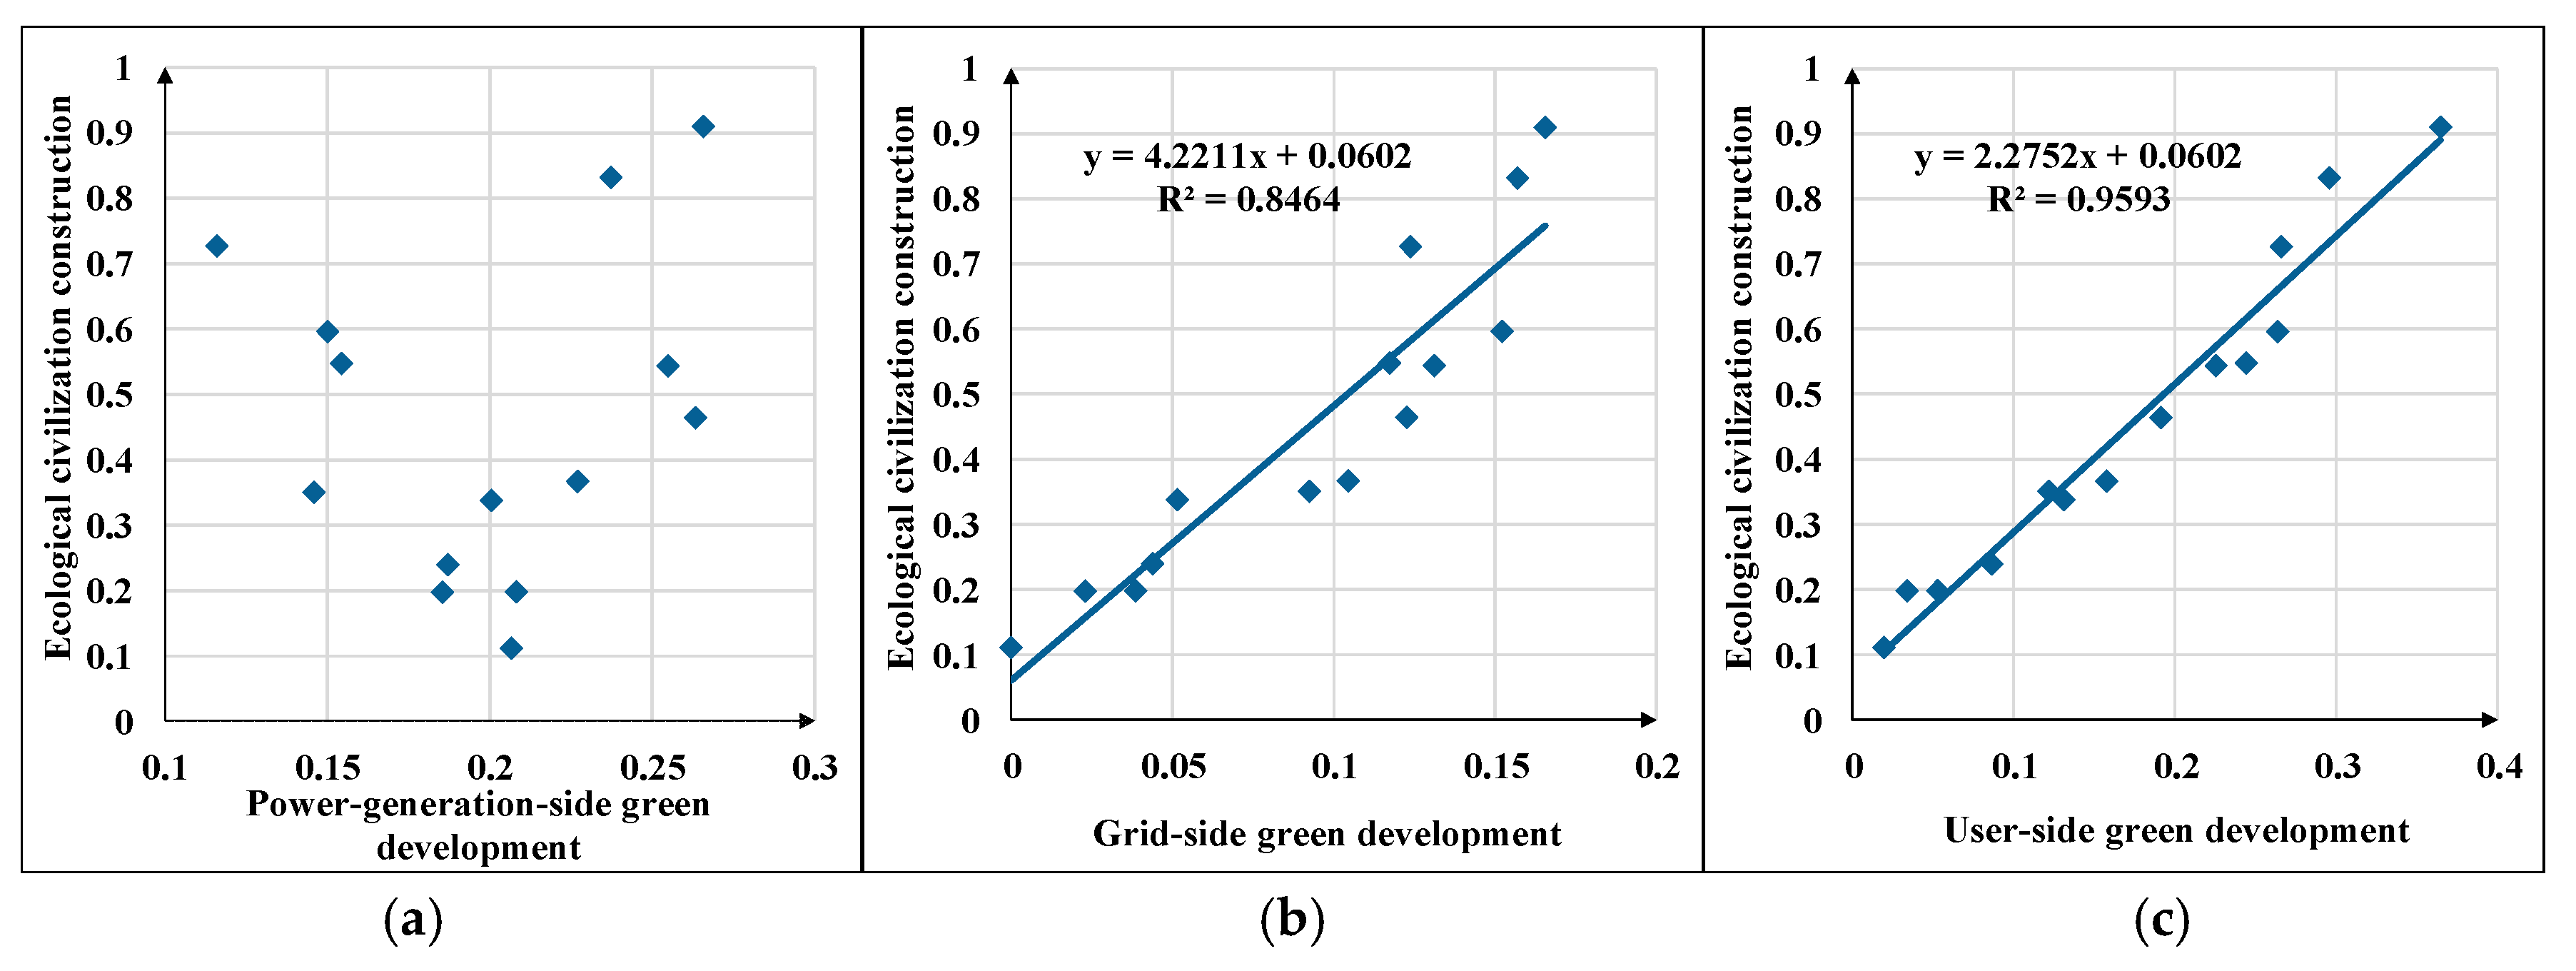
Impact of First-Class Indicators of EPGD on ECC

As shown in Figure 23, the regression coefficient of grid-side green development and ECC (4.2211) was the largest, the regression coefficient of user-side green development and ECC (2.2752) was the smallest, and there was no obvious regression relationship between the power-generation-side green development and ECC. Therefore, in the EPGD subsystem, grid-side green development is the factor that has the biggest impact on the ECC.
Under the grid-side green development, the index with the greatest weight is the transmission capacity per unit length of transmission line, which mainly reflects the transmission capacity of the grid. The grid connects electricity production and power consumption. Both clean energy generation and clean energy consumption are inseparable from efficient power grids. For example, the promotion of “coal-to-electricity” not only affects people’s heating in winter, but also affects environmental quality. People’s living standards and environmental quality both are important contents of ECC, so “coal-to-electricity” has a great influence on ECC. Simultaneously, the supporting construction of power grids plays a key role when implementing the “coal-to-electricity” projects. Therefore, comprehensively improving the power transmission capacity and promoting the grid-side green development are significant measures to upgrade the level of ECC.

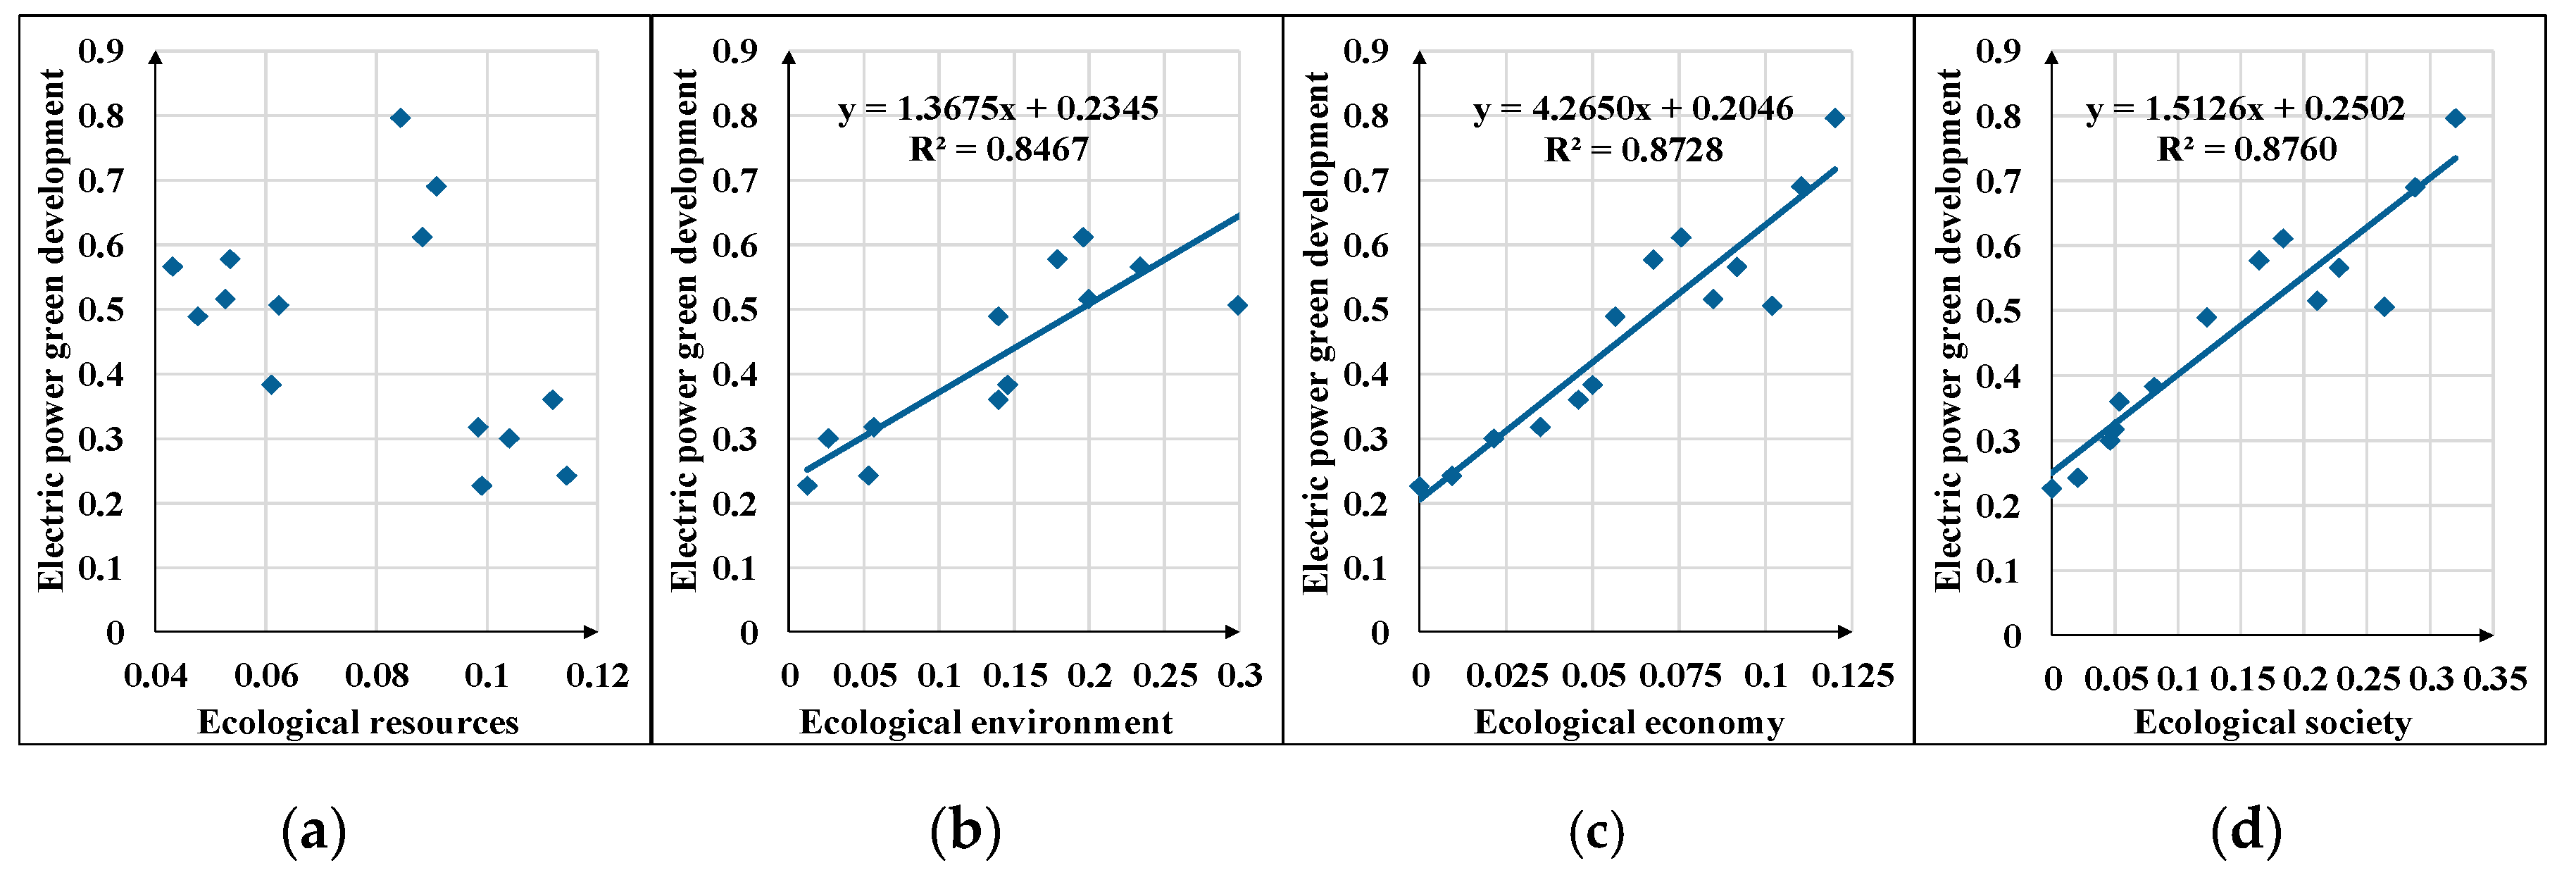
The Influence of the First-Class Index of ECC on EPGD

As shown in Figure 24, the regression coefficient of ecological economy and EPGD (4.2650) was the largest, the regression coefficient of ecological society and EPGD (1.5126) was the second-largest, and the regression coefficient of ecological environment and EPGD (1.3675) was the smallest. Ecological resources and EPGD had no obvious regression. Therefore, in the ECC subsystem, the ecological economy has the greatest impact on the EPGD.
In the ecological economy, the top two indicators with the greatest weight are the regional GDP per capita and the proportion of the added value of the tertiary industry. The production, transmission, and sales links of the electric power industry are all affected by economic conditions. First, economic development is conducive to expanding investment in power infrastructure construction and promoting the development and consumption of clean energy. Second, economic development can drive the level of power consumption. In addition, the development of electric vehicles, shore power and other industries can also promote the proportion of terminal electricity consumption. Finally, the development of the tertiary industry can bring about the development of technologies such as computers and information transmission, which is conducive to promoting EPGD through technological innovation. Therefore, ecological economic development is closely related to the green development of the power generation side, grid side and user side.

4.3. Policy Suggestion

According to the above analysis, CCD ( D ) is determined by CD ( C ) and the comprehensive evaluation index ( T ). From 2004 to 2017, the CD of EPGD and ECC has been kept at a high level, so the key to further improving the CCD of the two subsystems is to enhance the comprehensive evaluation index ( T ). Based on the weight analysis, CCD analysis and regression analysis, the indicators with larger weight, poorer performance and greater impact on the other party in the development of EPGD and ECC are identified, and recommendations are put forward.

4.3.1. Suggestions on Promoting EPGD

In the EPGD subsystem, the top five weighted indicators are G11, G12, G22, G31 and G32; the weak links are G11 and G15. The important factor affecting the EPGD in the ECC subsystem is E3, in which E31 and E32 are more weighted. The main paths to promote EPGD in the future are shown in Figure 25.
• Internal promotion paths
The government should focus on improving the proportion of clean energy installed capacity (G11), proportion of clean energy power generation (G12), annual utilization hours of power generating equipment (G15), transmission capacity per unit length of transmission line (G22), electricity proportion in energy consumption of terminal (G31), and electricity consumption per capita (G32), so as to promote the green development of the power generation side (G1), grid side (G2), and user side (G3). Finally, the performance of EPGD will be enhanced.
There are relatively few clean energy sources that can be developed on a large scale in Beijing, so G11 could be improved by developing distributed energy. It is possible to promote the complementary use of multiple energy sources through integrated energy systems, such as the complementation of daytime photovoltaic and nighttime wind power, thereby increasing G12. According to the analysis in Section 4.2.2, the main reason for the poor performance of G15 is high natural gas prices, leading to high costs of natural gas power generation. Beijing has not yet issued a clear subsidy policy document for natural gas power generation. Therefore, the Beijing municipal government should further improve the financial subsidy policy for gas power plants, so as to promote the purchase of natural gas and encourage the gas power plant to increase the power generation, thereby increasing the utilization of existing gas power plants and improving G15.
The government should coordinate the planning of the power generation side, grid side and user side so that the generated electricity can be efficiently delivered to the users. On the one hand, this is conducive to making full use of the grid, thereby increasing G22. On the other hand, this is conducive to promoting the use of electricity at the terminal, thus improving G31 and G32. In addition, the substitution of coal by electricity and substitution of oil by electricity can be implemented in the fields of industrial production, transportation and residents’ lives to promote the replacement of other energy by electricity, thereby improving G31 and G32.
• External promotion paths
The government should take measures to improve the regional GDP per capita (E31) and proportion of the added value of the tertiary industry (E32), so as to promote the construction of ecological economy (E3), and further facilitate the EPGD from the outside.
For example, it is possible to increase E31 by accelerating urbanization, expanding the areas of openness to private capital, and increasing people’s income, which is conducive to expanding investment in power infrastructure construction, thereby boosting the level of power consumption. Emphasis should also be placed on the development of tertiary industries such as transportation, computer services and electronic information (E32). On the one hand, it is possible to increase the proportion of final electricity consumption based on industries such as electric vehicles and shore power. On the other hand, it can promote the intellectualization of electric power based on technological innovations such as computers and communications.

4.3.2. Suggestions on Promoting ECC

In the ECC subsystem, the top five weighted indicators are E14, E21, E26, E41 and E43; the weak links are E13 and E14. The important factor affecting the ECC in the EPGD subsystem is G2, in which G21 and G22 are more weighted. The main paths to promote ECC in the future are shown in Figure 26.
• Internal promotion paths
The government should focus on increasing the water resources per capita (E13), forest area per capita (E14), proportion of energy saving and environmental protection expenditure (E26), and per capita disposable income (E41). In addition, the daily mean of inhalable particulate matter (E21) and Engel’s coefficient (E43) should be reduced. Thus, the level of ecological resources (E1), ecological environment (E2) and ecological society (E4) can be improved. Finally, the performance of the ECC will be enhanced. Ecological civilization emphasizes the harmonious development of human and nature, and pays attention to the protection of resources, environment and human beings. Therefore, in this study, the weight of economic development is smaller compared with other aspects.
Beijing municipal government should further protect water resources (E13) by strengthening scientific and technological water-saving and rainwater utilization, etc., and improve the forest coverage rate (E14) by strengthening the return of farmland to forests and advancing afforestation projects. In this regard, the Beijing municipal government also issued supporting documents, such as Opinions on comprehensively promoting the construction of a water-saving society [62], and Master plan for a new round of one million mu afforestation project [63].
The government should control pollutant emissions from aspects such as industry, transportation and people’s lives, so as to reduce E21 and protect people’s health. It is also necessary to improve the fiscal policy for environmental protection, clarify environmental responsibilities and increase capital investment in energy conservation, pollution reduction, environmental monitoring, etc. (E26).
The government can improve E41 and E43 by broadening employment channels, promoting farmers’ income, improving employment subsidy policies, and regulating the labor market. In addition to a good employment situation, stable price levels and a sound social security system are also important factors in reducing E43.
• External promotion paths
The government should focus on reducing the loss rate in transmission and distribution (G21) and improving the transmission capacity per unit length of transmission line (G22), so as to promote the grid-side green development (G2), and further facilitate the ECC from the outside.
For example, G21 can be reduced by using energy-saving transformers and placing the power supply in the load center as much as possible. Furthermore, more attention should be paid to the rational planning of the load and layout of the power grid lines, so as to improve G21 and G22. In The key points of energy work of Beijing in 2018 [64], it is also emphasized to strengthen the power grid transmission and distribution capacity. The above measures can save costs and maximize the effectiveness of the grid, thereby bringing benefits to the ECC.

5. Conclusions

In recent years, the EPGD and the ECC have received increasing attention from the state and society. This paper constructs an evaluation index system of the coupling coordination relationship between EPGD and ECC, and combines the CCDM, improved AHP based on cloud model, and regression model to propose a coupling coordination relationship analysis model for EPGD and ECC. The model proposed in this paper can analyze the coupling coordination relationship between EPGD and ECC from the three aspects of weight, weakness and influencing factors. The improved AHP based on cloud model adopted in this paper can fully reflect the will of decision makers and effectively deal with the ambiguity and randomness of weight judgment.
Taking Beijing as an example, this paper puts forward development suggestions for EPGD and ECC. The results show that from 2004 to 2017, the CCD of EPGD and ECC in Beijing changed from “slightly unbalanced” to “highly balanced”. “Proportion of clean energy power generation” is the most weighted indicator of EPGD, and “Proportion of energy saving and environmental protection expenditure” is the most weighted indicator of ECC. The weak point of EPGD lies in the power generation side, and the weak point of ECC depends on ecological resources. The grid-side green development is the most influential factor for ECC in the EPGD subsystem, and the ecological economy is the most influential factor for EPGD in the ECC subsystem. This paper provides the policy-making basis for the Beijing municipal government. It also provides theoretical and methodological references for the research on the coordinated development of energy revolution and ECC in other countries.
This study has certain limitations. The evaluation index system in this study is relatively basic and universal, but the focus of ECC and EPGD in different countries and regions is different. Therefore, differentiated evaluation index systems of EPGD and ECC according to the characteristics of the region will be established in future research.

Author Contributions

Conceptualization, L.Z. and L.N.; methodology, J.C., M.Y. and L.N.; validation, Q.N.; formal analysis, J.C. and M.Y.; investigation, Q.N.; data curation, L.Z.; writing—original draft preparation, J.C. and L.Z.; project administration, L.N. All authors have read and agreed to the published version of the manuscript.

Funding

This research was funded by the 2017 Special Project of Cultivation and Development of Innovation Base, grant number Z171100002217024, the Fundamental Research Funds for the Central Universities, grant number 2018ZD14, and the Fundamental Research Funds for Central Universities, grant number 2019QND63.

Acknowledgments

We want to thank the reviewers and editors for their hard work.

Conflicts of Interest

The authors declare no conflict of interest.

References

  1. Zhang, L.; Yang, J.; Li, D.; Liu, H.; Xie, Y.; Song, T.; Luo, S. Evaluation of the ecological civilization index of China based on the double benchmark progressive method. J. Clean. Prod. 2019, 222, 511–519. [Google Scholar] [CrossRef]
  2. Chang, I.-S.; Wang, W.; Wu, J. To strengthen the practice of ecological civilization in China. Sustainability 2019, 11, 4661. [Google Scholar] [CrossRef] [Green Version]
  3. Wang, X.; Chen, X. An Evaluation index system of China’s development level of ecological civilization. Sustainability 2019, 11, 2270. [Google Scholar] [CrossRef] [Green Version]
  4. Liu, C.; Chen, L.; Vanderbeck, R.M.; Valentine, G.; Zhang, M.; Diprose, K.; McQuaid, K. A Chinese route to sustainability: Postsocialist transitions and the construction of ecological civilization. Sustain. Dev. 2018, 26, 741–748. [Google Scholar] [CrossRef]
  5. Jiang, B.; Bai, Y.; Wong, C.P.; Xu, X.; Alatalo, J.M. China’s ecological civilization program–Implementing ecological redline policy. Land Use Policy 2019, 81, 111–114. [Google Scholar] [CrossRef]
  6. Lai, X.; Liu, G.; Wang, H. Evaluation and analysis of DEA efficiency in construction of ecological civilization of Jiangsu province. Disaster Adv. 2013, 6, 102–108. [Google Scholar]
  7. Liu, M.; Liu, X.; Yang, Z. An integrated indicator on regional ecological civilization construction in China. Int. J. Sustain. Dev. World Ecol. 2016, 23, 53–60. [Google Scholar] [CrossRef]
  8. Zhang, X.; Wang, Y.; Qi, Y.; Wu, J.; Liao, W.; Shui, W.; Zhang, Y.; Deng, S.; Peng, H.; Yu, X.; et al. Evaluating the trends of China’s ecological civilization construction using a novel indicator system. J. Clean. Prod. 2016, 133, 910–923. [Google Scholar] [CrossRef]
  9. Zhao, Y. Evaluation of ecological civilization in megacities. Appl. Ecol. Environ. Res. 2019, 17, 8527–8540. [Google Scholar] [CrossRef]
  10. Yang, P. Evaluation of ecological civilization development in the post-Olympic times. Appl. Ecol. Environ. Res. 2019, 17, 8513–8525. [Google Scholar] [CrossRef]
  11. Chen, J.; Cheng, J.; Dai, S. Regional eco-innovation in China: An analysis of eco-innovation levels and influencing factors. J. Clean. Prod. 2017, 153, 1–14. [Google Scholar] [CrossRef]
  12. National Energy Administration. Suzhou Consensus. Available online: http://www.nea.gov.cn/2016-10/31/c_135794708.htm (accessed on 15 September 2020).
  13. Wu, H.; Li, Y.; Hao, Y.; Ren, S.; Zhang, P. Environmental decentralization, local government competition, and regional green development: Evidence from China. Sci. Total Environ. 2020, 708, 135085. [Google Scholar] [CrossRef]
  14. Zhu, N.; Bu, Y.; Jin, M.; Mbroh, N. Green financial behavior and green development strategy of Chinese power companies in the context of carbon tax. J. Clean. Prod. 2020, 245, 118908. [Google Scholar] [CrossRef]
  15. Mundaca, L.; Markandya, A. Assessing regional progress towards a ‘Green Energy Economy’. Appl. Energy 2016, 179, 1372–1394. [Google Scholar] [CrossRef]
  16. Reddy, B.S. India’s energy system transition-Survival of the greenest. Renew. Energy 2016, 92, 293–302. [Google Scholar] [CrossRef]
  17. Peterson, T.R.; Stephens, J.C.; Wilson, E.J. Public perception of and engagement with emerging low-carbon energy technologies: A literature review. MRS Energy Sustain. 2015, 2. [Google Scholar] [CrossRef] [Green Version]
  18. Xu, B.; Zhou, S.; Hao, L. Approach and practices of district energy planning to achieve low carbon outcomes in China. Energy Policy 2015, 83, 109–122. [Google Scholar] [CrossRef]
  19. Bilgen, S.; Sarikaya, I. The use and its impact on the environment of cogeneration as an important element for a clean and sustainable energy future. Energy Sources Part Recovery Util. Environ. Eff. 2017, 39, 2078–2086. [Google Scholar] [CrossRef]
  20. Ma, Y.; Yan, J.; Sha, J.; He, G.; Song, C.; Fan, S.; Ke, W. Dynamic simulation of the atmospheric environment improved by a focus on clean energy utilization of resource-based cities in China. J. Clean. Prod. 2018, 192, 396–410. [Google Scholar] [CrossRef]
  21. Zhao, Y.; Cui, Z.; Wu, L.; Gao, W. The green behavioral effect of clean coal technology on China’s power generation industry. Sci. Total Environ. 2019, 675, 286–294. [Google Scholar] [CrossRef]
  22. Akyuz, E.; Kaynak, B. Use of dispersion model and satellite SO2 retrievals for environmental impact assessment of coal-fired power plants. Sci. Total Environ. 2019, 689, 808–819. [Google Scholar] [CrossRef] [PubMed]
  23. Chen, X.; Liu, Q.; Sheng, T.; Li, F.; Xu, Z.; Han, D.; Zhang, X.; Huang, X.; Fu, Q.; Cheng, J. A high temporal-spatial emission inventory and updated emission factors for coal-fired power plants in Shanghai, China. Sci. Total Environ. 2019, 688, 94–102. [Google Scholar] [CrossRef] [PubMed]
  24. Contini, D.; Cesari, D.; Conte, M.; Donateo, A. Application of PMF and CMB receptor models for the evaluation of the contribution of a large coal-fired power plant to PM10 concentrations. Sci. Total Environ. 2016, 560–561, 131–140. [Google Scholar] [CrossRef]
  25. Minichilli, F.; Gorini, F.; Bustaffa, E.; Cori, L.; Bianchi, F. Mortality and hospitalization associated to emissions of a coal power plant: A population-based cohort study. Sci. Total Environ. 2019, 694, 133757. [Google Scholar] [CrossRef]
  26. Noli, F.; Tsamos, P. Concentration of heavy metals and trace elements in soils, waters and vegetables and assessment of health risk in the vicinity of a lignite-fired power plant. Sci. Total Environ. 2016, 563–564, 377–385. [Google Scholar] [CrossRef]
  27. Peters, D.; Axsen, J.; Mallett, A. The role of environmental framing in socio-political acceptance of smart grid: The case of British Columbia, Canada. Renew. Sustain. Energy Rev. 2018, 82, 1939–1951. [Google Scholar] [CrossRef]
  28. Wu, J.; Tan, Z.; De, G.; Pu, L.; Wang, K.; Tan, Q.; Ju, L. Multiple scenarios forecast of electric power substitution potential in China: From perspective of green and sustainable development. Processes 2019, 7, 584. [Google Scholar] [CrossRef] [Green Version]
  29. Ren, J.; Dong, L. Evaluation of electricity supply sustainability and security: Multi-criteria decision analysis approach. J. Clean. Prod. 2018, 172, 438–453. [Google Scholar] [CrossRef]
  30. Botelho, A.; Pinto, L.M.C.; Lourenço-Gomes, L.; Valente, M.; Sousa, S. Social sustainability of renewable energy sources in electricity production: An application of the contingent valuation method. Sustain. Cities Soc. 2016, 26, 429–437. [Google Scholar] [CrossRef]
  31. Atilgan, B.; Azapagic, A. An integrated life cycle sustainability assessment of electricity generation in Turkey. Energy Policy 2016, 93, 168–186. [Google Scholar] [CrossRef]
  32. San Miguel, G.; Cerrato, M. Life cycle sustainability assessment of the Spanish electricity: Past, present and future projections. Energies 2020, 13, 1896. [Google Scholar] [CrossRef] [Green Version]
  33. Liu, N.; Liu, C.; Xia, Y.; Da, B. Examining the coordination between urbanization and eco-environment using coupling and spatial analyses: A case study in China. Ecol. Indic. 2018, 93, 1163–1175. [Google Scholar] [CrossRef]
  34. Li, Y.; Li, Y.; Zhou, Y.; Shi, Y.; Zhu, X. Investigation of a coupling model of coordination between urbanization and the environment. J. Environ. Manag. 2012, 98, 127–133. [Google Scholar] [CrossRef]
  35. Xing, L.; Xue, M.; Hu, M. Dynamic simulation and assessment of the coupling coordination degree of the economy–resource–environment system: Case of Wuhan City in China. J. Environ. Manag. 2019, 230, 474–487. [Google Scholar] [CrossRef]
  36. Cui, D.; Chen, X.; Xue, Y.; Li, R.; Zeng, W. An integrated approach to investigate the relationship of coupling coordination between social economy and water environment on urban scale—A case study of Kunming. J. Environ. Manag. 2019, 234, 189–199. [Google Scholar] [CrossRef]
  37. Liu, W.; Jiao, F.; Ren, L.; Xu, X.; Wang, J.; Wang, X. Coupling coordination relationship between urbanization and atmospheric environment security in Jinan City. J. Clean. Prod. 2018, 204, 1–11. [Google Scholar] [CrossRef]
  38. Wang, H.; Feng, Y. Improved AHP based on judgment matrix scaled with cloud model. Chin. J. Manag. Sci. 2005, 13, 32–37. [Google Scholar]
  39. Li, H.; Mu, H.; Gui, S.; Li, M. Scenario analysis for optimal allocation of China’s electricity production system. Sustain. Cities Soc. 2014, 10, 241–244. [Google Scholar] [CrossRef]
  40. Noorollahi, Y.; Itoi, R.; Yousefi, H.; Mohammadi, M.; Farhadi, A. Modeling for diversifying electricity supply by maximizing renewable energy use in Ebino city southern Japan. Sustain. Cities Soc. 2017, 34, 371–384. [Google Scholar] [CrossRef]
  41. Zhang, L.; Zhao, Z.; Xin, H.; Chai, J.; Wang, G. Charge pricing model for electric vehicle charging infrastructure public-private partnership projects in China: A system dynamics analysis. J. Clean. Prod. 2018, 199, 321–333. [Google Scholar] [CrossRef]
  42. Deveci, M.; Pekaslan, D.; Canıtez, F. The assessment of smart city projects using zSlice type-2 fuzzy sets based Interval Agreement Method. Sustain. Cities Soc. 2020, 53, 101889. [Google Scholar] [CrossRef]
  43. Sharifi, A. A typology of smart city assessment tools and indicator sets. Sustain. Cities Soc. 2020, 53, 101936. [Google Scholar] [CrossRef]
  44. Zhou, D.; Xu, J.; Lin, Z. Conflict or coordination? Assessing land use multi-functionalization using production-living-ecology analysis. Sci. Total Environ. 2017, 577, 136–147. [Google Scholar] [CrossRef] [PubMed]
  45. Zhou, S.; Yang, L.; Gao, R.; Wang, X.; Gao, X.; Nie, W.; Xu, P.; Zhang, Q.; Wang, W. A comparison study of carbonaceous aerosols in a typical North China Plain urban atmosphere: Seasonal variability, sources and implications to haze formation. Atmos. Environ. 2017, 149, 95–103. [Google Scholar] [CrossRef]
  46. Zhou, Z.X.; Li, J.; Zhang, W. Coupled urbanization and agricultural ecosystem services in Guanzhong-Tianshui Economic Zone. Environ. Sci. Pollut. Res. 2016, 23, 15407–15417. [Google Scholar] [CrossRef] [PubMed]
  47. Wang, Q.; Yuan, X.; Cheng, X.; Mu, R.; Zuo, J. Coordinated development of energy, economy and environment subsystems-A case study. Ecol. Indic. 2014, 46, 514–523. [Google Scholar] [CrossRef]
  48. Yan, Q.; Zhang, M.; Li, W.; Qin, G. Risk assessment of new energy vehicle supply chain based on variable weight theory and cloud model: A case study in China. Sustainability 2020, 12, 3150. [Google Scholar] [CrossRef] [Green Version]
  49. Li, D.; Liu, C.; Gan, W. A new cognitive model: Cloud model. Int. J. Intell. Syst. 2009, 24, 357–375. [Google Scholar] [CrossRef]
  50. Zhang, L.; Xin, H.; Kan, Z. Sustainability performance evaluation of hybrid energy system using an improved fuzzy synthetic evaluation approach. Sustainability 2019, 11, 1265. [Google Scholar] [CrossRef] [Green Version]
  51. Zhang, L.; Xin, H.; Yong, H.; Kan, Z. Renewable energy project performance evaluation using a hybrid multi-criteria decision-making approach: Case study in Fujian, China. J. Clean. Prod. 2019, 206, 1123–1137. [Google Scholar] [CrossRef]
  52. Wu, G.; Duan, K.; Zuo, J.; Zhao, X.; Tang, D. Integrated sustainability assessment of public rental housing community based on a hybrid method of AHP-Entropy weight and cloud model. Sustainability 2017, 9, 603. [Google Scholar] [CrossRef] [Green Version]
  53. Ai, J.; Feng, L.; Dong, X.; Zhu, X.; Li, Y. Exploring coupling coordination between urbanization and ecosystem quality (1985–2010): A case study from Lianyungang City, China. Front. Earth Sci. 2016, 10, 527–545. [Google Scholar] [CrossRef]
  54. Tang, Z. An integrated approach to evaluating the coupling coordination between tourism and the environment. Tour. Manag. 2015, 46, 11–19. [Google Scholar] [CrossRef]
  55. Huang, J.; Li, Q.; Pontius, R.G.; Klemas, V.; Hong, H. Detecting the dynamic linkage between landscape characteristics and water quality in a subtropical coastal watershed, Southeast China. Environ. Manag. 2013, 51, 32–44. [Google Scholar] [CrossRef]
  56. Niu, D.; Song, Z.; Xiao, X. Electric power substitution for coal in China: Status quo and SWOT analysis. Renew. Sustain. Energy Rev. 2017, 70, 610–622. [Google Scholar] [CrossRef]
  57. Rahman, M.M.; Karunasinghe, J.; Clifford, S.; Knibbs, L.D.; Morawska, L. New insights into the spatial distribution of particle number concentrations by applying non-parametric land use regression modelling. Sci. Total Environ. 2020, 702, 134708. [Google Scholar] [CrossRef]
  58. Beijing Municipal Bureau Statistics. Beijing Statistical Yearbook. Available online: http://tjj.beijing.gov.cn/tjsj_31433/ (accessed on 15 September 2020).
  59. National Bureau of Statistics. China Electric Power Yearbook. Available online: https://data.cnki.net/yearbook/Single/N2019060101 (accessed on 15 September 2020).
  60. National Bureau of Statistics. China Energy Statistical Yearbook. Available online: https://data.cnki.net/yearbook/Single/N2019080025 (accessed on 15 September 2020).
  61. Hu, J. Party’s Seventeenth Congress Report. Available online: http://cpc.people.com.cn/GB/64162/64168/106155/106156/6430009.html (accessed on 15 September 2020).
  62. The People’s Government of Beijing Municipality. Opinions on Comprehensively Promoting the Construction of a Water-Saving Society. Available online: http://www.beijing.gov.cn/zhengce/zhengcefagui/201905/t20190522_59043.html (accessed on 15 September 2020).
  63. Beijing Gardening and Greening Bureau. Master Plan for a New Round of One Million Mu Afforestation Project. Available online: http://yllhj.beijing.gov.cn/zwgk/ (accessed on 15 September 2020).
  64. Beijing Municipal Commission of Development and Reform. The key Points of Energy Work of Beijing in 2018. Available online: http://fgw.beijing.gov.cn/gzdt/tztg/202004/t20200417_1818984.htm (accessed on 15 September 2020).
Figure 1. Main elements of electric power green development (EPGD).
Sustainability 12 08845 g001
Figure 2. Main elements of ecological civilization construction (ECC).
Sustainability 12 08845 g002
Figure 3. Digital features of the cloud.
Sustainability 12 08845 g003
Figure 4. Cloud generator. (a) Forward cloud generator; (b) Backward cloud generator.
Sustainability 12 08845 g004
Figure 5. Schematic diagram of cloud model scale.
Sustainability 12 08845 g005
Figure 6. Logic diagram of this study.
Sustainability 12 08845 g006
Figure 7. Trend of Beijing population.
Sustainability 12 08845 g007
Figure 8. Trend of Beijing GDP.
Sustainability 12 08845 g008
Figure 9. Rank of criteria weights in EPGD subsystem.
Sustainability 12 08845 g009
Figure 10. Rank of criteria weights in ECC subsystem.
Sustainability 12 08845 g010
Figure 11. Trend of comprehensive level of EPGD.
Sustainability 12 08845 g011
Figure 12. Trends of indicators of power-generation-side green development.
Sustainability 12 08845 g012
Figure 13. Trends of indicators of grid-side green development.
Sustainability 12 08845 g013
Figure 14. Trends of indicators of user-side green development.
Sustainability 12 08845 g014
Figure 15. Trend of comprehensive level of ECC.
Sustainability 12 08845 g015
Figure 16. Trends of indicators of ecological resources.
Sustainability 12 08845 g016
Figure 17. Trends of indicators of ecological environment.
Sustainability 12 08845 g017
Figure 18. Trends of indicators of ecological economy.
Sustainability 12 08845 g018
Figure 19. Trends of indicators of ecological society.
Sustainability 12 08845 g019
Figure 20. Trend of the coupling coordination degree (CCD) of EPGD and ECC.
Sustainability 12 08845 g020
Figure 21. Trends of the coupling degree (CD) and comprehensive evaluation index of EPGD and ECC.
Sustainability 12 08845 g021
Figure 22. Comprehensive levels comparison of EPGD and ECC.
Sustainability 12 08845 g022
Figure 23. Regression relationship between ECC and the first-level indicators of EPGD. (a) Regression relationship between ECC and G1; (b) Regression relationship between ECC and G2; (c) Regression relationship between ECC and G3.
Sustainability 12 08845 g023
Figure 24. Regression relationship between EPGD and the first-level indicators of ECC. (a) Regression relationship between EPGD and E1; (b) Regression relationship between EPGD and E2; (c) Regression relationship between EPGD and E3; (d) Regression relationship between EPGD and E4.
Sustainability 12 08845 g024
Figure 25. Main paths to promote the EPGD.
Sustainability 12 08845 g025
Figure 26. Main paths to promote the ECC.
Sustainability 12 08845 g026
Table 1. Evaluation index system of the relationship between EPGD and ECC.
TargetFirst-Grade IndicesSecond-Grade IndicesDirectionUnit
EPGDG1 Power-generation-side green developmentG11 Proportion of clean energy installed capacity+%
G12 Proportion of clean energy power generation+%
G13 Proportion of external power received+%
G14 Standard coal consumption for power supplyg/kWh
G15 Annual utilization hours of power generating equipment+hour
G2 Grid-side green developmentG21 Loss rate in transmission and distribution%
G22 Transmission capacity per unit length of transmission line+100 million kWh/km
G23 Proportion of underground power lines+%
G3 User-side green developmentG31 Electricity proportion in energy consumption of terminal+%
G32 Electricity consumption per capita+kWh
G33 Electricity consumption per regional GDP of primary industry10,000 kWh/100 million yuan
G34 Electricity consumption per regional GDP of secondary industry10,000 kWh/100 million yuan
G35 Electricity consumption per regional GDP of tertiary industry10,000 kWh/100 million yuan
ECCE1 Ecological resourcesE11 Energy Consumption per 10,000 Yuan of regional GDPton of standard coal equivalent (SCE)/10,000 yuan
E12 Water Consumption per 10,000 Yuan of regional GDPm3/10,000 yuan
E13 Water resources per capita+m3/people
E14 Forest area per capita+10,000m2/people
E2 Ecological environmentE21 Daily mean of inhalable particulate mattermicrogram/m3
E22 Daily mean of SO2microgram/m3
E23 Daily mean of NO2microgram/m3
E24 Chemical oxygen demand (COD) emissions10,000 tons
E25 Production of industrial solid waste10,000 tons
E26 Proportion of energy saving and environmental protection expenditure+%
E3 Ecological economyE31 Regional GDP per capita+yuan
E32 Proportion of the added value of the tertiary industry+%
E33 Productivity of social labor in the primary industry+yuan/people
E34 Productivity of social labor in the secondary industry+yuan/people
E35 Productivity of social labor in the tertiary industry+yuan/people
E4 Ecological societyE41 Per capita disposable income+yuan
E42 Per capita consumption expenditure+yuan
E43 Engel’s coefficient%
E44 Park green area per capita+m2/people
E45 Life expectancy at birth+year
Table 2. Cloud model scale.
Importance JudgmentCloud Model Scale
Equally important(1, 0.437, 0.073)
A little important(3, 0.437, 0.073)
Generally important(5, 0.437, 0.073)
Very important(7, 0.437, 0.073)
Extremely important(9, 0.437, 0.073)
The intermediate value of the above adjacent judgment ( E x = 2,4,6,8)( E x , 0.707, 0.118)
Table 3. Random index ( R I ).
Order12345678910
R I 000.580.91.121.241.321.411.451.49
Table 4. Division of the development stages.
Value   of   D Development StagesTypesMeaning
0.8 < D 1 Highly balanced f ( X ) < g ( Y ) f ( X ) is lagging
f ( X ) = g ( Y ) synchronous development of f ( X ) and g ( Y )
f ( X ) > g ( Y ) g ( Y ) is lagging
0.5 < D 0.8 Barely balanced f ( X ) < g ( Y ) f ( X ) is lagging
f ( X ) = g ( Y ) synchronous development of f ( X ) and g ( Y )
f ( X ) > g ( Y ) g ( Y ) is lagging
0.2 < D 0.5 Slightly unbalanced f ( X ) < g ( Y ) f ( X ) is lagging
f ( X ) = g ( Y ) synchronous development of f ( X ) and g ( Y )
f ( X ) > g ( Y ) g ( Y ) is lagging
0 D 0.2 Seriously unbalanced f ( X ) < g ( Y ) f ( X ) is lagging
f ( X ) = g ( Y ) synchronous development of f ( X ) and g ( Y )
f ( X ) > g ( Y ) g ( Y ) is lagging
Table 5. The final weights of the indicators in the EPGD subsystem.
Sub-Indicators Weights   ( E x i , E n i , H e i ) Sub-Indicators Weights   ( E x i , E n i , H e i )
G1(0.4490, 0.4415, 0.4408)G2(0.1863, 0.1810, 0.1824)
G3(0.3647, 0.3775, 0.3768)G11(0.1400, 0.1377, 0.1378)
G12(0.1565, 0.1526, 0.1524)G13(0.0359, 0.0359, 0.0354)
G14(0.0821, 0.0805, 0.0809)G15(0.0346, 0.0348, 0.0344)
G21(0.0616, 0.0624, 0.0628)G22(0.0971, 0.0916, 0.0923)
G23(0.0276, 0.0270, 0.0274)G31(0.1400, 0.1374, 0.1376)
G32(0.0856, 0.0897, 0.0898)G33(0.0384, 0.0415, 0.0412)
G34(0.0414, 0.0446, 0.0442)G35(0.0592, 0.0644, 0.0640)
Table 6. The final weights of the indicators in the ECC subsystem.
Sub-Indicators Weights   ( E x i , E n i , H e i ) Sub-Indicators Weights   ( E x i , E n i , H e i )
E1(0.1721, 0.1747, 0.1748)E2(0.3856, 0.3780, 0.3778)
E3(0.1220, 0.1233, 0.1233)E4(0.3203, 0.3241, 0.3241)
E11(0.0237, 0.0231, 0.0234)E12(0.0152, 0.0158, 0.0157)
E13(0.0581, 0.0602, 0.0603)E14(0.0751, 0.0757, 0.0754)
E21(0.0787, 0.0783, 0.0782)E22(0.0597, 0.0602, 0.0602)
E23(0.0518, 0.0533, 0.0532)E24(0.0316, 0.0309, 0.0309)
E25(0.0283, 0.0287, 0.0283)E26(0.1354, 0.1265, 0.1270)
E31(0.0514, 0.0473, 0.0479)E32(0.0384, 0.0422, 0.0410)
E33(0.0060, 0.0062, 0.0063)E34(0.0105, 0.0113, 0.0114)
E35(0.0158, 0.0164, 0.0167)E41(0.0882, 0.0907, 0.0905)
E42(0.0542, 0.0560, 0.0562)E43(0.1185, 0.1168, 0.1169)
E44(0.0255, 0.0259, 0.0258)E45(0.0339, 0.0346, 0.0346)
Publisher’s Note: MDPI stays neutral with regard to jurisdictional claims in published maps and institutional affiliations.

