Analysis and Measurement of Carbon Emission Aggregation and Spillover Effects in China: Based on a Sectoral Perspective

Abstract
:
1. Introduction
2. Materials and Methods
2.1. Decomposition Model of Sectoral Carbon Emission Driving Factors Based on the LMDI Method
2.2. Decomposition Model of Sectoral Carbon Spillover Effects Based on the IO–SDA Method
2.3. Data Sources
- (1)
- The carbon emission data (Ci) of each sector was adopted using the data published in the CEADs China Carbon Accounting Database [39]. The carbon emissions in the database followed the Intergovernmental Panel on Climate Change (IPCC) emissions accounting method with a territorial administrative scope of the inventories, which includes energy-related emissions (17 fossil fuels in 47 sectors) and process-related emissions (cement production). CO2 emissions for fossil fuel consumption and for industrial processes are calculated based on energy consumption data and emission factors. The first version of the dataset presents emission inventories from 1997 to 2015. Currently, the inventories have been updated up to 2017.
- (2)
- Energy consumption data (Ei) (standard volume) of various sectors, the initial data of which came from the “energy consumption by sector” subclause in the China Energy Statistical Yearbook and the China Statistical Yearbook over the years [40]. The energy standard coal conversion coefficient was taken from the Reference Standard Coal for Various Energy Sources of the China Energy Statistical Yearbook.
- (3)
- Gross domestic product (GDP) and industrial added value of the various sectors (GDPi), which came from the “China Industrial Economic Statistical Yearbook” and the “China Statistical Yearbook” over the years. The total output of each sector and the industrial added value came from the input–output table [41] in the China Statistical Yearbook. Due to changes in statistical indicators, the industry-added value of the sector from 2012 to 2017 was calculated from the total output value of each sector (Lu et al., 2019). Since the industry-added value data of the industrial subordinate sectors in from 2015 to 2017 were missing, they were estimated by interpolation [42,43].
- (4)
- Population (P), urban population (UP), and urban area (A). This article used the permanent urban population at the end of the year to represent the total urban population. These data were mainly derived from statistical information networks such as the China Statistical Yearbook and the website of the National Bureau of Statistics.
3. Calculation Results and Discussions
3.1. Analysis of the Sector Carbon Emission Characteristics and Driving Factors
3.2. Analysis of the Aggregate Effect of Carbon Emissions by Sector
3.3. Analysis of the Sectoral Carbon Emission Spillover Effects
4. Conclusions and Recommendations
- (1)
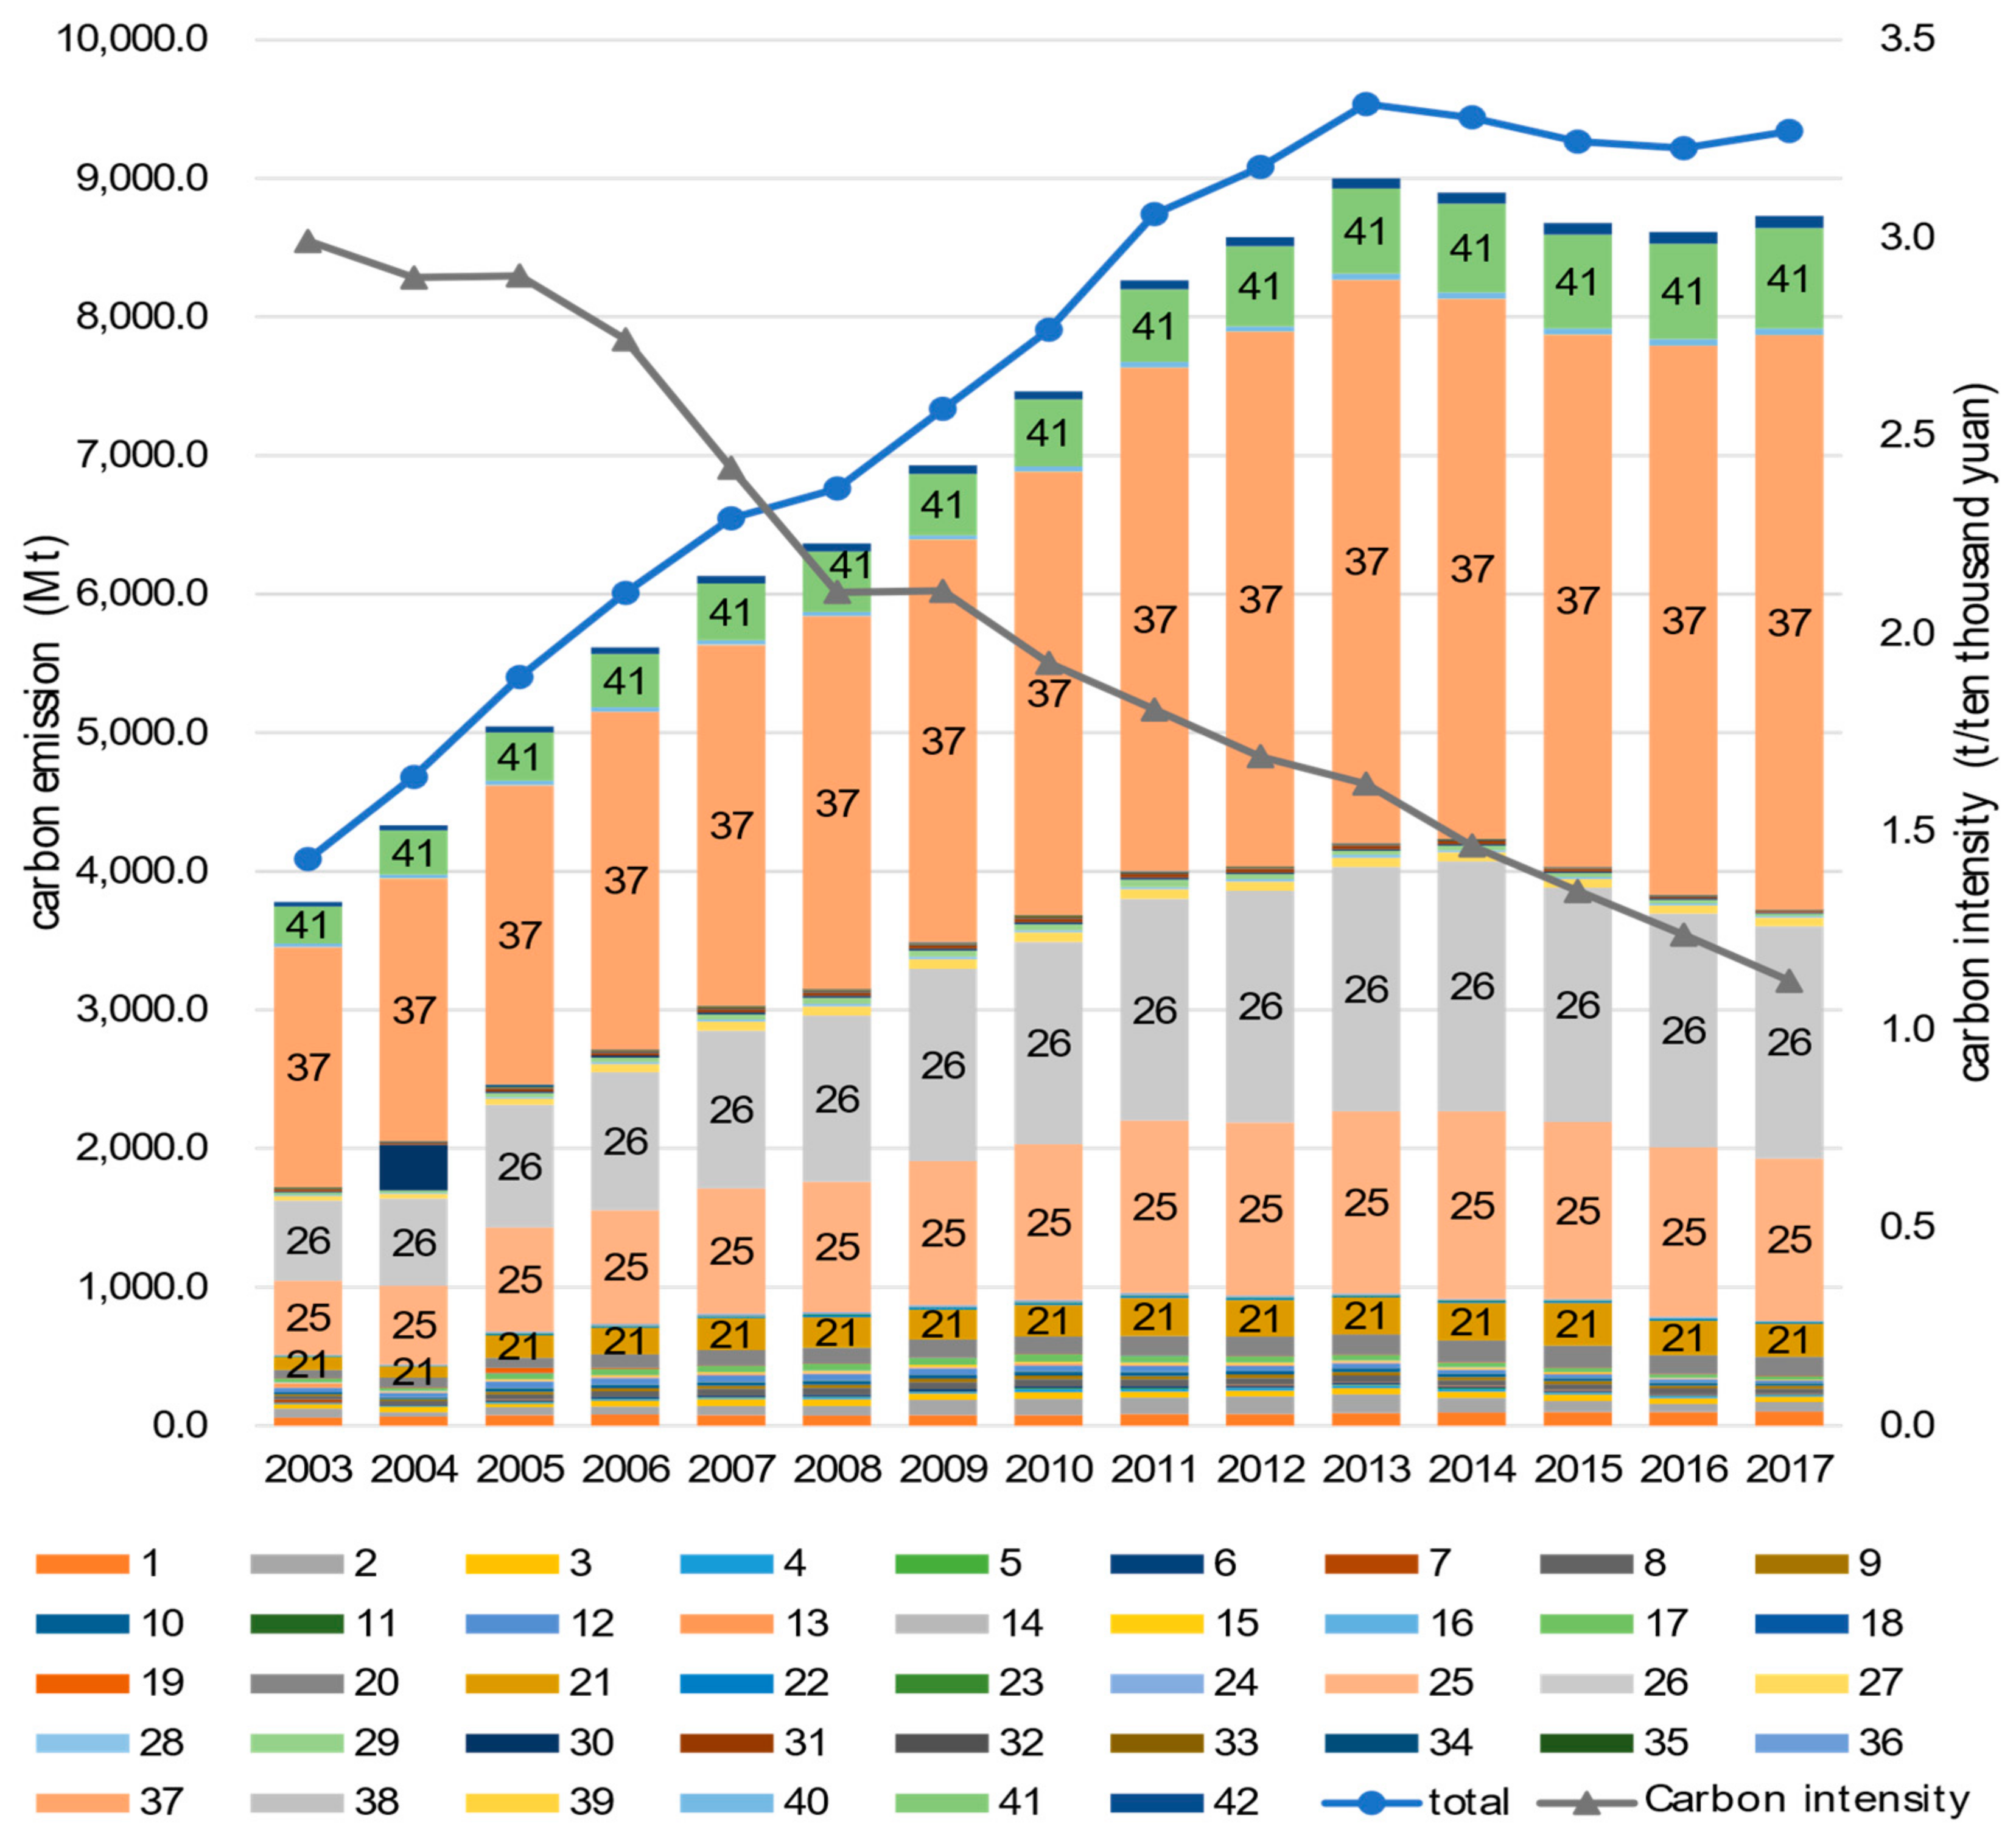
- During the study period, the production and supply of electric power, steam, and hot water (sector 37) was the main contributor to the growth of national carbon emissions; the proportion of its carbon emissions has been as high as 40%. Meanwhile, carbon emissions in the transportation, storage, post, and telecommunication services (sector 41) grew rapidly, increasing from 265.80 Mt in 2003 to 723.87 Mt in 2017, an increase of up to 1.7 times, and their carbon emissions as a proportion of total emissions increased from 6.51% in 2003 to 7.75% in 2017.
- (2)
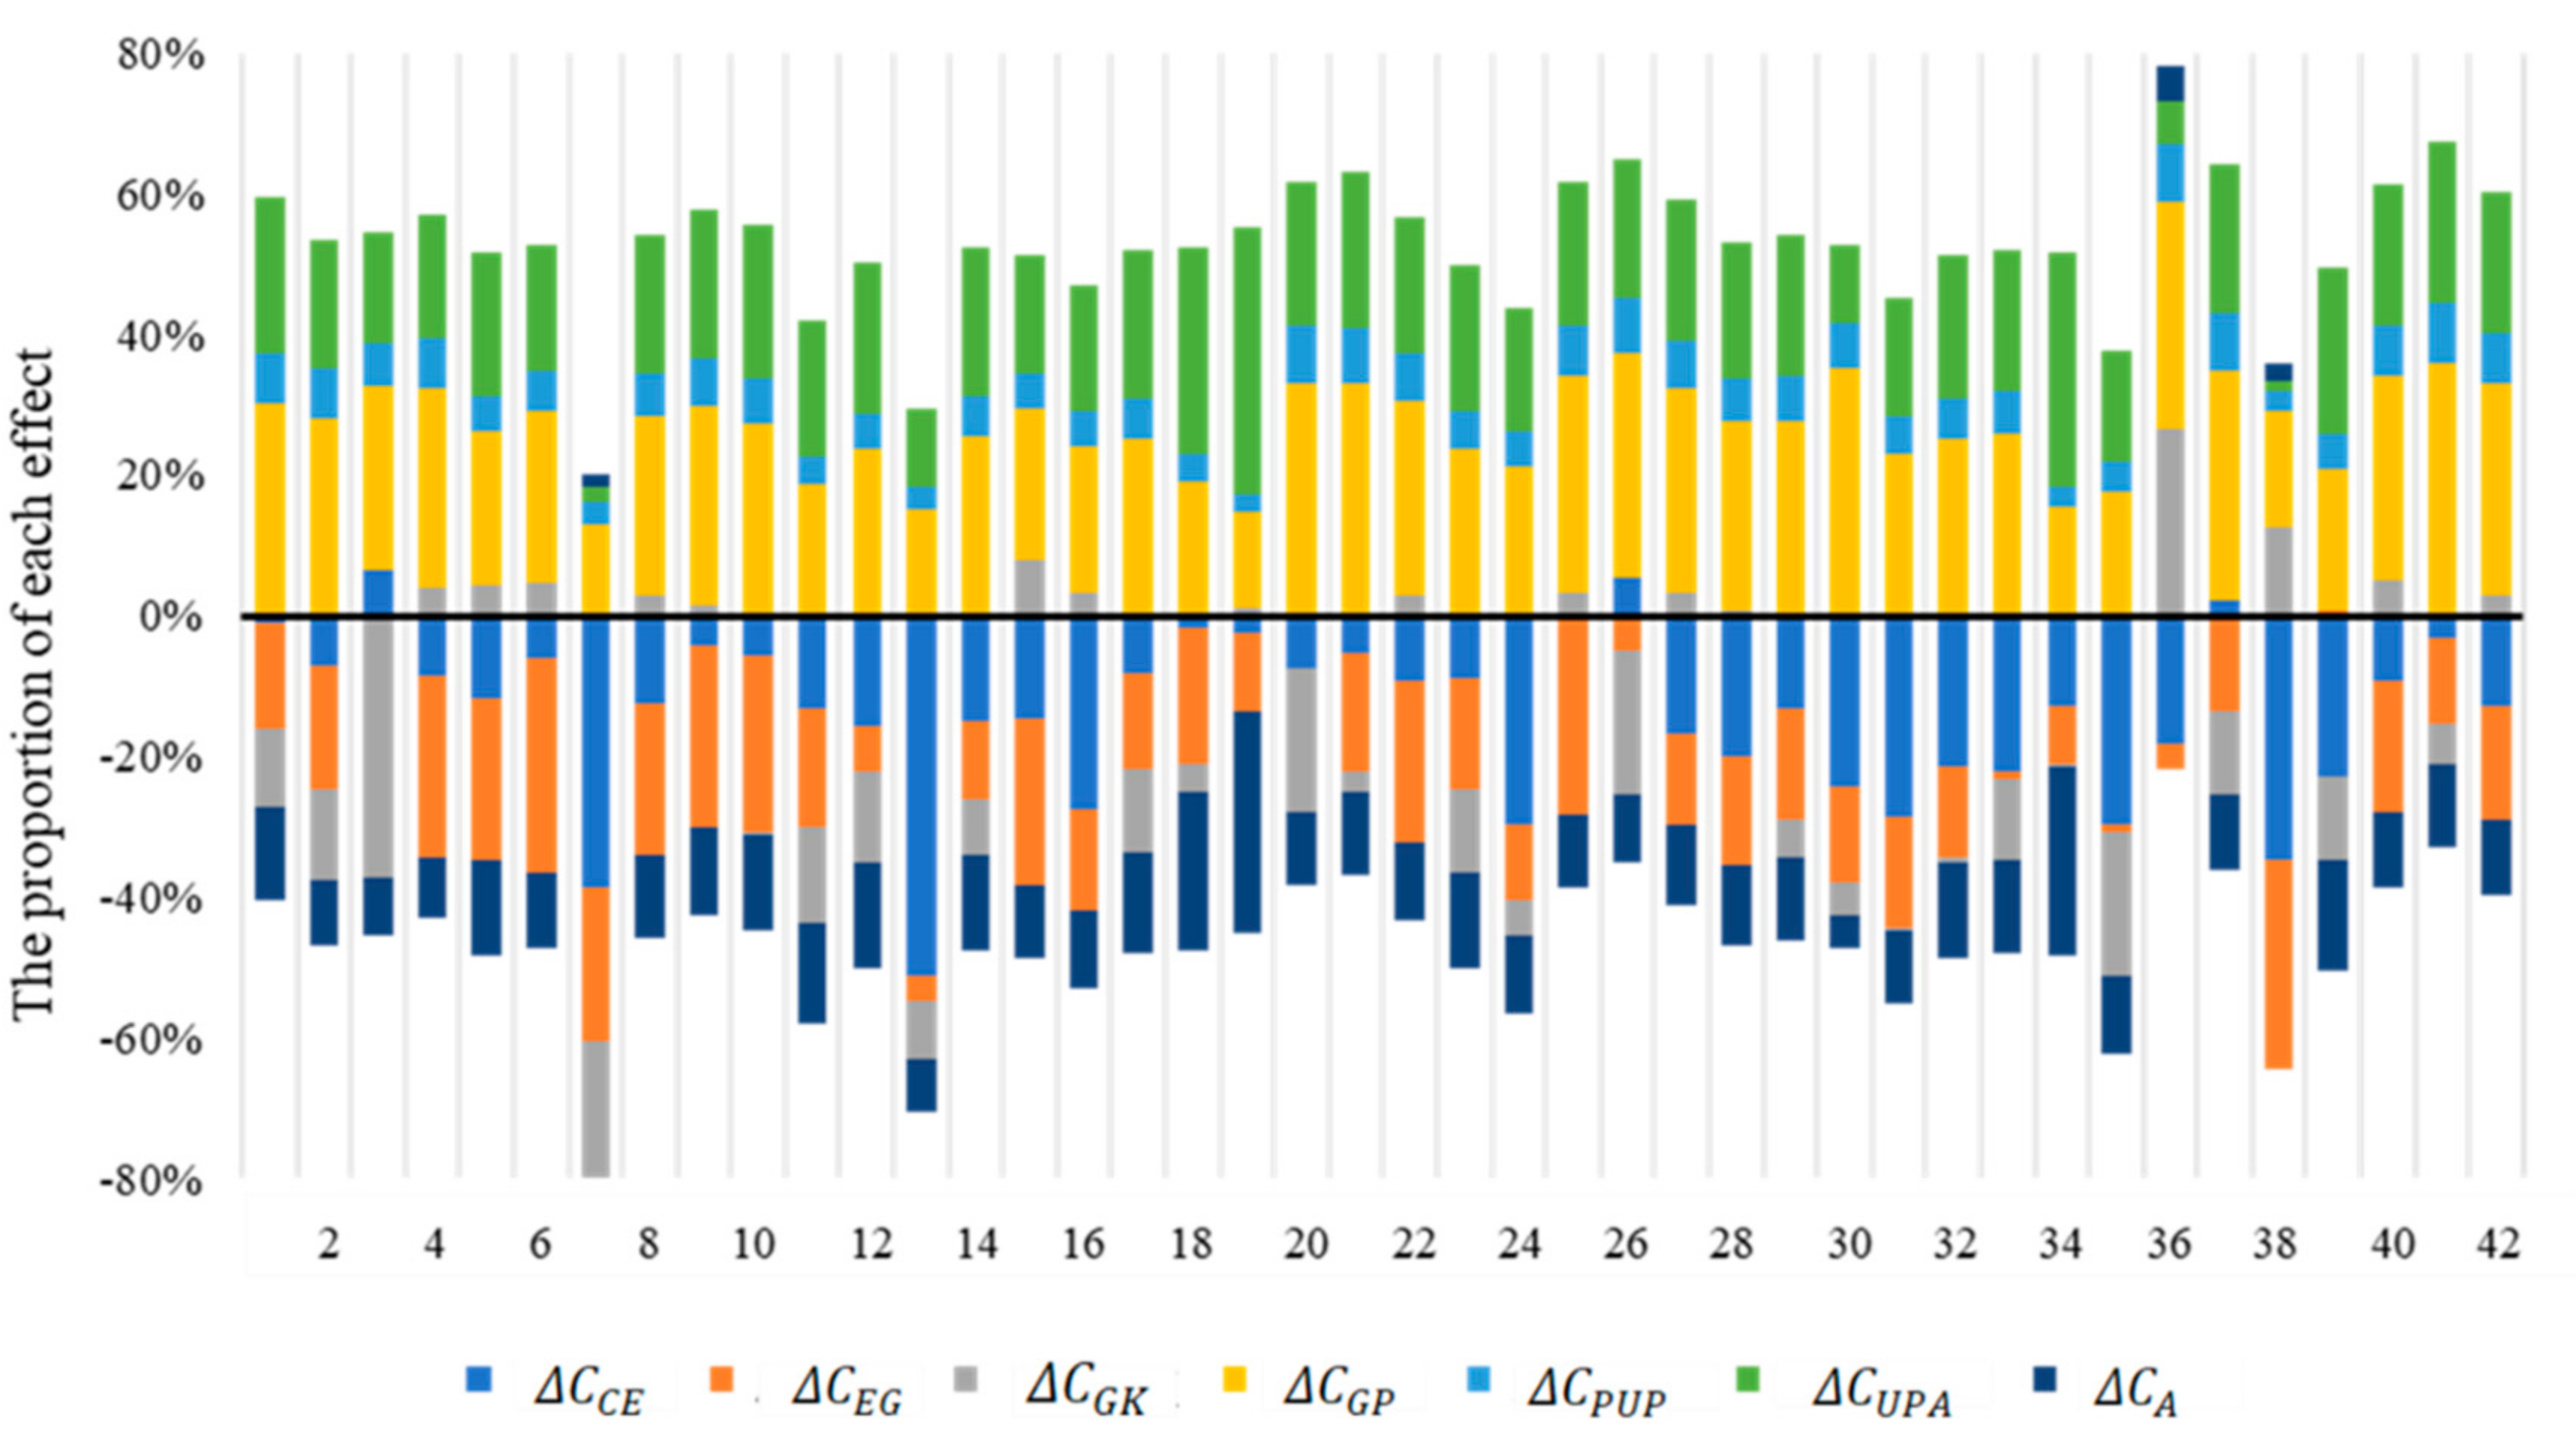
- There is a certain internal correlation between the structural, technological, and policy effects. The effectiveness of the three effects on each sector are almost synchronous, with obvious dynamic interactive synergy and action on most of sectors. The three effects all exert influence to promote the decline in the growth rate of sectoral carbon emissions, especially in the three sectors of textile industry (sector 12), raw chemical materials and chemical products (sector 21), and production and supply of tap water (sector 39). The reason is that China was in important periods of the “11th Five-Year Plan (2005–2010)”, the “12th Five-Year Plan (2010–2015)”, and the “13th Five-Year Plan (2016–2020)” during the research period. The national government’s development strategy for environmental protection, resource conservation, and green development put forward a series of policies to control the output value of large-scale leading industries, such as iron and steel smelting and electricity and thermal production, with huge carbon emissions, and encouraged relevant enterprises in order to actively explore clean and energy-saving production technologies, improve production efficiency, and vigorously promote low-technology-driven carbon sectors to achieve China’s carbon emission reduction goals.
- (3)
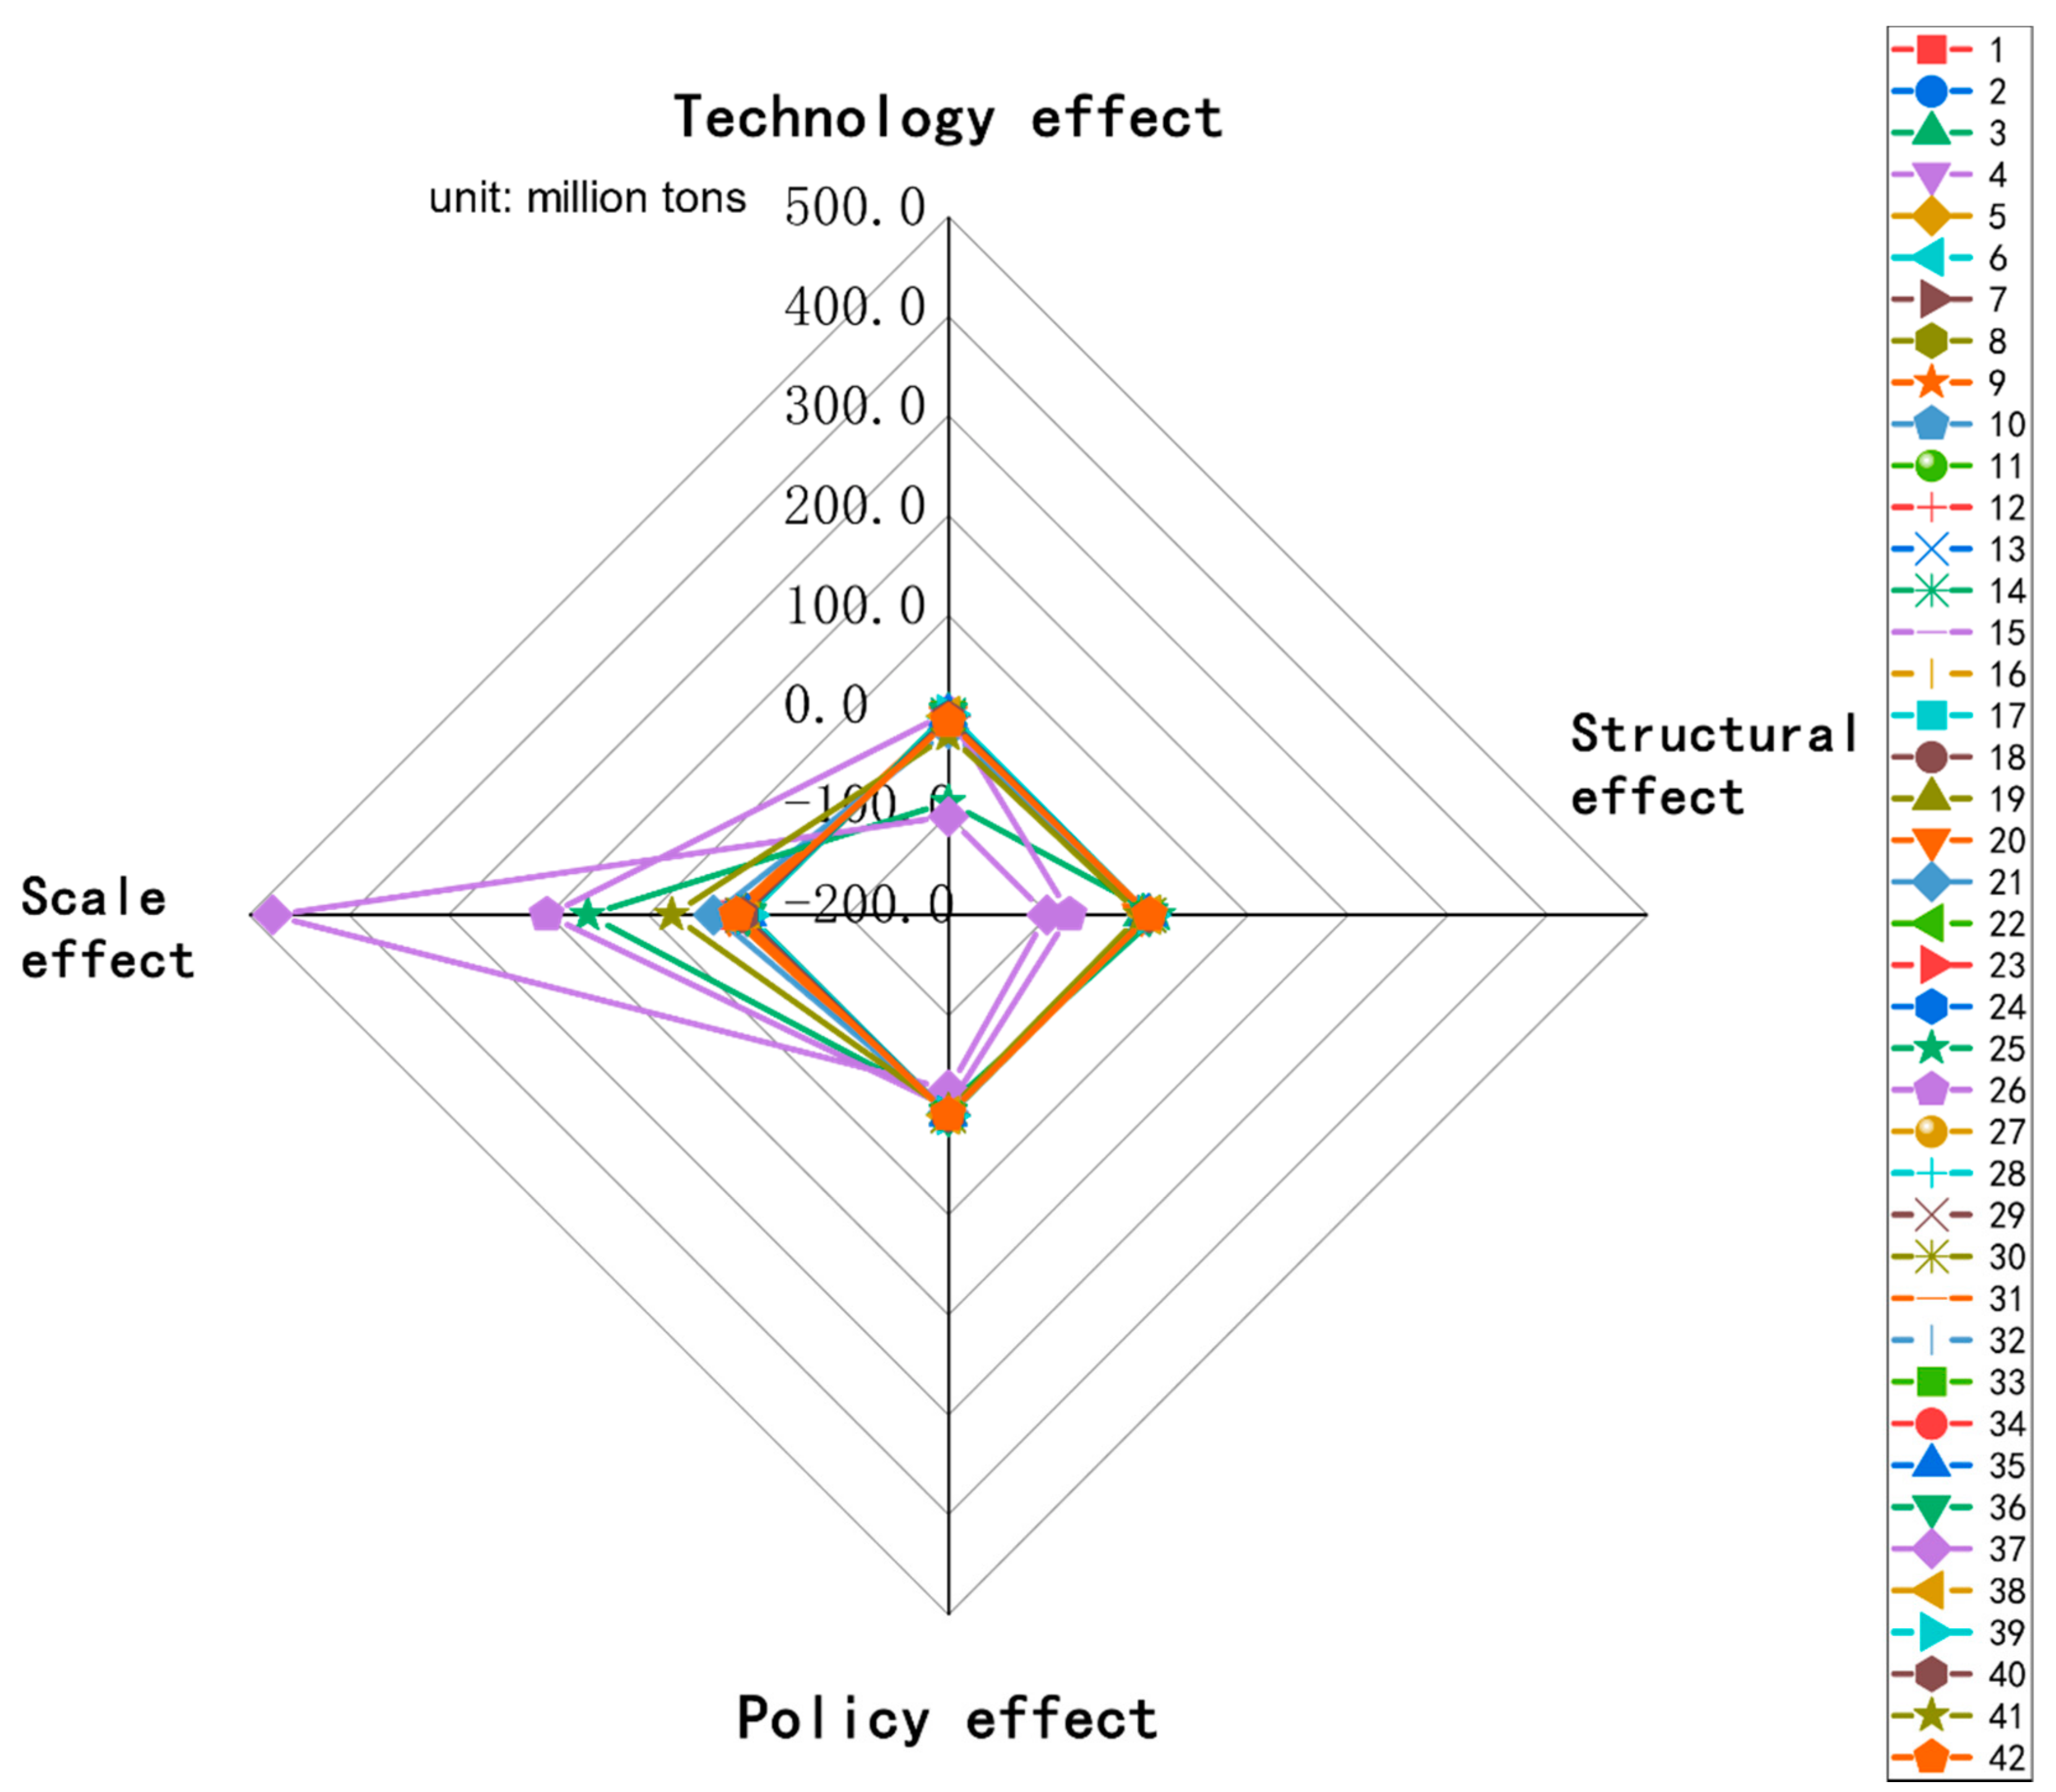
- The final aggregation of the 42 national economic sectors has four types: scale-driven, technology-driven, structure-driven, and policy-driven. Among them, typical representatives in the scale-driven sectors are sector 39, sector 26, sector 25, and sector 41. Meanwhile, the technology-driven sectors that show significant characteristics of dominant technology effects include sector 1, sector 21, sector 2, sector 12, sector 17, and sector 8. For the structure-driven sectors, the structural effect is relatively more prominent. Sector 3, sector 20, and sector 42 obviously belong to this category, and there is also a slight structure-driven trend for sector 19 compared with the other sectors. For the policy-driven sectors in which policy-driven trends are more obvious, typical representatives are sector 4, sector 7, sector 30, sector 38, and sector 39. The rest of the 42 sectors have no obvious aggregation characteristics of scale, technology, structure, or policy orientation.
- (4)
- The carbon emission spillover effects of the 42 national economic sectors have significant sectoral heterogeneity, with a huge impact on the carbon emissions of various sectors, as well as the direct carbon emissions of each sector. The spillover effect of each sector is mainly reflected in the heavy industry and heavy products manufacturing sectors, such as sector 28, sector 21, sector 20, sector 27, and other heavy industry sectors, as well as sector 1, sector 40, and sector 42. Their share of the spillover effects is large, almost reaching over 40%. These sectors are important carbon emission conversion sectors, which consume a lot of energy- and resource-consuming products, leading to a large amount of carbon emissions spread to the other sectors. The relative importance of spillover effects depends on the position of the sector in the supply chain. Sectors upstream of the supply chain (such as sector 37) have a higher share of direct emissions, while sectors at the end of the supply chain have higher spillover emissions (such as sector 42).
- (1)
- For scale-driven sectors, it is recommended to adopt a path of controlling the scale of investment to improve the company’s environmental awareness level, actively guide the industry clustering effect, increase the concentration through the construction of industrial parks, take the route of large-scale cluster production [55], promote industry standardization production and industrialized operation, improve production efficiency, reduce costs and energy consumption, and lay the foundation for the sustainable development of the sectors. For example, for the production and supply of electric power, steam, and hot water sector (sector 37), as an upstream sector of the various industries in the development of the national economy, its output value and carbon emissions are large, which is the focus of attention in the implementation of carbon emission control. When regulating its carbon emissions, considering that economic development has a large demand for electricity and that there will be no significant decline in a short period of time, it is necessary to increase the concentration and industry threshold of the power industry, to gradually eliminate outdated production capacity, and to promote standardized production across the industries. according to the power industry standardized management measures issued by the National Energy Administration. With the development of energy storage technology and energy Internet, carbon emission intensity can be reduced and carbon emission control strategies optimized.
- (2)
- For technology-driven sectors, it is recommended to implement a path to increase investment in innovation, guide enterprises to use low-carbon technology for product upgrades, and promote the establishment of sectoral energy-saving and emission reduction technical service systems. Combining the use of the Internet and other information technologies, intelligent control technology can be used to transform and upgrade existing technologies to achieve the goals of improving quality, reducing energy consumption, and reducing emissions. For example, the farming, forestry, animal husbandry, and fishery sector (sector 1) is a technology-driven sector; as the basic sector of economic development, this sector has an irreplaceable impact on people’s daily necessities, food, shelter, and transportation. Soilless agriculture, drip irrigation, and other energy-saving and emission reduction technologies, using geographic information technology and computer automatic control technology, can develop precision agriculture while protecting natural resources and acquiring materials needed for daily life. Of course, with the change in lifestyle, the development of tourism agriculture such as farmhouses can be encouraged to play basic production function, but also play a role in regulating carbon emissions in conjunction with its downstream industries.
- (3)
- For structure-driven sectors, it is recommended to adopt an optimized sector structure path, to vigorously develop the producer service and high-tech service industries, to increase the degree of industry service, and to increase the proportion of the service industry in economic development. At the same time, this would promote the development of industry sectors in a more refined direction, increase product value, and highlight the important position of industries in the supply chain. For example, the wholesale, retail trade, and catering services sector (sector 42) is a structure-driven sector, and in the process of gradual refinement of the social division of labor, advanced management methods are used to continuously improve the service level of the industry and consumer satisfaction, stimulate consumption, and increase output value and the proportion of wholesale and retail accommodation and catering in the national economy. On the other hand, it is recommended to continue to extend the industrial chain, form an industrial integration chain with downstream industries such as tourism, increase the added value of products, promote the brand effect, and take a unique carbon emission control path.
- (4)
- For policy-driven sectors, the implementation of a strengthened government supervision path is recommended to establish a complete monitoring network for high-energy-consumption and high-emission industries, and to regularly check the operation status of an enterprise’s production equipment and exhaust gas emission levels. For companies that do not meet the standards, they must take immediate measures to rectify such issues within a time limit, must strive to improve the development environment of the entire industry, and must promote the sustainable development of the industry. For example, for the ferrous metal mining and dressing sector (sector 4), a policy-driven sector, the environmental protection requirements in the process of ferrous metal mining and dressing can be strengthened, and enterprise production standards can be strictly regulated. The regulation of steel production and manufacturing in its downstream industries eliminates excess capacity in the process of urbanization and reduces the demand for raw materials, thereby reducing the mining and selection of ferrous metal minerals and realizing the reduction targets of carbon emissions in this type of sector.
Author Contributions
Funding
Conflicts of Interest
References
- Defying Expectations of a Rise, Global Carbon Dioxide Emissions Flatlined in 2019. Available online: https://www.iea.org/news/defying-expectations-of-a-rise-global-carbon-dioxide-emissions-flatlined-in-2019 (accessed on 9 August 2020).
- BP Statistical Review of World Energy. 2019. Available online: https://www.bp.com/en/global/corporate/energy-economics/statistical-review-of-world-energy/co2-emissions.html (accessed on 1 September 2020).
- The State Council Information Office of the People’s Republic of China. China’s Intended Nationally Determined Contribution: Enhanced Actions on Climate Change. 2015. Available online: http://www.scio.gov.cn/xwfbh/xwbfbh/wqfbh/2015/20151119/xgbd33811/Document/1455864/1455864.htm (accessed on 1 July 2020).
- Li, H.; Zhao, Y.; Qiao, X.; Liu, Y.; Cao, Y.; Li, Y.; Wang, S.; Zhang, Z.; Zhang, Y.; Weng, J. Identifying the driving forces of national and regional CO2 emissions in China: Based on temporal and spatial decomposition analysis models. Energy Econ. 2017, 68, 522–538. [Google Scholar] [CrossRef]
- Yi-Ming, W.; Meng, J.; Guan, D.; Shan, Y.; Song, M.; Wei, Y.-M.; Liu, Z.; Hubacek, K. Chinese CO2 emission flows have reversed since the global financial crisis. Nat. Commun. 2017, 8, 1–10. [Google Scholar] [CrossRef]
- Li, J.; Ma, J.; Wei, W. Analysis and Evaluation of the Regional Characteristics of Carbon Emission Efficiency for China. Sustainability 2020, 12, 3138. [Google Scholar] [CrossRef] [Green Version]
- The Thirteenth Five-Year Plan. 2016. Available online: http://www.gov.cn/xinwen/2016-03/17/content_5054992.htm (accessed on 21 October 2020).
- Yu, S.; Zheng, S.; Li, X.; Li, L. China can peak its energy-related carbon emissions before 2025: Evidence from industry restructuring. Energy Econ. 2018, 73, 91–107. [Google Scholar] [CrossRef]
- Luo, F.; Guo, Y.; Yao, M.; Cai, W.; Wang, M.; Wei, W. Carbon emissions and driving forces of China’s power sector: Input-output model based on the disaggregated power sector. J. Clean. Prod. 2020, 268, 121925. [Google Scholar] [CrossRef]
- Zhang, Y.; Yuan, Z.; Margni, M.; Bulle, C.; Hua, H.; Jiang, S.; Liu, X. Intensive carbon dioxide emission of coal chemical industry in China. Appl. Energy 2019, 236, 540–550. [Google Scholar] [CrossRef]
- Lin, B.; Xu, M. Good subsidies or bad subsidies? Evidence from low-carbon transition in China’s metallurgical industry. Energy Econ. 2019, 83, 52–60. [Google Scholar] [CrossRef]
- Zhu, L.; Zhang, X.; Li, Y.; Wang, X.; Guo, J. Can an emission trading scheme promote the withdrawal of outdated capacity in energy-intensive sectors? A case study on China’s iron and steel industry. Energy Econ. 2017, 63, 332–347. [Google Scholar] [CrossRef]
- Song, L.; Lieu, J.; Nikas, A.; Arsenopoulos, A.; Vasileiou, G.; Doukas, H. Contested energy futures, conflicted rewards? Examining low-carbon transition risks and governance dynamics in China’s built environment. Energy Res. Soc. Sci. 2020, 59, 101306. [Google Scholar] [CrossRef]
- Moezzi, M.; Janda, K. From “if only” to “social potential” in schemes to reduce building energy use. Energy Res. Soc. Sci. 2014, 1, 30–40. [Google Scholar] [CrossRef]
- Quan, C.; Cheng, X.; Yu, S.; Ye, X. Analysis on the influencing factors of carbon emission in China’s logistics industry based on LMDI method. Sci. Total. Environ. 2020, 734, 138473. [Google Scholar] [CrossRef]
- Zhou, Y.; Zhang, Y.; Ma, D.; Lu, J.; Luo, W.; Fu, Y.; Li, S.; Feng, J.; Huang, C.; Ge, W.; et al. Port-Related Emissions, Environmental Impacts and Their Implication on Green Traffic Policy in Shanghai. Sustainability 2020, 12, 4162. [Google Scholar] [CrossRef]
- Guo, M.; Hu, Y. The Impact of Financial Development on Carbon Emission: Evidence from China. Sustainability 2020, 12, 6959. [Google Scholar] [CrossRef]
- Xu, X.; Zhao, T.; Liu, N.; Kang, J. Changes of energy-related GHG emissions in China: An empirical analysis from sectoral perspective. Appl. Energy 2014, 132, 298–307. [Google Scholar] [CrossRef]
- Zhen, W.; Zhong, Z.; Wang, Y.; Miao, L.; Qin, Q.; Wei, Y.-M. Evolution of urban household indirect carbon emission responsibility from an inter-sectoral perspective: A case study of Guangdong, China. Energy Econ. 2019, 83, 197–207. [Google Scholar] [CrossRef]
- Li, J.; Kagawa, S.; Lin, C. China’s CO2 emission structure for 1957–2017 through transitions in economic and environmental policies. J. Clean. Prod. 2020, 255, 120288. [Google Scholar] [CrossRef]
- Du, G.; Sun, C.; Ouyang, X.; Zhang, C. A decomposition analysis of energy-related CO2 emissions in Chinese six high-energy intensive industries. J. Clean. Prod. 2018, 184, 1102–1112. [Google Scholar] [CrossRef]
- Tan, R.; Lin, B. What factors lead to the decline of energy intensity in China’s energy intensive industries? Energy Econ. 2018, 71, 213–221. [Google Scholar] [CrossRef]
- Zhang, S.; Andrews-Speed, P. State versus market in China’s low-carbon energy transition: An institutional perspective. Energy Res. Soc. Sci. 2020, 66, 101503. [Google Scholar] [CrossRef]
- Busby, J.W.; Gao, X.; Shidore, S. Turning the carbon supertanker: Sectoral feasibility of climate change mitigation in China. Energy Res. Soc. Sci. 2018, 37, 198–210. [Google Scholar] [CrossRef]
- Andrews-Speed, P. Applying institutional theory to the low-carbon energy transition. Energy Res. Soc. Sci. 2016, 13, 216–225. [Google Scholar] [CrossRef]
- Duan, M.; Tian, Z.; Zhao, Y.; Li, M. Interactions and coordination between carbon emissions trading and other direct carbon mitigation policies in China. Energy Res. Soc. Sci. 2017, 33, 59–69. [Google Scholar] [CrossRef]
- IPCC (Intergovernmental Panel on Climate Change). IPCC Guidelines for National Greenhouse Gas Inventories. 2006. Available online: https://www.ipcc.ch/report/2006-ipcc-guidelines-for-national-greenhouse-gas-inventories/ (accessed on 21 October 2020).
- Ang, B.; Liu, F.; Chew, E. Perfect decomposition techniques in energy and environmental analysis. Energy Policy 2003, 31, 1561–1566. [Google Scholar] [CrossRef]
- Su, B.; Ang, B. Structural decomposition analysis applied to energy and emissions: Some methodological developments. Energy Econ. 2012, 34, 177–188. [Google Scholar] [CrossRef]
- Ang, B.W. Decomposition analysis for policy making in energy: Which is the preferred method? Energy Policy 2004, 32, 1131–1139. [Google Scholar] [CrossRef]
- Ang, B.; Zhang, F.; Choi, K.-H. Factorizing changes in energy and environmental indicators through decomposition. Energy 1998, 23, 489–495. [Google Scholar] [CrossRef]
- Ang, B.; Zhang, F. A survey of index decomposition analysis in energy and environmental studies. Energy 2000, 25, 1149–1176. [Google Scholar] [CrossRef]
- Kaya, Y. Impact of Carbon Dioxide Emission Control on GNP Growth: Interpretation of Proposed Scenarios; IPCC Energy and Industry Subgroup, Response Strategies Working Group: Paris, France, 1990. [Google Scholar]
- Xu, S.-C.; Zhang, L.; Liu, Y.-T.; Zhang, W.-W.; He, Z.; Long, R.-Y.; Chen, H. Determination of the factors that influence increments in CO2 emissions in Jiangsu, China using the SDA method. J. Clean. Prod. 2017, 142, 3061–3074. [Google Scholar] [CrossRef]
- Hoekstra, R.; Bergh, J.C.J.M.V.D. Comparing structural decomposition analysis and index. Energy Econ. 2003, 25, 39–64. [Google Scholar] [CrossRef]
- Li, Y.; Su, B.; Dasgupta, S. Structural path analysis of India’s carbon emissions using input-output and social accounting matrix frameworks. Energy Econ. 2018, 76, 457–469. [Google Scholar] [CrossRef]
- Leontief, W. Environmental Repercussions and the Economic Structure: An Input-Output Approach. Rev. Econ. Stat. 1970, 52, 262–271. [Google Scholar] [CrossRef]
- Yuan, R.; Behrens, P.; Rodrigues, J.F.D. The evolution of inter-sectoral linkages in China’s energy-related CO2 emissions from 1997 to 2012. Energy Econ. 2018, 69, 404–417. [Google Scholar] [CrossRef]
- Shan, Y.; Guan, D.; Zheng, H.; Ou, J.; Li, Y.; Zheng, H.; Mi, Z.; Liu, Z.; Zhang, Q. China CO2 emission accounts 1997–2015. Sci. Data 2018, 5, 170201. [Google Scholar] [CrossRef] [PubMed] [Green Version]
- National Bureau of Statistics of China (NBS). 2003–2017 China Energy Statistical Yearbook; Chinese Statistics Press: Beijing, China, 1998. (In Chinese)
- National Bureau of Statistics of China (NBS). 2017 Input-Output Tables of China; Chinese Statistics Press: Beijing, China, 1998. (In Chinese)
- Chen, S.Y. Estimation of statistical data by industry in China: 1980-2008. Economics 2011, 10, 735–776. [Google Scholar] [CrossRef]
- Lu, M.; Wang, K. China’s industrial double-digit industry economic energy and environment data estimation. Environ. Econ. Res. 2019, 4, 28–46. [Google Scholar]
- Liu, Z.; Guan, D.; Wei, W.; Davis, S.J.; Ciais, P.; Bai, J.; Peng, S.; Zhang, Q.; Klaus, H.; Marland, G.; et al. Reduced carbon emission estimates from fossil fuel combustion and cement production in China. Nature 2015, 524, 335–338. [Google Scholar] [CrossRef] [Green Version]
- Tian, H.Z.; Ma, L. Analysis of structural factors of changes in industrial carbon emissions in China. J. Nat. Resour. 2020, 35, 639–653. [Google Scholar]
- Wang, J.; Zhao, T.; Wang, Y. How to achieve the 2020 and 2030 emissions targets of China: Evidence from high, mid and low energy-consumption industrial sub-sectors. Atmos. Environ. 2016, 145, 280–292. [Google Scholar] [CrossRef]
- Knapp, T.; Mookeriee R, P. Growth and global CO2 Emissions. Energy Policy 1996, 24, 31–37. [Google Scholar] [CrossRef]
- Notice of the State Council on Issuing the National Population Development Plan (2016–2030). Available online: http://www.gov.cn/zhengce/content/2017-01/25/content_5163309.htm (accessed on 15 October 2020).
- Wang, C.; Chen, J.; Zou, J. Decomposition of energy-related CO2 emission in China: 1957–2000. Energy 2005, 30, 73–83. [Google Scholar] [CrossRef]
- Shimada, K.; Tanaka, Y.; Gomi, K.; Matsuoka, Y. Developing a long-term local society design methodology towards a low-carbon economy: An application to Shiga Prefecture in Japan. Energy Policy 2007, 35, 4688–4703. [Google Scholar] [CrossRef]
- Wu, Y.; Shen, J.; Zhang, X.; Skitmore, M.; Lu, W. Reprint of: The impact of urbanization on carbon emissions in developing countries: A Chinese study based on the U-Kaya method. J. Clean. Prod. 2017, 163, S284–S298. [Google Scholar] [CrossRef]
- Wang, Q.; Su, M. The effects of urbanization and industrialization on decoupling economic growth from carbon emission—A case study of China. Sustain. Cities Soc. 2019, 51, 101758. [Google Scholar] [CrossRef]
- Yan, X.; Fang, Y.-P. CO2 emissions and mitigation potential of the Chinese manufacturing industry. J. Clean. Prod. 2015, 103, 759–773. [Google Scholar] [CrossRef]
- Kang, J.; Ng, T.S.; Su, B. Optimizing electricity mix for CO2 emissions reduction: A robust input-output linear programming model. Eur. J. Oper. Res. 2020, 287, 280–292. [Google Scholar] [CrossRef]
- Peng, H.; Wang, Y.; Hu, Y.; Shen, H. Agglomeration Production, Industry Association and Carbon Emission Performance: Based on Spatial Analysis. Sustainability 2020, 12, 7234. [Google Scholar] [CrossRef]


| Variable | Implication, Unit |
|---|---|
| Ci | the carbon emissions generated by the i industry sector, million tons |
| Ei | the total amount of standard coal converted from the energy consumption of the sector, hundred million tons |
| GDPi | the increase value of domestic production in the i sector industry, hundred million yuan |
| GDP | the total value of domestic production, hundred million yuan |
| P | the total population of China, 10,000 people |
| UP | the total urban population, 10,000 people |
| A | the urban built-up area, square kilometers, which characterizes urban construction |
| CE | CE = Ci/Ei, the carbon emission per unit energy, which characterizes the cleanliness of the energy consumption structure |
| EG | EG = Ei/GDPi, the energy consumed by the unit industry added value of each sector, which characterizes the energy consumption intensity of the sector |
| GK | GK = GDPi/GDP, the ratio of industrial added value of each sector to GDP, which characterizes the sectoral industrial structure |
| GP | GP = GDP/P, GDP per capita, which characterizes the economic scale |
| PUP | PUP = P/UP, the reciprocal rate of urbanization, which characterizes the urban–rural structure |
| UPA | UPA = UP/A, urban population density, which characterizes the population size |
| Economic Sector Number | National Economic Sector | Economic Sector Number | National Economic Sector |
|---|---|---|---|
| 1 | Farming, Forestry, Animal Husbandry, and Fishery | 22 | Medical and Pharmaceutical Products |
| 2 | Coal Mining and Dressing | 23 | Chemical Fibers |
| 3 | Petroleum and Natural Gas Extraction | 24 | Rubber and Plastic Products |
| 4 | Ferrous Metal Mining and Dressing | 25 | Nonmetal Mineral Products |
| 5 | Nonferrous Metal Mining and Dressing | 26 | Smelting and Pressing of Ferrous Metals |
| 6 | Nonmetal Mineral Mining and Dressing | 27 | Smelting and Pressing of Nonferrous Metals |
| 7 | Other Mineral Mining and Dressing | 28 | Metal Products |
| 8 | Food Processing | 29 | Ordinary Machinery |
| 9 | Food Production | 30 | Equipment for Special Purposes |
| 10 | Beverage Production | 31 | Transportation Equipment |
| 11 | Tobacco Processing | 32 | Electric Equipment and Machinery |
| 12 | Textile Industry | 33 | Electronic and Telecommunication Equipment |
| 13 | Garments and Other Fiber Products | 34 | Instruments, Meters, and Cultural and Office Machinery |
| 14 | Leather, Fur, Down, and Related Products | 35 | Other Manufacturing Industry |
| 15 | Timber Processing and Bamboo, Cane, Palm Fiber, and Straw Products | 36 | Scrap and Waste |
| 16 | Furniture Manufacturing | 37 | Production and Supply of Electric Power, Steam, and Hot Water |
| 17 | Papermaking and Paper Products | 38 | Production and Supply of Gas |
| 18 | Printing and Record Medium Reproduction | 39 | Production and Supply of Tap Water |
| 19 | Cultural, Educational, and Sports Articles | 40 | Construction |
| 20 | Petroleum Processing and Coking | 41 | Transportation, Storage, Post, and Telecommunication Services |
| 21 | Raw Chemical Materials and Chemical Products | 42 | Wholesale, Retail Trade, and Catering Services |
Publisher’s Note: MDPI stays neutral with regard to jurisdictional claims in published maps and institutional affiliations. |
© 2020 by the authors. Licensee MDPI, Basel, Switzerland. This article is an open access article distributed under the terms and conditions of the Creative Commons Attribution (CC BY) license (http://creativecommons.org/licenses/by/4.0/).
Share and Cite
Liu, J.; Wei, D. Analysis and Measurement of Carbon Emission Aggregation and Spillover Effects in China: Based on a Sectoral Perspective. Sustainability 2020, 12, 8966. https://doi.org/10.3390/su12218966
Liu J, Wei D. Analysis and Measurement of Carbon Emission Aggregation and Spillover Effects in China: Based on a Sectoral Perspective. Sustainability. 2020; 12(21):8966. https://doi.org/10.3390/su12218966
Chicago/Turabian StyleLiu, Jinpeng, and Delin Wei. 2020. "Analysis and Measurement of Carbon Emission Aggregation and Spillover Effects in China: Based on a Sectoral Perspective" Sustainability 12, no. 21: 8966. https://doi.org/10.3390/su12218966