Article

Research on the Construction of Performance Indicators for the Marketing Alliance of Catering Industry and Credit Card Issuing Banks by Using the Balanced Scorecard and Fuzzy AHP

1
Department of Business Administration, Dayeh University, Changhua 51591, Taiwan
2
Department of Accounting, National Changhua University of Education, Changhua 50074, Taiwan
3
Department of Finance, National Chung Hsing University, Taichung 402204, Taiwan
4
Department of Finance, National Changhua University of Education, Changhua 50074, Taiwan
*
Author to whom correspondence should be addressed.
Sustainability 2020, 12(21), 9005; https://doi.org/10.3390/su12219005
Submission received: 8 September 2020 / Revised: 15 October 2020 / Accepted: 28 October 2020 / Published: 29 October 2020
(This article belongs to the Special Issue Blockchain for Business Process Reengineering and Sustainability)

Abstract

:
In recent years, strategic alliances have seen explosive growth in various practical fields. Various forms of strategic alliances and cooperation models have been widely used among various organizations and have received considerable attention from academic and practical circles. However, there are many factors that affect the success of marketing alliances, and the academic community has not reached a conclusion and consensus. Among them, the establishment and monitoring of a performance evaluation mechanism is one of the key points. In the past, many academic studies have devoted themselves to the establishment of performance evaluation mechanisms for many different industries, but few of them have focused on the establishment of performance evaluation mechanisms for marketing alliances between the service industry and the banking industry. The purpose of this study is to assist in the establishment of performance evaluation indicators for marketing alliance between the catering industry and credit card issuing banks by using expert Delphi, fuzzy analytic hierarchy process and balanced scorecard methods. The main result of this study is to establish five key performance evaluation indicators including customer factors, cooperative alliance factors, financial factors, learning and growth factors, and internal process factors. In terms of secondary indicators, there are seven customer sub-factors, six cooperative alliance sub-factors, five financial sub-factors, seven internal processes sub-factors, and five learning and growth sub-factors, totaling 30 sub-factors. The research results can be used as a reference for academic and practical areas.

1. Introduction

A strategic alliance is a voluntary cooperation agreement between enterprises, and each one can be regarded as an alliance partner that is utilized to achieve competitive advantage [1,2]. Through resource connection and close cooperation between allies, stronger competitive advantages can be established [1,2]. In order to cope with the ever-changing environment, alliance cooperation has long been regarded as an effective competitive strategy and has been widely recognized as an important source of competitive advantage, especially in today’s increasingly competitive global market [3]. More companies accept the new thinking of strategic alliances and participate in all possible alliances as much as possible, increasing the number of alliances to maintain their competitiveness and freedom in the market [3]. Beritelli [4] argues that if strategic alliance cooperation can achieve the greatest competitive advantage for the company, that is, maximize revenue or minimize costs, and both partners can win reputation and rewards, then for a company, alliance cooperation is worth knowing and using. Because the value of strategic alliances is to produce win-win results [5], in this case, strategic alliances are not limited to intra-industry alliances. In the context of specific needs, companies are also trying to establish alliances with different industries. Many companies have understood that, through various types of strategic alliances, companies can enhance their strengths and make up for their weaknesses [6]. Greve et al. [7] and Lazzarini [8] both pointed out that strategic alliances can provide greater marketing capabilities and achieve performance that surpasses their competitors. Lavie and Miller [9] found that cross-industry alliances can create unique market opportunities and establish unique network resources, forming barriers to competition.
Academic research has also confirmed that companies can use strategic alliances to increase their competitive advantages, reduce operating risks, improve corporate efficiency, gain markets, increase product competitiveness and attractiveness, increase customer value, and enhance brand equity [10,11,12,13,14]. Various forms of strategic alliances and cooperation modes have been widely used among various organizations and have received considerable attention from academia and industry [15]. However, there are many factors that affect the success of marketing alliances, but academic research has not reached a conclusion and consensus, which involves corporate culture, marketing alliance capabilities, investment resources, management models, trust, commitment, experience, and performance evaluation timing, standards, and weights [16,17,18]. The establishment and monitoring of the performance evaluation mechanism is one of the key characteristics. After a strategic alliance or marketing alliance has been in operation for a period of time, there must be some specific or jointly recognized performance evaluation indicators for post-alliance strategy or marketing performance evaluation. Cravens, Piercy, and Cravens [19] believe that, for a successful alliance to cooperate, it is necessary to use appropriate indicators to evaluate performance. However, the evaluation indicators must be reliable. The lack of reliability in the evaluation performance means that a consensus cannot be generated or one of the alliance partners does not agree with the evaluation indicators. This has a major negative impact on the marketing alliance [20,21]. However, currently, marketing performance evaluation tools or methods, especially key performance indicators for marketing performance evaluation, are still lacking, and empirical research is also lacking.
Today, due to the popularity of credit cards, in addition to helping banks enter different markets and gain competitive advantages, many banks use credit cards as bridges to enter into contracts with businesses to promote different types of credit cards and to establish marketing alliances to increase profits and also increase customer and consumer satisfaction. In the past, many academic studies have been devoted to evaluating the performance of strategic alliances between various industries [22,23,24,25,26,27,28,29], but they have rarely focused on the performance evaluation of marketing alliances in the catering and banking industries. However, in practice, the catering industry often forms marketing alliances with credit card issuers. Therefore, the purpose of this study is to construct performance evaluation indicators for the marketing alliance between the catering industry and credit card issuing banks.
The study is separated into five sections. The literature review is described in Section 2. Section 3 presents the method. The empirical results and discussions are presented in Section 4, while Section 5 includes the research conclusions.

2. Literature Review

In the past two decades, through the formation of strategic alliances and the knowledge provided by different types of alliance models, companies are increasingly able to see opportunities. In addition, through the formation and execution of alliances, companies can achieve opportunities to enter new markets and improve knowledge and technology. Strategic alliances can be seen as voluntary cooperation agreements between companies that will allow them to gain competitive advantages. Enterprises forming alliances with other industries or enterprises can reduce risks and uncertainties in environmental conditions through activities such as resource connection and cooperation [30]. Marketing alliance is one of these methods. The motivation for companies to use marketing alliances is that marketing alliances have been proven by academia as a way to improve organizational efficiency, improve competitive advantage, and increase product attractiveness. In addition, through the means of marketing alliances, customers’ perceived value, customer satisfaction, and brand equity can be relatively improved [31]. Therefore, strategic alliance is almost a new competitive strategy, and it has been recognized worldwide as an important source of competitive advantage [1]. However, not every company can benefit from marketing alliances. Some studies even show that the failure rate of strategic alliances exceeds 50% [30,32,33]. There are divergent opinions on the failure of the strategic alliance, and no consensus has yet been reached. One of the most important and critical elements is the performance of the alliance after cooperation, which is undeniable. Therefore, this study takes the marketing strategy alliance as the main axis of inquiry and will try to find out what is the most common key factor affecting the performance of the marketing alliance.
Marketing strategy refers to the positioning, promotion, and distribution of the target market, and its purpose is to meet customer needs and accomplish organizational goals; in addition, marketing strategy includes target market strategy, competitive positioning strategy, and marketing portfolio strategy [34]. Banks can improve the number of credit card issuances, customer satisfaction, and competitive advantage through strategic alliances with other industries [35,36]. However, many studies in the past have confirmed that the effectiveness of alliances is not high. The failure rate is more than 60% [33,37,38,39,40]. Therefore, how to measure the performance of marketing alliance is a very important issue for both parties of a marketing alliance because the performance of both parties after the alliance will determine the success or failure of the alliance.
In the past, most of the publications on marketing alliances explored the reasons and motivations for adopting marketing alliances, the cooperation mode of marketing alliances, the selection elements of marketing alliance partners, and the factors affecting the success or failure of marketing alliances. There are not many publications on how to measure the performance of marketing alliances. Cronin [41] defines performance evaluation as a management tool; it consists of tangible performance data obtained under a meaningful organizational evaluation. Beer et al. [42] pointed out that the main tools of performance evaluation and management include a balanced scorecard, benchmarking, competence management, and management by objectives. Marketing alliance is a cooperative business behavior. The satisfaction of both parties to the alliance will affect subsequent decision-making, and performance is the most critical variable that affects satisfaction. After the marketing alliance has been in operation for a period of time, its performance should be evaluated with a complete and comprehensive indicator. Continuous performance evaluation and continuous good performance will become a force for the stability of marketing alliance cooperation, and poor performance results may lead to instability and partner withdrawal [29]. Therefore, the performance evaluation mechanism of the marketing alliance is very important. However, the previous publications on the performance evaluation mechanism of marketing or strategic alliances are not complete. Some publications use subjective indicators, such as perceptual satisfaction [43], and some use objective indicators, such as profit and sales growth [44] or operating income and costs [45]. Most of the publications do not comprehensively explore the performance indicators of marketing alliances.
Because the performance of strategic alliances is related to whether the company’s alliance strategy is appropriate, the accuracy of performance evaluation is necessary. The differences in the resources invested by the alliance companies and the motivations of the alliance make the companies themselves have different identifications of performance. Therefore, it is not easy to measure performance with a single indicator. The performance of strategic alliances will be measured based on their different goals, and the measurement indicators will also be different. Early scholars such as Tomlinson [46] and Pekar [47] believed that the performance of strategic alliances should be based on objective financial indicators such as profit, sales rate, and return on investment. However, the research of Anderson [48] shows that the short-term financial performance of strategic alliances is not significant due to the instability and risk of the alliances. If only financial indicators are used as the measurement, the performance of strategic alliances cannot be truly reflected. Therefore, four indicators are used as the measurement of alliance performance: (1) Type of alliance organization; appropriateness, productivity, financial resource indicators, adaptability and innovation capabilities. (2) Learning ability; different markets and different technologies. (3) Measurement of market performance; market share, customer satisfaction. (4) Measurement of financial performance; profitability, cash flow. Harrigan [49] uses three indicators to measure the performance of strategic alliances: whether the alliance is still going on, the performance time of the alliance, and the parent company’s subjective evaluation of the success of the alliance. According to the publications, the performance measurement of strategic alliances can be roughly divided into three directions: financial performance, operating performance, and organizational efficiency performance [50]. Kaplan and Norton [51] proposed the following three principles to illustrate the relationship between the balanced scorecard and key performance indicators (KPI): (1) Pay attention to causality. (2) Including lagging indicators and leading indicators. (3) Link financial goals. Balkovskaya and Filneva [52] took one of the regional banks in Russia as an example, constructed a balanced scorecard (BSC) strategy map for banking institutions, and selected key evaluation indicators for bank performance through relevant literature analysis. They then used an objective method to determine the causal relationship between KPIs, that is, the direction and intensity of their mutual influence, and defined the most strategically significant indicators, which could help managers determine the priority of their strategic steps within the limited resources so as to view the strategy of their bank in the most effective way. Keshavarz, Ftahikenari, Rohani, and Bagheri [53] used balanced scorecards to construct performance evaluation indicators for the three major banks in Iran’s banking industry and used fuzzy analytic hierarchy process (AHP) to select the relative weights of the indicators. Karasneh and Al-Dahir [54] also took the performance evaluation of the banking industry as an empirical object and pointed out that the balanced scorecard is a promising tool for organizations to evaluate their performance. In addition, Kim and Lee [55] suggested that the balanced scorecard can be considered as a tool for performance measurement in various fields. Lucie and Iveta [56] also support this view; they claim that it is a very common method to choose the balanced scorecard method as the key performance indicator for management. Therefore, the balanced scorecard can comprehensively measure the performance indicators of the marketing alliance.

3. Methods

In order to objectively find out the performance factors and indicators that affect the marketing alliance between credit card issuing banks and the catering industry, and for them to be accepted by industry decision makers as a key performance indicator model, this study first conducts a detailed literature review to find relevant publications that have reported on factors and indicators related to key performance indicators and to classify them. Secondly, the expert Delphi method is implemented, and a group of experts, including academics, government agencies, catering companies, and banks with experience in issuing credit cards, is invited to screen and evaluate the identified factors to identify the performance factors and indicators of marketing alliances between credit card issuing banks and the catering industry. After they have reached a consensus, the attributes are determined for the subsequent fuzzy analytic hierarchy process (AHP) method. In addition, the four major aspects of the balanced scorecard are used as the framework for performance evaluation. Because these four aspects cannot fully reflect the explored issues and the required goals in this study, another factor related to the performance of marketing alliances was also used. Therefore, a total of five major factors for performance evaluation are used as the main axis of this study. Finally, a fuzzy AHP analysis method is performed, scores are assigned according to different attributes or standards, and a priority order of index importance is established.

3.1. Delphi

The Delphi method has the characteristics of structuring group communication procedures, making the communication process more efficient, making a group of people look like a whole, and effectively solving complex problems [57]. The expert Delphi method is to obtain answers to questions by collecting expert opinions [58]. This is the most commonly used Delphi method. In this way of collecting data, the researchers design the questionnaire and send the completed questionnaire to a specific group of experts to complete. After the first round of recovery, the researchers must summarize the results of the questionnaire and, at the same time, design the second round of questionnaires based on the inconsistent results of the first round of questionnaires. Then, the second round of questionnaires are sent to the same experts, and they complete them. Such a procedure continues until expert opinions are unanimous.
The expert Delphi method is recognized as an appropriate way to determine the core or thematic elements of a problem; its purpose is to reduce implicit and complex knowledge and objectively clarify possible evaluations or opinions in a single sentence [58]. Because the selection and determination of key performance indicators is a complex process, this study uses a modified expert Delphi method. Its practice in the first round is to conduct an in-depth literature review on the types, motives, and management mechanisms that affect the credit card issuing bank and the catering industry marketing alliance and then establish the key factors and indicators that affect the marketing alliance performance. In the second round, the collected factors and indicators are submitted to the expert group for confirmation. In the third round, the consensus and results of the second round are submitted to experts for verification again. In this way, a total of three rounds are performed. When all factors have reached convergence and consistency, the method achieves the target task. The expert Delphi method is subject-proven and can fully demonstrate that some complex issues or opinions are grouped into a specific group of attributes [59]. Therefore, many studies have used the expert Delphi method to solve some problems related to the tourism catering industry [60,61,62]. The application of the Delphi method to strategic alliances is also quite extensive [63,64,65,66].
The questionnaires for the Delphi method used in this study included senior managers of credit card issuing banks and the catering industry, government authorities, and academic research experts. The first round of questionnaires provided a list of attributes derived from literature reviews, asking about the performance factors and possible impact attributes of any credit card issuing bank and catering industry marketing alliance. Respondents expressed agreement or disagreement with a Likert 5-point scale for each item. In the first round, 20 experts received the questionnaire, and the responses of 19 questionnaires provided a 95% actual rate of return. After descriptive data analysis, the coefficient of variation of 32 attributes was less than or equal to 0.3, and the degree of consistency and convergence was high; therefore, all 30 attributes were retained. Based on the results of the first round, the results were sent back to the experts, asking them to reconsider their opinions, and asking if there were any objections, opinions, or views on the results of the first round. Therefore, after the discussion of two rounds, the experts reached a set of 5 first-level indicators and 30 second-level indicators. After completion, 5 selected first-level indicators and 30 second-level indicators, a total of 35 indicators, were applied to the fuzzy analytic hierarchy method, and the expert group determined the true weight and importance of each indicator.

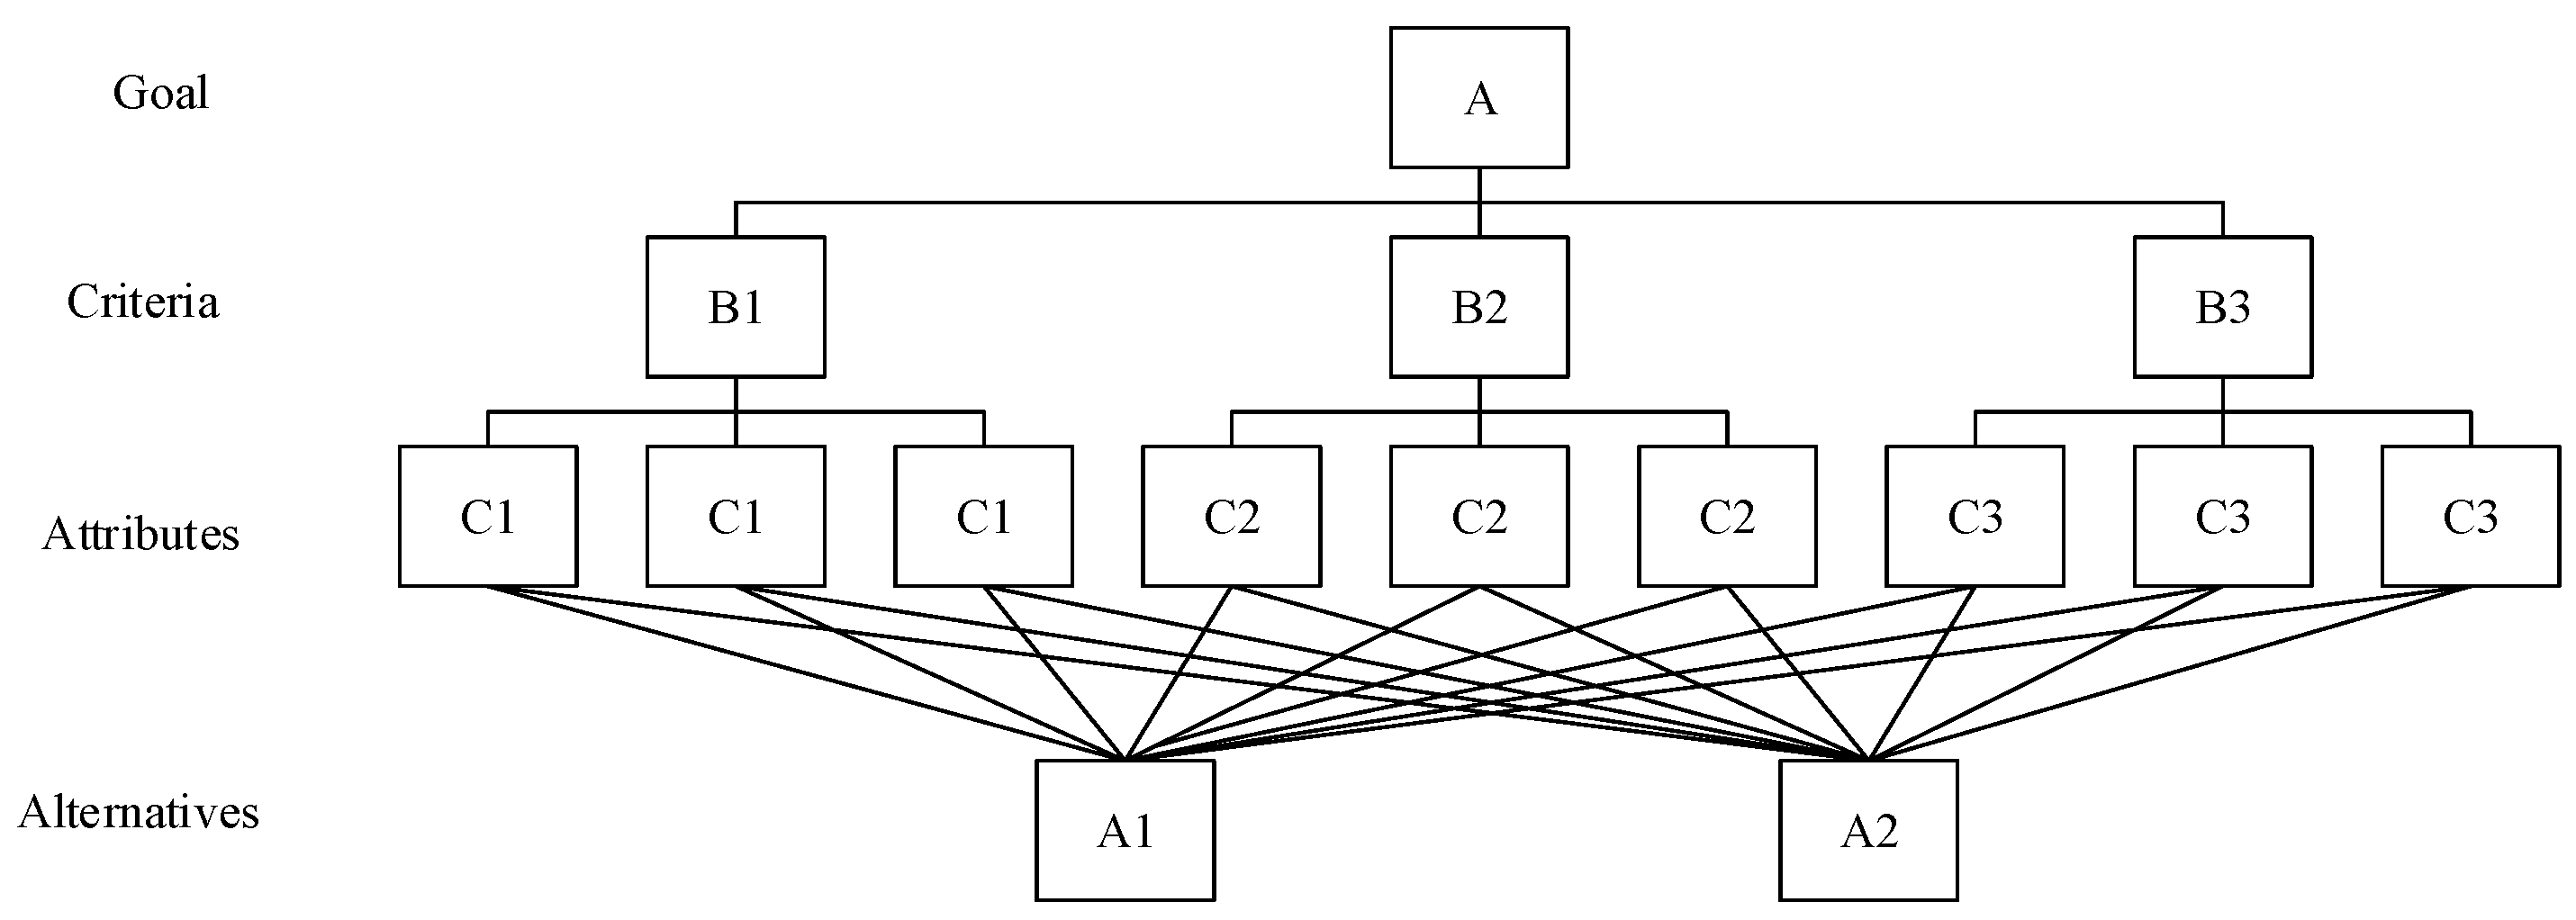
3.2. AHP and Fuzzy AHP

The AHP method is a multi-criteria decision analysis method [67,68]. It has two uses in risk analysis: The first is to decompose and identify the risk factors layer by layer until the most basic risk factors are found; this is also known as forward decomposition. The second is to compare the importance of risk factors at the same layer and list the judgment matrix of the risk factors at the same layer (the judgment matrix can be obtained by expert investigation). The characteristic root of the judgment matrix is the weight of each risk factor at the layer. Using the combination of weights and the probability distribution of risk factors at the same layer, the probability distribution of the risk of the previous layer is obtained until the probability distribution of the total target is obtained; this is also known as reverse synthesis [67,69].
The AHP method is mainly applicable to uncertain situations and decision-making problems with multiple evaluation criteria. The biggest feature is to systematize complex and unstructured problems and use a hierarchical structure to systematically link the complex relationships between the influencing factors; the pairwise comparison between the two factors allows the decision makers’ intentions to be more clearly reflected [68]. It can improve the decision-making process that relied on intuition in the past, carry out hierarchical system integration analysis in clear layers, and increase the reliability of the assessment [69].
Because the analysis-level procedure method constructs complex multi-objective decision-making problems into a hierarchy structure, each layer is composed of different elements, and the complex problems are moved from high level to low level. This step by step decomposition means that many qualitative factors can be dealt with systematically. The entire decision-making process is judged by the hierarchical relationship constructed by the criteria and alternatives, so as to obtain the priority of each plan. The larger the value, the higher the priority of the adopted plan [70]. In the analysis process, the AHP method uses eigenvectors to determine the priority order among the elements of a certain hierarchical level and calculates an individual element’s eigenvalue, which is then used as the basis for evaluating the relative importance of each pairwise comparison matrix performed on a nominal scale. If the opinion of experts is consistent, the priority value represented by the eigenvectors can be used as a basis for a decision or selection [67]. Basically, the relative weights are calculated in the form of eigenvector values, and the weight of each alternative is finally obtained by multiplying the sum of the eigenvector values of each hierarchy.
The use of analytic hierarchy process to solve practical problems generally includes four steps [71]: (1) Establish a hierarchical structure of the researched problem; define the performance index problem, confirm the goal, and identify the criteria and attributes that must meet the goal. In the problem hierarchy, goals are at the first level, criteria are at the second level, attributes are at the third level, and decision-making alternatives are at the fourth level (Figure 1). (2) Establish a pairwise comparison judgment matrix: There are N factors in the hierarchy and a total of [N*(N − 1)]/2 combinations according to the pairing method. The elements at a particular hierarchical level are compared using a nine-point numerical scale to define how much more important one element is from another [72]. An example of the pair comparison numerical scale of the AHP method is shown in Table 1 [73]. If A and B are the elements at a particular hierarchical level to compare, “1/9” means that B is of absolute importance, “1” means that A and B are of equal importance, and “9” means that A is of absolute importance. All pairwise comparisons are given in a judgment matrix [72]. (3) Solve the weight of each level and verify its consistency: For calculating the relative weight of each element from the judgment matrix, the AHP method adopts the eigenvector method. Because the comparisons in the judgement matrix are made subjectively, consistency test need to be performed. The consistency test is based on Saaty’s [67] recommendations, using consistency index (C.I.) and consistency ratio (C.R.) to test. C.I. is the degree of difference between the maximum eigenvalue (λmax) and the order (n), which can be used as an evaluation criterion for judging the consistency. The calculation method is C.I. = (λmax − n)/n − 1. If the C.I. value is smaller, the consistency is higher; if C.I. ≦ 0.1, it means that the pairwise comparison matrix has satisfactory consistency. C.R. means that the size of the C.I. will be affected by the order of the matrix and the number of evaluation scales, namely C.R. = C.I./R.I. R.I. is a random index, derived from a randomly generated positive reciprocal matrix. The greater the R.I. value increases with the order of the matrix, if C.R. ≦ 0.1, it means that the rating in the pairwise comparison matrix is acceptable. (4) Solve the dominance value of each decision alternative: After passing the consistency test, the dominance value of each decision alternative can be calculated; this is obtained by multiplying the weights of each level and adding them up. The larger the value, the more preferred the alternative is.
Zadeh [74] proposed the fuzzy set theory and initiated the development of fuzzy theory. Decision-making in real life is usually carried out in a fuzzy environment. When the decision-making environment becomes increasingly complex and includes much individual subjective judgment, the fuzzy view is much more important [75]. Zadeh [74] introduced the concept of the fuzzy set, which aims to solve uncertainty and fuzziness in the real environment. In order to improve the subjective, inaccurate, and fuzzy problems of the pairwise comparison matrices in traditional AHP, Van Laarhoven and Pedrvcz [76] applied fuzzy set theory to bring triangular fuzzy numbers into the pairwise comparison matrix and developed AHP into fuzzy AHP [77].
Fuzzy theory uses the concept of membership function to make up for the problem of uncertainty in traditional logic. The concept of the fuzzy set can measure fuzzy nature, and can also express concepts that cannot be clearly defined in reality. Buckley [78] believes that the traditional AHP method is simple and practical in the evaluation of criteria, but the pairwise comparison must be expressed in absolute values, which does not conform to the uncertain and vague nature of human subjective judgment so it cannot properly present the subjective cognition and judgment of the evaluator. Therefore, fuzzy theory is combined with AHP to propose a fuzzy AHP method. The fuzzy AHP method combines the advantage of fuzzy theory to solve the ambiguity of subjective cognitive judgment and the AHP method to analyze and understand the nature of the problem, and it can reflect the problems encountered in decision analysis in the real environment. The following is a brief description of several important basic concepts of fuzzy theory:
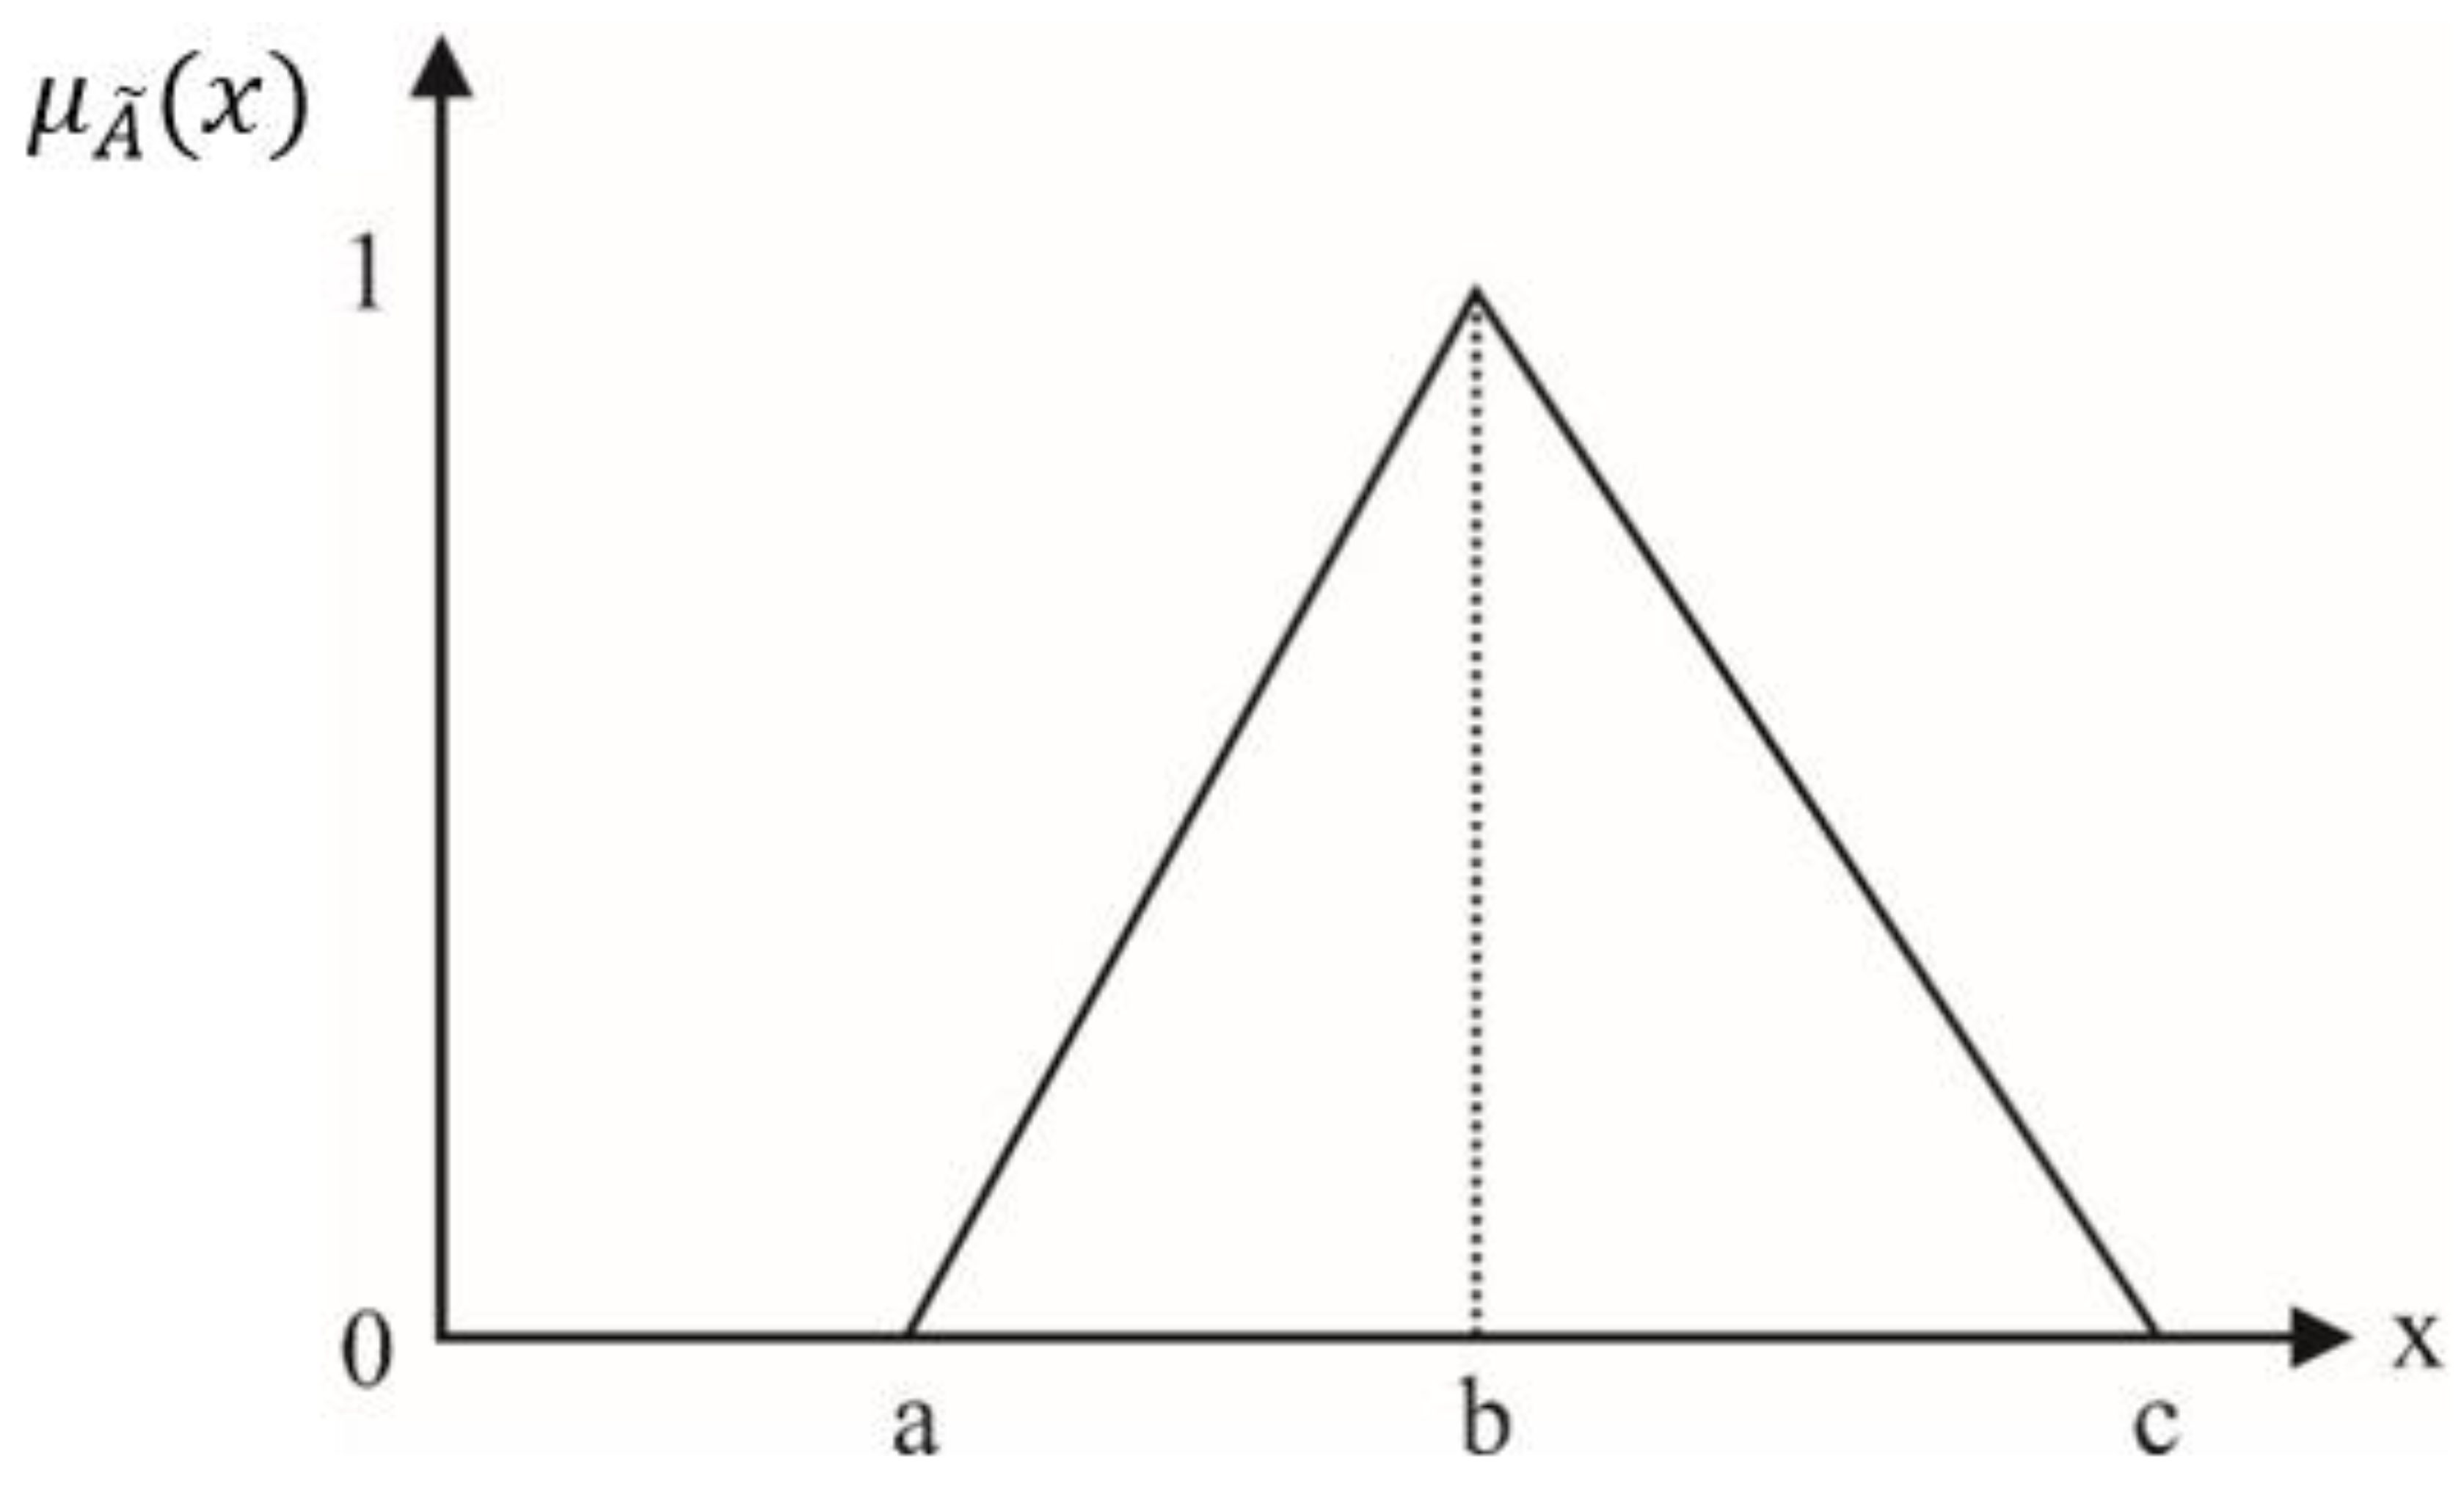
  • Attribution function: Fuzzy set refers to a set of things with unclear boundaries and specific properties. The concept of the fuzzy set is that whether an element, x 1 , belongs to a set, A ˜ , is no longer a question of “if it is or not “, but rather an attribute value of 0 to 1 is used to indicate the degree of x 1 belonging to A ˜ . Expressed as a function as Formula (1):
    μ A ˜ ( x 1 ) = { 0 1 x 1 1 0 ,   i f ,   i f ,   i f x 1 x 1 x 1 A ˜ A ˜ A ˜
    μ A ˜ ( x 1 ) is called the attribute function of x 1 in fuzzy set A ˜ . It can be understood from the formula of (1) that any function value can become a membership function as long as it is between 0 and 1 and conforms to common sense. If μ A ˜ ( x 1 ) is closer to 1, it means a higher degree of x 1 belonging to A ˜ . Suppose U is a universe of discourse, and A ˜ is a fuzzy subset of U. If a number, μ A ˜ ( x 1 ) [ 0 , 1 ] , is assigned to each x 1 U , it is used to represent the degree of belonging of x 1 to A ˜ , referred to as the degree of belonging of x 1 ; that is μ A ˜ ( x 1 ) U [ 0 , 1 ] , and μ A ˜ ( x 1 ) is called the attribution function of A ˜ [79].
    When the attribution function is determined, the fuzzy set is also determined. How to choose an appropriate attribution function is often the key to determining whether the attribution function can be successfully applied. The most commonly used attribute function is the triangular fuzzy attribution function. The triangular fuzzy attribution function graph is shown in Figure 2, and the three value points (a,b,c) are denoted as fuzzy events. The attribution function can be defined as Formula (2) [72,80]:
    μ A ˜ ( x ) = { 0 ,    i f   x < a x a b a ,    i f   a x b c x c b ,     i f   b x c 1 ,    i f   x > c
    A fuzzy number can always be given by its corresponding left and right representation of each degree of membership [71,80]:
    A ˜ = ( A I ( y ) , A r ( y ) ) = ( a + ( b a ) y ,   c + ( b c ) y ) ,   y ( 0 , 1 )
    where l(y)and r(y) denote the left side representation and the right side representation of a fuzzy number, respectively. The algebraic operations with fuzzy numbers can be found in Kahraman, Ruan, and Tolga [81] and Kahraman, Cebeci, and Ulukan [82].
  • Semantic variables: The language used in human thinking and communication is called natural language, and an important feature of natural language is its vagueness [79]. Semantic variables are the use of words in human natural language to express the degree of perception of someone or something, rather than conveying them in a numerical form. For example, we often use the language “very good”, “good”, “normal”, “poor”, “very bad”, etc. to express the subjective judgment of the evaluator. Therefore, we divide the semantic variables into several appropriate semantic scales and let the evaluators choose the semantic meaning they thought was appropriate to describe their feelings about a certain evaluation item. Furthermore, the fuzzy number was expressed through various semantic scales designed in advance, and it was used to calculate the actual feeling value of all the judges on the evaluation item.
  • Defuzzication: Defuzzification is to convert fuzzy set data into clear data. There are many different ways of defuzzification, and there is no definite method, which depends on the nature of the problem. The commonly used methods are as follows:
    (1)
    Center of Gravity Method: This method is used to calculate the attribution function of the fuzzy number and the center of gravity of the area enclosed by the domain of the attribution function, and then uses the center of gravity as the definite value of the fuzzy number, which is the attribution degree of the semantic variable. Assuming that the attribution function of fuzzy set A ˜ is μ A ˜ ( x 1 ) , the weight is also a fuzzy function, denoted by g ( x 1 ) , and F is the position of the center of gravity of the fuzzy set, as in Formula (4):
    F = g ( x 1 ) × μ A ˜ ( x 1 ) μ A ˜ ( x 1 )
    (2)
    Mean of Maximum Method: This method uses the element value with the highest membership value in the attribution function as the clear value for the defuzzification of the fuzzy set. However, if there is more than one element with the highest membership value, all corresponding element values must be taken as an average, and this average represents the defuzzification value.
In clear AHP, a discrete scale from 1 to 9 is used to determine the priority of one decision variable relative to another decision variable while, in fuzzy AHP, fuzzy numbers or semantic variables are used. In fact, decision makers usually prefer triangular or trapezoidal fuzzy numbers. Because fuzzy numbers are used in fuzzy AHP, the solution method is different from clear AHP [72,80]. The most common method used to solve the application of fuzzy AHP is the extent analysis method proposed by Chang [83]. This research uses this method to solve fuzzy AHP. Please refer to Kahraman et al. [80] and Kilincci and Onal [72] for detailed inference process.
In this study, the marketing strategy alliances of different industries have multiple evaluation criteria, goals, and attributes as well as subjective judgments involving enterprise managers. The AHP is suitable as a group decision method [84]. The judgment or performance evaluation of the marketing strategy alliance plan by the managers may produce ambiguity; that is, the judgment value may be an interval judgment value instead of only one judgment value. Fuzzy AHP, which combines fuzzy theory [74] and the AHP method, can reflect the fuzzy judgment of the decision maker. Therefore, fuzzy AHP is suitable for analyzing the ranking of key performance indicators of the marketing alliance between credit card issuing banks and the catering industry in this study.

3.3. The Combining of Fuzzy AHP and Balance Scorecard

Because the performance of strategic alliances is related to whether the company’s alliance strategy is appropriate, the accuracy of performance evaluation is necessary. Early scholars such as Tomlinson [46] and Pekar [47] believed that the performance of strategic alliances should be based on objective financial indicators such as profitability, sales rate, and investment returns. However, financial indicators alone cannot fully reflect the performance of the alliance. In the research of Anderson [48], strategic alliances, because of their instability and risk among alliances, and short-term financial performance are not significant so, if the financial indicators are used as a measure, they cannot truly reflect the performance of strategic alliances. Therefore, they adopt alliance organization, status, learning ability, market performance, and financial performance as the standard for measurement. The balanced scorecard (BSC) is a comprehensive evaluation of financial and non-financial indicators as a standard for performance evaluation and includes the four major aspects of finance, customers, internal processes, and learning and growth. Kim and Lee [55] pointed out that the BSC is regarded as a tool for performance measurement in various fields. Lucie and Iveta [56] and Lucas, Sandra Mara, Vinicius, and Sandra [85] also support this view. Balkovskaya and Filneva [52] constructed a balanced scorecard strategy map for banking institutions, and they pointed out that it can help managers prioritize their strategic steps within limited resources so that they can browse their bank’s strategy. Therefore, this study uses the BSC as the performance evaluation method for the catering industry and the credit card issuing bank marketing alliance. In addition to the four aspects of the BSC, Whipple and Frankel [86] and Lambe, Spekman and Hunt [32] all pointed out that affecting marketing alliance performance also includes trust and senior management support, the ability to meet performance expectations, clear goals, and partner compatibility. Therefore, this study adds the alliance cooperation aspect as the fifth aspect that forms an improved BSC.
The purpose of this research is to find out the key performance indicators that affect the credit card issuing bank and the catering industry marketing alliance, and to classify, score, and judge the weight of each factor that affects the overall performance. Because marketing strategy alliances in different industries have multiple evaluation criteria, objectives and attributes, and subjective judgments involving managers, in many studies, fuzzy AHP and the BSC are often integrated to explore performance evaluation and key performance indicators in various fields, including ERP systems [87], banking performance [53,88], the IT industry [89], the hotel Industry [90], the logistics industry [91], supply chain [92], the manufacturing industry [93], the medical service industry [94], and strategy management [95]. Therefore, it is undoubtedly feasible to integrate fuzzy AHP and the improved BSC in performance evaluation. Compared with other fuzzy AHP methods and traditional AHP, this study adopts Chang’s [83] degree analysis method because it is easier to express and use.

4. Results and Discussion

4.1. Performance Evaluation Indicators for the Marketing Alliance between the Catering Industry and Credit Card Issuing Banks

Using the Delphi method, after obtaining consensus through three round-trip questionnaire surveys by 19 experts, the empirical results obtained two-level performance indicators, as shown in Table 2. The results in Table 2 show that 19 experts in practice and academia agree that the first level performance indicators of the catering industry and credit card issuing bank marketing alliance can be divided into five aspects, namely customer aspect, alliance cooperation aspect, financial aspect, internal process aspect, and learning and growth aspect. Lee, Brownlee, Kim, and Lee [95] pointed out that traditional performance indicators rely too much on financial performance such as market share, revenue, and profit and cannot truly reflect overall organizational performance, and may even provide wrong guidance information because financial performance cannot capture and reflect organizations’ intangible assets such as customer loyalty, employee satisfaction, and organizational innovation [96,97]. Therefore, when evaluating organizational performance, it is necessary to consider non-financial performance measures. Kaplan and Norton [98] claimed that the formation of organizational strategy must be based on the organization’s mission, and the success of strategy implementation determines the organization’s financial performance. Kaplan [99] pointed out that non-financial performance measures can bridge the gap between the organization’s operational measures and mission/strategy, shift the focus from initiatives to performance results, and enhance overall performance indicators by combining organizational initiatives with individual/department levels [95]. In fact, non-financial performance measures have been widely valued by academic and practical fields [95]. Kasie and Belay [100] also pointed out that companies that use important financial and non-financial indicators to measure their performance can achieve better business performance. Even though some companies are currently using non-financial indicators, research indicates that these non-financial indicators are not integrated with each other, nor with financial indicators and strategic goals [100]. Morten [101] pointed out that the use of non-financial performance measures for strategy implementation is quite effective. Kaplan and Norton’s balanced scorecard has been developed into a good strategy execution tool that integrates financial and non-financial performance indicators to improve the company’s strategic goals [98]. Gan and Simerly [102] indicated that non-financial performance measures such as productivity, customer satisfaction, employee satisfaction, market share percentage, strategic goals, quality measures, and operational efficiency have been identified as being valuable because they supply additional information about managerial behavior, provide more timely feedback, and alleviate the inherent risk as well as noise in financial measures. Therefore, the four aspects of the balanced scorecard include finance, customers, internal processes, and learning and growth, which can be used to evaluate the business performance of strategic alliances between companies and support the opinions of experts in this research.
The second level of performance indicators in the customer aspect may include customer source, reuse (purchase) willingness, customer growth rate, the willingness to recommend others, customer satisfaction, and the perceived image of caterings and banks. Kaplan and Norton [51] pointed out that the performance measurement indicators of the customer aspect include five core metrics: market share, customer continuity, customer acquisition rate, customer satisfaction, and customer profitability. Additionally, to improve customer loyalty and satisfaction, the customer value proposition includes the attributes of products and services, customer relationships, image, and goodwill. Fyall, Garrod, and Leask [31] also pointed out that, in the customer aspect, it is necessary to emphasize customer value, customer number, customer satisfaction, service quality, customer behavior before and after purchase, after-sales service, etc., in order to improve customer loyalty and repurchase behavior, and to attract new customers. These results are roughly consistent with the research results of Kaplan [103], Kaplan and Norton [51], Kalagnanam and Krueger [104], Hussain and Hoque [105], and Režňáková, Karas, and Strnadová [106]. The second level of performance indicators in the alliance cooperation aspect may include the commitment of partners, satisfaction of partners, value of partners, value of corporate image, loyalty of partners, and industry relations. These results are roughly consistent with the research results of Medina-Munoz and Garcia-Falcon [107] (2000), Whipple and Frankel [86], Hoffman and Schlosser [108], Chen and Tseng [109], and Pansiri [110]. There are many factors that affect the performance of marketing alliances, such as key know-how, trust, protectiveness, complementarity, cultural distance, etc. [111]. Whipple and Frankel [86] and Lambe, Spekman, and Hunt [32] both discussed the influence of marketing alliance performance factors such as trust, senior management support, ability (ability to meet performance expectations), goals (clear goals), and partner compatibility. Heimeriks and Duysters [11] advocated the idea that the factors that affect alliance performance have ability (alliance capability), experience, and governance mechanisms. Wittman, Hunt, and Arnett [112] proposed that the influence of alliance performance includes relationship, commitment, communication, idiosyncratic resources, excellent competences, and top management support. Other factors or indicators include knowledge sharing [113], power sharing [114], social capital [115], partner satisfaction, and alliance cooperation stability [116]. The second level of performance indicators in the financial aspect may include cost, sale revenue, net profit, average consumption per customer, and market share. These results are consistent with the research results of Kaplan [103], Evans [24], and Carlo, Cugini, and Zerbini [117]. Kaplan [103] pointed out that each stage of an enterprise pursues different financial goals, but no matter which stage, it is driven by three financial themes: (1) revenue and growth portfolio; (2) cost reduction and productivity increase; (3) Asset utilization and investment strategy.
The second level of performance indicators in the internal process aspect may include resource integration ability, marketing strategy and management ability, diversified operating capacity, efficiency, brand equity, deviation rate, and number of customer complaints. The internal process aspect of an enterprise cares about how to achieve customer satisfaction and the financial goals of the enterprise. Through the operation process, products and services are delivered to customers and, finally, after-sales service is provided so that customers can obtain the greatest satisfaction from products or services. In this study, both parties in the marketing alliance are constantly seeking the best ways to increase their performance and market share in order to increase revenue, customer numbers, and customer satisfaction [118]. Both the credit card and catering industries are quite competitive industries. In order to surpass competitors, managers must have excellent leadership skills and know how to create more value and attract more customers. This is a big challenge for managers. Therefore, managers’ ability to integrate resources, diversified operations, brand equity, marketing strategies, and management capabilities, etc., must be strengthened by the company’s internal operating processes. The second level of performance indicators in the learning and growth aspect may include employee productivity, human quality improvement, employee satisfaction, employee loyalty, and an increase in employees. Kaplan and Norton [51] believe that this aspect is used to create an infrastructure that must be established for the long-term growth and progress of the organization. In the fiercely competitive environment, it is impossible for companies to achieve the long-term goals of customers and internal processes with today’s technology and capabilities. Only by continuously improving their abilities through learning and growth can companies improve their internal processes and pursue the goals of customers and financial aspects. Among the measurement indicators of the learning growth aspect, the motivation dimension broadly includes employee motivation, authorization, and consistency between employee goals and corporate goals. In terms of information system capabilities, it includes system availability, timeliness, and accuracy. In terms of staff, it includes staff training, technology, satisfaction, and continuity rate. Therefore, the learning and growth aspect is the driver of the success of the other three dimensions [93]. Employee abilities and skills are regarded as the main drivers of productivity and performance. In order to bring the marketing alliance between the issuing bank and the catering industry to the best competitive conditions, managers must provide opportunities to improve the skills and knowledge of employees through training and development plans. More skilled workers have higher productivity, and training sufficient staff can improve the quality of services [119]. Therefore, abundant outstanding personnel is a key factor for the success or failure of future marketing alliance performance. In the selection of indicators, Kim, Suh, and Hwang [120] pointed out that these include employee skills, knowledge, education/training, participation, loyalty, absenteeism, turnover, job/pay satisfaction, etc.
Table 2. Performance indicators of catering industry and credit card issuing bank marketing alliance.
First Level IndicatorsSecond Level IndicatorsDefinitionReference
Customer aspect1. customer sourceCustomer source level: whether occupation, social status, education level, age, different residence, etc., have changedRothaermel and Boeker (2008) [121]
2. customer growth rateAnnual growth rate of new customers using alliance credit cardsFyall, Garrod, and Leask (2002) [31]
3. customer satisfactionCustomer satisfaction with alliance credit cardsFyall, Garrod, and Leask (2002) [31]
4. service qualityCustomer satisfaction with the service quality of the catering industry and the issuing banksFyall, Garrod, and Leask (2002) [31]
5. reuse (purchase) willingnessCustomers’ willingness to use or reuse credit cards.Fyall, Garrod, and Leask (2002) [31]
6. the willingness to recommend othersThe willingness of customers to recommend alliance credit cards to others.Fyall, Garrod, and Leask (2002) [31]
7. the perceived image of the catering industry and banksFor every one hundred people, the number who know the catering industry and the issuing banksFyall, Garrod, and Leask (2002) [31]
Alliance cooperation aspect1. commitment of partnersThe degree of mutual commitment between the catering industry and the bankWittman, Hunt and Arnett (2009) [112]
2. value of partnersThe degree of contribution to market value and customer value that may be generated after the marketing allianceFranco (2012) [17]
3. loyalty of partnersDegree of trust and loyalty with partners and willingness to maintain long-term cooperative relationsSolesvik and Westhead (2010) [18]
4. satisfaction of partnersThe degree of mutual satisfaction between the catering industry and the banksDas and Teng (2003) [116]
5. value of corporate imageThe degree of influence of the catering industry and bank cooperation on corporate image valueChen and Tseng (2005) [109]
6. industry relationWhether the cooperation relationship and experience with other industries have been improvedHitt et al. (2004) [122]
Financial aspect1. costDirect and indirect costs of the catering industry and bank marketing alliance cooperationHitt et al. (2004) [122]
2. net profitThe profit generated after the catering industry and the bank cooperateHitt et al. (2004) [122]
3. market shareMarket share after catering industry and bank cooperationHitt et al. (2004) [122]
4. sale revenueIncrease or decrease in operating income after catering industry and bank cooperationHitt, et al. (2004) [122]
5. average consumption per customerThe average amount spent and the number of credit card uses per customerChen and Tseng (2005) [109]
Internal process aspect1. resource integration abilityEnhancement of the ability of the catering industry and banks to integrate internal and external resourcesChand and Katou (2012) [16]
2. diversified operating capacityWhether the diversified management capabilities of the catering industry and banks will be improved after the strategic allianceChand and Katou (2012) [16]
3. brand equityCustomers’ recognition of brand equity after the catering industry and bank jointly issued credit cardsBiel (1992) [123]
4. number of customer complaintsThe number of customers complaints about the effectiveness of the joint issuance of credit cards by the catering industry and banksKaplan and Norton(1996) [51]
5. marketing strategy and management abilityWhether the marketing strategy and management capabilities of the catering industry and bank cooperation have been improved.Hitt et al. (2004) [122]
6. efficiencyWhether the management efficiency of the catering industry or bank cooperation with different industries has been improvedRothaermel and Boeker (2008) [121]
7. departure rateCustomers abandon or increase the usage rate of credit cards every yearFyall, Garrod, and Leask (2002) [31]
Learning and growth aspect1. employee productivityWhether the marketing ability, management ability, and productivity of employees after the catering industry and bank marketing cooperation have improvedKusluvan and Kusluvan (2000) [119]
2. employee satisfactionEmployee satisfaction after catering industry and bank marketing cooperationKim, Suh, and Hwang (2003) [120]
3. increase in employeesThe number of employees increased after catering industry and bank marketing cooperationKim, Suh, and Hwang (2003) [120]
4. human quality improvementImproved manpower quality after catering industry and bank cooperationKusluvan and Kusluvan (2000) [119]
5. employee loyaltyEmployee loyalty after catering industry and bank marketing cooperationKim, Suh, and Hwang (2003) [120]

4.2. The Relative Importance Ranking of Five Performance Aspect

The performance evaluation of the catering industry and credit card issuing bank marketing alliance includes the first-level indicator, which has five aspects, and the second-level indicator, which includes seven customer factors, six alliance cooperation factors, five financial factors, seven internal processes, and five learning and growth factors, which makes a total of 30 factors. The 29 experts then completed a fuzzy AHP questionnaire to get the relative importance ranking of each level of indicators.
The results show that the weight of customer aspect (0.264) is much larger than other aspects, which shows that the most important key aspects of the performance indicator of marketing alliance between the catering industry and credit card issuing banks is the customer aspect, followed by the financial aspect (0.231), the alliance cooperation aspect (0.188), the learning and growth aspect (0.159), and the internal process aspect (0.158), as shown in Table 3. Whether it is the catering industry or the credit card issuing bank, increasing the number of customers is most important because it can improve the company’s financial performance [51,98]. Therefore, it is reasonable that the customer aspect is the most valued for the performance measurement indicators of the marketing alliances in these two industries. Pursuing the financial aspect of revenue and profitable growth is the ultimate goal of a for-profit company. Therefore, the marketing alliance between the catering industry and the credit card bank pays more attention to the financial aspect than other internal operational aspects. The success or failure of the marketing alliance between the catering industry and the credit card bank has a great relationship with whether there is a benign cooperation between the alliances. Therefore, in terms of performance measurement, the alliance cooperation aspect will also be paid more attention to compared to the internal operational aspect. Learning and growth are the key to achieving internal process optimization. Therefore, for the performance measurement of marketing alliances, the learning and growth aspect is also more important than the internal process aspect. The evaluation results of the relative importance of these marketing alliance performance indicators are roughly consistent with the views of Kaplan and Norton [98].

4.3. The Relative Importance Ranking of Performance Indicators for the Customer Aspect

In terms of the customer aspect of influencing performance indicators, the weight of factors that recommend to others’ wishes (0.05) is the highest, followed by the reuse (purchase) willingness (0.046), service quality (0.044), customer satisfaction (0.037), catering and bank perception image (0.031), customer source (0.031), and customer growth rate (0.026), as shown in Table 4. The willingness of customers to recommend to others refers to the willingness of customers to recommend alliance credit cards to others. If the customer is willing to recommend the alliance credit card to others, it means that the customer is loyal to the alliance credit card and may reuse it. The strategy of improving customer loyalty is a necessary condition for attracting new customers and retaining old customers to improve the company’s sustainable competitiveness [124]. Lai [125] also pointed out that recommendations from highly loyal customers is a successful and low-cost way to promote business in the banking industry. Therefore, the most important performance indicator for customers is the willingness to recommend to others, followed by the willingness to reuse. Qasem and Alhakimi [126] pointed out that satisfaction with banking services is only the starting point for building long-term relationships with customers. Customer loyalty is one of the main determinants of a marketing partnership. However, how to convert customer satisfaction into loyalty is a key issue. Therefore, customer loyalty relative to customer satisfaction is more important for marketing alliances. In addition, higher service quality will bring higher customer satisfaction and loyalty, and satisfaction is an important intermediary to improve the loyalty to bank customers by developing excellent service quality. Therefore, service quality and customer satisfaction are also important performance indicators for the customer aspect. The perceptual image of catering and banks refers to the number of people who know the catering industry and issuing banks, while the customer growth rate refers to the growth rate of new customers using alliance credit cards each year and the source of customers refers to customers at different levels. The most important purpose of loyal customer recommendation is to increase the source of new customers [125]. The increase in the number of customers using alliance credit cards can improve the performance of the alliance. Therefore, the catering industry, bank perception image, customer source, and customer growth rate are also the secondary performance indicators of the marketing alliance.

4.4. The Relative Importance Ranking of Performance Indicators for the Financial Aspect

In terms of the financial aspect of affecting performance indicators, the weight of cost factors (0.06) is the highest, followed by net profit (0.055), market share (0.043), average consumption per customer (0.038), and sales (0.035), as shown in Table 5. Many empirical studies in the past have found that cost is an important factor affecting a company’s financial performance [127,128,129,130], and the reasons for poor company’s financial performance are all due to poor cost control. Therefore, it is reasonable that the most important performance indicator for the financial aspect of marketing alliances is the cost factor. The increase in net profit and market share is the main purpose of the company for marketing or strategic alliances [46,84] and is therefore also a relatively important performance measurement indicator. Mohr and Spekman [44] pointed out that profit and sales growth are objective indicators of marketing alliances.

4.5. The Relative Importance Ranking of Performance Indicators for the Alliance Cooperation Aspect

In terms of the alliance cooperation aspects that affect performance indicators, the weight of the corporate image factor (0.041) is the highest, followed by the satisfaction of the partner (0.039), the loyalty of the partner (0.03), the increase in relationships with other industries (0.027), the degree of commitment of the partner (0.026), and the value of the partner (0.024), as shown in Table 6. When an enterprise perceives the existence of inequality, it may feel unfair, and become reluctant to form an existing alliance or continue a particular alliance [131]. Whether it is the catering industry or the credit card issuing bank, they all hope to enhance the value of their corporate image through marketing alliances so as to improve their company’s performance. Therefore, if one party in the marketing alliance feels that it has been treated unfairly and reduces satisfaction and loyalty, not only will the performance be unachievable, it may also break the alliance. Therefore, the value of corporate image, the satisfaction of partners, the loyalty of partners, and the commitment of partners are important performance indicators for alliance cooperation. Wang and Fesenmaier [132] and Rothaermel and Boeker [121] both emphasized that the main motivation for the service industry to participate in marketing alliances is to obtain key resources and quickly enter new markets. Therefore, improving the relevance to other industries and the value of the partners are the secondary performance indicators of the alliance’s cooperation.

4.6. The Relative Importance Ranking of Performance Indicators for the Learning and Growth Aspect

In terms of the learning and growth aspect of influencing performance indicators, the weight of the human quality improvement factor (0.041) is the highest, followed by employee productivity (0.039), employee loyalty (0.035), employee satisfaction (0.028), and employee growth (0.017), as shown in Table 7. One of the purposes of the marketing alliance is to use alliance resources to improve the company’s human quality, employee’s marketing and management-related productivity, and employee satisfaction and loyalty [43], so as to increase the company’s revenue and profits [44]. Abbas’s [133] empirical evidence shows that human resource management practices, service quality, employee satisfaction, and employee loyalty have a positive impact on improving hotel performance in the financial and innovation fields. Therefore, improving the company’s human quality, employee productivity, and employee loyalty and satisfaction are relatively important performance indicators for learning and growth.

4.7. The Relative Importance Ranking of Performance Indicators for the Internal Process Aspect

In terms of the internal process aspects that affect performance indicators, the weight of efficiency factors (0.029) is the highest, followed by marketing strategies and management capabilities (0.026), customer complaints (0.023), resource integration capabilities (0.021), brand equity (0.02), departure rates (0.02), and diversified operating capabilities (0.018), as shown in Table 8. Both Hoffman and Schlosser [108] and Taylor [134] pointed out that strategic compatibility, appropriate governance mechanisms, and excellent strategic planning have an important impact on the success of the alliance. All these show that the management efficiency, marketing strategy, and management capabilities of alliance members are the most important performance indicators for internal processes. Abbas [133] empirically shows that customer satisfaction and customer loyalty have a positive impact on improving hotel performance in the financial and innovation fields. Therefore, the number of customer complaints and the customer departure rate are relatively important performance indicators for internal processes. Chen and Tseng [109] conducted research on credit card issuing banks and tourism marketing alliances and pointed out that partners having excellent resources and diversifying promotion channels will affect the motivation of marketing alliances. Therefore, the ability to integrate resources and diversified operations are also performance indicators for internal processes.

4.8. Extended Discussion of Marketing Alliances between the Service Industry and the Banking Industry

From the discussion of the above empirical results, we can discover the importance of establishing a strategic alliance between the service industry and the banking industry and its reliable performance measurement indicators. For the practical industry, especially small and medium-sized enterprises (SMEs), the cooperative relationship with banks is very important, including strategic alliances and general corporate loans. SMEs often lack many resources, including funds, marketing channels, innovation resources, etc. If they can form a strategic alliance with the banking industry, on the one hand, they can obtain sufficient funds to achieve a higher return on equity, and on the other hand strategic alliances with banks increase marketing channels or innovation resources. These resources will enable SMEs to have better capabilities and opportunities to expand their business scale and develop into an international market. Taiwan’s SMEs are the lifeblood of that country’s economy, and banks’ support for SMEs in Taiwan is an important key to the sustainable operation and development of SMEs. Therefore, this study takes Taiwan’s catering and banking marketing alliances as an example to set and test the performance indicators of strategic alliances, which has not only indicative implications for Taiwan’s SMEs, but also has important practical implications for countries with many SMEs.

5. Conclusions

The marketing strategy alliance between the catering industry and credit card issuing bank has been in operation for many years but, in the past, few academic studies have conducted in-depth research and discussion on the key performance indicators of the marketing alliance. In addition, in practice, due to the lack of knowledge and ability, most of the managers of both sides of the alliance cannot understand the factors and attributes that will affect the performance of the marketing strategy alliance. Previous academic research has confirmed the effectiveness of key performance indicators in other fields. The use of key performance indicators has been verified to improve organizational performance, diagnose organizational strengths, weaknesses, and opportunities, and identify key drivers for future development. Therefore, it is necessary to explore the key performance indicators of marketing alliances. The purpose of this study was to assist the establishment of performance evaluation indicators for marketing alliance between the catering industry and credit card issuing banks by using expert Delphi, fuzzy AHP, and balanced scorecard methods.
The main result of this study is to establish five key performance evaluation indicators for evaluating the performance of marketing alliances between the catering industry and credit card issuing banks, which include customer aspect, cooperative alliance aspect, financial aspect, learning and growth aspect, and internal process aspect. The relative importance of these five performance measurement indicators of marketing alliance are customer aspect, financial aspect, alliance cooperation aspect, learning and growth aspect, and the internal process aspect. Thirty factors of performance indicator for evaluating the catering industry and credit card issuing bank marketing alliance were established from these five aspects. The customer performance measurement indicators are ranked in order of importance as recommend to others’ wishes, reuse (purchase) willingness, service quality, customer satisfaction, catering and bank perception image, customer source, and customer growth rate. The financial performance measurement indicators are cost factors, net profit, market share, average consumption per customer, and sales, in order of importance. The financial performance measurement indicators are ranked, in order of importance, as corporate image, satisfaction of the partner, loyalty of the partner, increase in relationships with other industries, degree of commitment of the partner, and value of the partner. The performance measurement indicators for learning and growth are human quality improvement, employee productivity, employee loyalty, employee satisfaction, and employee growth, in order of importance. The performance measurement indicators for learning and growth are, in order of importance, efficiency, marketing strategies and management capabilities, customer complaints, resource integration capabilities, brand equity, department rates, and diversified operating capabilities. The research results can be used as a reference for academic and practical areas.
This research has the following contributions to the academic and practical fields. First, in the past decade, more and more companies have used mergers and acquisitions or strategic alliances to enhance their own competitiveness and reduce the threat of competition; however, not all mergers or strategic alliances result in success or have a positive effect on the company. Many mergers and acquisitions or strategic alliances ended in failure. One of the reasons for many failures is that a partner, or even all partners of the strategic alliance, feel that their performance is not as good as expected. Therefore, as far as the practical world is concerned, it is very important to understand the performance indicators of the strategic alliance between the two parties before the strategic alliance is carried out. Therefore, from the perspective of academic and practical experts, this research uses objective statistical methods to construct the performance indicators of strategic alliances, which will make considerable contributions to the practical field. Second, based on the differences in the purpose of strategic alliances, there are many ways of strategic alliances, such as the upstream and downstream strategic alliances of the industry, the strategic alliances of competitors in the same industry, and the strategic alliances of different industries. One of the strategic alliances is the marketing alliance; that is, the use of joint marketing to improve the company’s competitiveness and profitability. Marketing alliances may be in the same industry or in different industries. Among them, the marketing alliance between the banking industry and other industries is a very popular strategic alliance. It is not easy to set the performance evaluation method of marketing alliances in different industries. In practice, when partners have disagreements on the performance indicators of marketing alliances, conflicts may arise and the cooperation relationship may break. Therefore, how to construct a common performance indicator suitable for cross-industry marketing alliances is very important to the field of practice. Third, although there have been a lot of publications discussing the success factors and performance indicators of strategic alliances in the past, there are still few publications on the common performance measurement indicators of strategic alliances between the banking industry and other industries, especially the strategic alliances between the banking industry and the catering industry. In addition, the balanced scorecard has been a long-developed tool for measuring performance indicators that has been affirmed by both practical and academic fields, but there are few publications on applying this tool to the performance indicators of strategic alliances. This study uses a balanced scorecard to measure the performance indicators of the strategic alliance between the banking industry and the catering industry, which is an innovative method. Furthermore, using the fuzzy AHP method to verify the validity of experts and assess the suitability of performance measurement indicators is also an objective and rigorous verification method that has been affirmed academically.
This study has the following limitations and deficiencies: (1) This study uses the expert Delphi method and the fuzzy AHP method; only a few academic and practical experts are used as samples and the sample size is relatively small, so the external validity is slightly weak. (2) This research uses the indicators synthesized by past empirical research publications as the basis to set the performance indicators. Although this research adds some indicators that are in line with practical applications, it has not been tested by practical cases for a long time and whether it is fully in line with practical applications is still to be tested. (3) This study uses a balanced scorecard with expert Delphi and fuzzy AHP methods to set and test performance indicators. Although previous publications have used these methods well in relevant empirical research, there are still other good methods that can be used. In the future, different methods could be used and their pros and cons compared.

Author Contributions

Conceptualization, S.-C.D.; Data curation, J.-T.C. and I.-F.C.; Formal analysis, J.-T.C., S.-C.D. and C.-C.C.; Funding acquisition, I.-F.C., J.-T.C. and C.-C.C.; Investigation, J.-T.C.; Methodology, J.-T.C., S.-C.D. and C.-C.C.; Software, J.-T.C.; Supervision, S.-C.D. and C.-C.C.; Validation, C.-C.C.; Visualization, I.-F.C.; Writing—original draft, J.-T.C. and C.-C.C.; Writing—review & editing, C.-C.C. All authors have read and agreed to the published version of the manuscript.

Funding

This research received no external funding.

Conflicts of Interest

The authors declare no conflict of interest.

References

  1. Hoffmann, W. Strategies for managing a portfolio of alliances. Strateg. Manag. J. 2007, 28, 827–856. [Google Scholar] [CrossRef]
  2. Kiessling, T.; Harvey, M. Global marketing networks and the development of trust: A dynamic capabilities perspective. J. Mark. Channels 2004, 11, 21–41. [Google Scholar] [CrossRef]
  3. Teng, B.S.; Das, T.K. Governance structure choice in strategic alliances: The roles of alliance objectives, alliance management experiences and international partners. Manag. Decis. 2008, 46, 725–742. [Google Scholar] [CrossRef]
  4. Beritelli, P. Cooperation among prominent actors in a tourist destination. Tour. Manag. 2011, 38, 607–629. [Google Scholar] [CrossRef]
  5. Sarkar, M.B.; Aulakh, P.S.; Madhok, A. Process capabilities and value generation in alliance portfolios. Organ. Sci. 2009, 20, 583–600. [Google Scholar] [CrossRef]
  6. Sirmon, D.G.; Lane, P.J. A Model of Cultural Differences and International Alliance Performance. J. Int. Bus. Stud. 2004, 35, 306–319. [Google Scholar] [CrossRef]
  7. Greve, H.R.; Baum, J.A.C.; Mitsuhashi, H.; Rowley, T.J. Built to last but falling apart: Cohesion, friction, and withdrawal from interfirm alliances. Acad. Manag. J. 2010, 53, 302–322. [Google Scholar] [CrossRef]
  8. Lazzarini, S.G. The impact of membership in competing alliance constellations: Evidence on the operational performance of global airlines. Strateg. Manag. J. 2007, 28, 345–367. [Google Scholar] [CrossRef]
  9. Lavie, D.; Miller, S.R. Alliance portfolio internationalization and firm performance. Organ. Sci. 2008, 19, 623–646. [Google Scholar] [CrossRef]
  10. Goerzen, A. Alliance networks and firm performance: The impact of repeated partnerships. Strateg. Manag. J. 2007, 28, 487–509. [Google Scholar] [CrossRef]
  11. Heimeriks, K.H.; Duysters, G. Alliance capability as mediator between experience and alliance capability. J. Manag. Stud. 2007, 44, 25–49. [Google Scholar] [CrossRef] [Green Version]
  12. Judge, W.Q.; Dooley, R.S. Strategic alliance outcomes: A transaction-cost economics perspective. Br. J. Manag. 2005, 16, 1–15. [Google Scholar] [CrossRef]
  13. Kandemir, D.; Yaprak, A.; Cavusgil, S.T. Alliance orientation: Conceptualization, measurement, and impact on market performance. J. Acad. Mark. Sci. 2006, 34, 324–340. [Google Scholar] [CrossRef]
  14. Lane, P.; Salk, J.; Lyles, M. Absorptive capacity, learning, and performance in international joint ventures. Strateg. Manag. J. 2001, 22, 1139–1161. [Google Scholar] [CrossRef]
  15. Shah, R.H.; Swaminathan, V. Factors influencing partner selection in strategic alliances: The moderating role of alliance context. Strateg. Manag. J. 2008, 29, 471–494. [Google Scholar] [CrossRef]
  16. Chand, M.; Katou, A.A. Strategic determinants for the selection of partner alliances in the Indian tour operator industry: A cross-national study. J. World Bus. 2012, 47, 167–177. [Google Scholar] [CrossRef]
  17. Franco, M. Determining factors in the success of strategic alliances: An empirical study performed in Portuguese firms. Eur. J. Int. Manag. 2012, 5, 608–632. [Google Scholar] [CrossRef]
  18. Solesvik, M.Z.; Westhead, P. Partner selection for strategic alliances: Case study insights from the maritime industry. Ind. Manag. Data Syst. 2010, 110, 841–860. [Google Scholar] [CrossRef]
  19. Cravens, K.; Piercy, N.; Cravens, D. Assessing the performance of strategic alliances: Matching metrics to strategies. Eur. Manag. J. 2000, 18, 529–541. [Google Scholar] [CrossRef]
  20. Das, T.K.; Teng, B. The dynamics of alliance conditions in the alliance development process. J. Manag. Stud. 2002, 39, 725–746. [Google Scholar] [CrossRef]
  21. Gill, J.; Butler, R.J. Managing instability in cross-cultural alliances. Long Range Plan. 2003, 36, 543–563. [Google Scholar] [CrossRef]
  22. Bharadwaj, S.; Varadarajan, P.R.; Fahy, J. Sustainable competitive advantage in service industries: A conceptual model and research propositions. J. Mark. 1993, 57, 83–99. [Google Scholar] [CrossRef]
  23. Dev, C.S.; Klein, S.; Fisher, R.A. A market-based approach for partner selection in marketing alliances. J. Travel Res. 1996, 35, 11–17. [Google Scholar] [CrossRef]
  24. Evans, N. Alliances in the international travel industry: Sustainable strategic options? Int. J. Cater. Tour. Adm. 2001, 2, 9–16. [Google Scholar] [CrossRef]
  25. Holmberg, S.R.; Cummings, J.L. Building successful strategic alliances: Strategic process and analytical tool for selecting partner industries and firms. Long Range Plan. 2009, 42, 164–193. [Google Scholar] [CrossRef]
  26. Meier, M. Knowledge management in strategic alliances: A review of empirical evidence. Int. J. Manag. Rev. 2011, 13, 1–23. [Google Scholar] [CrossRef]
  27. Pansiri, J. How company and managerial characteristics influence strategic alliance adoption in the travel sector. Int. J. Tour. Res. 2007, 9, 243–255. [Google Scholar] [CrossRef]
  28. Selin, S.; Myers, N. Tourism marketing alliances: Member satisfaction and effectiveness attributes of regional initiative. J. Travel Tour. Res. 1998, 7, 79–94. [Google Scholar] [CrossRef]
  29. Wong, E.P.Y.; Mistilis, N.; Dwyer, L. A framework for analyzing intergovernmental collaboration. The case of ASEAN tourism. Tour. Manag. 2011, 32, 367–376. [Google Scholar] [CrossRef] [Green Version]
  30. Das, T.; Teng, B. Instabilities of strategic alliances: An internal tensions perspective. Organ. Sci. 2000, 11, 77–101. [Google Scholar] [CrossRef]
  31. Fyall, A.; Garrod, B.; Leask, A. Scottish visitor attractions: Managing visitor impacts. Tour. Manag. 2002, 23, 265–279. [Google Scholar]
  32. Lambe, C.J.; Spekman, R.E.; Hunt, S.D. Alliance competence, resources, and alliance success: Conceptualization, measurement, and initial test. J. Acad. Mark. Sci. 2002, 30, 141–158. [Google Scholar] [CrossRef]
  33. Pangarkar, N. Do firms learn from alliance terminations? An empirical examination. J. Manag. Stud. 2009, 46, 982–1004. [Google Scholar] [CrossRef]
  34. Peng, X. Research on the Current Status, Difficulties and Development Strategies of Educational Marketing in Normal Schools. Master’s Thesis, National Education Institute, National Tainan University, Tainan City, Taiwan, 2000. [Google Scholar]
  35. Dyer, J.; Singh, H. The relational view: Cooperative strategies and sources of interorganizational competitive advantage. Acad. Manag. Rev. 1998, 23, 660–679. [Google Scholar] [CrossRef] [Green Version]
  36. Ireland, R.D.; Hitt, M.A.; Vaidyanath, D. Alliance management as a source of competitive advantage. J. Manag. 2002, 28, 413–446. [Google Scholar] [CrossRef]
  37. Day, G.S. Advantageous alliances. J. Acad. Mark. Sci. 1995, 23, 297–300. [Google Scholar] [CrossRef]
  38. Geringer, J.M.; Hebert, L. Measuring performance of international joint ventures. J. Int. Bus. Stud. 1991, 22, 249–263. [Google Scholar] [CrossRef]
  39. Park, S.H.; Russo, M. When competition eclipses cooperation: An event history analysis of alliance failure. Manag. Sci. 1996, 42, 875–890. [Google Scholar] [CrossRef]
  40. Park, S.H.; Ungson, G.R. Interfirm rivalry and managerial complexity: A conceptual framework of alliance failure. Organ. Sci. 2001, 12, 37–53. [Google Scholar] [CrossRef]
  41. Cronin, M.J. Performance Measurement for Public Services in Academic and Research Libraries; Office of Management Studies, Association of Research Libraries: Washington, DC, USA, 2000. [Google Scholar]
  42. Beer, M.; Ruh, R.; Dawson, J.A.; McCaa, B.B.; Kavanagh, M.J. A performance management system: Research, design, introduction and evaluation. Pers. Psychol. 1978, 31, 505–535. [Google Scholar] [CrossRef]
  43. Mjoen, H.; Tallman, S. Control and performance in international joint ventures. Organ. Sci. 1997, 81, 257–274. [Google Scholar] [CrossRef]
  44. Mohr, J.; Spekman, R. Characteristics of partnership success. Strateg. Manag. J. 1994, 15, 135–152. [Google Scholar] [CrossRef]
  45. Contractor, F.J.; Lorange, P. Co-Operative Strategies in International Business; Lexington Press: Lexington, MA, USA, 1988. [Google Scholar]
  46. Tomlinson, J.W.C. The Joint Venture Process in International Business: India and Pakistan; MIT Press: Cambridge, MA, USA, 1970. [Google Scholar]
  47. Pekar, P., Jr. How battle-tested managers assess strategic alliances. Plan. Rev. 1989, 17, 34–37. [Google Scholar] [CrossRef]
  48. Anderson, E. Two firms, one frontier: On assessing joint venture performance. Sloan Manag. Rev. 1990, 31, 19–30. [Google Scholar]
  49. Harrigan, K. Joint ventures and competitive strategy. Strateg. Manag. J. 1988, 2, 141–158. [Google Scholar] [CrossRef]
  50. Ariño, A. Measures of strategic alliance performance: An analysis of construct validity. J. Int. Bus. Stud. 2003, 34, 66–79. [Google Scholar] [CrossRef]
  51. Kaplan, R.S.; Norton, D.P. Linking the balanced scorecard to strategy. Calif. Manag. Rev. 1996, 39, 53–79. [Google Scholar] [CrossRef]
  52. Balkovskaya, D.; Filneva, L. The use of the balanced scorecard in bank strategic management. Int. J. Bus. Excell. 2016, 9, 48–67. [Google Scholar] [CrossRef]
  53. Keshavarz, E.; Ftahikenari, M.; Rohani, A.; Bagheri, S.M. Performance evaluation of banks using balanced scorecard. Int. J. Bus. Excell. 2014, 7, 371–393. [Google Scholar] [CrossRef]
  54. Karasneh, A.A.-F.; Al-Dahir, A. Impact of IT- balanced scorecard on financial performance: An empirical study on Jordanian banks. Eur. J. Econ. Financ. Adm. Sci. 2012, 46, 54–70. [Google Scholar]
  55. Kim, W.G.; Lee, S. Developing a new hotel performance measurement system: Application of the balanced-scorecard and the fuzzy-analytic hierarchy process model. In Proceedings of the First Hospitality and Leisure: Business Advances and Applied Research Conference, Lausanne, Switzerland, 5 July 2007; pp. 89–98. [Google Scholar]
  56. Lucie, S.; Iveta, Š. Key performance indicators as a basic element for a marketing efficiency measurement. In Proceedings of the 7th International Scientific Conference Business and Management, Vilnius, Lithuania, 10–11 May 2012. [Google Scholar]
  57. Linstone, H.A.; Turoff, M. The Delphi Method: Techniques and Applications; Addison-Wesley Publishing Company: Houston, TX, USA, 1975. [Google Scholar]
  58. Rowe, G.; Wright, G. The delphi technique as a forecasting tool: Issues and analysis. Int. J. Forecast. 1999, 15, 353–375. [Google Scholar] [CrossRef]
  59. Briedenhann, J.; Butts, S. Application of the Delphi technique to rural tourism project evaluation. Curr. Issues Tour. 2006, 9, 171–190. [Google Scholar] [CrossRef]
  60. Garrod, B.; Fyall, A. Managing heritage tourism. Ann. Tour. Res. 2000, 27, 682–708. [Google Scholar] [CrossRef]
  61. Miller, G. The development of indicators for sustainable tourism: Results of a Delphi survey of tourism researchers. Tour. Manag. 2001, 22, 351–362. [Google Scholar] [CrossRef] [Green Version]
  62. Park, D.B.; Yoon, Y.S. Developing sustainable rural tourism evaluation indicators. Int. J. Tour. Res. 2011, 13, 401–415. [Google Scholar] [CrossRef]
  63. Bonnemaizon, A.; Cova, B.; Louyot, M. Relationship marketing in 2015: A Delphi approach. Eur. Manag. J. 2007, 25, 50–59. [Google Scholar] [CrossRef]
  64. Fan, T.; Vigeant-Langlois, L.; Geissler, C.; Bosler, B.; Wilmking, J. Evolution of global airline strategic alliance and consolidation in the twenty-first century. J. Air Transp. Manag. 2001, 7, 349–360. [Google Scholar] [CrossRef]
  65. Whipple, J.S.; Gentry, J.J.A. Network comparison of alliance motives and achievements. J. Bus. Ind. Mark. 2000, 15, 301–322. [Google Scholar] [CrossRef]
  66. Wu, W.Y.; Shih, H.-A.; Chan, H.-C. The analytic network process for partner selection criteria in strategic alliances. Exp. Syst. Appl. 2009, 36, 4646–4653. [Google Scholar] [CrossRef]
  67. Saaty, T.L. An Analytic Hierarchy Process; McGraw-Hill: New York, NY, USA, 1980. [Google Scholar]
  68. Zamparas, M.; Kapsalis, V.C.; Kyriakopoulos, G.L.; Aravossis, K.G.; Kanteraki, A.E.; Vantarakis, A.; Kalavrouziotis, I.K. Medical waste management and environmental assessment in the Rio University Hospital, Western Greece. Sustain. Chem. Pharm. 2019, 13, 100163. [Google Scholar] [CrossRef]
  69. Deng, J.-Y.; Tzeng, G.-H. The Analytic Hierarchy Process: Concepts, Techniques and Applications(I). J. Chin. Stat. Assoc. 1989, 27, 13707–13724. [Google Scholar]
  70. Ghodsypour, S.H.; O’Brien, C. A decision support system for supplier selection using an integrated analytic hierarchy process and linear programming. Int. J. Prod. Econ. 1998, 56, 199–212. [Google Scholar] [CrossRef]
  71. Zahedi, F. The analytic hierarchy process-A survey of the method and its applications. Interfaces 1986, 16, 96–108. [Google Scholar] [CrossRef]
  72. Kilincci, O.; Onal, S.A. Fuzzy AHP approach for supplier selection in a washing machine company. Exp. Syst. Appl. 2011, 38, 9656–9664. [Google Scholar] [CrossRef]
  73. Saaty, T.L.; Takizawa, M. Dependence and independence: From linear hierarchies to nonlinear networks. Eur. J. Oper. Res. 1986, 26, 229–237. [Google Scholar] [CrossRef]
  74. Zadeh, L.A. The concept of a linguistic variable and its application to approximate reasoning. Inform. Sci. 1975, 8, 199–249. [Google Scholar] [CrossRef]
  75. Xu, J.; Yu, L.; Gupta, R. Evaluating the performance of the government venture capital guiding fund Using the intuitionistic fuzzy analytic hierarchy process. Sustainability 2020, 12, 6908. [Google Scholar] [CrossRef]
  76. Van Laarhoven, P.J.M.; Pedrycz, W. A fuzzy extension of Saaty’s priority theory. Fuzzy Sets Syst. 1983, 11, 229–241. [Google Scholar] [CrossRef]
  77. Yu, F.J.; Wei, Y.J. Ranking model for used car selection employing a fuzzy analytic hierarchy process and the technique for order preference by similarity to ideal solution. J. Sci. Eng. Technol. 2017, 13, 1–11. [Google Scholar]
  78. Buckley, J. Fuzzy Hierarchical Analysis. Fuzzy Sets Syst. 1985, 17, 33–247. [Google Scholar] [CrossRef]
  79. Que, S.L. Applied Fuzzy Mathematics; Scientific & Technical Publishing Co., Ltd.: Taipei City, Taiwan, 2001. [Google Scholar]
  80. Kahraman, C.; Cebecia, U.; Ruan, D. Multi-attribute comparison of catering service companies using fuzzy AHP: The case of Turkey. Int. J. Prod. Econ. 2004, 87, 171–184. [Google Scholar] [CrossRef]
  81. Kahraman, C.; Ruan, D.; Tolga, E. Capital budgeting techniques using discounted fuzzy versus probabilistic cashflows. Inform. Sci. 2002, 42, 57–76. [Google Scholar] [CrossRef]
  82. Kahraman, C.; Cebeci, U.; Ulukan, Z. Multi-criteria supplier selection using fuzzy AHP. Logist. Inform. Manag. 2003, 16, 382–394. [Google Scholar]
  83. Chang, D.Y. Applications of the extent analysis method on fuzzy AHP. Eur. J. Oper. Res. 1996, 95, 649–655. [Google Scholar] [CrossRef]
  84. Lai, V.S.; Wong, B.K.; Cheung, W. Group decision making in a multiple criteria environment: A case using the AHP in software selection. Eur. J. Oper. Res. 2002, 37, 134–144. [Google Scholar] [CrossRef]
  85. Lucas, D.S.M.; Sandra Mara, I.V.; Vinicius, A.M.; Sandra, R.E. Development of performance evaluation theme: A systematic analysis of the literature. Contextus Rev. Contemp. Econ. Gest. 2019, 17, 63–97. [Google Scholar]
  86. Whipple, J.M.; Frankel, R. Strategic alliance success factors. J. Supply Chain Manag. 2000, 36, 21–28. [Google Scholar] [CrossRef]
  87. Cebeci, U. Fuzzy AHP-based decision support system for selecting ERP systems in textile industry by using balanced scorecard. Exp. Syst. Appl. 2012, 36, 8900–8909. [Google Scholar] [CrossRef]
  88. Wu, H.Y.; Tzeng, G.H.; Chen, Y.H. A fuzzy MCDM approach for evaluating banking performance based on balanced scorecard. Exp. Syst. Appl. 2009, 36, 10135–10147. [Google Scholar] [CrossRef]
  89. Feili, H.R.N.; Farahani, V.; Vesaghi, N. Integration of fuzzy analytic hierarchy process (FAHP) with balance score card (BSC) in order to evaluate the performance of information technology in industry. J. Math. Comput. Sci. 2011, 2, 271–283. [Google Scholar] [CrossRef]
  90. Wang, L.; Zhang, H.; Zeng, Y.R. Fuzzy analytic hierarchy process (FAHP) and balanced scorecard approach for evaluating performance of Third-Party Logistics (TPL) enterprises in Chinese context. Afr. J. Bus. Manag. 2012, 6, 521–529. [Google Scholar]
  91. Sharma, M.K.; Bhagwat, R. An integrated BSC-AHP approach for supply chain management evaluation. Meas. Busi Excell. 2007, 11, 57–68. [Google Scholar] [CrossRef]
  92. Abdolshah, M.; Javidnia, M.; Astanbous, M.A.; Eslami, M. An integrated approach to analyze strategy map using BSC–FUZZY AHP: A case study of auto industry. Manag. Sci. Lett. 2012, 2, 705–712. [Google Scholar] [CrossRef]
  93. Grigoroudis, E.; Orfanoudaki, E.; Zopounidis, C. Strategic performance measurement in a healthcare organization: A multiple criteria approach based on balanced score. Omega 2012, 40, 104–119. [Google Scholar] [CrossRef]
  94. Pan, F.C. Escalate BSC Power by AHP: Innovative Approach for Strategy Implementation. Int. J. Manag. Decis. Mak. 2006, 7, 337–351. [Google Scholar] [CrossRef]
  95. Lee, S.; Brownlee, E.; Kim, Y.; Lee, S. Ticket sales outsourcing performance measures using balanced scorecard and analytic hierarchy process combined model. Sport Mark. Quart. 2017, 26, 110–120. [Google Scholar]
  96. Ahmad, K.; Zabri, S. The application of non-financial performance measurement in Malaysian manufacturing firms. Proc. Econ. Financ. 2016, 35, 476–484. [Google Scholar] [CrossRef] [Green Version]
  97. Kaplan, R.S.; Norton, D. The balanced scorecard: Measures that drive performance. Harv. Bus. Rev. 1992, 71, 71–79. [Google Scholar]
  98. Kaplan, R.S.; Norton, D. The Strategy-Focus Organization: How Balanced Scorecard Companies Thrive in the New Business Environment; Harvard Business School Publishing Corporation: Boston, MA, USA, 2001. [Google Scholar]
  99. Kaplan, R.S. Strategic performance measurement and management in nonprofit organizations. Nonprofit Manag. Leadersh. 2001, 11, 353–370. [Google Scholar] [CrossRef] [Green Version]
  100. Kasie, F.M.; Belay, A.M. The impact of multi-criteria performance measurement on business performance improvement. J. Ind. Eng. Manag. 2013, 6, 595–625. [Google Scholar] [CrossRef] [Green Version]
  101. Morten, J. Consequences of intensive use of non-financial performance measures in Danish family farm holdings. Qual. Res. Account. Manag. 2017, 14, 137–156. [Google Scholar]
  102. Gan, H.; Simerly, M.C. The use of non-financial performance measures: Does the strength of corporate governance matter? Am. J. Manag. 2019, 19, 10–30. [Google Scholar]
  103. Kaplan, R.S. The Balanced Scorecard: Translating Strategy into Action; Harvard Business School Press: Boston, MA, USA, 1996. [Google Scholar]
  104. Kalagnanam, S.; Krueger, C. Reporting nonfinancial performance measures: A survey of electric and electronic firms. Int. J. Strateg. Cost Manag. 1999, 2, 55–71. [Google Scholar]
  105. Hussain, M.; Hoque, Z. Understanding non-financial performance measurement practices in Japanese banks: A new institutional sociology perspective. Accout. Audi. Account. 2002, 15, 162–183. [Google Scholar] [CrossRef]
  106. Režňáková, M.; Karas, M.; Strnadová, M. Non-financial factors of performance: The case of mechanical engineering companies in the Czech Republic. Ser. D Fac. Econ. Adm. 2017, 24, 188–198. [Google Scholar]
  107. Medina-Munoz, D.; Garcia-Falcon, J.M. Successful relationships between hotels and agencies. Ann. Tour. Res. 2000, 27, 737–762. [Google Scholar] [CrossRef]
  108. Hoffman, W.H.; Schlosser, R. Success factors of strategic alliances in small and medium-sized enterprises: An empirical survey. Long Range Plan. 2001, 34, 357–381. [Google Scholar] [CrossRef]
  109. Chen, H.M.; Tseng, C.H. The performance of marketing alliances between the tourism industry and credit card issuing banks in Taiwan. Tour. Manag. 2005, 26, 15–24. [Google Scholar] [CrossRef]
  110. Pansiri, J. The effects of characteristics of partners on strategic alliance performance in the SME dominated travel sector. Tour. Manag. 2008, 29, 101–115. [Google Scholar] [CrossRef]
  111. Nielsen, B.B. Determining international strategic alliance performance: A multidimensional approach. J. Bus. Rev. 2007, 16, 337–361. [Google Scholar] [CrossRef]
  112. Wittman, C.M.; Hunt, S.D.; Arnett, D.B. Explaining alliance success: Competences, resources, relational factors, and resource-advantage theory. Ind. Mark. Manag. 2009, 38, 743–756. [Google Scholar] [CrossRef]
  113. Narasimhan, R.; Nair, A. The antecedent role of quality, information sharing and supply chain proximity on strategic alliance formation and performance. Int. J. Prod. Econ. 2005, 96, 301–313. [Google Scholar] [CrossRef]
  114. Muthusamy, S.K.; White, M.A. Does power sharing matter? The role of power and influence in alliance performance. J. Bus. Res. 2006, 59, 811–819. [Google Scholar] [CrossRef]
  115. Suseno, Y.; Ratten, V. A theoretical framework of alliance performance: The role of trust, social capital and knowledge development. J. Manag. Organ. 2007, 13, 4–23. [Google Scholar] [CrossRef]
  116. Das, T.K.; Teng, B. Partner analysis and alliance performance. Scand. J. Manag. 2003, 19, 279–308. [Google Scholar] [CrossRef]
  117. Carlo, M.D.; Cugini, A.; Zerbini, F. Assessment of destination performance: A strategy map approach. Tour. Rev. 2008, 63, 25–37. [Google Scholar] [CrossRef]
  118. Turanli, M.; Güneren, A.G.E. Turizm sektöründe talep tahmin modellemesi. Istanb. Ticaret Üniversitesi Sos. Bilimler Derg. 2003, 2, 1–13. [Google Scholar]
  119. Kusluvan, S.; Kusluvan, Z. Perceptions and attitudes of undergraduate tourism students towards working in the tourism industry in Turkey. Tour. Manag. 2000, 21, 251–269. [Google Scholar] [CrossRef]
  120. Kim, J.; Suh, E.; Hwang, H. A model for evaluating the effectiveness of CRM using the balanced scorecard. J. Inter. Mark. 2003, 17, 5–19. [Google Scholar] [CrossRef]
  121. Rothaermel, F.; Boeker, W. Old technology meets new technology: Complementarities, similarities and alliance formation. Strateg. Manag. J. 2008, 29, 47–77. [Google Scholar] [CrossRef] [Green Version]
  122. Hitt, M.A.; Ahlstrom, D.; Dacin, M.T.; Levitas, E.; Svobodina, L. The institutional effects on strategic alliance partner selection in transition economies: China vs Russia. Organ. Sci. 2004, 15, 173–185. [Google Scholar] [CrossRef]
  123. Biel, A.L. How brand image drives brand quality. J. Advert. Res. 1992, 32, 6–12. [Google Scholar]
  124. Oluwafemi, O.J.; Adebiyi, S.O. Customer loyalty and integrated marketing communications among subscribers of telecommunication firms in Lagos Metropolis, Nigeria. J. Compet. 2018, 10, 101–118. [Google Scholar] [CrossRef] [Green Version]
  125. Lai, S.W. A Study of Management Opportunity Grid in Banking Industry. Master’s Thesis, Advanced Management Master’s Program in the Accounting Department of National Changhua Normal University, Changhua County, Taiwan, 2006. [Google Scholar]
  126. Qasem, A.; Alhakimi, W. The impact of service quality and communication in developing customer loyalty: The mediating effect of customer satisfaction. J. Soc. Stud. 2019, 25, 137–172. [Google Scholar]
  127. Lewandowski, R.A. Cost control of medical care in public hospitals-A comparative analysis. Int. J. Contemp. Manag. 2014, 13, 125–136. [Google Scholar]
  128. Ramsbottom, G.; Horan, B.; Berry, D.P.; Roche, J.R. Factors associated with the financial performance of spring-calving, pasture-based dairy farms. J. Dairy Sci. 2015, 98, 3526–3540. [Google Scholar] [CrossRef] [Green Version]
  129. Cengiz, E.; Cengiz, F.; Demirciftci, T.; Cobanoglu, C. Do food and beverage cost-control measures increase hotel performance? A case study in Istanbul, Turkey. J. Foodserv. Bus. Res. 2018, 21, 610–627. [Google Scholar] [CrossRef]
  130. Tavalaei, M.M.; Santalo, J. Pure versus hybrid competitive strategies in the airport industry. Transp. Res. Part A Policy Pract. 2019, 124, 444–455. [Google Scholar] [CrossRef]
  131. Pun, K.F.; White, A.S. A performance measurement paradigm for integrating strategy formulation: A review of systems and frameworks. Int. J. Manag. Rev. 2005, 7, 49–71. [Google Scholar] [CrossRef]
  132. Wang, Y.; Fesenmaier, D. Collaborative destination marketing: A case study of Elkhart County, Indiana. Tour. Manag. 2007, 28, 863–875. [Google Scholar] [CrossRef]
  133. Abbas, A. Effects of human resource management on hotel performance using structural equation modeling. Comput. Hum. Behav. 2015, 43, 293–303. [Google Scholar]
  134. Taylor, A. An operations perspective on strategic alliance success factors. Int. J. Oper. Prod. Manag. 2005, 25, 469–490. [Google Scholar] [CrossRef]
Figure 1. Hierarchical structure diagram of analytical hierarchy process [69].
Sustainability 12 09005 g001
Figure 2. A triangular attribution function.
Sustainability 12 09005 g002
Table 1. Analytic hierarchy process (AHP) method pair comparison numerical scale [73].
Pair Comparison of A and B
Evaluating factorAbsolute unimportanceVery strong unimportanceEssential unimportanceWeak unimportanceEqual importanceWeak importanceEssential importanceVery strong importanceAbsolute importanceEvaluating factor
A1/91/71/51/313579B
Table 3. Analysis of the first-level indicators of performance evaluation of the catering industry and the credit card issuing bank marketing alliance.
Main GoalFirst-Level IndicatorsWeightsRank
Performance indicators of the catering industry and the credit card issuing bank marketing allianceCustomer aspect0.2641
Alliance cooperation aspect 0.1883
Financial aspect0.2312
Internal process aspect0.1585
Learning and growth aspect0.1594
Table 4. Analysis of performance evaluation indicators for customer aspect.
First-Level IndicatorWeightSecond-Level IndicatorsLocal WeightsOverall WeightsRank
Customer aspect0.2641. customer source0.1160.0315
2. customer growth rate0.0970.0266
3. customer satisfaction0.1410.0374
4. service quality0.1670.0443
5. reuse (purchase) willingness0.1720.0462
6. the willingness to recommend others0.1900.0501
7. the perceived image of the catering industry and banks0.1170.0315
Table 5. Analysis of performance evaluation indicators for financial aspect.
First-Level IndicatorWeightSecond-Level IndicatorsLocal WeightsOverall WeightsRank
Financial aspect0.2311. cost0.2590.0601
2. net profit0.2370.0552
3. market share0.1870.0433
4. sale revenue0.1520.0355
5. average consumption per customer0.1650.0384
Table 6. Analysis of performance evaluation indicators for alliance cooperation aspect.
First-Level IndicatorWeightSecond-Level IndicatorsLocal WeightsOverall WeightsRank
Alliance cooperation aspect0.1881. commitment of partners0.1400.0265
2. value of partners0.1250.0246
3. loyalty of partners0.1610.0303
4. satisfaction of partners0.2080.0392
5. value of corporate image0.2200.0411
6. industry relation0.1460.0274
Table 7. Analysis of performance evaluation indicators for learning and growth aspect.
First-Level IndicatorWeightSecond-Level IndicatorsLocal WeightsOverall WeightsRank
Learning and growth aspect0.1591. employee productivity0.2470.0392
2. employee satisfaction0.1730.0284
3. increase in employ0.1030.0175
4. human quality improvement0.2600.0411
5. employee loyalty0.2170.0353
Table 8. Analysis of performance evaluation indicators for internal aspect.
First-Level IndicatorWeightSecond-Level IndicatorsLocal WeightsOverall WeightsRank
Internal aspect0.1581. resource integration ability0.1340.0214
2. diversified operating capacity0.1130.0186
3. brand equity0.1290.0205
4. number of customer complaints0.1470.0233
5. marketing strategy and management ability0.1670.0262
6. efficiency0.1850.0291
7. departure rate0.1250.0205
Publisher’s Note: MDPI stays neutral with regard to jurisdictional claims in published maps and institutional affiliations.

