Abstract
The Eurobarometer report from December 2019 revealed that 80% of European Union (EU) citizens believe that industry is doing too little to protect the environment and that more work needs to be done to help companies transition to a more sustainable economic model. In recent years, the EU has made the Circular Economy (CE) a priority, and an environmental management system based on the EMAS Regulation can help companies achieve this goal by assisting them in analysing and measuring an efficient and sustainable use of resources. Thus, this study analyses EMAS companies’ environmental statements in order to identify and quantify the CE practices they have implemented. Findings identify 23 circular practices and show that the majority of companies focus their efforts on reducing emissions by optimizing the materials cycle and improving internal production processes. Eco-design stands out as the main driver amongst the circular transformation practices. This study has also detected a lack of uniformity in the way companies quantify the various circular practices currently operating, or how they communicate this information. These results may be useful to companies, professionals and administrations responsible for promoting the CE, and it can also provide guidance on what information to include in future environmental statements.
1. Introduction
Neither the planet nor the economy can survive if it continues to follow the traditional economic model based on raw material extraction, manufacturing, use and disposal. Preserving valuable resources and fully exploiting their full economic value has become crucial [1]. The Circular Economy (CE) is rooted in the principles of reducing waste and protecting the environment as well as dramatically transforming the way the economy works. By rethinking the way in which we produce, work and buy products, new opportunities and occupations can be created [2,3]. The CE needs to be able to generate value which is less dependent on natural resources by taking a systemic and holistic approach and integrating the whole value chain. The concept of a CE requires, and accommodates to a greater or lesser extent, the participation of a wide spectrum of agents varying in size and nature such as public and private agents, consumers or research centres.
Aspiring to replace single-use products with ones that are circular by design and creating reverse logistic networks have become powerful stimuli for new ideas. Thus, everything related to circular supplies, resource recovery, product life extension, sharing platforms and products as a service represents a vibrant business terrain for entrepreneurs [4]. Businesses should reap the benefits of an economy that operates with higher rates of technological development, optimized and improved materials, energy efficiency and greater opportunities for productive and resource-efficient companies.
Hence, activities and actions aligned with the new CE paradigm in the business environment have become more and more frequent for all types of organisations and sectors, and increasingly, researchers are focusing their efforts on studying the key role played by businesses in developing the CE at company and organization level [5,6,7,8]. However, a more in-depth study of how businesses on the road to circularity integrate the principles of this new paradigm is needed [9,10].
Companies that have implemented an Environmental Management System (EMS) are considered to have greater environmental awareness and show a special sensitivity towards protecting the environment, as well as being one step ahead of the rest [11,12,13]. The Environmental Maturity Model (EMM), developed by Ormazábal et al. [14], which assesses the level of maturity of companies transitioning to a CE, ranging from the most reactive to the most proactive maturity stage, considers that companies implementing an EMS would be located at a medium stage of maturity in their progress towards circularity (Systematization) on a 6-stage scale. Traditionally, proactive EMS adoption and certification have been associated with large companies, usually endowed with more capital than small and medium-sized enterprises (SMEs), and which have a clear strategic vision and regard EMS implementation as a genuine commitment to competition [15]. However, this situation has been changing, and increasingly, SMEs are also reaping the benefits of implementing EMS in their organisations. Proof of this are the data available from the European Commission’s EMAS Helpdesk register of 15 June 2020, which reveals that only 26% of EMAS-registered businesses are large companies [16]. Nevertheless, a company’s green image and commitment to a paradigm shift towards the CE needs to be translated into action [17].
Research on CE adoption in companies at regional level is still limited [18], so the aim of this study is to help reduce this deficit. Therefore, this article aims to identify CE practices being reported by SMEs implementing EMS in their move towards a CE model. The following Research Questions (RQ) have been posed:
- RQ1: Do companies include the CE concept in their environmental statements?
- RQ2: What CE activities or practices do companies claim to have adopted? Are some activities more commonly adopted than others?
- RQ3: How are CE practices reported and quantified in environmental statements? How are these practices reported to stakeholders?
- RQ4: Does a relationship exist between circularity practices and economic performance?
- RQ5: What information should be included in environmental statements in the future to help evaluate the application of circularity practices in EMAS-registered companies?
The aim of this study is to answer these questions by analysing the environmental statements of EMAS-registered SMEs in Spain, currently the second country in the EU in number of companies with EMAS registration (1092 companies), behind Germany (1099 companies). Specifically, we have analysed companies from the industrial sector in Catalonia (northeast Spain), one of the most industrialized regions of Spain, with a business network mainly made up of SMEs.
This study is focused on companies in the industrial sector as the challenges of environmental pollution and worldwide scarcity of resources have meant that these companies must simultaneously cope with the pressure of environmental regulations, the challenges of resource price volatility and supply chain risks in a far more critical way [19]. At the same time, this sector has been included in the priority areas of activity on which the 2030 Spanish Strategy for the Circular Economy is focused.
The main novelty of this research is that it focuses on exploring the actions that industrial EMAS-registered SMEs have claimed to have taken in relation to adopting CE practices. These companies are supposedly located at a higher stage of circularity than the rest of industries that still have a very traditional, linear business model, as suggested by Marrucci et al. [12]. We believe this study can be useful for other companies operating in similar contexts, but which have not yet reached the mid-level maturity stage on the EMM scale developed by Ormazábal et al. [14]. Thus, this contribution aims to provide examples of practices implemented on the long road of transition towards the sustainable production and consumption model that the CE involves. Finally, this study also focuses on analysing the way in which companies quantify different circular variables, such as materials inflow and outflow, water and energy consumption, and how this information is communicated to different stakeholders.
At Spanish state level, studies analysing CE implementation have been conducted in the Basque Country and Navarra [20,21] and Aragon [22,23]. This study will help expand the geographical scope of the research by analysing the situation in Catalonia.
This article is organized into 5 sections. Section 2 reviews the literature on CE-related concepts in the field of SMEs and their relationship with EMS. Section 3 describes the methodology designed to respond to the research questions based on information in the environmental statements. The results are presented in Section 4. Finally, results analysis and the main conclusions and limitations of the study are contained in Section 5.
2. Overview of the Research Context
In 2015, the United Nations presented the 2030 Agenda for Sustainable Development, which established 17 Sustainable Development Goals (SDG) focusing on people, planet and prosperity. The CE is one of the central elements for achieving some of the goals, among which five are especially noteworthy:
- SDG 7: Ensure access to affordable, reliable, sustainable and modern energy.
- SDG 8: Promote inclusive and sustainable economic growth, employment and decent work for all.
- SDG 9: Build resilient infrastructure, promote sustainable industrialization and foster innovation.
- SDG 12: Ensure sustainable consumption and production patterns.
- SDG 13: Take urgent action to combat climate change and its impacts.
Since then, the CE has been vigorously implemented in the EU Commission’s economic policy with the aim of promoting the transition towards production and consumption systems based on the principles of circularity [24]. In a global context of strained, over-exploited resources, no one questions the importance of taking sustainability into account in business strategies, business models and product and service design [6,25,26]. It is the key to moving towards a more competitive, responsible and circular economy for progress and social wellbeing.
The definition of CE has been widely debated depending on the field of knowledge and the issues addressed [7,9,23,27,28,29,30], but consensus does exist that CE is an economic model oriented towards achieving more efficient and resilient production and consumption systems that preserve resources within a continuous cycle optimizing their value [31,32,33]. Thus, the numerous, different definitions of CE can be classified according to whether they focus on its objectives, activities or outcomes [34]. Some of these contributions are summarized briefly in Table 1.

Table 1.
Contributions to the definition of Circular Economy.
In short, the new economic paradigm involving the CE requires a change in both business and individual outlook, rethinking the ways in which we produce and consume. Some authors [30,45,46] have established varying levels of analysis in the implementation of CE principles:
- Macro: includes national and supranational levels where work is being done to promote a society oriented towards recycling and circularity implemented nationally and supranationally. Includes cities and states.
- Meso: contemplates CE implementation through eco-parks, local industrial symbiosis initiatives and through the management of waste and the inflow and outflow of resources and raw materials in a territory.
- Micro: refers to companies and organisations and consumers. CE objectives for this level are focused mainly on more environmentally sustainable production.
- Nano: at process or product level.
Thus, this new paradigm shift should take place under a multi-level approach [47]. It should also be implemented at all levels simultaneously and always within the framework of the Triple Bottom Line perspective [48], which intersects economic aspects with social and environmental ones [39].
2.1. Adopting the Circular Economy in SMEs
According to the results of a new Eurobarometer survey (December 2019), 94% of citizens from all EU Member States said that protecting the environment was important for them. Ninety-one percent stated that climate change was a serious problem in the EU, and 80% of respondents, reaching 90% in the case of Spain, felt that industry was not doing enough to protect the environment. The survey also revealed that citizens believed responsibility should be shared by large companies and industry, national governments and the EU, as well as by the citizens themselves. It was recognized that fundamental changes may be needed as well as greater investment in research and development, more information and education, stricter legislative control and the promotion of company participation in sustainable activities.
SMEs play a fundamental role in the transition to a CE both at global and European level and in Spain, where they represent 99.83% of all companies [49]. Thus, SMEs are essential drivers for the transition towards a CE. Identifying all the opportunities gained and progress made by these companies in different territories in this field and highlighting their importance is a necessary starting point to attract new initiatives to help shape an environment that fosters more CE business strategies.
Challenges and opportunities for companies in their transition towards a CE model have been identified in different studies [47,50,51,52,53,54]. On this basis, it must be taken into account that business incentives and motivation to move forward in this direction may differ greatly, both qualitatively and quantitatively, depending on the sector, the company and its location [55]. In some cases, the focus will be on transforming existing business activities, while in others, new business models will have to be introduced for which there may be no precedent. It is also important to keep in mind that, although circularity may exist across the entire value chain, it is possible that in the early stages of implementing the new circularity paradigm, all progress with positive impacts should be recognized and encouraged, even though only one part of the value chain is affected and only a part of the possible stakeholders have been integrated.
It is well known that SMEs have a daily work routine that is packed with obligations, and they are very focused on their business, but they should take a moment to reflect on what routes to take and the possible benefits that transitioning to the CE can bring them [52,56,57]. Aside from traditional ways of approaching business, many other ways exist and being more sustainable is not the only reason for making this transition, but also being more competitive, having a mid- to long-term plan, or being innovative, to name but a few.
Some public incentives can help promote the adoption of sustainable CE manufacturing practices among SMEs [58,59,60,61,62,63,64,65,66]. Promoting the introduction of broader circular principles related to the exchange of goods and services through polices supporting corporate social responsibility is also useful [67].
At a European level, there are the European Structural and Investment Funds, the SME Instrument, or Fast Track to Innovation [24]. In Spain, the 2030 Spanish Circular Economy Strategy was passed on 2 June 2020, in line with the objectives of the two European Commission Circular Economy Action Plans: (1) Closing the loop: an EU action plan for the Circular Economy, and (2) A New Circular Economy Action Plan for a Cleaner and more Competitive Europe (2020) in addition to the European Green Deal and the 2030 Agenda for Sustainable Development. At the level of Catalonia, the Government of Catalonia Strategy for Promoting Green and Circular Economy in Catalonia and the Catalan Eco-design Strategy have been created to promote a CE based on eco-innovation. The PIMEC business organization has also approved its own strategy for promoting a green and CE.
However, apart from the support that SMEs can obtain through the state, regional governments or business associations, it is worth highlighting where business opportunities can be found, so SMEs can focus on increasing their income in this area. Lacy and Rutqvist [68] identified five circular business models (Circular Supplies, Resource Recovery, Product Life Extension, Sharing Platforms and Product as a Service), and the consulting firm Accenture [56] highlighted 10 technologies (in particular, digital technologies in the form of social networks, cloud computing, analytics and mobility), which are enabling levels of speed and flexibility not seen before. Thanks to these business models and technologies, companies can focus on circular advantage from the customer’s point of view instead of on simply improving efficiency.
2.2. Environmental Management Systems and the Circular Economy
The Pact for a Circular Economy [24] was spearheaded by various government entities in order to define the process of transition towards a CE model. One of its actions is to develop guidelines to boost innovation and the overall efficiency of production processes by introducing measures such as EMS. Since the Pact was written, certifiable EMS have been adopted by a significant number of businesses and institutions [69,70,71], and a considerable number of studies have highlighted their strengths and weaknesses [72,73,74,75,76,77,78,79]. Other institutions and researchers have also highlighted the importance of adopting environmental management standards [80] and eco-labels [81,82] to foster CE within companies.
One of the standards underpinning the transition to CE is the Eco-Management and Audit Scheme (EMAS). EMAS was developed in 1993, a year before the first version of the international standard ISO 14001 was published, and a year after the 1992 Rio Summit. At the Rio Summit, a broad intergovernmental agreement on a global action plan to promote sustainable development, called Agenda 21, was approved and the United Nations Commission for Sustainable Development was created. After 27 years, the EMAS model continues to be a reference of excellence for environmental management systems. Throughout this time, the scheme has been evolving alongside organisations, adapting to their needs and expectations, and to changes in European policies and strategies. It has undergone up to four revisions, the last one in January 2019 [83].
The EMAS Regulation can help businesses on the path towards a CE as it evaluates the environmental impact of their activities, as well as encouraging improvements in their energy efficiency and developing systematized audits. It also monitors and guarantees the transparency of their processes [80]. In essence, EMAS contributes to circular development by analysing and measuring the efficient use of resources [12,83,84].
The benefits of a circular model can be reaped by taking both the context and stakeholders into account, identifying the environmental aspects and legal requirements, as well as any associated risks and opportunities; in other words, adopting a Lifecycle perspective and risk-based thinking. In addition, a circular model enables organisations to not only ensure legal compliance but also plan ahead for new environmental requirements to be approved, which in turn contribute to minimizing risks and identifying new business opportunities.
Approaching EC implies changing the business model and incorporating new management practices. To do so, involving employees is essential. This is a long-standing requirement in the EMAS and makes employees aware of the importance of participating in the system. It is particularly important for senior management to be involved as they bear the greatest responsibility for the company’s environmental strategy and can therefore demonstrate their leadership.
EMAS requires that organisations demonstrate continuous improvement in their environmental performance on an ongoing basis. This encourages the organization to investigate the efficiency of resource consumption, changes in processes, the search for less contaminating materials and other actions that are a driving force for innovation. The annual publication of the environmental statement gives EMAS organisations a major opportunity for transparency. This additional initiative, compared to the ISO 14001 standard, for example, is recognized by all interested parties, including public administrations. This is what makes it a very powerful communication tool which highlights the actions taken to move towards circular models. It also serves as an example for other organisations to verify the advantages of adopting the principles that govern the CE.
Hence, this study aims to identify the CE practices currently reported by EMAS-registered industrial sector SMEs. The question that arises at this point is what adopting a CE model means for companies in this sector. The literature refers to sustainable manufacturing as a radical change within the context of closed-loop product systems. The concept of Resource Conservative Manufacturing, ResCoM, has been introduced as a new paradigm for sustainable manufacturing [85]. Since traditional business models, products and supply chains have been designed to operate in linear systems, they are unable to cope with the dynamics of closed-loop systems. Therefore, a novel approach is proposed in which the dynamic interaction between business models, product design, supply chains and customers is essential, and at the same time treated as an integral part of industrial firms [86]. The concept of ResCoM includes the concept of multiple product lifecycles and, together with energy conservation, material and added value with waste prevention and environmental protection are integrated components of the product design and development strategy [10]. A difficulty for many SMEs is the fact that these companies often work on a B2B basis and producers cannot control the final product. The majority lose their traceability, which means that they cannot take action in the reclaiming materials stage, and this limits their actions regarding clean production practices to within the company alone [13,47].
2.3. Models for Measuring Micro Level Circularity Actions
In order to measure the degree to which businesses adopt CE, several studies in the literature that propose definitions of micro-level circularity indicators were identified [87,88,89,90,91,92]. Their novelty, together with the very generic definition given to them, may explain the low degree of CE adopted by businesses [93,94,95]. Park and Kremer [96] warn that companies need to understand the usefulness, importance and potential benefits of environmental sustainability indicators in order to be able to use them in their operations management [97]. Another key issue is obtaining the considerable amount of data these indicators require. Much of the necessary data is difficult to gather and often has to be provided by various actors linked to the product lifecycle. This difficulty in obtaining data, both in terms of time and cost, is one of the main stumbling blocks for extending the use of indicators to a company or organization level, due to the lack of information exchange between companies and confidentiality issues [98,99]. Despite this, advances in digital technology should make it easier and faster to obtain data [27]. Standards publications such as the BS8001:2017-Framework for implementing CE principles in organisations [92] should also help guide organisations in implementing the standards.
Various models proposing to measure circularity activities or practices in companies have been identified in the literature: Garza-Reyes et al. [100] carried out a review of various models used to measure CE in SMEs and proposed a model that includes 36 practices grouped into 7 factors; Masi et al. [101] mention 25 CE practices; the European Environmental Agency (EEA) [3] proposes 16 actions grouped into 5 key characteristics; Mura et al. [52] identify 20 practices; Aranda-Uson et al. [18] propose 13 activities grouped into 4 levels; Fonseca et al. [13] propose 15 dimensions; Prieto-Sandoval et al. [20] define 11 elements as fields of action for CE; Janik and Zafraniek [84] establish 12 practices grouped in the 5 categories described as key elements by the EEA [3]; and Rizos et al. [51] mention 8 main processes.
Some of these proposals have been put into practice, and the models used to measure the degree to which CE has been adopted by businesses at both national and regional level are shown in Table 2.
Table 2.
Studies on EC implementation in companies.
In this study, the model proposed by Prieto-Sandoval et al. [20] was followed to analyse the CE practices reported in the environmental statements. The underlying concept of this model is that CE can be understood through 5 areas of action: Take, Make, Distribute, Use and Recover. Each of these areas is specified in a series of circular practices in line with the key characteristics proposed by the EEA [3], enabling comparisons with similar studies to be made (see Table 3). We found that only 3 fields of action (Take, Make and Recover) had key related characteristics.
Table 3.
Circular practices following the model of fields of action.
3. Methodology
The research questions posed in the study are answered based on the theoretical framework described in the previous section, and an analysis of the environmental statements of EMAS-registered businesses in the industrial sector in Catalonia (northeast Spain). The study presents an exploratory analysis of public environmental statements, or those verified by accredited third parties. To achieve this, the research was carried out in several stages.
Firstly, access was gained to the European Commission’s EU EMAS Helpdesk register, and in June 2019, a list of 845 EMAS-verified centres in Spain was obtained. Of these, 233 pertain to businesses in Catalonia and 59 to the industrial sector. Of these, 31 are SMEs, and make up the study population (see Table 4).
Table 4.
Description of the study population.
The second step was to search for the statements directly on the company websites, or when they were not found directly, using the web search engine. In the search, the following criteria were taken into account: (1) most recent environmental statement and (2) Spanish and/or Catalan language and the key words: “Name of the company” + “EMAS statement/Environmental statement” and/or “EMAS verification number”. A review process was then carried out to ensure that the documents met the above criteria and were accessible for Optical Character Recognition (OCR). In addition, in order to ensure the information was relevant, all documents were verified by an accredited verification body.
Thirdly, to determine what data should be collected from the statements and which ones would provide relevant information on circularity practices, the characteristics of the two models were used in way that was complementary: Fields of action and the EEA key characteristics (see Table 3). Based on the above, a list of 23 CE practices was obtained, grouped into 6 categories: Natural Resources (NR), Renewable Energy (RE), Raw Materials (RM), Reduce Emission (EM), Waste Management (WM) and Product Lifecycle (LC) and classified according to the fields of action proposed by Prieto-Sandoval et al. [20] (see Table 5).
Table 5.
Elements of Fields of Action model and CE practices.
The data grid (Table S1) was designed, corroborated and validated by the researchers to establish whether the information was available in the statements. Both qualitative data on circularity practices mentioned (1) and no mentioned (0), and quantitative data (positive (1) or negative (0) performance variation) were gathered. Quantitative data compiled consumption of water, energy, raw materials and waste, which was related to both the production volume, as well as differences in comparison to the previous year (see Figure 1).
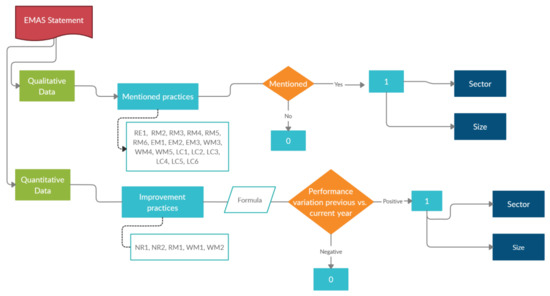
Figure 1.
Data coding and classification process.
The fourth step involved searching for the data, then coding it using Atlas.ti software. All three researchers analysed and categorized all the information in the documents following the research model (see Table S1, Figures S1 and S2 in Supplementary Materials). The same protocol of action was followed and added the grid designed and agreed by all members of the group in order to ensure reliability and validity [104].
Finally, the data gathered independently was verified and discussed by the researchers in order to avoid errors before adding them to the grid with the final information chosen. The data was subsequently statistically processed using the SPSS v25 software.
4. Results
In accordance with the objectives of the study, the Research Questions are thus answered.
4.1. RQ1: Do Companies Include the CE Concept in Their Environmental Statements?
Of the 31 statements analysed, only 3 explicitly mentioned the term “Circular Economy”. It should be noted that the time period of the statements studied is from 2016 to 2019, and the incursion of the term is relatively recent in the business world.
4.2. RQ2: What CE Activities or Practices do Companies Claim to Have Adopted? Are Some Activities More Commonly Adopted than Others?
Although the term is not explicitly mentioned in most of the statements, one of the aims of the study was to explore which circularity practices are mentioned in the environmental statements of EMAS-registered organisations in the industrial sector in Catalonia. A total of 23 practices were identified, which can be grouped into 6 categories (1) Natural Resources, (2) Renewable Energies, (3) Raw Materials, (4) Emissions, (5) Waste Management;, and (6) Product Lifecycle. Figure 2 shows the number of companies mentioning these practices in their environmental statements. We can conclude that the most commonly implemented practices belong to the fields of action Take and Make.
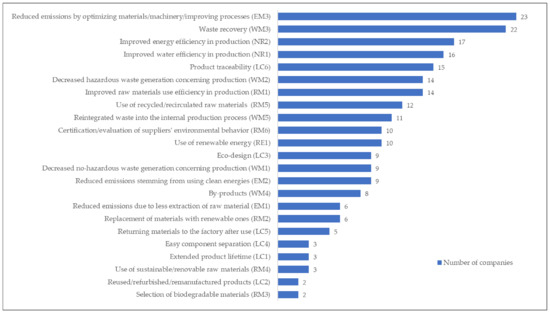
Figure 2.
Circularity practices mentioned in the Eco-Management and Audit Scheme (EMAS) Environmental Statements.
To analyse the practices mentioned above, organisations were examined to see how they were distributed according to size and grouped by industrial sectors (Figure 3).
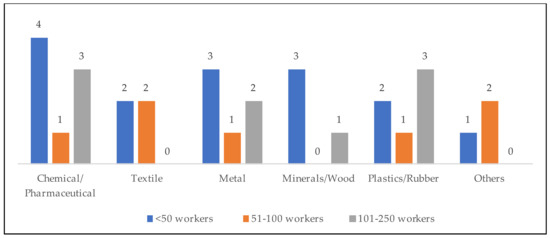
Figure 3.
Population distribution by size and sector.
The practices were divided into two types: quantitative, which enabled the increase or decrease in yield to be calculated, and qualitative, which determined whether actions related to the practices were mentioned or not. For the quantitative practices, the following formula was used and adapted to either the consumption of natural resources or raw materials:
and for waste reduction:
Table 6 shows the practices organisations have implemented corresponding to the size or industry sector group. In the performance practices (Improved water efficiency in production, Improved energy efficiency in production, Improved raw materials use efficiency in production) those with increased performance were counted.
Table 6.
Contingency table. Distribution of practices by company size and sector groupings.
It was noted that some practices were mentioned more frequently in the statements; for example, reducing emissions by optimizing materials, machinery or improving processes (74%). Within this practice, it is worth highlighting that the main practice mentioned by the majority of organisations was that renewing equipment or machinery enables them to reduce the consumption of natural resources and/or raw materials, which in turn reduces emissions. The second most frequently mentioned practice is waste recovery (72%), most of which was carried out through an authorized manager. No information was found in the statements on the behaviour of organisations in relation to limits of waste in landfill or incineration, and confusion was detected when using the terms recovery, waste treatment and by-products.
All the statements were checked for mention of practices employed to improve water and energy consumption performance, and calculations were made to determine differences in performance compared to the previous year. Of the 31 organisations analysed, findings showed that 52 per cent achieved improvements in water use performance and 55 per cent in energy use performance.
In the Product Lifecycle category, fewer CE-related actions were found, with the exception of product traceability (48%). Organisations generally mentioned that they take the product lifecycle into account, but there were no details available regarding how they could monitor or track products, parts or components once they had left their facilities or production plants.
The contingency table (see Table 6), in which binary data compare 3 or more independent groups, was carried out in order to check whether the participation of the analysed companies in CE practices according to their sector and size.
Significant associations between circularity practices in size grouping were observed in the following cases:
- Improved energy efficiency in production: while companies with 51–100 workers showed increased energy efficiency (6 out of 7), only 1 out of 4 of the companies with 101–250 workers showed a decrease.
- Renewable energy use: companies with <50 workers and those with 101–250 workers mention renewable energy (5 out of 15, and 5 out of 8, respectively). Companies with 51–100 workers do not report using renewable energy (0 out of 7).
- Eco-design: companies with <50 workers and those with 101–250 workers mention eco-design in their statements (4 out of 15, and 5 out of 8, respectively). Companies with 51–100 workers do not report any eco-design actions (0 out of 7).
- By sector, significant differences were found in the following cases:
- Renewable energy use: while the total of the companies in the Minerals/Wood group (4 out of 4) reported using renewable energies, the Textile and Other industries groups do not mention using renewable energies (0 out of 4 and 0 out of 6, respectively).
- Reduction in emissions stemming from using clean energies: The Minerals/Wood group mentions a reduced emissions from clean energy use (4 out of 4); the Textile and Metal groups do not mention any actions taken regarding clean energies (0 out of 4 and 0 out of 6).
Finally, in order to analyse the relationship between circularity practices, the Phi correlation coefficient test was carried out as these are nominal dichotomous variables [105]. The correlation matrix (see Table S2) indicates that practices are related, both within the same category (Raw Materials, Emission Reduction, Waste Management and Product Lifecycle) and between categories. The coloured cells are significant relationships.
Table 7 summarizes the practices most frequently related to CE and Table 8 shows the cases in which correlations were found between practices in various categories.
Table 7.
Relationship between practices considered drivers of change towards a CE.
Table 8.
Relationship between CE practices with significant correlation (p < 0.05).
Within the group of businesses analysed, 23 directly positive correlations were found: 2 high (with correlation strength between 1 and 0.7), 14 moderate (between 0.69 and 0.4), 7 low (between 0.39 and 0.10) and 1 low inverse correlation (<0) was also found. The practices showing the highest correlation were using biodegradable raw materials and raw materials of sustainable and/or biodegradable origin (rφ = 0.802), followed by extending product life cycle and returning materials to the factory after use (rφ = 0.745). In contrast, practices employed to improve energy efficiency and use renewable energies showed a low negative correlation (rφ = −0381).
4.3. RQ3: How Are CE Practices Reported and Quantified in Environmental Statements? How Are These Practices Reported to Stakeholders?
As mentioned above, previous studies on implementing circularity practices at micro level, especially in SMEs, were taken as a reference for this study. From there, the list of search criteria for CE practices within the statements was established (see Table S1). Although the majority of the statements are structured in accordance with the indications of the EMAS regulation, a wide disparity was found in the way the results were presented, especially with regard to the consumption of natural resources, raw materials, particularly the production indicator (m3, tones, physical units or by number of workers) which indicate whether yields show an improvement or a decrease.
The statements also differed widely regarding the number of workers involved, the length of the documents and the way in which each organisation presents the information. Standardising the information required by EMAS could help stakeholders access the data in a clearer and simpler way, as well as enabling comparative studies between companies to be carried out.
4.4. RQ4: Does a Relationship Exist between Circularity Practices and Economic Performance?
To analyse the economic performance of the companies in the study, Turnover, Net Profit and Economic Profitability variables of the SABI database were examined (see Table S1). Finally, we chose to only focus our analysis on Turnover due to the differences in the types of organisations in both size and sector. No significant correlation was found which could determine a relationship between incorporating circularity practices and economic performance.
4.5. RQ5: What Information Should Be Included in Environmental Statements in the Future to Help Evaluate the Application of Circularity Practices in EMAS-Registered Companies?
With a view to strengthening the statements beyond being just a tool for providing information on the consumption of natural resources, raw materials and environmental behaviour in generating waste and emissions, it would also be useful to know if the organisation is registered with an industrial cluster of some kind in order to reuse by-products, or for companies to provide more precise information on changing to renewable energies and the percentage of use with respect to total consumption, and whether this is self-generated.
Of the six categories analysed (see Table 6), Product Life Cycle is the least covered or addressed, but it offers the most opportunities for entering into CE and close the cycle of processes and products.
5. Discussion and Conclusions
Based on the analytical framework and models proposed at the micro level, this study has identified 23 circularity practices that are currently being adopted by SME companies with EMAS regulation in the industrial sector in Catalonia. Based on the model proposed by Prieto-Sandoval et al. [20], we can conclude that of the 5 fields of action needed to make the transition to the CE model (Take, Make, Use, Distribution and Recover), the majority of the practices implemented only mainly refer to Take and to a lesser extent to Make and Recover. The results of our study are in line with those obtained in Spain by Ormazábal et al., 2016 [21] (Take and Recover); Ormázabal et al., 2018 [47] (Take),; and Aranda-Usón et al., 2020 [18] (Take and Recover). At the European level, in Portugal, Fonseca et al., 2018 [13] highlight Take and Recover, as does Mura et al., 2020 [52] in Italy. Janik and Szafraniec, 2019 [84], describe practices associated with Take in Poland. Therefore, it can be concluded that most of the studies detected coincide in highlighting circular practices mainly in the fields of Take and Recover.
EMAS companies have made headway in measuring and quantifying consumption of natural resources and emissions and waste generated. However, it is clear that the EMAS model has not contributed to standardising how information is presented in statements nor to using general indicators to facilitate comparisons between companies. Several statements showed that companies report their environmental impacts without making reference to their annual production volumes. Results also showed that the units used to give the data differ from one company to another, making it very difficult to compare the progression of implementing circularity actions between companies, as pointed out by Janik and Szafraniek [84]. As mentioned by Aranda et al. [18], findings demonstrate that standardized metrics need to be implemented in order to measure the environmental impact of CE activities within companies.
To date, no consensus has been reached in the literature as to which indicators are the most suitable for measuring circularity and can be applied by SMEs. Therefore, the authors of this study propose taking the key characteristics of CE into consideration according to the fields of action. The implementation of a production model based on CE means much more than reducing waste through recycling. It also requires reducing the consumption of raw materials, designing environmentally friendly products that can be easily recovered and reused, lengthening product lifetimes through proper maintenance, using recyclable materials in products and taking actions to recover raw materials from waste streams [1].
In relation to groups by size and sector, the results show that organisations with <50 and 101–250 workers, and those in the Minerals/Wood sector are more concerned about practices related to using renewable energies and the reduction of emissions. These same groups of companies, by size, also correspond to those that reported practices aimed at product eco-design. Similarly, the correlation matrix clearly demonstrates that using renewable energies is linked to emission reduction practices. Future studies could analyse this in greater depth by looking at different years and standardizing production indicators for CE practices among companies.
Eco-design was one of the practices with the highest correlation and is associated with Returning materials to the factory after use, Extending product lifecycle, Reintegrating waste into the internal production process and Using recycled and recirculated raw materials (see Table 8). This analysis enables associations between practices to be detected; however, future research could investigate whether causality between CE practices exists and what factors motivate internalizing environmental discourse within companies [78].
Other practices such as using biodegradable raw materials are closely linked to raw materials of sustainable origin or from renewable sources. Reusing/reconditioning/remanufacturing products and parts is beginning to appear in statements, although in an incipient way and may require emphasising the areas of Distribute and Use to facilitate its implementation.
Although waste recovery occurs in 71% of the companies researched, it is only linked to by-products. This corroborates the study by Daddi et al. [106], which points out the importance of encouraging the development of eco-industrial parks and strengthening business associations, clusters, and all kinds of groups and networks in order to work at a meso level and move towards an economy based on collaborative networks. The fact that no practices have been detected in the areas of Distribute and Use indicates that CE practices need to be extended beyond the internal level in EMAS-registered companies in Catalonia’s industrial sector. It is essential to understand that the CE model does not affect individual companies but rather refers to the interconnection of the business fabric as a whole [101,107], as well as the rest of stakeholders in order to successfully introduce the concept of CE on a large scale [10]. A key factor could be to facilitate communication between the various stakeholders (organisations, customers, users, administration). However, for this to occur, more efficient information and communication tools need to be developed whichthat will enable companies and organisations to continue improving the practices implemented, as well as making inroads into others that will enhance the circular model.
Finally, along the lines of Aranda-Usón et al. [18], this study has also failed to detect any significant correlation that could determine any relationship between the incorporating circularity practices and a company’s economic performance.
This study is limited to analysing CE practices in industrial sector SMEs with EMAS in Catalonia. Several proposals are put forward for future research: (a) widen the study to include the trade and service sectors, (b) extend the study to companies with other types of EMS already in place such as ISO 14001, (c) replicate similar research in other regions or countries and (d) carry out studies based on developing surveys or questionnaires enabling an in-depth analysis of the extent to which these CE practices are adopted by businesses.
Supplementary Materials
The following are available online at https://www.mdpi.com/2071-1050/12/21/9011/s1, Figure S1: Example Codification 1 with Atlas.ti. Source: screenshot of document encoding in Atlas.ti (Version 8.4.24.9), Figure S2: Example Codification 2 with Atlas.ti. Source: screenshot of document encoding in Atlas.ti (Version 8.4.24.9) Table S1: Data collection grid; Table S2: Phi coefficient correlation matrix of circularity practices.
Author Contributions
The manuscript was written by A.B., R.d.C. and G.G. All the authors contributed to the conceptualization, methodology, formal analysis, writing—original draft preparation and writing—review and editing. All authors have read and agreed to the published version of the manuscript.
Funding
This research is an outcome of the Efficiency, Innovation, Competitiveness and Sustainable Business Performance (EFICOSPER) research project, funded by MINECO/AEI/FEDER/EU: ECO2017-86054-C3-3-R.
Acknowledgments
The authors would like to thank the EFICOSPER project partners, the GRADIENT and GREP teams, and members of the University of Girona, for their input and discussions on the topic of CE.
Conflicts of Interest
The authors declare no conflict of interest.
References
- Ellen MacArthur Fundation. Towards the circular economy. Econ. Bus. Ration. Accel. Transition 2013, 2, 23–44. [Google Scholar]
- Mitchell, P. Economic Growth Potential of More Circular Economies. WRAP (Waste & Resources Action Programme), 2015. Available online: https://www.researchgate.net/publication/284187423_Economic_growth_potential_of_more_circular_economies (accessed on 15 October 2020).
- European Environment Agengy. Circular economy in Europe—Developing the Knowledge Base—European Environment Agency. Available online: https://www.eea.europa.eu/publications/circular-economy-in-europe (accessed on 27 July 2020).
- Veleva, V.R.; Bodkin, G. Corporate-entrepreneur collaborations to advance a circular economy. J. Clean. Prod. 2018, 188, 20–37. [Google Scholar] [CrossRef]
- Franco, M.A. Circular economy at the micro level: A dynamic view of incumbents’ struggles and challenges in the textile industry. J. Clean. Prod. 2017, 168, 833–845. [Google Scholar] [CrossRef]
- Lewandowski, M. Designing the Business Models for Circular Economy—Towards the Conceptual Framework. Sustainability 2016, 8, 43. [Google Scholar] [CrossRef]
- Pieroni, M.P.; McAloone, T.C.; Pigosso, D.C. Business model innovation for circular economy and sustainability: A review of approaches. J. Clean. Prod. 2019, 215, 198–216. [Google Scholar] [CrossRef]
- Garcés-Ayerbe, C.; Rivera-Torres, P.; Suárez-Perales, I.; La Hiz, D.I.L.-D. Is It Possible to Change from a Linear to a Circular Economy? An Overview of Opportunities and Barriers for European Small and Medium-Sized Enterprise Companies. Int. J. Environ. Res. Public Heal. 2019, 16, 851. [Google Scholar] [CrossRef]
- Katz-Gerro, T.; Sintas, J.L. Mapping circular economy activities in the European Union: Patterns of implementation and their correlates in small and medium-sized enterprises. Bus. Strat. Environ. 2018, 28. [Google Scholar] [CrossRef]
- Lieder, M.; Rashid, A. Towards circular economy implementation: A comprehensive review in context of manufacturing industry. J. Clean. Prod. 2016, 115, 36–51. [Google Scholar] [CrossRef]
- European Comission. Moving towards a Circular Economy with EMAS. Luxemburg 2017. [Google Scholar] [CrossRef]
- Marrucci, L.; Daddi, T.; Iraldo, F. The integration of circular economy with sustainable consumption and production tools: Systematic review and future research agenda. J. Clean. Prod. 2019, 240, 118268. [Google Scholar] [CrossRef]
- Fonseca, L.M.; Domingues, J.P.; Pereira, M.T.; Martins, F.; Zimon, D. Assessment of Circular Economy within Portuguese Organizations. Sustainability 2018, 10, 2521. [Google Scholar] [CrossRef]
- Ormazabal, M.; Sarriegi, J.M.; Barkemeyer, R.; Viles, E.; McAnulla, F. Evolutionary Pathways of Environmental Management in UK Companies. Corp. Soc. Responsib. Environ. Manag. 2013, 22, 169–181. [Google Scholar] [CrossRef]
- Parker, C.M.; Redmond, J.; Simpson, M. A Review of Interventions to Encourage SMEs to Make Environmental Improvements. Environ. Plan. C: Gov. Policy 2009, 27, 279–301. [Google Scholar] [CrossRef]
- EMAS Register. Register of EMAS Firms. Available online: https://webgate.ec.europa.eu/emas2/public/registration/list (accessed on 15 July 2019).
- Del Río, P.; Carrillo-Hermosilla, J.; Könnölä, T.; Bleda, M. Resources, capabilities and competences for eco-innovation. Technol. Econ. Dev. Econ. 2015, 22, 274–292. [Google Scholar] [CrossRef]
- Aranda-Usón, A.; Portillo-Tarragona, P.; Scarpellini, S.; Llena-Macarulla, F. The progressive adoption of a circular economy by businesses for cleaner production: An approach from a regional study in Spain. J. Clean. Prod. 2020, 247, 119648. [Google Scholar] [CrossRef]
- European Comission. Towards a Circular Economy: A Zero Waste Programme for Europe. Brussels 2014. Available online: http://ec.europa.eu/environment/resource_efficiency/re_platform/index_en.htm (accessed on 5 September 2020).
- Prieto-Sandoval, V.; Ormazabal, M.; Jaca, C.; Viles, E. Key elements in assessing circular economy implementation in small and medium-sized enterprises. Bus. Strat. Environ. 2018, 27, 1525–1534. [Google Scholar] [CrossRef]
- OOrmazabal, M.; Prieto-Sandoval, V.; Jaca, C.; Santos, J. An overview of the circular economy among SMEs in the Basque country: A multiple case study. J. Ind. Eng. Manag. 2016, 9, 1047–1058. [Google Scholar] [CrossRef]
- Portillo, P.; Estudios, C. Nivel de Implantación de la Economía Circular en Aragón; CESA: Zaragoza, Spain, 2017. [Google Scholar]
- Aranda-Usón, A.; Portillo-Tarragona, P.; Marín-Vinuesa, L.M.; Scarpellini, S. Financial Resources for the Circular Economy: A Perspective from Businesses. Sustainability 2019, 11, 888. [Google Scholar] [CrossRef]
- European Comission. Closing the Loop—An EU Action Plan for the Circular Economy. Brussels 2015. Available online: https://eur-lex.europa.eu/resource.html?uri=cellar:8a8ef5e8-99a0-11e5-b3b7-01aa75ed71a1.0012.02/DOC_1&format=PDF (accessed on 5 September 2020).
- Manninen, K.; Koskela, S.; Antikainen, R.; Bocken, N.; Dahlbo, H.; Aminoff, A. Do circular economy business models capture intended environmental value propositions? J. Clean. Prod. 2018, 171, 413–422. [Google Scholar] [CrossRef]
- Witjes, S.; Lozano, R. Towards a more Circular Economy: Proposing a framework linking sustainable public procurement and sustainable business models. Resour. Conserv. Recycl. 2016, 112, 37–44. [Google Scholar] [CrossRef]
- Geissdoerfer, M.; Savaget, P.; Bocken, N.M.; Hultink, E.J. The Circular Economy—A new sustainability paradigm? J. Clean. Prod. 2017, 143, 757–768. [Google Scholar] [CrossRef]
- Walls, J.L.; Paquin, R.L. Organizational Perspectives of Industrial Symbiosis. Organ. Environ. 2015, 28, 32–53. [Google Scholar] [CrossRef]
- Zeng, H.; Chen, X.; Xiao, X.; Zhou, Z. Institutional pressures, sustainable supply chain management, and circular economy capability: Empirical evidence from Chinese eco-industrial park firms. J. Clean. Prod. 2017, 155, 54–65. [Google Scholar] [CrossRef]
- Kirchherr, J.; Reike, D.; Hekkert, M. Conceptualizing the circular economy: An analysis of 114 definitions. Resour. Conserv. Recycl. 2017, 127, 221–232. [Google Scholar] [CrossRef]
- Prieto-Sandoval, V.; Jaca, C.; Ormazabal, M. Towards a consensus on the circular economy. J. Clean. Prod. 2018, 179, 605–615. [Google Scholar] [CrossRef]
- Murray, A.; Skene, K.; Haynes, K. The Circular Economy: An Interdisciplinary Exploration of the Concept and Application in a Global Context. J. Bus. Ethic. 2015, 140, 369–380. [Google Scholar] [CrossRef]
- Ellen Macarthur Foundation. Growth within: A circular economy vision for a competitive Europe. Ellen MacArthur Found 2015, 100, 1–22. [Google Scholar]
- Ghisellini, P.; Cialani, C.; Ulgiati, S. A review on circular economy: The expected transition to a balanced interplay of environmental and economic systems. J. Clean. Prod. 2016, 114, 11–32. [Google Scholar] [CrossRef]
- Yuan, Z.; Bi, J.; Moriguichi, Y. The Circular Economy: A New Development Strategy in China. J. Ind. Ecol. 2008, 10, 4–8. [Google Scholar] [CrossRef]
- Li, H.; Bao, W.; Xiu, C.; Zhang, Y.; Xu, H. Energy conservation and circular economy in China’s process industries. Energy 2010, 35, 4273–4281. [Google Scholar] [CrossRef]
- Andersen, M.S. An introductory note on the environmental economics of the circular economy. Sustain. Sci. 2006, 2, 133–140. [Google Scholar] [CrossRef]
- Kama, K. Circling the economy: Resource-making and marketization in EU electronic waste policy. Area 2014, 47, 16–23. [Google Scholar] [CrossRef]
- Zhijun, F.; Nailing, Y. Putting a circular economy into practice in China. Sustain. Sci. 2007, 2, 95–101. [Google Scholar] [CrossRef]
- Ehrenfeld, J.; Gertler, N. Industrial Ecology in Practice: The Evolution of Interdependence at Kalundborg. J. Ind. Ecol. 1997, 1, 67–79. [Google Scholar] [CrossRef]
- Jacobsen, N.B. Industrial Symbiosis in Kalundborg, Denmark: A Quantitative Assessment of Economic and Environmental Aspects. J. Ind. Ecol. 2008, 10, 239–255. [Google Scholar] [CrossRef]
- Liu, Q.; Li, H.-M.; Zuo, X.-L.; Zhang, F.-F.; Wang, L. A survey and analysis on public awareness and performance for promoting circular economy in China: A case study from Tianjin. J. Clean. Prod. 2009, 17, 265–270. [Google Scholar] [CrossRef]
- Morlet, A.; Blériot, J.; Opsomer, R. Intelligent Assets: Unlocking the Circular Economy Potential, by the Ellen MacArthur Foundation and World Economic Forum as Part of Project MainStream. 2016. Available online: https://www.ellenmacarthurfoundation.org/publications/intelligent-assets (accessed on 5 September 2020).
- Haas, W.; Krausmann, F.; Wiedenhofer, D.; Heinz, M. How Circular is the Global Economy? An Assessment of Material Flows, Waste Production, and Recycling in the European Union and the World in 2005. J. Ind. Ecol. 2015, 19, 765–777. [Google Scholar] [CrossRef]
- Mathews, J.A.; Tan, H. Progress Toward a Circular Economy in China: The drivers (and inhibitors) of eco-industrial initiative. J. Ind. Ecol. 2011, 15, 435–457. [Google Scholar] [CrossRef]
- Saidani, M.; Yannou, B.; Leroy, Y.; Cluzel, F. How to Assess Product Performance in the Circular Economy? Proposed Requirements for the Design of a Circularity Measurement Framework. Recycling 2017, 2, 6. [Google Scholar] [CrossRef]
- Ormazabal, M.; Prieto-Sandoval, V.; Puga-Leal, R.; Jaca, C. Circular Economy in Spanish SMEs: Challenges and opportunities. J. Clean. Prod. 2018, 185, 157–167. [Google Scholar] [CrossRef]
- Elkington, J. The Triple Bottom Line. Does it All Add Up? Henriques, A., Richardson, J., Eds.; Routledge: London, UK, 2001; pp. 1–16. [Google Scholar]
- Ministerio Industria. Cifras PYME. Publicaciones Ministerio de Industria. Available online: http://www.ipyme.org/Publicaciones/cifraspyme-enero2020.pdf (accessed on 15 March 2020).
- Geng, Y.; Doberstein, B. Developing the circular economy in China: Challenges and opportunities for achieving ’leapfrog development’. Int. J. Sustain. Dev. World Ecol. 2008, 15, 231–239. [Google Scholar] [CrossRef]
- Rizos, V.; Behrens, A.; Van Der Gaast, W.; Hofman, E.; Ioannou, A.; Kafyeke, T.; Flamos, A.; Rinaldi, R.; Papadelis, S.; Hirschnitz-Garbers, M.; et al. Implementation of Circular Economy Business Models by Small and Medium-Sized Enterprises (SMEs): Barriers and Enablers. Sustainability 2016, 8, 1212. [Google Scholar] [CrossRef]
- Mura, M.; Longo, M.; Zanni, S. Circular economy in Italian SMEs: A multi-method study. J. Clean. Prod. 2020, 245, 118821. [Google Scholar] [CrossRef]
- Agyemang, M.; Kusi-Sarpong, S.; Khan, S.A.; Mani, V.; Rehman, S.T.; Kusi-Sarpong, H. Drivers and barriers to circular economy implementation. Manag. Decis. 2019, 57, 971–994. [Google Scholar] [CrossRef]
- Shi, H.; Peng, S.; Liu, Y.; Zhong, P. Barriers to the implementation of cleaner production in Chinese SMEs: Government, industry and expert stakeholders’ perspectives. J. Clean. Prod. 2008, 16, 842–852. [Google Scholar] [CrossRef]
- Bassi, F.; Dias, J.G. The use of circular economy practices in SMEs across the EU. Resour. Conserv. Recycl. 2019, 146, 523–533. [Google Scholar] [CrossRef]
- Accenture Strategy. Insights Circular Advantatges. 2015. Available online: https://www.accenture.com/es-es/insight-circular-advantage-innovative-business-models-value-growth (accessed on 15 October 2020).
- Thorley, J.; Garza-Reyes, J.A.; Anosike, A. The circular economy impact on small to medium enterprises. Waste Manag. Environ. IX 2018, 231, 257–267. [Google Scholar] [CrossRef]
- Testa, F.; Heras-Saizarbitoria, I.; Daddi, T.; Boiral, O.; Iraldo, F. Public regulatory relief and the adoption of environmental management systems: A European survey. J. Environ. Plan. Manag. 2016, 59, 2231–2250. [Google Scholar] [CrossRef]
- Moktadir, A.; Rahman, T.; Rahman, H.; Ali, S.M.; Paul, S.K. Drivers to sustainable manufacturing practices and circular economy: A perspective of leather industries in Bangladesh. J. Clean. Prod. 2018, 174, 1366–1380. [Google Scholar] [CrossRef]
- Gharfalkar, M.; Court, R.; Campbell, C.; Ali, Z.; Hillier, G. Analysis of waste hierarchy in the European waste directive 2008/98/EC. Waste Manag. 2015, 39, 305–313. [Google Scholar] [CrossRef]
- Fletcher, C.A.; Hooper, P.D.; Dunk, R.M. Unintended consequences of secondary legislation: A case study of the UK landfill tax (qualifying fines) order 2015. Resour. Conserv. Recycl. 2018, 138, 160–171. [Google Scholar] [CrossRef]
- Despeisse, M.; Kishita, Y.; Nakano, M.; Barwood, M. Towards a Circular Economy for End-of-Life Vehicles: A Comparative Study UK–Japan. Procedia CIRP 2015, 29, 668–673. [Google Scholar] [CrossRef]
- Ghisellini, P.; Ji, X.; Liu, G.; Ulgiati, S. Evaluating the transition towards cleaner production in the construction and demolition sector of China: A review. J. Clean. Prod. 2018, 195, 418–434. [Google Scholar] [CrossRef]
- Hu, Y.; He, X.; Poustie, M. Can Legislation Promote a Circular Economy? A Material Flow-Based Evaluation of the Circular Degree of the Chinese Economy. Sustainability 2018, 10, 990. [Google Scholar] [CrossRef]
- Zink, T.; Geyer, R. Circular Economy Rebound. J. Ind. Ecol. 2017, 21, 593–602. [Google Scholar] [CrossRef]
- Fischer, A.; Pascucci, S. Institutional incentives in circular economy transition: The case of material use in the Dutch textile industry. J. Clean. Prod. 2017, 155, 17–32. [Google Scholar] [CrossRef]
- Liu, Y.S.; Yang, J.H. A longitudinal analysis of corporate greenhouse gas disclosure strategy. Corp. Gov. Int. J. Bus. Soc. 2018, 18, 317–330. [Google Scholar] [CrossRef]
- Lacy, P.; Rutqvist, J. The Sharing Platform Business Model: Sweating Idle Assets. Waste Wealth 2015, 2015, 84–98. [Google Scholar] [CrossRef]
- Daddi, T.; Iraldo, F.; Testa, F. Environmental Certification for Organisations and Products: Management Approaches and Operational Tools; Taylor and Francis Inc.: New York, NY, USA, 2015. [Google Scholar] [CrossRef]
- Chiarini, A. Setting Strategies outside a Typical Environmental Perspective Using ISO 14001 Certification. Bus. Strat. Environ. 2017, 26, 844–854. [Google Scholar] [CrossRef]
- Matuszak-Flejszman, A.; Szyszka, B.; Johannsdottir, L. Effectiveness of EMAS: A case study of Polish organisations registered under EMAS. Environ. Impact Assess. Rev. 2019, 74, 86–94. [Google Scholar] [CrossRef]
- Boiral, O.; Guillaumie, L.; Heras-Saizarbitoria, I.; Tene, C.V.T. Adoption and Outcomes of ISO 14001: A Systematic Review. Int. J. Manag. Rev. 2017, 20. [Google Scholar] [CrossRef]
- Heras-Saizarbitoria, I.; Arana, G.; Boiral, O. Outcomes of Environmental Management Systems: The Role of Motivations and Firms’ Characteristics. Bus. Strat. Environ. 2015, 25, 545–559. [Google Scholar] [CrossRef]
- Daddi, T.; Magistrelli, M.; Frey, M.; Iraldo, F. Do environmental management systems improve environmental performance? Empirical evidence from Italian companies. Environ. Dev. Sustain. 2011, 13, 845–862. [Google Scholar] [CrossRef]
- Daddi, T.; Testa, F.; Frey, M.; Iraldo, F. Exploring the link between institutional pressures and environmental management systems effectiveness: An empirical study. J. Environ. Manag. 2016, 183, 647–656. [Google Scholar] [CrossRef] [PubMed]
- Iraldo, F.; Testa, F.; Frey, M. Is an environmental management system able to influence environmental and competitive performance? The case of the eco-management and audit scheme (EMAS) in the European Union. J. Clean. Prod. 2009, 17, 1444–1452. [Google Scholar] [CrossRef]
- Merli, R.; Preziosi, M. The EMAS impasse: Factors influencing Italian organizations to withdraw or renew the registration. J. Clean. Prod. 2018, 172, 4532–4543. [Google Scholar] [CrossRef]
- Testa, F.; Boiral, O.; Iraldo, F. Internalization of Environmental Practices and Institutional Complexity: Can Stakeholders Pressures Encourage Greenwashing? J. Bus. Ethic. 2015, 147, 287–307. [Google Scholar] [CrossRef]
- Bracke, R.; Verbeke, T.; Dejonckheere, V. What Determines the Decision to Implement EMAS? A European Firm Level Study. Environ. Resour. Econ. 2008, 41, 499–518. [Google Scholar] [CrossRef]
- European Comission. The Revised Annexes of the EMAS Regulation. 2017. Available online: http://ec.europa.eu/environment/emas/pdf/factsheets/EMAS_revised_annexes.pdf (accessed on 15 October 2020).
- Evans, L.; Nuttall, C.; Gandy, S.; Iraldo, F.; Barberio, M.; Paglialunga, A.; Iefe, B.N. Project to Support the Evaluation of the Implementation of the EU Ecolabel Regulation; Publications Office of the European Union: Luxembourg, 2015. [Google Scholar] [CrossRef]
- Prieto-Sandoval, V.; Alfaro, J.A.; Mejía-Villa, A.; Ormazabal, M. ECO-labels as a multidimensional research topic: Trends and opportunities. J. Clean. Prod. 2016, 135, 806–818. [Google Scholar] [CrossRef]
- AENOR. EMAS: Se Actualizan Los Requisitos. Available online: https://revista.aenor.com/346/emas-se-actualizan-los-requisitos.html (accessed on 10 June 2020).
- Janik, A.; Szafraniec, M. Circular economy performance of EMAS organizations in Poland based on an analysis of environmental statements. Multidiscip. Asp. Prod. Eng. 2019, 2, 536–547. [Google Scholar] [CrossRef]
- Rashid, A.; Asif, F.M.; Krajnik, P.; Nicolescu, C.M. Resource Conservative Manufacturing: An essential change in business and technology paradigm for sustainable manufacturing. J. Clean. Prod. 2013, 57, 166–177. [Google Scholar] [CrossRef]
- Gusmerotti, N.M.; Testa, F.; Corsini, F.; Pretner, G.; Iraldo, F. Drivers and approaches to the circular economy in manufacturing firms. J. Clean. Prod. 2019, 230, 314–327. [Google Scholar] [CrossRef]
- Kristensen, H.S.; Mosgaard, M.A. A review of micro level indicators for a circular economy—moving away from the three dimensions of sustainability? J. Clean. Prod. 2020, 243, 118531. [Google Scholar] [CrossRef]
- Ellen MacArthur Foundation. Circularity Indicators: An Approach to Measuring Circularity. Ellen MacArthur Found 2015, 12, 159–161. [Google Scholar] [CrossRef]
- Walker, S.; Coleman, N.; Hodgson, P.; Collins, N.; Brimacombe, L. Evaluating the Environmental Dimension of Material Efficiency Strategies Relating to the Circular Economy. Sustainability 2018, 10, 666. [Google Scholar] [CrossRef]
- Linder, M.; Sarasini, S.; Van Loon, P. A Metric for Quantifying Product-Level Circularity. J. Ind. Ecol. 2017, 21, 545–558. [Google Scholar] [CrossRef]
- Mitchell, S.; O’Dowd, P.; Dimache, A. Manufacturing SMEs doing it for themselves: Developing, testing and piloting an online sustainability and eco-innovation toolkit for SMEs. Int. J. Sustain. Eng. 2019, 13, 159–170. [Google Scholar] [CrossRef]
- British Standards Institution. BSI Standards Publication Framework for Implementing the Principles of the Circular Economy in Organizations—Guide; British Standards Institution: London, UK, 2017. [Google Scholar]
- Saidani, M.; Yannou, B.; Leroy, Y.; Cluzel, F.; Kendall, A. A taxonomy of circular economy indicators. J. Clean. Prod. 2019, 207, 542–559. [Google Scholar] [CrossRef]
- Blomsma, F.; Brennan, G. The Emergence of Circular Economy: A New Framing Around Prolonging Resource Productivity. J. Ind. Ecol. 2017, 21, 603–614. [Google Scholar] [CrossRef]
- Pauliuk, S. Critical appraisal of the circular economy standard BS 8001:2017 and a dashboard of quantitative system indicators for its implementation in organizations. Resour. Conserv. Recycl. 2018, 129, 81–92. [Google Scholar] [CrossRef]
- Park, K.; Kremer, G.E. Text mining-based categorization and user perspective analysis of environmental sustainability indicators for manufacturing and service systems. Ecol. Indic. 2017, 72, 803–820. [Google Scholar] [CrossRef]
- Kravchenko, M.; Pigosso, D.C.; McAloone, T.C. Towards the ex-ante sustainability screening of circular economy initiatives in manufacturing companies: Consolidation of leading sustainability-related performance indicators. J. Clean. Prod. 2019, 241, 118318. [Google Scholar] [CrossRef]
- Potting, J.; Hekkert, M.; Worrell, E.; Hanemaaijer, A.; PBL Netherlands Environmental Agency; Copernicus Institute of Sustainable Development. Circular c: Measuring Innovation in the Product Chain, Policy Report. 2017.
- Birat, J.-P. Materials, beyond Life Cycle Thinking. Rev. Métallurgie 2012, 109, 273–291. [Google Scholar] [CrossRef]
- Garza-Reyes, J.A.; Valls, A.S.; Nadeem, S.P.; Anosike, A.; Kumar, V. A circularity measurement toolkit for manufacturing SMEs. Int. J. Prod. Res. 2018, 57, 7319–7343. [Google Scholar] [CrossRef]
- Masi, D.; Day, S.; Godsell, J. Supply Chain Configurations in the Circular Economy: A Systematic Literature Review. Sustainability 2017, 9, 1602. [Google Scholar] [CrossRef]
- Oncioiu, I.; Capusneanu, S.; Tűrkeș, M.C.; Topor, D.I.; Constantin, D.-M.O.; Marin-Pantelescu, A.; Hint, M. Ștefan The Sustainability of Romanian SMEs and Their Involvement in the Circular Economy. Sustainability 2018, 10, 2761. [Google Scholar] [CrossRef]
- Dey, P.K.; Malesios, C.; De, D.; Budhwar, P.; Chowdhury, S.; Cheffi, W. Circular economy to enhance sustainability of small and medium-sized enterprises. Bus. Strat. Environ. 2020, 29, 2145–2169. [Google Scholar] [CrossRef]
- Schreier, M. Qualitative Content Analysis in Practice; Sage Publications: New York, NY, USA, 2012. [Google Scholar]
- Jurgensen, C.E. Selected factors which influence job preferences. J. Appl. Psychol. 1947, 31, 553–564. [Google Scholar] [CrossRef] [PubMed]
- Daddi, T.; Nucci, B.; Iraldo, F. Using Life Cycle Assessment (LCA) to measure the environmental benefits of industrial symbiosis in an industrial cluster of SMEs. J. Clean. Prod. 2017, 147, 157–164. [Google Scholar] [CrossRef]
- Di Maio, F.; Rem, P.C. A Robust Indicator for Promoting Circular Economy through Recycling. J. Environ. Prot. 2015, 6, 1095–1104. [Google Scholar] [CrossRef]


Publisher’s Note: MDPI stays neutral with regard to jurisdictional claims in published maps and institutional affiliations. |
© 2020 by the authors. Licensee MDPI, Basel, Switzerland. This article is an open access article distributed under the terms and conditions of the Creative Commons Attribution (CC BY) license (http://creativecommons.org/licenses/by/4.0/).