Article

Anthropogenic Impacts on Water Quality in a Small, Forested Mountain Catchment: A Case Study of the Seebächle, Black Forest, Southern Germany

1
Faculty of Geography and Spatial Planning, University of Strasbourg, 67000 Strasbourg, France
2
Department of Imagery, City and Environment (LIVE), Faculty of Geography and Spatial Planning, University of Strasbourg, 67000 Strasbourg, France
*
Author to whom correspondence should be addressed.
Sustainability 2020, 12(21), 9022; https://doi.org/10.3390/su12219022
Submission received: 21 July 2020 / Revised: 18 October 2020 / Accepted: 22 October 2020 / Published: 30 October 2020
(This article belongs to the Section Hazards and Sustainability)

Abstract

:
The aims of this case study are to assess water quality in a small, forested mountain catchment in the Black Forest, forming part of a National Park and Natura 2000 zone. Field work was carried out in the catchment of the Seebächle torrent, a small headwater basin of the River Acher, a confluent of the Rhine, in Southern Germany between late winter and early summer of 2018. The catchment has a diverse natural setting of water bodies, including springs, torrents, and a lake, and is impacted by anthropogenic activities such as summer tourism, winter sports, two quarries, road traffic, and an isolated construction site. Physio-chemical and bacterial water samples were obtained at 10 measurement sites, including a spring, a lake (Mummelsee), a fountain, artificial and natural snow on and next to a ski run (Seibelseckle), artificial ditches and parking lots draining the ski run, and the Seebächle torrent above two granite mines. Samples were either taken directly on site or analyzed in corresponding hydrology and hospital microbiology laboratories. Water of the Seebächle is oxygen-rich, peaty, and mostly acidic, but the pH varies between 4.1 and 9.5 throughout the catchment, inclining towards acid in the fountain and below the ski run and towards alkaline in the lake. Conductivity is spatially highly variable, reaching the most elevated values below the ski run and its parking lot (149 µS/cm). A high density of bacteria including enterobacteria was detected at nearly all sites. Human pathogenic bacteria were found below and surrounding the ski run, at parking lots draining the ski run, as well as at the lowest site during the mid-spring campaign. They were also detected in the touristically highly frequented lake and in the spring feeding the lake during the end-of-spring campaign. Whilst most physico-chemical parameters followed a similar pattern and fell within good to very good EU drinking water quality status, the lake turbidity levels (19.2 NTU) by far exceeded norms after ice thawing. The most contaminated site in terms of bacteria and turbidity (5.2 NTU), ammonium nitrogen (0.18 mg/L), and total nitrogen (5.06 mg/L) was the spring feeding the Mummelsee draining the construction site of a new restaurant. These field analyses show that the water quality of a virtually uninhabited, natural headwater catchment is strongly interconnected and can degrade both by direct and indirect impacts of overtourism.

1. Introduction

Water quality is essential for ecosystems and drinking water supply, in particular in headwater catchments [1]. Forested catchments play a particularly important role in regulating water quality and quantity, but they are increasingly threatened both by climate and anthropogenic change, even in mountain regions [2]. Sustainable management of water is specifically addressed by the UN Sustainable Development Goals (SDG 6) to be achieved by 2030 [3]. Within SDG 6, target 6.3 requires nations to improve water quality by reducing pollution, among other things [4]. With the help of indicator 6.3.2, the proportion of water bodies with good ambient water quality is determined based on monitoring of core water quality indicators. In Europe, water quality is classified by the Water Framework Directive (WFD) into five categories from high to bad [5]. Requirements also include an improvement of water quality where necessary and the prohibition of degradation from a good state [5]. Water quality is assumed to be high in forested catchments, particularly in the low mountains of the Black Forest, Germany [6]. Yet, anthropogenic influences in upland forested catchments in Europe are multiple, including urbanization, roads, dams, mining, ski runs, and mountain bike trails [2,7,8].
Studies on stream water quality commonly focus on physico-chemical characteristics. Stream water quality is influenced by many factors, including hydrological variables such as discharge; general variables (such as temperature, total suspended and dissolved solids, suspended matter, turbidity and transparency, conductivity, pH, redox potential, dissolved oxygen, CO2, hardness, and chlorophyll); nutrients (such as nitrogen compounds, phosphorous compounds); organic matter (such as total organic compound, chemical oxygen demand); major ions; inorganic variables; metals; organic contaminants (such as mineral oil and petroleum products); and microbiological indicators, in particular disease-causing micro-organisms [9]. Stream and lake water quality are also influenced by meteorological factors such as temperature, atmospheric pressure, evaporation, wind speed, radiation, rainfall intensity, and droughts [10,11], as well as climate variations [12].
The most common water-borne bacterial human pathogens are Salmonella, Shigella, enterotoxigenic Escherichia coli, Campylobacter, Vibrio, and Yersinia [9]. Nonetheless, bacteriological studies are often neglected in stream quality studies, because they are complex and expensive. The same is true for routine monitoring of individual pathogenic micro-organisms in drinking water [13]. In freshwater, the most common sources of microbial pathogens are fecal matter, from improperly treated wastewater, animals, wildlife, livestock and leaky septic tanks [14]. Water-borne pathogens are mainly spread by sewage, polluted surface waters and storm runoff [15].
Amongst the general variables, pH is the strongest indicator since it determines the survival of aquatic life. The pH of surface and groundwater varies as a function of the geology, origin of water, acidity of precipitation, and pollution levels [9]. In the Black Forest, water bodies are generally poor in nutrients because the geology is dominated by a granitic and gneissic crystalline basement partially covered by sandstone deposits [16]. This favors coniferous forests. Resulting soils are rich in humic and fulvic acids, favoring a low pH. Granite and sandstone yield neutral water with pH values around 6.5 and 6.6, respectively, whereas moorlands and wetlands yield water with pH values below or around 6 [6,17]. Acid deposition from the atmosphere by rain or pollution can also acidify surface waters. This was a major problem in the Black Forest between the 1960s and 1980s [18].
Due to the specific orographic and climatic conditions of the Black Forest, with extensive areas of upland moors in combination with coniferous forests, stream waters contain low amounts of dissolved solids but are rich in natural organic matter (DOC) [16]. Electrical conductivity is a measure of salt concentration in water. In the Black Forest, it is around 10 mS/m for sandstone and 15 mS/m for granite, which indicates a low to moderate mineralization [17].
Stream water contains dissolved substances that consist of both inorganic and organic solutes [19]. Particulate matter carried by streams consists of soil particles and organic debris, and suspended matter concentration provides insight onto the total amount of mineral and organic particles present in water [19]. Suspended matter can influence water quality in several ways, including a decrease in luminosity, the modification of absorption capacity, an increase in clogging capacity and corrosion. Mountain streams usually have low concentrations of dissolved substances and, in forested catchments, the uptake of nitrate and phosphate by trees limits their concertation in stream water [19]. Dissolved oxygen is usually maximized in mountain streams [19].
Water quality—in particular the amount of suspended and dissolved matter—is influenced by discharge [9], therefore it is important to differentiate between low, medium, and high flow [6,20]. Flood events usually dilute concentrations of major solutes such as calcium, chloride, and sulfate [19]. Water temperature is a key factor for many physico-chemical parameters such as dissolved oxygen, the solubility of salt (i.e., electrical conductivity), pH, etc., and for the determination of the origin of water. Groundwater temperatures usually have few annual variations and are much cooler than surface streams [21], in particular during the summer months. Hence, water temperature is an important indicator for the degree of groundwater influence. Forested catchments offer cool water temperatures in the summer [19]. Many Black Forest streams are classified as “summercold” (cold stenotherm) [6]. Nevertheless, water temperatures in shallow streams can be strongly influenced by air temperature. Anthropogenic impacts such as ski development can degrade water quality in sensitive mountain environments. According to [19], ski runs transport rain and snowmelt more rapidly to streams channels than adjacent permeable forest soils. On the other hand, compaction of snow on ski runs by skiers and snow grooming can delay runoff by several weeks [19]. Other impacts include the release of nutrients such as nitrate and calcium due to the interruption of biological uptake in sites where forest has been cleared. Furthermore, the authors list water quality problems from mountain development such as construction works, septic system leakage or failure, salt contamination from roadway de-icing, heavy metals and petroleum derivatives from vehicles, as well as sediment transport and deposition. Slope grading during ski run and lift construction, combined with the impacts of snow grooming equipment during minimal snow cover, can cause soil erosion and increase turbidity [22]. Steep slopes, thin soil cover, and shallow groundwater bodies [19] limit natural purification capacities and facilitate rapid transmission of contaminants. Nearly all nutrient levels and sediment loads are shown to increase below certain ski areas [23].
These early studies do not take into account impacts of artificial snowmaking on water quality [24]. Later studies have shown that meltwater from artificial snow strongly differs from that of natural snow but have only investigated ion, phosphorous, and calcium content [25]. Yet, few studies carry out bacterial analyses. Snowmaking water is transported over considerable distances through pipelines that are prone to the development of biofilms and is stored for long time periods in reservoirs and as snow; the subsequent meltwater contains a higher concentration of possibly pathogenic bacteria [26]. Snow grooms can transmit fuel residues and mix shredded remnants of plastic and other waste into the snow. When artificial snow melts, bacteria and other substances can enter springs and streams and reach the groundwater [27]. Additives to optimize snow production, such as Snomax®, based on the sterilized and lyophilized bacterial remains of Pseudomona sygringae, are not allowed in Germany [26].
The aims of the study are to investigate whether anthropogenic activities, including summer and winter tourism in a forested low mountain catchment, has impacts on its water quality, as defined by the WFD. In this study, water quality is assessed from a series of physico-chemical and bacteriological measurements and samples during the early spring and summer of 2018 [28]. The spring melt season and early summer were selected for sampling since they concentrate the strongest impacts on water quality. Our objectives are to investigate the combined impacts of winter tourism from a ski run, a highly frequented lake with a hotel, and associated parking lots on water quality. Specific bacteriological analyses were focused on identifying bacteria.

2. Materials and Methods
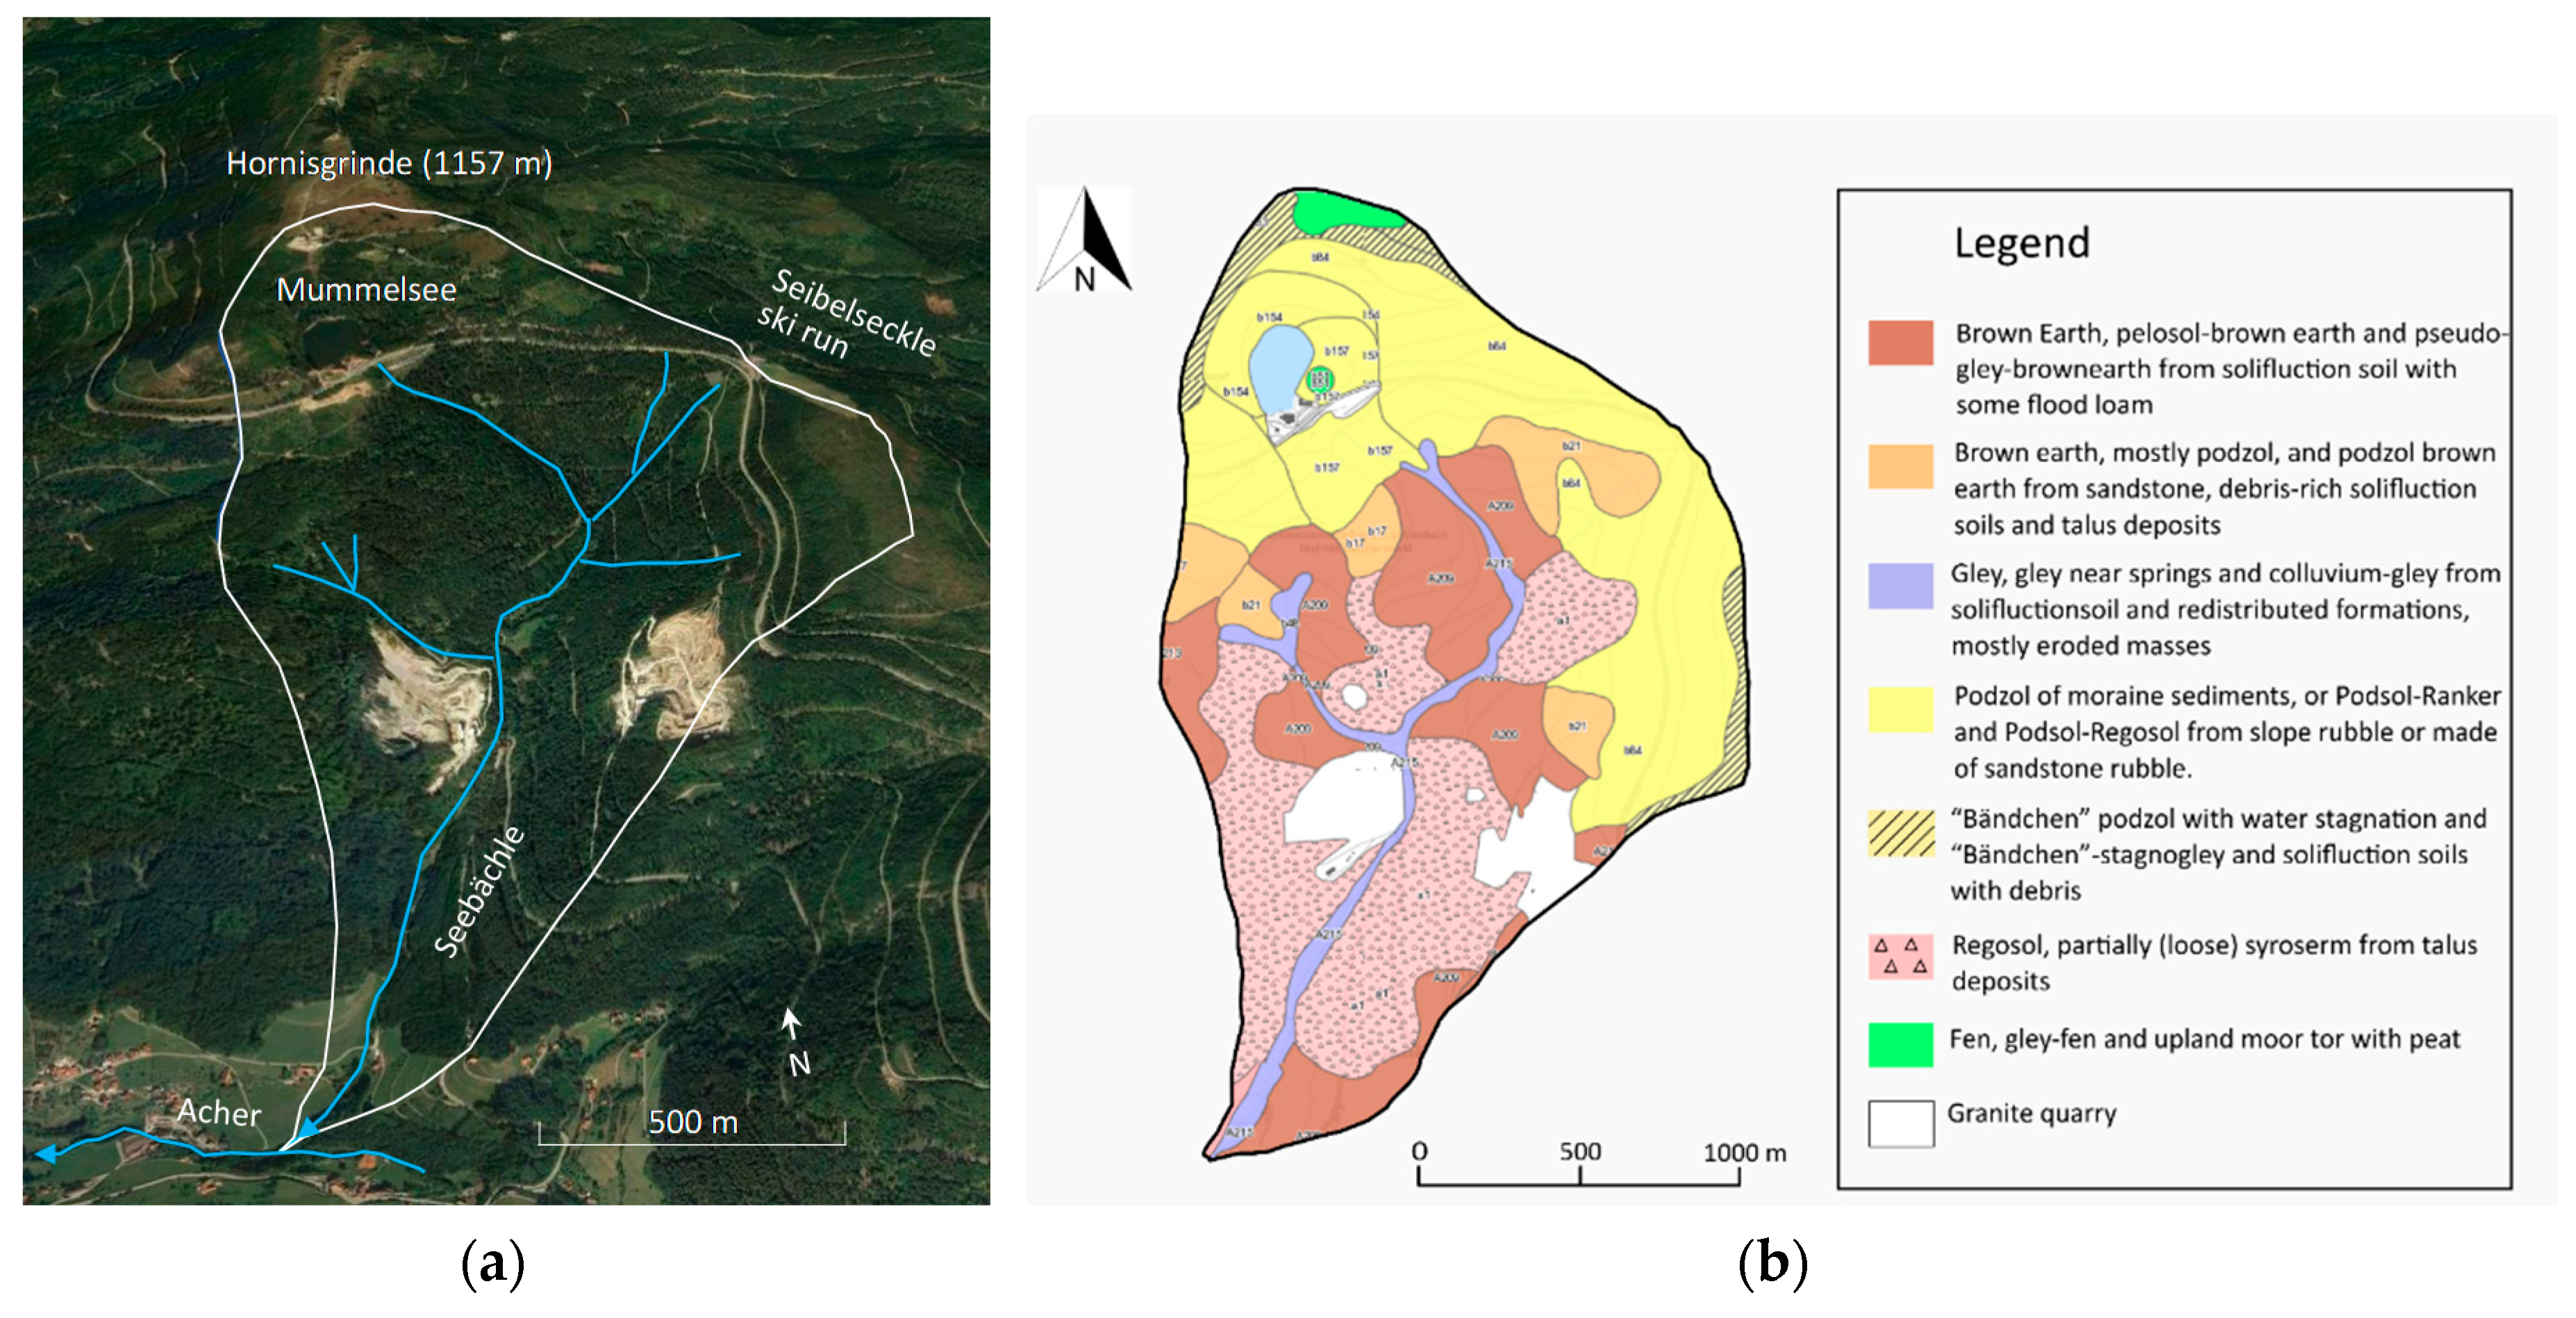
2.1. Study Site

The Seebächle catchment is a small headwater catchment of the Acher River (48°34′36.33″ N, 8°11′55.21″ E at the outlet), 3.2 km2 in size and situated near Achern in the north-western Black Forest in Baden Wurttemberg, Southern Germany (Figure 1a). Altitudes range between 510 m a.s.l. at the confluence of the Seebächle torrent with the River Acher and 1157 m a.s.l. at the Hornisgrinde, the highest peak of the Northern Black Forest. Approximately two thirds of the catchment consists of Paleozoic magmatic granite covered in the upper parts above 960 m a.s.l. by Lower Triassic sandstone. The dominant soil types are illustrated in Figure 1b [29].
The region experiences a relatively warm and humid climate with approx. 100 snow days in winter. The Hornisgrinde receives some of the highest precipitation in Germany, estimated at more than 2100 mm per year. Precipitation measured by the German Meteorological Service (DWD) at the closest meteorological station (7 km from Baiersbronn-Ruhestein) from 1961 to 1990 totals 2060 mm per year [30]. Snow depth is measured by the DWD at the Kniebis (901 m.a.s.l.), situated 7 km from the Mummelsee at a comparable altitude to the highest point in the catchment (1052 m). The upper parts of the catchment experience an estimated 180 fog days per year [30].
The Seebächle emerges from Lake Mummelsee [31], which is located in a cirque at 1028 m a.s.l. surrounded by glacial deposits. The Mummelsee is the highest and deepest cirque lake in the Northern Black Forest [32]. It is a small, humic-rich headwater lake situated just below the Hornisgrunde [33] with a small fen to its east. Due to its susceptibility to acid conditions resulting from its underlying geology and acid podzol soils, the lake has no fish [33]. In the past (from the 1970s to 1990s), the lake has been affected by acid deposition, with pH values dropping below 5, but since then the lake has recovered. The Mummelsee has a maximum depth of 18 m [34], a surface area of 3.7 ha, a volume of about 227,500 m3 [33], and a catchment area of only 0.4 km2. It is fed by four shallow groundwater springs emerging from the cirque headwall, the most important one being the Hirtenstein-Quelle, a boundary spring situated above a clay layer on sandstone [31]. The three other springs are tallus springs, including one to the north of the lake, a developed spring to the south, and a new developed spring even further south that feeds the well of the Mummelsee chapel. All the springs emerge from the same spring zone above a deeper sandstone layer overlying granite bedrock at 1050 m a.s.l. approximately 20 m in front of the cirque tallus. The Hirtenstein-Quelle has a discharge varying between 5 and 30 L/s (annual average of 15 L/s), whilst the remaining 3 springs have a combined mean discharge of about 22 L/s [31]. Accordingly, the residence time of lake water is estimated to be 70 days.
Only zero, first, and second order streams exist in the Seebächle catchment. It has no discharge gauging stations. The nearest discharge station is on the River Acher at Kappelrodeck, located at 220 m altitude a.s.l. and 7 km downstream of the Seebächle confluence with the Acher. Discharge data are provided by the LUBW (Landesanstalt für Umwelt Baden-Württemberg). Average discharge of the Acher between 1971 and 2019 was 1.95 m3/s according to our own calculations. It experiences low flow during the summer months, mainly from June to September, and high flow in winter and early spring, mainly during the month of March. As is typical for mountain streams, its flood regime is flashy. Low flows have been more frequent over the last few years 2018 [28]. Droughts could have multiannual impacts on groundwater, as witnessed by similar catchments in the Black Forest [35]. Due to its small size, the catchment is not part of the WFD inventory. Nevertheless, in 2017 the ecological status of the downstream Acher River was classified as poor [36].
Land use in the catchment is nearly entirely dominated by forest, mainly spruce and beech. The highest parts of the catchment (above 1150 m a.s.l.) form the Hornisgrinde summit plateau and consist of “Grinden”, treeless heathlands on an upland moor with some small lakes [37] that developed subsequent to forest clearing and following conversion into pastureland from the 15th century onwards [38]. Moorland covers approximately 10 ha, corresponding to 3% of the catchment. Towards the east of the Hornisgrinde, the moor reaches a depth of 2–4 m. It contains typical moor vegetation (peat moss, moor grass, deer-hair sedge, and dwarf shrubs) and dwarf mountain pine. Since 2018, the whole Hornisgrinde moorland forms part of the redefined Natura 2000 management plan of the Fauna-Flora-Habitat protected area 7415-311 “Wilder See—Hornisgrinde und Oberes Murgtal” [39]. The upper and middle parts of the eastern catchment fall into the forestry managed buffer zone of the Black Forest National Park created in 2014 [40]. Some of these overlap with the Natura 2000 zone.
In terms of anthropogenic land use, the Seebächle catchment is not urbanized but accommodates day tourism (hiking in summer, cross-country skiing and alpine skiing in winter, and year-round lake tourism), forestry, quarrying, energy production via one large wind turbine, a small hydropower plant at the outlet of the Mummelsee, and a TV and telephone transmission mast on the Hornisgrinde. It is accessible by a federal highway, the B500 Schwarzwaldhochstrasse (Black Forest High Road), which was constructed in 1933 and is now used mainly for tourism. Hotel Mummelsee with restaurants and shops is located at the shores of the Mummelsee, with 5 parking lots for approx. 250 cars (Figure 2). Construction of a new parking lot below Hotel Mummelsee (shown in Figure 2) only began after the end of the study. Touristically highly frequented, the Mummelsee attracts between 700,000 and 1 million visitors per year [34]. A derelict hotel, Gasthof Hornisgrinde, located next to the Hornisgrinde Tower above the Mummelsee, was demolished in the spring of 2018 after 20 years of vacancy, and replaced by the new Grinde Hütte restaurant (1157 m a.s.l.) (Figure 2). It is accessible via a secondary road with a parking lot for approx. 30 cars situated right next to the moorland. Two granite quarries of the VSG Schwarzwald Granit Werke and Fischer are located in the mid catchment. Both the eastern granite quarry and the alpine ski run Seibelseckle with two parking lots lie within the buffer zone of the Black Forest National Park [40].
The Seibelseckle ski run is located on the catchment divide between 956 and 1052 m a.s.l. below the Schwarzkopf (1057.9 m) and is owned by the Waldgenossenschaft (forestry cooperative) Seebach (Figure 3). The ski run has a length of 500 m, covers a surface of approx. 3.8 ha, and also offers nocturnal skiing with a parking lot for approx. 180 cars. Seibelseckle used to attract about 40,000 skiers per year, but this has recently decreased by 50–75%. In 1966, an exemption was obtained from the Regional Council of Baden-Württemberg to deforest 4 ha and to install the ski lift and ski run within the nature protection zone, “Wilder See—Hornisgrinde”, established in 1939. Nowadays, the ski run lies within three protected zones: most of the western part lies within the Natura 2000 nature protection zone 7415-341 “Wilder See—Hornisgrinde” and the bird sanctuary 7415-441 “Nordschwarzwald”, and the eastern part lies within a protected woodland [40]. Permission was obtained in 2006 for the installation of a permanent artificial snowmaking infrastructure within the nature protection zones. In 2011, artificial snowmaking infrastructure was installed for 4 snow canons, but has meanwhile increased to 6. Since no natural streams drain the ski run, water for artificial snow production is diverted from the Mummelsee from a small existing hydroelectric power plant. It flows 78 m downstream and is then pumped uphill to the top of the ski run over a total distance of 1.7 km. Water is attributed according to the existing water rights for the power plant. The ski season begins in mid- to end of November and ends towards the end of April, depending on natural snowfall and conditions for artificial snow production. A fault line traverses the ski run in its upper third. The ski run is mowed as a mountain meadow in summer.
The ski run is drained with the help of 22 diagonal drainage ditches that roughly maintain the same length and therefore cross the irregular catchment boundary often (Figure 3). Drainage flows in 5 main directions (Figure 3): the first one concentrates snow meltwater directly below the ski run and diverts it into the adjacent Kesselbach catchment (“ski_run”); the second one diverts flow from the right hand parts of the ski run (on the image) into the Kesselbach catchment (a tributary of the Murg valley); the third one diverts flow from the upper left hand parts of the ski run (on the image) into the Seebächle catchment; the fourth one diverts snow meltwater flow from the lower left third of the ski run below the B500 road and into a stream below the adjacent parking lot (“P 2”) within the Seebächle catchment; the fifth one drains flow from the large ski parking lot below the ski run which includes meltwater from the ski run (“P 1”), and is not connected to the small parking lot above.

2.2. Field Sampling

This study is based on field sampling and laboratory analysis of water quality, as well as meteorological and hydrological data analyses. Physio-chemical and bacterial water samples were taken 7 times at 10 measuring sites during a 14-week period between 6 March and 16 June 2018 [28]. Since each field visit took a full day, measurements could not be taken simultaneously.

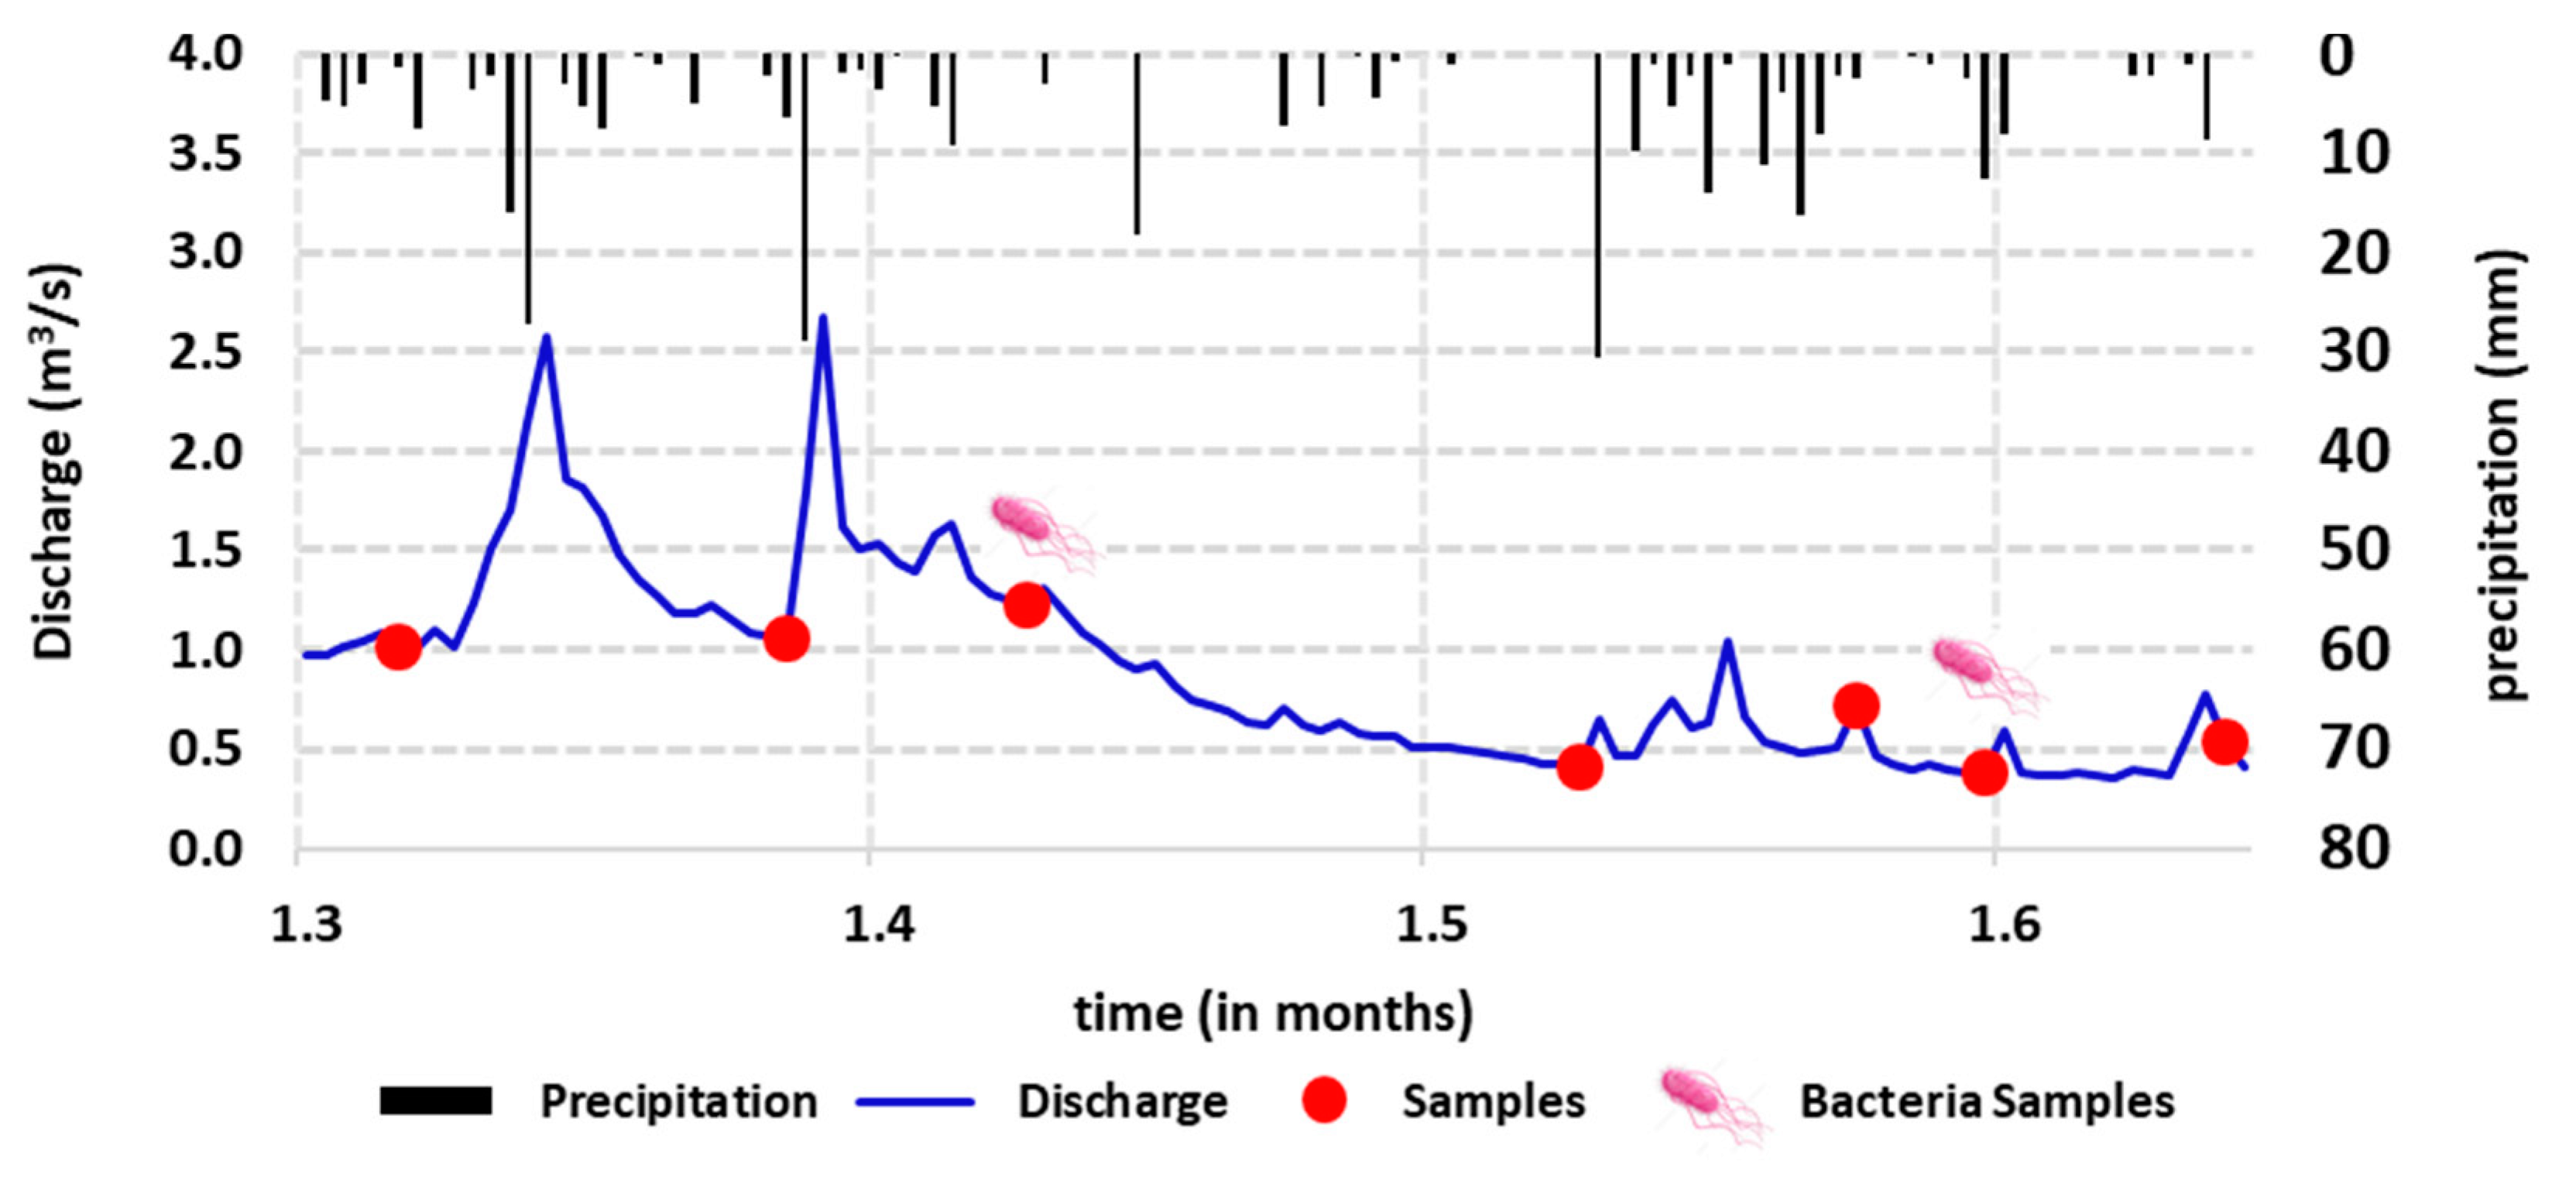
2.3. Precipitation and Discharge

Daily precipitation data were obtained from meteorological data bases of the DWD Kniebis weather station (901 m a.s.l.). Hydrological time series were calculated from the LUBW Kappelrodeck discharge station on the Acher. Since no continuous discharge data were available for the Seebächle, discharge data from a measuring campaign undertaken in 2012 and 2013 in the Seebächle 600 m above its confluence with the Acher [6] were correlated with the official LUBW site at Kappelrodeck located approximately 10 km further downstream on the River Acher (Figure 4). This gives a long-term average discharge of 0.03 m3/s for the Seebächle, compared to 1.93 m3/s for the Acher. During the 2018 measuring campaign, the calculated discharge of the Seebächle fluctuated between 0.005 and 0.042 m3/s. Field measurements were carried out on 6 and 27 March; 9 April; 9, 24, and 31 May; and 13 June (Figure 4). Most samples were taken during low and medium flow.

2.4. Snow Cover and Artificial Snow Production

Average snow depth and number of snow cover days were based on our own statistical analyses of meteorological data from the DWD at the Kniebis station. Snow data have existed since 1980. The frequency of artificial snow production was obtained from more than 500 webcam photos with a view of the entire ski lift and an hourly frequency between 6 a.m. and 8 p.m. Unfortunately, no webcam photos are available at night when most of the artificial snow production takes place.

2.5. Measuring Sites

The 10 water sampling sites in the field were defined according to possible natural and anthropogenic impacts (Table 1 and Figure 5). However, not all of them could be sampled during the entire duration of the campaign due to changing hydrological and meteorological conditions. Six series of in situ water measurements were taken in the field, and five series of water samples that were later analyzed in two different laboratories of the University of Strasbourg.
The Seebächle torrent at the “quarry” site is not impacted by the quarries, since it lies above the quarry discharge station and quarry outlets. “Parking_2”, initially selected as a natural reference site, turned out to be an artificial drainage from the ski run. The “ski_run” site only provided one sample, because meltwater was either lacking due to sub-zero temperatures or because snow had already melted from the ski run. Snow for bacterial analyses was sampled at “up_ski_run” and “low_ski run”. Snow sampling was limited to a depth of approx. 10 cm due to high snow compaction caused predominantly by artificial snow and the frequent passage of snow grooms. Average snow depth on the ski run is about 30 cm and is more compacted towards the lower end. The “natural” site represents natural snow in the forest next to the ski run. Very little snow was present here, since it does not last as long as artificial snow on the ski run. Water at the “fountain” site emerges behind the restaurant Rasthütte Seibels Eckle. It is probably influenced by a faultline running parallel with the Seebächle/Kesselbach catchment boundary from the Hornisgrinde towards Seibelseckle. The fountain is thus impacted by the Hornisgrinde upland moorland. A highly frequented hiking path follows this catchment boundary. Water from the fountain flows continuously and is potable. The “lake” site was selected near the shore of the Mummelsee to enable water sampling even during frozen conditions in winter. Samples were taken near the surface. A highly frequented tourist path with picknick tables leads around the lake. The “spring” site (Hirtenstein-Quelle), intended as a natural reference site, flows into the Mummelsee just a few meters above its northern shore. At that time, it was not clear that the spring directly drains the slope 122 m below the Hornisgrinde Tower at the demolition site of an old hotel and the construction site of the new Grinde Hütte (Figure 2).

2.6. Field and Laboratory Analyses

Three series of physico-chemical and two series of bacterial water analyses were conducted during the field campaign. Samples were transported in cold boxes and analyzed immediately. Cations and Anions were filtered, acidified, stored at 4 °C, and analyzed within 48 h. Physico-chemistry was analyzed at the ENGEES water laboratory and bacteriology at the Microbiology Laboratory, of the Laboratory of Hospital Hygiene at the University Hospital of Strasbourg.

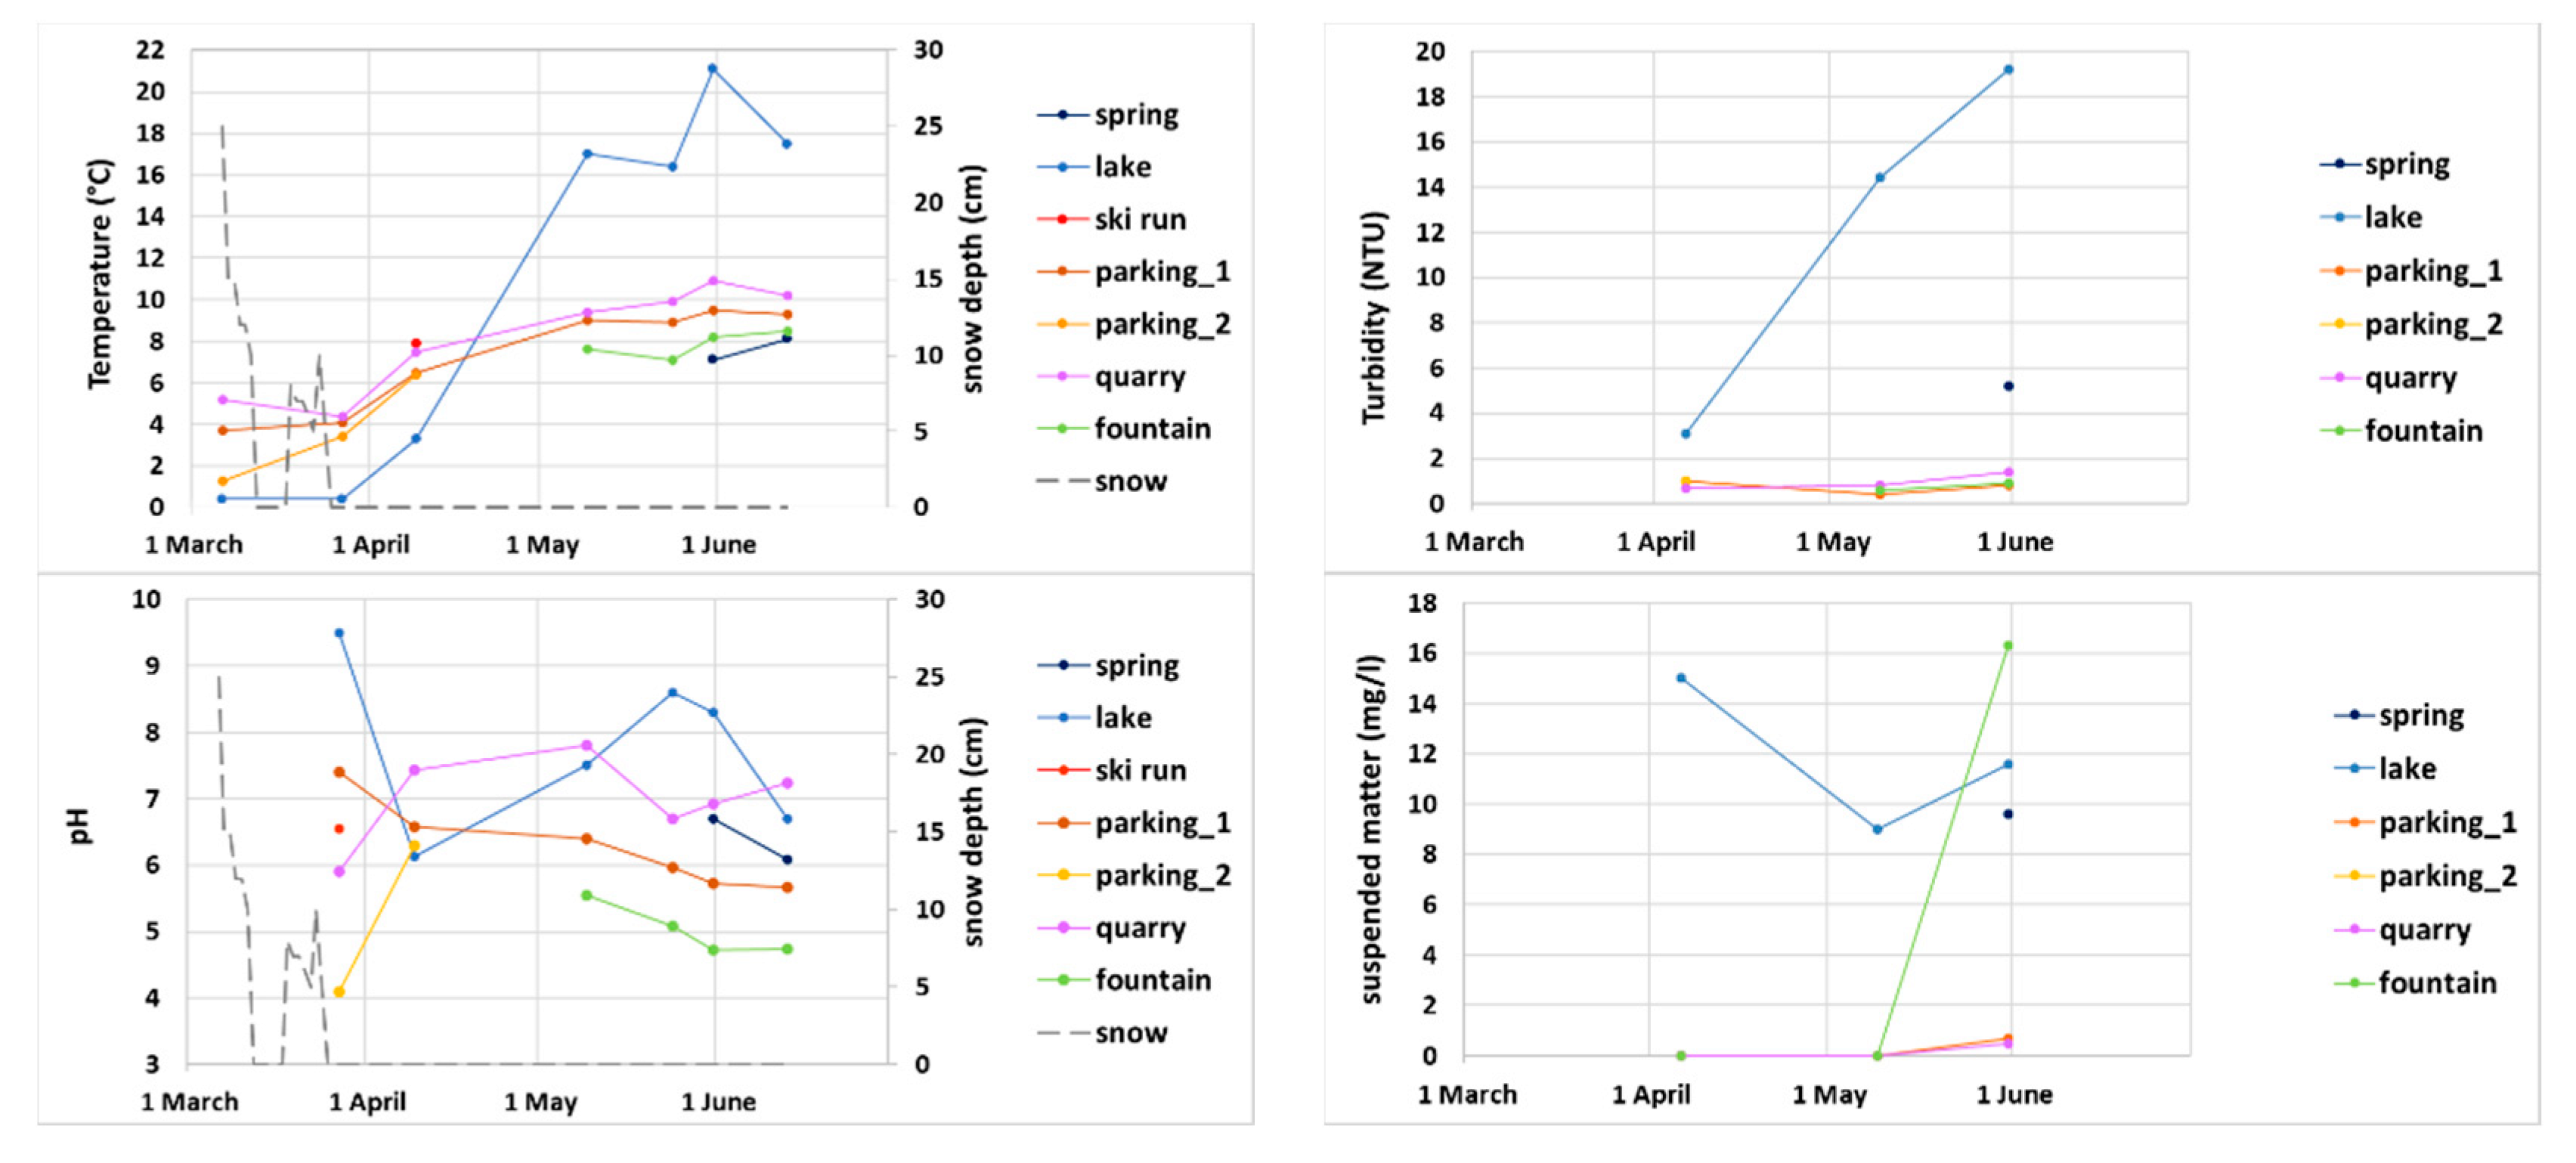
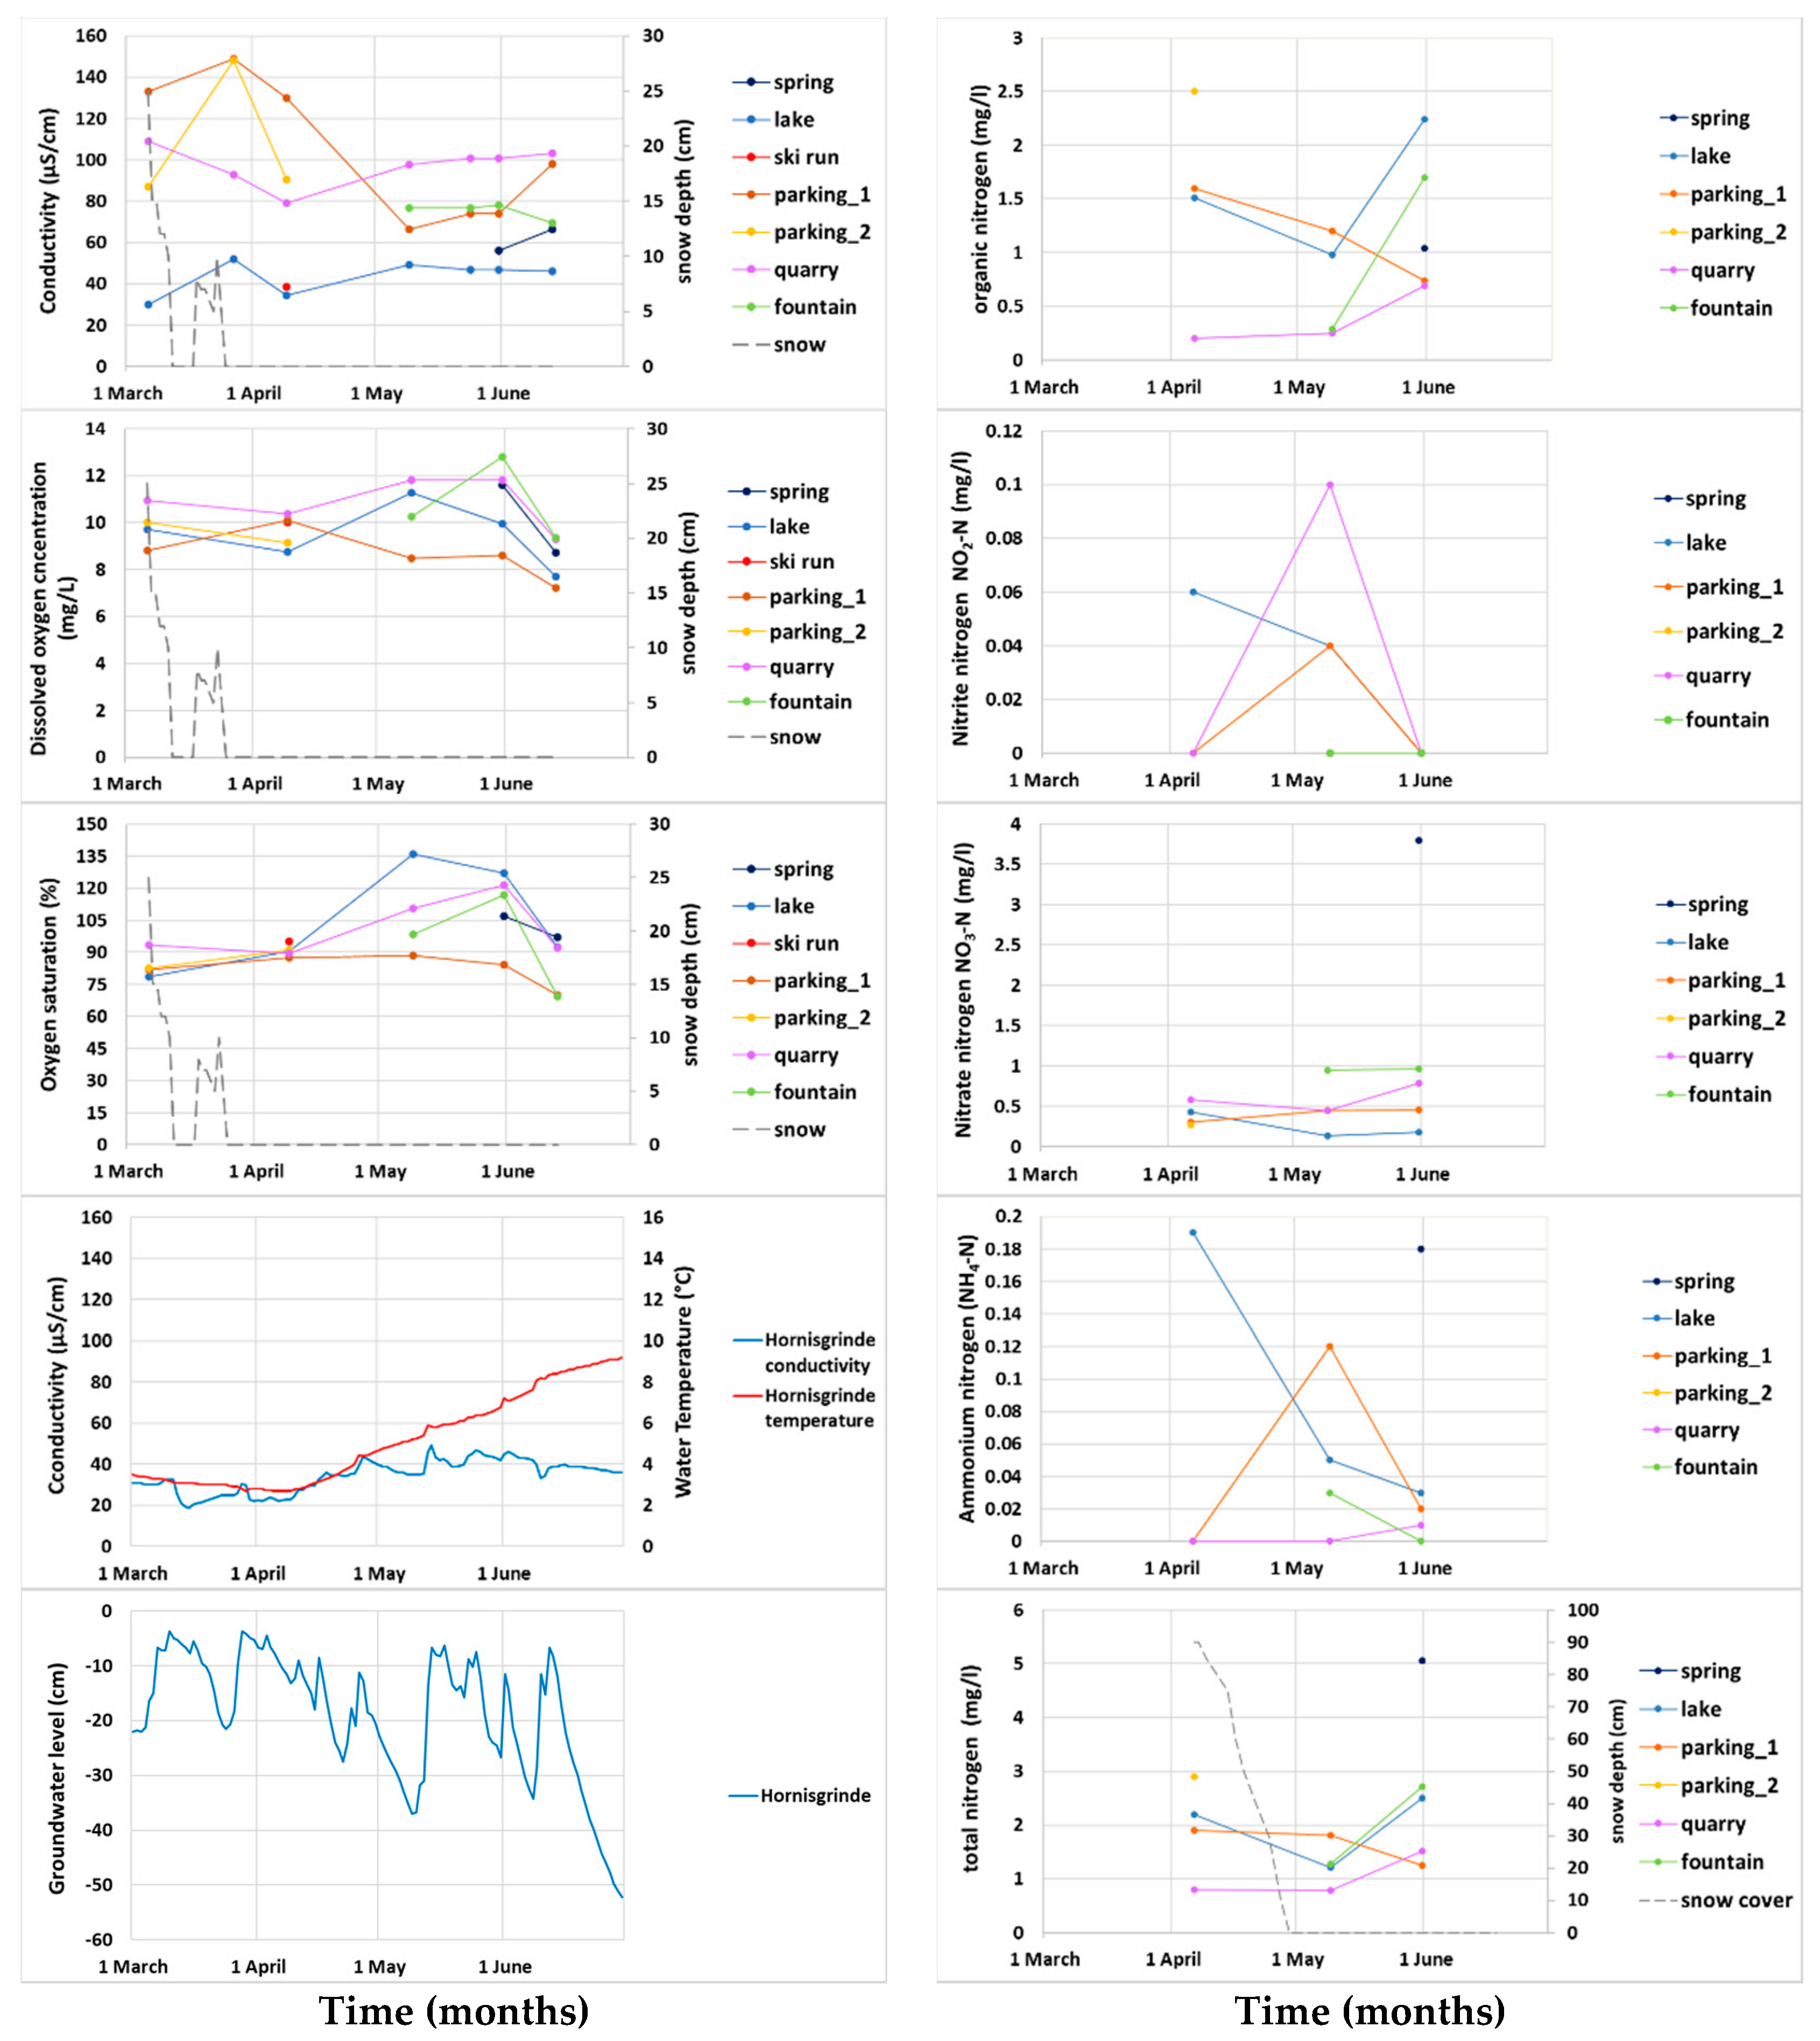
2.6.1. Physico-Chemical Analyses

Different parameters were measured, including:
  • temperature,
  • pH,
  • electrical conductivity,
  • dissolved oxygen,
  • turbidity,
  • suspended matter,
  • nitrogenous substances.
Temperature and pH were measured in situ using a portable, multiparameter Hanna HI9125 probe. Electrical conductivity was measured in situ with a WTW LF 191 conductometer. Dissolved oxygen was measured in situ with a WTW Cellox 325 probe that compensates temperature variations automatically. Turbidity was determined in situ with a turbidimeter that measures by nephelometry. This method uses an optic analysis that determines the concertation of a substance according to the light intensity diffused by particles in suspension.
Suspended matter was sampled and then determined by filtration at the ENGEES water laboratory, according to the concentration of suspended matter retained in fiberglass filters with an area density of between 50 and 100 g/m2 following the NF EN 872 norm. The concentration of suspended matter was determined relative to its volume.
Nitrogenous substances such as nitrate nitrogen (NO3-N), nitrite nitrogen (NO2-N), ammonium nitrogen (NH4-N), and organic nitrogen were sampled and measured in the ENGEES water laboratory with an ionic chromatograph. The chromatograph is a Metrohm 930 Compact IC Flex for the detection of conductivity, with a suppressor used for routine analyses. The water sample is injected and driven by a solution of carbonate and bicarbonate within a chromatographic column (for anion exchange) or driven by a solution of nitric and dipicolinic acid into a cationic column. The ions present in the sample are separated as a function of their relative affinity for material in the column. They are identified according to their retention time and measured with the help of a conductimetric detector. The conductivity measured is proportional to the concentration of each anion within the sample. Phosphorous was not considered, since there is practically no agriculture in the catchment.

2.6.2. Bacteriological Analyses

Bacteriological analyses were aimed at identifying bacteria in association with artificial snow production and parking lots. The type of bacterial analyses carried out at the Microbiology Laboratory were based on the hypothesis that the water is of high quality—i.e., contains a low density of bacteria. However, it turned out that the torrents and snowmelt runoff from the ski run had a very high concentration of bacteria, rendering it impossible to quantify the bacteria with the initial approach. Bacteria were detected by mass spectrometry, a technique that identifies bacteria according to their mass-to-charge ratio [41]. After the ionization of the sample, ions are separated and their electrical signals result in a spectrum characteristic of each bacteria. This permits the rapid identification of a large number of micro-organisms, in particular those that are difficult to cultivate. It analyses proteins that are specific to each specific species of bacteria. Bacteria are identified from their Colony Forming Unit in the culture medium.
During the first bacteriological measuring campaign on 9 April 2018, four water samples and three snow samples were taken. Water samples were taken at the quarry, parking_1 and _2, and the ski_run drain, and snow samples were taken on the upper and lower ski_run and from natural snow in proximity as a natural reference. We found a large number of micro-organisms, in particular enterobacteria, and we identified the main bacteria strain but could not determine their concentration.
During the second campaign on 31 May 2018, five water samples were taken, including the parking_1, fountain and quarry sites, and two new sites at the spring and lake. Since the snowmelt had finished, no more snow samples could be taken. This time, agar filtration was used to determine the microbiome in order allow the detection and determination of all bacteria present. The microorganisms were filtered with a sterile membrane and the filtrate cultured on a petri dish with agar, a nutritive substance favorable to the development and proliferation of bacteria.
Overall, the study is limited by its seasonal duration, but the spring melt season was ideal since it coincided with the highest ecosystem dynamics and diversity of anthropogenic impacts.

3. Results and Discussion

3.1. Natural and Artifcial Snow Cover and Hydrology

From 1980 to 2017, the average snow depth recorded at Kniebis decreased from 32.2 to 10 cm and the average number of snow cover days decreased from 100 to 70 days, according to our own calculations. Winter 2017/18 was exceptional, since it received about 1.5 as much snow as in previous years, with the snow lasting until 24 March. It was particularly cold, with a minimum temperature of −17 °C measured on the 28 February 2018 at Freudenstadt, corresponding to approx. −18.3 °C at Seibelseckle. Nevertheless, artificial snow on the ski run was produced regularly. Although snowmaking could not be derived from the webcams in March, suitable conditions were available on approx. 15 days. Natural snow could have dominated over artificial snow at the beginning of the winter due to its exceptional character, but from February onwards artificial snow was dominant.
Artificial snow was first produced on 25 November 2017, since the first natural snowfall on 13 November was insufficient and had disappeared by 14 November. However, temperatures proved too warm to maintain an artificial snow cover, so the season could only be opened on 15 December after stronger natural snowfall and cold enough temperatures for snow production. Despite strong snowfalls, the ski season ended on 31 March and lasted for only 106 days (compared to 153 days on the business plan). Snow thawed slowly on the ski run and had completely melted by 29 April. Artificial snow was produced on the 2, 4, 13, and 16–17 December 2017, then again between 17 and 19 January, 21 January 2018, and more intensely towards the end of the winter, from 2 to 14, 19 to 21, and 25 to 27 February 2018. As outlined in the methodology section (2), it was not possible to observe if nighttime snowmaking had taken place between the 5 and 31 March. The last natural snowfall occurred on 23 March but had disappeared by 24 March. Assuming approximately 40 snowmaking days during this particular season, approximately 300,000 m3 water would have been introduced onto the ski run.
Concerning the hydrology, two large floods occurred in March, followed by a period of low flow from May onwards, interrupted by two small floods (Figure 4). Low-flow periods—i.e., the number of days per year with a discharge inferior to 0.4 m3/s (defined as the average of the annual minimal discharge over a given period by the flood center Baden-Württemberg (https://www.hvz.baden-wuerttemberg.de/pegel.html?id=00114))—did not exceed 82 days from 1971 to 2012 but jumped to 118 and 188 days in 2015 and 2018, respectively. These low-flow periods could deteriorate water quality in the future. The Mummelsee was frozen over the winter and started thawing on 6 April. It had entirely thawed by 11 April.

3.2. Physisco-Chemical Parameters

All physico-chemical parameters are presented in Figure 6, together with their mean and standard deviation in Table 2. Temperatures of the water bodies follow each other closely within a 5 °C range and increase homogenously over the study period, stabilizing towards the end of May (Figure 6). Once thawed, the lake heats up much more rapidly than the rest, reaching 21.2 °C by the end of the study period. At this time, a maximum stream temperature of only 10.2 °C was recorded in the catchment at the quarry site. The high lake temperatures could be influenced by measurements taken near the surface. However, in 2005 a Mummelsee study with detailed depth profiles showed that, in June, the temperature was 18.5 °C near the surface, 18 °C at −1 m, and 5.8 °C at −17 m.
Water temperatures at the Hornisgrinde moorland site of the LUBW at 1158 m a.s.l. vary between approximately 5 and 6 °C, reaching a maximum of 8.5 °C in mid-May [42]. Geographically, the nearest site for comparison is the spring feeding the lake, where temperatures range from 7 to 8 °C between the end of May and mid-June. Temperatures at the fountain site always lie slightly above the spring (by 0.5–1 °C). Low temperatures at the fountain site indicate that it is directly connected with the exposed Hornisgrinde moorland via a faultline and remains much cooler than the surrounding sites.
Within the Seebächle catchment, strong variations in pH were found over short distances. The lowest pH value of 4.1 was measured at the Parking_2 site towards the end of natural snowmelt, but it recovered strongly by the second sample. At that time, it was still under the influence of snow cover on the ski run that persisted for another 4 weeks. Its low pH could be due to the influence of podzol soil along its approx. 230 m-long hydrological trajectory. The second lowest value recorded was 4.7 at the fountain site, probably due to the influence of acid podzol and moorland transferred along the faultline from the Hornisgrinde above. The Parking_1 site, which drains the parking lot and some of the ski run, remains more alkaline during the snow season, as does the only sample taken directly below the ski run. Subsequently, the parking site grows steadily more acid, reaching 5.6, possibly due to road salting. Few studies exist on the impacts of road salting on the pH of streams. Previous studies at a lake inlet below the road leading to the Hornisgrinde, which was intensely salted during the 1980s, found that pH values decreased during snowmelt events and were higher before snowmelt [32].
The most alkaline values of the catchment were recorded at the Mummelsee during the winter. During its frozen state, the pH of the lake peaked at around 9.5, fluctuating strongly once thawed and stabilizing around 6.5 towards the end of May. Values during the ice-free period are corroborated by an earlier study from 2005 to 2006 that found a pH between 6 and 7 [33]. The results demonstrate that the Mummelsee has recovered from past effects of acid rain when pH values fluctuated around 5.3 and dropped as low as 4.4 in the 1980s [32]. Neither the lake nor the quarry site follow this general pattern. At the quarry site, pH values ranging between 5.9 and 7.8 during low-flow periods (i.e., for an Acher discharge below 0.8 m3/s) are in good agreement with the pH of 6.62 observed during a previous study in May 2011 [6]. Our values demonstrate a good to very good state for all sample sites, apart from the fountain and parking_2, which only reach poor to moderate values according to the 2000/6/CE European Water Framework Directive.
The electrical conductivity results are quite variable over the catchment and over time. Conductivity of the Mummelsee is weak and relatively constant around 40 µS/cm. It increases as the lake ice starts thawing at the beginning of April and the water starts mixing. It then decreases slightly from May onwards, probably due to water dilution effects. Temporal dynamics compare well with the Hornisgrinde moorland site of the LUBW (Figure 6), where conductivity fluctuates around 30 µS/cm at the beginning of the measurement campaign, reaches a peak around 60 µS/cm, and then decreases to 40 µS/cm by the end of the campaign [42]. Average results are also consistent with another lake study that obtained 33 µS/cm during the spring of 2009 [33]. Low lake conductivity values can be explained by its location in the catchment headwaters, which are unaffected by road salt pollution. The spring feeding the lake has a slightly higher conductivity that increases in June to a maximum of 66 µS/cm. Values of around 43 µS/cm were obtained for it in December 1972 in a study mentioned in [32]. However, in the 1980s conductivity was 10 times more elevated and reached values as high as 143 µS/cm due to excessive winter road salting during postwar French military stationing at the Hornisgrinde [32]. Since the end of the military presence in 1999 [38], the Mummelsee seems to have recovered, assuming that the newly accessible road (since 2019) between the lake and Grinde Hütte restaurant will not be salted in winter.
Values for the parking lot and ski run are very different. During the ski season, conductivity at the parking site and lower ski run drainage (parking_1 and parking_2) is far higher than any other site in the catchment, reaching nearly 150 µS/cm at the end of March. This seems directly related to the salting of roads but also to long-lasting artificial snow. Artificial snow usually has a higher salt content than natural snow, because it is subject to long periods of evaporation as it persists for longer on the ski run [21]. In contrast, the only measurement taken in the drain below the ski run (“ski_run”) after the end of the ski season (38.7 µS/cm) strongly resembled that of the lake (34.5 µS/cm). Perhaps this indicates that large amounts of fresh artificial snow had been produced repeatedly, especially over the more vulnerable lower ski run in the last weeks of the ski season, the water for snowmaking being supplied directly from the lake. Unexpectedly, conductivity at the parking_1 site started to increase strongly again from 66.5 µS/cm from the beginning of May onwards, reaching values of 98 µS/cm at more or less constant water temperatures, even though road salting had stopped and the ski season was over. Conductivity of the fountain remains constant, at just below 80 µS/cm. At the quarry site, conductivity fluctuates around 100 µS/cm, which closely corroborates the values of a study by the Regional Council of Freiburg in May 2011 (93 µS/cm) at a reference site located approximately 300 m further upstream [6].
The levels of dissolved oxygen indicate a good to very good water quality during the entire sampling period, even though it can vary according to many factors, including turbulence, temperature, salinity, the photosynthetic activity of algae and plants, and atmospheric pressure [9]. Whilst the percentage saturation in oxygen reached a very good level for most of the sites, it was only medium to good for some of the anthropogenically influences sites, such as below the parking lot (parking_1) and ski run (parking_2) (Table 1). The site draining the parking lot (parking_1) constantly had the lowest percentage saturation in oxygen. Surprisingly, in mid-June the fountain had the lowest values of the whole study, indicating that there may have been oxidation during its flow path.
Concerning the dissolved oxygen concentration, the highest levels were obtained in the lower basin at the quarry site, and the lowest values, with the exception of one sample, were again obtained at the parking_1 site. The low oxygen values obtained from both types of oxygen analyses can be explained by the high compaction of snow and soil on the ski run. Previous studies have shown that there is oxygen deficiency in soils covered by artificial snow on ski runs [25]. In this study, oxygen deficiency persisted after the snow had thawed completely on the ski run, indicating that the soils did not recover. Towards the beginning of summer, the dissolved oxygen concentration also dropped from a very good to good state at the lake and at the parking_1. Dissolved oxygen concentrations in May at the lake (9.9–11.2 mg/L) compared well with those in a 2006 study that obtained 10 mg/L at the surface and 9 mg/L at −1 m in the same month [33]. Maximum dissolved oxygen levels attained could possibly be due to spring turnover of the lake in May, when the overlaying water contains higher levels of dissolved oxygen [33]. Increases in summer stream temperatures can cause dissolved oxygen levels to fall into a lower range [43], however they do not reach critical enough levels to threaten the health of aquatic species at those sites. Climate change-induced temperature increases in the future may, however, push oxygen levels more strongly towards these limits.
The highest turbidity values were measured in the Mummelsee (up to 19.2 NTU) and the spring entering it (5.2 NTU). All the other sites have comparatively low values remaining below 1 NTU. Only the quarry site lies slightly above with a turbidity of 1.4 NTU. As a consequence of lake thawing, turbidity constantly increases at the lake site, reaching levels 10 times higher than for all other sites at the beginning of June. Large quantities of pollen were found on the lake surface on 9 May and 31 May. The high value at the spring was unexpected. It could be explained by the fact that the spring lies in the direct, very steep drainage path of a new construction site (Grinde Hütte) with a vertical difference of only 122 m over a horizontal distance of 200 m (Figure 2). Earlier studies by Sackmann in 1957 and 1959 mentioned in [32] demonstrated via tracer experiments that there was a direct hydrological link between the buildings above the Mummelsee cirque headwall on the Hornisgrinde and the spring area of the Mummelsee. Taking into account that the EU limit for drinking water is 4 NTU [44], the lake and its main spring never reach a good water quality status. For the spring, this is unfortunate since it was appropriate for drinking water until the 1970s before sewage and road salting problems started in the catchment above. Since these problems have been solved, the spring could have been revalued.
Suspended matter should be related to the turbidity. This is the case for most of the sites, apart from the fountain. The lake and spring have suspended matter values ranging between 9.6 and 15 mg/L but surprisingly the fountain has the highest value of 16.3 mg/L. Fortunately, this still lies under the EU limit of 25 mg/L but the high value for suspended matter obtained at the fountain is difficult to explain. Groundwater feeding the fountain must therefore be linked to a local sediment input source in the upper catchment which is rapidly propelled along the local faultline. The most obvious input would be sediment released from the strongly eroded upper parts of the highly frequented hiking path leading to the Hornisgrinde. Due to steep slopes, it can be assumed that there is strong and rapid lateral near-surface flow within the catchment [45]. Experimental analyses on hillslopes in the Brugga catchment, southern Black Forest, found fast near-surface responses to flood flow of between a few hours to a few days [46]. Shallow groundwater had a mean residence time of 2–3 years.
With the exception of the quarry site, the NO2-N levels were good to very good. Concerning ammonium (NH4-N), levels were good to very good apart from at the Mummelsee and the spring feeding it, which only reached medium to good quality levels. In mid-May, the values were highest in the drainage from the parking lot (parking_1). It should be noted that wastewater from the Mummelsee Hotel, Hornisgrinde, and Seibelseckle restaurant is connected to the communal sewage system since 2005. For nitrite (NO2-N), a level of 0.03 mg/L is considered as a very good ecological state and for ammonium (NH4-N) 0.08 mg/L.
The nitrate nitrogen levels (here NO3-N) hardly vary at any of the sites throughout the study, showing only a slight tendency to increase. This lack in seasonality is unusual, with other studies in mountain environments—e.g., Cairngorms and the Highlands of Scotland—indicating that NO3-N values are highest during the winter and decrease during the spring and summer [47]. All but the spring site fall well within the EU limits of a very good ecological state (2.26 mg/L for water courses, and 0.5 mg/L for lakes) [48]. The lake site values ranged between 0.18 and 0.43 mg/L and the ski resort reached 0.27 mg/L. All water courses had values below 1 mg/L, with the exception of the spring. With a concentration of 3.5 mg/L, the latter only qualifies for a good ecological state. This pollution once again seems to originate from the construction site above the lake. Other mountain sites with ski resorts, such as Lone Mountain, Montana, indicate elevated NO3-N across all seasons (median around 0.2 mg/L) [49].
Nitrite was detected only twice in the lake on 6 April and 9 May, at two other sites on 9 May, and none on the 31 May. None of the values apart from the fountain reached a very good status. The ammonium curves follow a similar pattern to the nitrate ones, with the exception of the spring. Whereas the fountain and quarry sites reached a very good status, the parking_1 site, spring and lake alternately reached this limit only once. Total nitrogen increased at all sites, with the exception of the parking_1 site, as discharge decreased and low flow persisted from the beginning of May onwards. Nitrogen loading calculated at the quarry site based on the discharge correlation between the Seebächle and Acher gave an estimated monthly value of between 20 and 40 mg/L. Since discharge was not measured at the zero and first order streams, the nutrient load could not be calculated for the other sites but an estimation showed that the spring feeding the lake and the parking_2 sites draining the ski run had the highest load. Organic nitrogen, an indicator of nitrogen in freshly polluted water, also increased at all sites, with the exception of the parking_1 site. This indicates less nitrogen uptake by plants and pollution at various sites throughout the catchment.
The interpretation of the results in this study is limited to medium and low-flow conditions. It could be expected that concentrations decrease during high flows. However, the water quality results are comparable to previous studies carried out within the catchment [6,32,33,42].

3.3. Bacteria

All the water samples taken on 9 April 2018 in the Seebächle catchment (during an Acher discharge of 1.23 m3/s) were strongly contaminated by micro-organisms, including 8 different types of pathogenic bacteria (Table 3). These included Pseudomonas, Yersinia, and enterobacteria. Pseudomonas are important decomposers of organic matter in soil, water, and food products, but are also pathogenic to plants, animals, and humans [50]. Enterobacteria are bacteria hosted by the digestive track of animals and humans. Some of them are pathogenic. Yersinia enterocolitica can be transmitted through wildlife, such as deer, and propagated through the catchment during stormwater runoff [15].
Amongst all sites, the highest number of bacteria species was found at the quarry site. Both the quarry and parking_2 site (drained by the ski run) were most contaminated, hosting three pathogenic species each. In total, three bacteria species (two of them pathogenic) were mutual to both sites, demonstrating a strong connectivity. Of the pathogenic bacteria, Yersinia enterocolitica was found at the parking_2 site, which mostly diverted snowmelt from the ski run and 1 km further downstream in the Seebächle torrent (at the quarry site). Two other bacteria, Rahnella aquatilis (pathogenic) and P. protegens, were mutual to the parking and quarry site. At least two species of pathogenic bacteria were found in each ski run snow sample as well as in the ski run drainage. All the samples from the ski run and from the parking lot contained pathogenic bacteria of the Pseudomonas family. The largest number of bacteria from the Pseudomonas family were found at Parking_1 draining the parking lot.
The bacterium Pantoea agglomerans belongs to the family of enterobacteria, is pathogenic, and thrives well during winter chilling. It seems specific to long-lasting artificial and/or compacted snow on the ski run, since it was only found in the snow samples on the upper ski run and in meltwater draining the ski run. Indeed, snow persists for longer on the upper parts of the ski slope, which is colder, whereas the lower slope is subject to higher temperatures and concentration of skiers. On the sampling day, snow was already very patchy along the lower slope. Although the ski season had ended on 31 March, there was still some snow on the ski run that continued to melt.
Although several bacteria were found at the natural site, only one was pathogenic but one non-pathogenic one, Pseudomonas frederiksbergensis, was of serious concern. It was found at the natural site (natural snow next to the ski run). It is a bacterium that degrades phenanthrene (a polycyclic aromatic hydrocarbon), a persistent toxic compound [51]. It is the only bacterium that that can be explained solely by anthropogenic activities. Phenanthrene originates from incomplete combustion of wood, coal or petrol and has been isolated from tar-polluted soil. Phenanthrene is a likely a human carcinogen. Found within 10 m from the ski run, the bacterium most probably originates from the diesel-powered snow grooming machines that work both by day and night during the ski season. At that time, snowmelt was well advanced in the basin and snow had to be sampled from an isolated snow patch within the forest, well protected in the shade, which had probably persisted over a long time and accumulated the diesel emissions over a longer period. It is likely that this presumably natural snow sample was influenced by wind-driven snow or snowmelt from one of the numerous drainage ditches issued from the ski run (Figure 3). Although the subspecies of Pseudomonas frederiksbergensis is not known, some subspecies, such as Pseudomonas frederiksbergensis ERDD5, show survivability at high altitude stress conditions, such as freezing and frequent freeze-thaw cycles [52].
During the second campaign on 31 May 2018 (with an Acher discharge of 0.38 m3/s), the number of bacteria present was still too elevated to be quantified, with the exception of the fountain site sample. For most samples, the Colony Forming Unit could be determined, considering that a bacterium is at the origin of a colony in the culture medium. Nevertheless, there were six genera of bacteria whose species could not be determined, in this case the name terminates with an sp.
Table 4 shows that 4 of the 6 bacteria present in the samples of the parking_1 site are identical to those of the fountain site (Serratia fonticola, Flavobacterium sp, Pseduomonas sp and Yersinia sp), however their density at the fountain site is much lower than at all other sites in the catchment. Despite their geographical proximity, the similarity between groundwater and surface water results is surprising. This indicates that the two sites are connected via flow along the watershed boundary. It also indicates that the fountain is partially fed by surface water from the Hornisgrinde.
Carnobacterium maltaromaticum is common to both the fountain and quarry site. This bacterium can be found in the food industry, in particular in association with meat, fish, and milk products [53]. Its occurrence could be explained by the remains of related food products on the highly frequented hiking path leading along the catchment boundary to the Hornisgrinde plateau. Again, this indicates that the fountain drainage is directly linked to the Seebächle stream, as was already observed with the intermediate parking_1 site. At the parking_1 site, five different species of Aeromonas were found, some pathogenic to humans. They are common to freshwater.
Because of their high incidence (more than 60 different species), Pseudomonas bacteria were found across all sampling sites. Yet, since their species could not be identified, it was not possible to compare them amongst each other. Both the spring and the quarry site contained the highest number of bacteria. The unexpectedly high number of bacteria in the spring could be an indication of contamination from the upper catchment, possibly from an ongoing construction site draining the spring. Three bacteria species and one bacteria genus were found in the spring: Cedecea davisae, Flavobacterium araucananum, Serratia liquefaciens and Citrobacter sp. Cedecea davisae is a rare bacteria species that has been found in cockroaches, blood, human saliva and wounds, and in the intestines of certain animals [54]. Flavobacterium araucananum is a recently discovered species found in salmon [55]. Serratia liquefaciens, is a bacterium that is very ubiquitous in the environment and capable of colonizing the soil, water, plants digestive tracts of animals and humans [56]. Both Citrobacter sp and Cedecea davisae are enterobacteria. The former is a genus present in numerous ecological niches, whilst the latter is rather unexpected in this environment.
The only two bacteria species found in the lake were common to the spring and lake. However, the lake sampling point could be somewhat biased since it is located near the shore and is characterized by a prolonged ice cover. A sampling point nearer the middle of the lake may have picked up more microbes emitted from the spring entering the lake, even under a slow lake turnover. The lake had a high concentration of bacteria despite their low diversity, probably due to intense tourism and short hydrological pathways within the small surrounding subcatchment. It is unfortunate that the lake seems to be entering a new phase of pollution due to tourism after its water quality has improved over the past 50 years. Between the 1950 and 1970s, untreated sewage water from the French military barracks on the Hornisgrinde had entered the lake via the main Hirtenstein spring (Figure 3), leading to eutrophication and cyanobacteria blooms [32].
The sampling point below the quarry contains the highest diversity of bacteria, including Erwinia billingiae, a bacterium pathogenic to plants. Hafnia alvei is naturally present in ecosystems. Such diversity is probably due to transmission of bacteria from the entire catchment. Possibly, the concentration of bacteria at the spring and fountain was negatively influenced by low discharge after snowmelt, taking into account that discharge was thrice lower during the second sampling period.
Most water pollution in the Seebächle catchment is directly linked to overtourism. Overtourism reflects an imbalance between the numbers of tourists and the carrying capacity of the tourism system [57] and can be related to unsustainable practices of mass tourism [58]. Major challenges arise when the carrying capacity is exceeded. Since the Mummelsee and its catchment is frequented by several thousands of visitors per day, its water quality carrying capacity is exceeded during certain seasons. The same is true for the winter and spring seasons at the Seibelseckle ski run, despite being frequented by comparatively fewer visitors. Case studies from other mountain regions (Central Range, Iberia, Fagaras Mountains, Romania, Australian Alps, Australia) and fells (Ruka and Levi, Finland) worldwide show that strong tourism pressure by skiing and hiking can negatively affect the water quality of alpine lakes and aquatic ecosystems [59]. This often concerns sensitive areas and National Parks. A recent study identifies eutrophication caused by anthropogenic impacts of hiking tourism as a major threat to water quality of several high-altitude alpine lakes in the Tatra National Park, Poland [59].
Our study results are applicable in future management and monitoring programs by water and regional environmental authorities, tourism, and National Park administrations. The results could be applied to other temperate, low-mountain, forested catchments with ski runs and cirque lake tourism in Europe, such as in the Vosges Mountains (France), Bavarian Forest (Germany) and Giant Mountains (Czech Republic), even though the high tourist intensity of the Mummelsee is unique. Water quality from this ski run producing artificial snow from lake water may be less generalizable because artificial snow is mostly produced from stream water. Wider applicability also depends on the location of roads and intensity of salting. With the exception of the influence of the specific faultline situation and an upland moor, the results could be generalizable to similar catchments.

4. Conclusions

Combined physico-chemical and bacterial analyses show that ski runs, parking lots, construction sites, and highly frequented hiking trails have significant impacts on water quality in a small, headwater mountain catchment situated partially within the buffer zone of the Black Forest National Park. These anthropogenically impacted sites were compared with natural sites (spring, lake, fountain, and torrent). Our research strongly benefitted from cooperation with a medical laboratory, enabling the identification of a range of pathogenic and non-pathogenic bacteria. Since this was a first-time mountain field study, we could not anticipate the unexpectedly high concentration of bacteria and, as a result, not all bacteria species could be quantified and not all species determined. In some cases, only qualitative comparisons were therefore possible.
The ski run has both direct and indirect effects on the water’s physico-chemical quality. Conductivity of parking_1 and _2, draining the road and ski run, respectively, was far higher than at the other sites, indicating both the effects of road salting as well as stagnating artificial snow. Although only one ski run meltwater sample could be taken directly beneath the Seibelseckle ski run during the campaign, nearly all its physico-chemical properties corresponded very well with the two sites below it. The only exception was conductivity. Its close correspondence with the lake instead can be explained by the fact that water for snowmaking originates from the Mummelsee and that artificial snow was produced frequently towards the end of the season. Nitrate, nitrite, and ammonium values increased below the ski run after its snow cover had completely disappeared.
Bacterial analyses revealed bacteria specific to the ski run and ski run maintenance. Pathogenic bacteria were found in the snow on the ski run and its meltwater. In fact, the highest number of pathogenic bacteria was found in the drainage water below the ski run and parking lot. One bacterium found in the snow on the ski run is specific to cold conditions and could be linked to the compacted and persistent snow cover (both natural and artificial) on the ski run. Another bacterium found in the natural snow next to the ski run could be linked to daily and nightly emissions from diesel-driven snow grooms. It is likely that this presumably natural snow sample was influenced by wind-driven snow or snowmelt from one of the numerous drainage ditches issued from the ski run. Since bacterial analyses were mostly limited to identification without quantification, the bacterial concentrations in artificial and natural snow could not be compared.
Although the physico-chemical properties of some sites seemed to fluctuate with seasonality and discharge, others such as the parking site seemed more dependent on tourist and traffic frequentation. The only exception was conductivity at the parking lot, which started to increase strongly again from May onwards, despite constant temperatures and the termination of road salting and the ski season. Although the samples were representative of the discharge regime, more frequent samples over a longer time period, beginning with the first snowfall, would have been advantageous.
There are major differences in water quality between the Mummelsee and the Seebächle, with the lake showing a far lower diversity of bacteria than the downstream torrent. Moreover, there was a strong similarity between pathogenic bacteria pollution found in the fountain, parking, and quarry sites, indicating their strong hydrological connectivity. At the quarry site, certain pathogenic bacteria such as Hafnia alvei and Lelliottia amnigena persisted during the whole season.
An unexpected result was that those sites presumed natural, such as the spring above the lake and the fountain, proved more contaminated by bacteria than those under visible anthropogenic influence, such as the ski run or parking lot. The fountain contamination could be derived from erosion and waste from the highly frequented tourist path running along the faultline, whilst the spring contamination could be linked by a direct hydrological pathway from the restaurant and parking construction site that was active during the measurement campaign. Nevertheless, it is alarming that the groundwater-fed drinking fountain hosted three different kinds of pathogenic bacteria.
Most water pollution in the Seebächle catchment is directly linked to overtourism around the Mummelsee and at the Seibelseckle ski run, an issue that needs to be further addressed. In future, it would be recommendable to ban pet animals around the Mummelsee as well as in the catchment above to prevent pathogenic bacteria from entering the water cycle of the catchment. To avoid waste and human feces input, mobile toilets and waste bins should be established along the most frequented tourist paths, and awareness should be raised on these issues. Visitors should be mandated to use the lower parking, and road salting should be avoided along the Mummelsee-Hornisgrinde road during wintertime.
Further long-term monitoring programs consisting of physico-chemical and bacteriological analyses in selected hotspots at regular time intervals are required. A more advanced study of bacteria and their metabolism could help to identify the sources and sinks of nitrates and dissolved oxygen compounds in the catchment. The question of whether a forested catchment plays a purification role still remains to be answered.

Author Contributions

This work is based primarily on the Master’s 1 Thesis of Laura Siegwald at the Faculty of Geography and Regional Planning, University of Strasbourg, France in 2018. Conceptualization: C.d.J.; methodology: C.d.J. and L.S.; software: L.S.; validation: L.S.; formal analysis: L.S.; investigation: L.S. and C.d.J.; resources: C.d.J.; writing—original draft preparation: C.d.J.; writing—review and editing: C.d.J. and L.S.; visualization: L.S. and C.d.J.; supervision: C.d.J.; funding acquisition: C.d.J. All authors have read and agreed to the published version of the manuscript.

Funding

The water and bacterial analyses were funded by the Department LIVE (Laboratoire Image Ville Environnement) = Department of Imagery, Town and Environment (CNRS 7362), University of Strasbourg, France. The Microbiology Laboratory of the Laboratory of Hospital Hygiene (UF 1302) of the CHU Strasbourg, University Hospital of Strasbourg, financed the second series of bacterial analyses.

Acknowledgments

We would like to acknowledge the immense help offered by Laure Belotti Ehrhard for bacterial analyses carried out at the Microbiology Laboratory of the Laboratory of Hospital Hygiene (UF 1302) of the CHU Strasbourg (University Hospital of Strasbourg) and Marie-Pierre Ottermatte and Carole Lutz of the ISO 9001 certified LEE (Laboratoire d’Etudes d’Eau) = the Laboratory for Water Analyses of the ENGEES (Ecole National du Génie de l’Eau et de l’Environnement de Strasbourg) = National School for Water and Environmental Engineering, Strasbourg, France, for water analyses. Our thanks also go to four anonymous reviewers and the academic editor.

Conflicts of Interest

The authors declare no conflict of interest.

References

  1. Křeček, J.; Haigh, M.; Hofer, T.; Kubin, E.; Promper, C. Ecosystem Services of Headwater Catchments; Springer: Berlin/Heidelberg, Germany, 2017; ISBN 3-319-57945-2. [Google Scholar]
  2. Amatya, D.M.; Williams, T.M.; Bren, L.; de Jong, C. Forest Hydrology: Processes, Management and Assessment; CABI: Wallingford, UK, 2016; ISBN 978-1-78064-660-2. [Google Scholar]
  3. Hoekstra, A.Y.; Chapagain, A.K.; Van Oel, P.R. Advancing water footprint assessment research: Challenges in monitoring progress towards Sustainable Development Goal 6. Water 2017, 9, 438. [Google Scholar] [CrossRef] [Green Version]
  4. UN Water. Integrated Monitoring Guide for SDG 6: Targets and Global Indicators; UN Water: Geneva, Switzerland, 2016; p. 26. [Google Scholar]
  5. European Commission. Directive 2000/60/EC of the European Parliament and of the Council of 23 October 2000 Establishing a Framework for Community Action in the Field of Water Policy. s.l; European Commission: Brussels, Belgium, 2000. [Google Scholar]
  6. Wurm, K. Untersuchungen zu Den Gewässerökologischen Auswirkungen der Einleitungen aus den Steinbruchbetrieben im Oberen Achertal (Analysis of Hydroecological Impacts of Discharge from a Granite Quarry in the Upper Acher Valley); Regierungspräsidium Freiburg; Gewässerökologisches Labor: Starzach, Germany, 2014. [Google Scholar]
  7. Mann, C.; Absher, J.D. Recreation conflict potential and management implications in the northern/central Black Forest Nature Park. J. Environ. Plan. Manag. 2008, 51, 363–380. [Google Scholar] [CrossRef]
  8. Ott, B.; Uhlenbrook, S. Quantifying the impact of land-use changes at the event and seasonal time scale using a process-oriented catchment model. Hydrol. Earth Syst. Sci. Discuss. 2004, 8, 62–78. [Google Scholar] [CrossRef] [Green Version]
  9. Global Freshwater Quality. A first Assessment; Meybeck, M.D., Chapman, D.V., Helmer, R., Eds.; WHO and UNE; Basil Blackwell: Oxford, UK, 1989. [Google Scholar]
  10. Delpla, I.; Jung, A.-V.; Baures, E.; Clement, M.; Thomas, O. Impacts of climate change on surface water quality in relation to drinking water production. Environ. Int. 2009, 35, 1225–1233. [Google Scholar] [CrossRef]
  11. Pompei, C.; Alves, E.; Vieira, E.; Campos, L. Impact of meteorological variables on water quality parameters of a reservoir and ecological filtration system. Int. J. Environ. Sci. Technol. 2020, 17, 1387–1396. [Google Scholar] [CrossRef] [Green Version]
  12. Mengistu, S.G.; Quick, C.G.; Creed, I.F. Nutrient export from catchments on forested landscapes reveals complex nonstationary and stationary climate signals. Water Resour. Res. 2013, 49, 3863–3880. [Google Scholar] [CrossRef]
  13. Gray, N.F. Ch. 19 Monitoring and removal of pathogens. In Drinking Water Quality: Problems and Solutions; Cambridge University Press: Cambridge, UK, 2008; pp. 307–322. [Google Scholar]
  14. Pennington, K.L.; Cech, T.V. Water Quality. In Introduction to Water Resources and Environmental Issues; Cambridge University Press: Cambridge, UK, 2009; pp. 99–136. ISBN 1-107-39420-1. [Google Scholar]
  15. Geldreich, E.E. Pathogenic agents in freshwater resources. Hydrol. Process. 1996, 10, 315–333. [Google Scholar] [CrossRef]
  16. Xie, X.; Norra, S.; Berner, Z.; Stüben, D. A Gis-Supported Multivariate Statistical Analysis of Relationships Among Stream Water Chemistry, Geology and Land Use in Baden-Württemberg, Germany. Water. Air. Soil Pollut. 2005, 167, 39–57. [Google Scholar] [CrossRef]
  17. Schneider, P.; Neitzel, P.L.; Schaffrath, M.; Schlumprecht, H. Physico-chemical assessment of the reference status in German surface waters: A contribution to the establishment of the EC Water Framework Directive 2000/60/EG in Germany. Acta Hydrochim. Hydrobiol. 2003, 31, 49–63. [Google Scholar] [CrossRef]
  18. Driscoll, C.T.; Wang, Z. Ecosystem Effects of Acidic Deposition. In Encyclopedia of Water; American Cancer Society: New York, NY, USA, 2019; pp. 1–12. ISBN 978-1-119-30076-2. [Google Scholar]
  19. Shanley, J.B.; Wemple, B. Water Quantity and Quality in the Mountain Environment. Vt. Law Rev. 2001, 26, 717. [Google Scholar]
  20. Murdoch, P.S.; Shanley, J.B. Detection of water quality trends at high, median, and low flow in a Catskill Mountain stream, New York, through a new statistical method. Water Resour. Res. 2006, 42, 42. [Google Scholar] [CrossRef]
  21. Constantz, J. Interaction between stream temperature, streamflow, and groundwater exchanges in alpine streams. Water Resour. Res. 1998, 34, 1609–1615. [Google Scholar] [CrossRef]
  22. Ries, J.B. Landscape damage by skiing at the Schauinsland in the Black Forest, Germany. Mt. Res. Dev. 1996, 16, 27–40. [Google Scholar] [CrossRef]
  23. Molles, M.C.; Gosz, J.R. Effects of a ski area on the water quality and invertebrates of a mountain stream. Water. Air. Soil Pollut. 1980, 14, 187–205. [Google Scholar] [CrossRef]
  24. de Jong, C. Challenges for mountain hydrology in the third millennium. Front. Environ. Sci. 2015, 3, 38. [Google Scholar] [CrossRef] [Green Version]
  25. Rixen, C.; Stoeckli, V.; Ammann, W. Does artificial snow production affect soil and vegetation of ski pistes? A review. Perspect. Plant Ecol. Evol. Syst. 2003, 5, 219–230. [Google Scholar] [CrossRef]
  26. Lagriffoul, A.; Boudenne, J.-L.; Absi, R.; Ballet, J.-J.; Berjeaud, J.-M.; Chevalier, S.; Creppy, E.E.; Gilli, É.; Gadonna, J.-P.; Gadonna-Widehem, P.; et al. Bacterial-based additives for the production of artificial snow: What are the risks to human health? Sci. Total Environ. 2010, 408, 1659–1666. [Google Scholar] [CrossRef] [PubMed] [Green Version]
  27. de Jong, C. Hochgebirge: Wassertürme für eine wachsende Weltbevölkerung. In Warnsignal Klima: Hochgebirge im Wandel; Lozán, J.L., Breckle, S.-W., Escher-Vetter, H., Grassl, H., Kasang, D., Paul, F., Schickhoff, U., Eds.; Wissenschaftliche Auswertungen: Hamburg, Germany, 2020; pp. 45–52. [Google Scholar]
  28. Siegwald, L. Qualité de l’eau en Moyenne Montagne: Pentes Naturelles et Anthropisées (Water Quality in Low Mountain Regions: Natural and Artificial Slopes). Master’s Thesis, Faculty of Geography and Regional Planning, University of Strasbourg, Strasbourg, France, 2018. [Google Scholar]
  29. Landesamt für Geologie, Rohstoffe und Bergbau. Baden Würrtemberg Bodenkunde Übersichtskarte 1:50,000. Available online: http://maps.lgrb-bw.de/?view=lgrb_uek350_boden (accessed on 1 June 2018).
  30. DWD Niederschlag: Vieljährige Mittelwerte 1981–2010. Available online: https://www.dwd.de/DE/leistungen/klimadatendeutschland/mittelwerte/nieder_8110_akt_html.html?view=nasPublication (accessed on 1 June 2018).
  31. Ortlam, D. Der Ursprung der Acher (Nord-Schwarzwald) Anhand Historischer Recherchen, Die Glaziale Genese des Ruhesteins und der Neue FRT-Horizont im Tiefen Buntsandstein (Schwarzwald-Hochstraße); Ortlam: Bremen, Germany, 2010; p. 26. [Google Scholar]
  32. Thies, H. Limnochemische Untersuchungen an vier Karseen des Nordschwarzwaldes unter Berücksichtigung von sauren Niederschlägen sowie der Makrophytenvegetation. Diploma Thesis, University of Freiburg, Baden-Württemberg, Germany, 1987. [Google Scholar]
  33. Gilfedder, B.S.; Petri, M.; Biester, H. Iodine speciation and cycling in fresh waters: A case study from a humic rich headwater lake (Mummelsee). J. Limnol. 2009, 68, 396–408. [Google Scholar] [CrossRef] [Green Version]
  34. Wikipedia. Mummelsee—Wikipedia, Die Freie Enzyklopädie. Available online: https://de.wikipedia.org/wiki/Mummelsee (accessed on 2 June 2020).
  35. Fiedler, S.; Lamers, M.; Ingwersen, J.; Streck, T.; Stahr, K.; Jungkunst, H.F. Impact of the heatwave in 2003 on the summer CH4 budget of a spruce forest with large variation in soil drainage: A four-year comparison (2001–2004). J. Plant Nutr. Soil Sci. 2008, 171, 666–671. [Google Scholar] [CrossRef]
  36. BFG Thematische Karte, 2nd WRRL Bewirtschaftungsplan (WFD Management Plan); BFG: Koblenz, Germany. Available online: https://geoportal.bafg.de/wfdmaps2017/ (accessed on 2 June 2020).
  37. Schlund, W. Naturschutzgebiet Hornisgrinde—Biberkessel; Staatliche Naturschutzverwaltung Baden-Württemberg, Regierungspräsidium Freiburg: Freiburg, Germany, 2009. [Google Scholar]
  38. Hornisgrinde. Available online: https://en.wikipedia.org/wiki/Hornisgrinde (accessed on 2 June 2020).
  39. ILN Bühl. Management Plan (MaP) für das FFH-Gebiet 7415-311 “Wilder See—Hornisgrinde und Oberes Murgtal”. Natura 2000; Regierungspräsidium Karlsruhe: Karlsruhe, Germany, 2018; p. 178. [Google Scholar]
  40. Nationalpark Schwarzwald LGL Gebietsgliederung. Available online: www.lgl-bw.de (accessed on 2 June 2020).
  41. Sauer, S.; Freiwald, A.; Maier, T.; Kube, M.; Reinhardt, R.; Kostrzewa, M.; Geider, K. Classification and identification of bacteria by mass spectrometry and computational analysis. PLoS ONE 2008, 3, e2843. [Google Scholar] [CrossRef] [Green Version]
  42. LUBW. Wetter—Und Pegeldaten Hornisgrinde, Messjahr 2018, Moorkataster Baden-Würtemberg; LUBW: Karlsruhe, Germany, 2018. [Google Scholar]
  43. Morrill, J.C.; Bales, R.C.; Conklin, M.H. Estimating Stream Temperature from Air Temperature: Implications for Future Water Quality. J. Environ. Eng. 2005, 131, 139–146. [Google Scholar] [CrossRef] [Green Version]
  44. WHO. Drinking Water Parameter Cooperation Project. Support to the Revision of Annex I Council Directive 98/83/EC on the Quality of Water Intended for Human Consumption (Drinking Water Directive); WHO: Bonn, Germany, 2017; p. 240. [Google Scholar]
  45. Wenninger, J.; Uhlenbrook, S.; Tilch, N.; Leibundgut, C. Experimental evidence of fast groundwater responses in a hillslope/floodplain area in the Black Forest Mountains, Germany. Hydrol. Process. 2004, 18, 3305–3322. [Google Scholar] [CrossRef]
  46. Uhlenbrook, S.; Leibundgut, C.; Maloszewski, P. Natural tracers for investigating residence times, runoff components and validation of a rainfall-runoff model. IAHS Publ. 2000, 262, 465–471. [Google Scholar]
  47. Clark, M.J.; Cresser, M.S.; Smart, R.; Chapman, P.J.; Edwards, A.C. The influence of catchment characteristics on the seasonality of carbon and nitrogen species concentrations in upland rivers of Northern Scotland. Biogeochemistry 2004, 68, 1–19. [Google Scholar] [CrossRef]
  48. Ministère de la Transition écologique et solidaire. Guide Technique Relatif à L’évaluation de L’état des Eaux de Surface Continentales (Cours D’eau, Canaux, Plans D’eau); Ministère de la Transition Ecologique et Solidaire: La Défense, France, 2019; p. 123. [Google Scholar]
  49. Gardner, K.K.; McGlynn, B.L. Seasonality in spatial variability and influence of land use/land cover and watershed characteristics on stream water nitrate concentrations in a developing watershed in the Rocky Mountain West. Water Resour. Res. 2009, 45, 45. [Google Scholar] [CrossRef] [Green Version]
  50. Andersen, S.M.; Johnsen, K.; Sørensen, J.; Nielsen, P.; Jacobsen, C.S. Pseudomonas frederiksbergensis sp. nov., isolated from soil at a coal gasification site. Int. J. Syst. Evol. Microbiol. 2000, 50, 1957–1964. [Google Scholar] [CrossRef] [Green Version]
  51. Abdel-Shafy, H.I.; Mansour, M.S. A review on polycyclic aromatic hydrocarbons: Source, environmental impact, effect on human health and remediation. Egypt. J. Pet. 2016, 25, 107–123. [Google Scholar] [CrossRef] [Green Version]
  52. Kumar, R.; Acharya, V.; Mukhia, S.; Singh, D.; Kumar, S. Complete genome sequence of Pseudomonas frederiksbergensis ERDD5: 01 revealed genetic bases for survivability at high altitude ecosystem and bioprospection potential. Genomics 2019, 111, 492–499. [Google Scholar] [CrossRef]
  53. Afzal, M.I.; Jacquet, T.; Delaunay, S.; Borges, F.; Millière, J.-B.; Revol-Junelles, A.-M.; Cailliez-Grimal, C. Carnobacterium maltaromaticum: Identification, isolation tools, ecology and technological aspects in dairy products. Food Microbiol. 2010, 27, 573–579. [Google Scholar] [CrossRef]
  54. Perkins, S.R.; Beckett, T.A.; Bump, C.M. Cedecea davisae bacteremia. J. Clin. Microbiol. 1986, 24, 675. [Google Scholar] [CrossRef] [Green Version]
  55. Kämpfer, P.; Lodders, N.; Martin, K.; Avendaño-Herrera, R. Flavobacterium chilense sp. nov. and Flavobacterium araucananum sp. nov., isolated from farmed salmonid fish. Int. J. Syst. Evol. Microbiol. 2012, 62, 1402–1408. [Google Scholar] [CrossRef] [PubMed] [Green Version]
  56. Labbate, M.; Queck, S.Y.; Koh, K.S.; Rice, S.A.; Givskov, M.; Kjelleberg, S. Quorum sensing-controlled biofilm development in Serratia liquefaciens MG1. J. Bacteriol. 2004, 186, 692–698. [Google Scholar] [CrossRef] [PubMed] [Green Version]
  57. Weber, F.; Stettler, J.; Priskin, J.; Rosenberg-Taufer, B.; Ponnapureddy, S.; Fux, S.; Barth, M. Tourism destinations under pressure: Challenges and innovative solutions. Lucerne Univ. Appl. Sci. Arts Inst. Tour. ITW Roesslimatte 2017, 48, 6002. [Google Scholar]
  58. Martín-Martín, J.M.; Ostos-Rey, M.S.; Salinas-Fernández, J.A. Why Regulation Is Needed in Emerging Markets in the Tourism Sector. Am. J. Econ. Sociol. 2019, 78, 225–254. [Google Scholar] [CrossRef] [Green Version]
  59. Senetra, A.; Dynowski, P.; Cieślak, I.; Źróbek-Sokolnik, A. An Evaluation of the Impact of Hiking Tourism on the Ecological Status of Alpine Lakes—A Case Study of the Valley of Dolina Pięciu Stawów Polskich in the Tatra Mountains. Sustainability 2020, 12, 2963. [Google Scholar] [CrossRef] [Green Version]
Figure 1. (a) 3D view of the Seebächle catchment. Source: Google Earth image, 16 September 2018. (b) Soil map of Seebächle catchment according to soil units of the 1:50,000 soil map. Source: [29].
Sustainability 12 09022 g001
Figure 2. Lake Mummelsee with the existing and construction sites of parking lots. Construction site of the new Grinde Hütte restaurant with parking visible above the cirque headwall (35° slope angle) within a direct drainage path into the Mummelsee. The Hirtensteinquelle is a spring and the main source of the River Acher. Source: Google Earth image, 16 September 2018.
Sustainability 12 09022 g002
Figure 3. Drainage pattern of Seibelseckle ski run (“Ski_run”) and parking lots (P 1 = “Parking_1” and P 2 = “Parking_2”) crossing the catchment divide between the Seebächle and Kesslebach catchments. Source: Google Earth image, 16 September 2018.
Sustainability 12 09022 g003
Figure 4. Water quality sampling and measurements related to the discharge regime of the River Acher between 1 March and 15 June 2018. Discharge curve established from data from LUBW. Precipitation data are from Kniebis, 901 m a.s.l., DWD.
Sustainability 12 09022 g004
Figure 5. Map of the Seebächle study area with the measuring and sampling sites.
Sustainability 12 09022 g005
Figure 6. Physico-chemical field results (each dot = one sample) from 6 March—13 June 2018. Left column: direct sampling (temperature, pH, conductivity, DOC, and oxygen saturation). Right column: laboratory analysis (turbidity, suspended matter, organic nitrogen, nitrite, nitrate, ammonium, and total nitrogen). Hornisgrinde LUBW groundwater site (conductivity, temperature, and groundwater level) [42] on two graphs bottom left.
Sustainability 12 09022 g006aSustainability 12 09022 g006b
Table 1. Coordinates and characteristics of the measuring sites.
SiteLatitudeLongitudeAltitude (m)Hiking ImpactSki Run ImpactSki Park. ImpactDrains below B500
spring48°35′56.274″8°12′2.012″1040-nonono
lake48°35′52.228″8°11′59.222″1035yesnonono
up_ski run48°35′38.555″8°13′11.859″1010noyesnono
natural48°35′37″8°13′13.583″1000nononono
low_ski run48°35′43.679″8°13′6.651″960noyesnono
ski_run48°35′46.079″8°13′6.106″955noyesnono
fountain48°35′47.663″8°13′2.308″955-nonono
parking_148°35′42.84″8°12′59.42″945noyesyesyes
parking_248°35′40.258″8°12′57.636″935noyesnoyes
quarry48°35′16.346″8°12′21.345″700no--no
Table 2. Standard deviation (box: top left) and mean (box: bottom right) of the variables at sites.
VariableTpHCond.DOCOxyg. Satur.Turb.Susp. Matt.Organ.Nitrog.NO2-NNO3-NNH4-NTN
Spring0.7 0.4 7.3 2.0 7.1
7.8 6.4 61.2 10.2 102
Lake9.1 1.3 8.1 1.3 25.1 8.3 3.01 0.63 0.03 0.16 0.09 0.7
10.9 7.8 43.6 9.5 104.9 12.2 11.9 1.58 0.03 0.25 0.09 2.0
P_12.5 0.7 33.6 1.0 7.4 0.3 0.4 0.43 0.02 0.08 0.06 0.4
7.3 6.3 103.5 8.6 82.5 0.7 0.23 1.18 0.01 0.41 0.05 1.7
P_22.6 1.6 34.3 0.6 6.0
3.7 5.2 108.5 9.6 86.8
Quarry2.6 0.7 9.5 1.1 14.0 0.4 0.29 0.27 0.06 0.17 0.01 0.4
8.2 7.0 97.6 10.8 101.4 1.0 0.17 0.38 0.03 0.61 0 1.0
Fount.0.6 0.4 3.9 1.8 24.0 0.2 11.5 1.0 0 0.01 0.02 1.0
7.9 5.0 75.3 10.8 94.9 0.8 8.15 1.0 0 0.96 0.02 2.0
Table 3. Bacterial analysis on 9 April 2018 with some remaining snow cover on the ski run (the ski season had ended on the 31 March).
Sampling Site
Speciesski_runnatural siteup_ski_runlow_ski_run_parking_1parking_2quarryHabitatPathogenic
Achromobacter sp x freshwater, marine water, soil-
Bacillus megaterium x marine water, soilno
Hafnia alvei * xfreshwater, waste water, soil, food productsrarely
Lelliottia amnigena * xprincipally in wateryes
Pantoea agglomeransx x vegetables, grains, fruits, excrementsyes
P. brassicacearumx isolated apart from rapeseed floweryes
P. fluorescens x soil, animalsRarely
P. frederiksbergensis x soil and sedimentsno
P. koreensisxx xx cultivated soil-
P. protegens xxxsoilno
Rahnella aquatilis * x xxxwater, soil, vegetablesyes
Serratia fonticola * x soil, animalsyes
Staphylococcus pasteuri x animals, vegetables, stratospheryes
Yersinia enterocolitica * xxsurface water, foodyes
Yersinia intermedia * x freshwater, wastewater, rodentsrarely
* enterobacteria
Table 4. Bacterial analysis on 31 May 2018 after complete snow melt in the catchment and ski run.
Sampling Site
SpeciesSpringLakeFountainParking_1_QuarryPathogenic
Carnobacterium maltaromaticum x xfish
Cedecea davisaex -
Erwinia billingiae * xplants
Flavobacterium araucananumx -
Hafnia alvei * xrarely
Lelliottia amnigena *xx xyes
Serratia fonticola *x xx rarely
Serratia liquefaciens *x sometimes
Yersinia aldovae* xno
Aeromonas sp. xx-
Citrobacter sp. *x -
Flavobacterium sp xxx-
Pseudomonas spxxxxx-
Serratia sp * x-
Yersinia sp * xx -
* enterobacteria
Publisher’s Note: MDPI stays neutral with regard to jurisdictional claims in published maps and institutional affiliations.

