Article

Should Photovoltaics Stay at Home? Comparative Life Cycle Environmental Assessment on Roof-Mounted and Ground-Mounted Photovoltaics

by
Victor Kouloumpis
1,2,3,*,
Antonios Kalogerakis
4,5,
Anastasia Pavlidou
6,
George Tsinarakis
6,7 and
George Arampatzis
7
1
Environment and Sustainability Institute, University of Exeter, Penryn TR10 9FE, UK
2
College of Engineering, Mathematics and Physical Sciences, University of Exeter, Penryn TR10 9FE, UK
3
OSTRACON Ltd., Crown House, 27 Old Gloucester Street, London WC1N 3AX, UK
4
Department of Science Natural Resources and Outdoor Studies, University of Cumbria, Cumbria LA22 9BB, UK
5
Department of the Orthodox Academy of Crete, Institute of Theology and Ecology, 73006 Kolympari, Greece
6
Department of Financial & Management Engineering, School of Business Studies, University of the Aegean, 82100 Chios, Greece
7
School of Production Engineering and Management, Technical University of Crete, University Campus, Akrotiri, 73100 Chania, Greece
*
Author to whom correspondence should be addressed.
Sustainability 2020, 12(21), 9120; https://doi.org/10.3390/su12219120
Submission received: 16 September 2020 / Revised: 22 October 2020 / Accepted: 27 October 2020 / Published: 2 November 2020
(This article belongs to the Special Issue Applications, Integration and Trends of Renewable Energy Technologies)

Abstract

:
Renewable energy technologies like photovoltaics may be considered an indispensable component of a low-carbon electricity mix, but social acceptance should not be taken for granted. For instance, in Greece there are still claims, especially in rural areas, regarding the land use and the competition against more traditional economic activities such as grazing. An argument in favor of confining to roof-mounted photovoltaic installations is the additional infrastructure requirements for ground-mounted larger-scale photovoltaics. These requirements reduce and could potentially negate their environmental benefits. The aim of this study is to investigate the life cycle environmental impacts of commercial ground-mounted photovoltaic farms and compare them against residential roof-mounted photovoltaic installations. Data were gathered for a 500 kW ground-mounted photovoltaic installation and for five roof-mounted installations of 10 kW capacity, each from the same area at the prefecture of Pella in Northern Greece. An LCA (Life Cycle Assessment) was performed and results show that panel production is the main contributor for both types and that ground-mounted photovoltaics—when no transmission/distribution infrastructure is considered—have lower impacts than the roof-mounted residential photovoltaic installations for all impact categories except terrestrial ecotoxicity. However, when located further than 10.22 km from grid connection, ground-mounted photovoltaics have higher impacts for almost all environmental impact categories.

1. Introduction

Climate change, pollution, waste management and extreme meteorological phenomena comprise some of the most significant problems, and for this reason, in 2015, the 17 Goals for people, planet and prosperity are part of the 2030 Agenda for Sustainable Development [1]. Goal 7 aims to “Ensure access to affordable, reliable, sustainable and modern energy for all” which is connected to the substantial increase of the renewable energy share in the global energy mix by 2030 and Goal 12 which refers to “Ensure sustainable consumption and production patterns” and more specifically (12.a.1), to the “Installed renewable energy-generating capacity in developing countries (in watts per capita)”. It becomes obvious that the use of renewable energy is one of the main priorities of the United Nations and leads most of the countries to transform their energy mix, which has changed significantly [2] by reducing the shares of fossil fuels such as oil and coal, and increasing the shares of natural gas and renewable energy sources as they grow steadily. According to the IEA (International Energy Agency), the share of fossil fuels will decrease from 81% in 2011 to 76% in 2035, while the respective shares of renewable resources including biomass will grow from 11% to 18%. Especially in Europe [3,4], the total share of renewable energy resources in 2019 reached 35% of the total electricity mix and is significantly increased compared to the respective global shares thanks to the energy transition priorities of the European Union to move to a clean, affordable and reliable Energy System up to 2030. In particular, the total installed capacity of photovoltaics in the European Union in 2017 was 106,707 MW [5]. In this direction, the main targets set are to reduce greenhouse gas emissions at least 40% below 1990 levels, to increase the use of renewable resources so that they can provide at least 32% percent of European energy through the implementation of suitable strategies and projects, and through the use of new technologies and systems [6]. Especially, solar has increased its share from 1% in 2010 to 4% in 2019 [4]. From the end of 2019, the EU environmental policy based on the European Green Deal aims for zero net emissions of greenhouse gases by 2050 [7].
In Greece, the energy mix is traditionally heavily dependent on fossil fuels (84%) featuring in the 7th highest position among International Energy Agency members in 2016 [8] and, in particular, in oil and coal (lignite) that is produced in large quantities in Ptolemais, Amynteon, Florina and Megalopolis. The penetration of natural gas (although restricted to certain cities only) and the introduction of renewables have led to significant changes in the shares of the individual fuels. The share of energy generated from renewable sources has almost been doubled from 5.9% in 2006 to 12.5% in 2016 and in 2018 [9], the share of RES (Renewable Energy Sources) reached approximately 21.54% (2579 MW capacity) on the way to achieving the main national objective of the RES share in gross final energy consumption of 35% by 2030 [8]. According to the latest data, the renewables share was 37.57% in June 2020 [9]. The electricity system of Greece consists of the interconnected system of the main part of the country and of the non-interconnected system of several islands including Crete, where two interconnection processes are currently under implementation: a) interconnection of Crete with Attica (Project Ariadne) [10] and b) interconnection of Crete with Peloponnese [11]. According to these data, the overall installed power (nominal capacity) in Greece is currently about 27 GW, based on a mix of fossil fuels and renewables [12]. It is expected that during the period 2017–2027, the share of hydropower will increase slightly from 223 MW to 277 MW while the shares of photovoltaic and wind turbines are expected to rise significantly from 2444 MW to 4556 MW and from 2047 to 4330 MW respectively [13]. It must be clarified that in Greece, solar refers mainly to photovoltaics, and only recently, some concentrated solar [14] and pumped storage projects [15] are being implemented.
The installed photovoltaics in Greece have started to take off during the last two years after a six-year stagnation, and in 2019, 625 new facilities were installed adding 160 MW of capacity [16]. From the 2780 MWp of photovoltaics connected to the grid, on July 2020, 352 MWp were installed on rooftops (systems of capacity ≤10 KW) and the rest, 2428 MWp, were ground-mounted. Although the installed capacity of roof-mounted photovoltaics during the last two years has been practically constant, the capacity for ground-mounted photovoltaics has risen about 15% from 2121 to 2428 MW. That can be explained by the approximately 40% reduction in the price which, nevertheless, is still higher than the price consumers pay per KW, rendering photovoltaics a safe investment. The turn to higher capacity photovoltaic projects could be attributed to the incentivizing regulations, the photovoltaic panel cost reduction and the efficiency increases, thanks to new technological trends [17,18] and the novel mounting systems that increase the overall energy production. In parallel, EU- funded projects like the H2020 Project, “Energy Efficiency Project Development for South Attica” [19] which supports the installation of 3.2 MW Photovoltaics in 116 Municipal Buildings in Attica, and the “Net Metering Integration of Photovoltaic Plants for Self-Consumption under the Net Metering Concept”, which supports photovoltaic stations in public infrastructure based on the Net Metering scheme, provide incentives for smaller-scale projects as well.
Prioritizing larger-scale projects which are usually ground-mounted against smaller roof-mounted ones is not easy. Large-scale renewable energy projects, although they provide greater capacity, have received opposition—especially wind, but solar is not unaffected [20] and opposers’ considerations have been published in the local press. Solar is much better than wind in that respect, especially when they serve as wildlife sanctuaries [21], but still, people seem to prefer roof-mounted rather than ground-mounted ones, e.g., regarding the land use and the competition against more traditional economic activities, such as grazing. It is easy to assume that using photovoltaics mounted on existing buildings will require less supporting infrastructure and therefore, the impacts will be lower than the larger projects. However, in order to investigate this assumption, more reliable methods should be used such as a Life Cycle Assessment (LCA). Using LCA to assess photovoltaic systems for their environmental impacts, especially for their greenhouse gas emissions that have an impact on climate change, is widely applied.

Literature Review

In a review paper [22], 29 cases regarding CO2 emissions per kWh from a variety of different photovoltaic systems, including industrial and decentralized sites have been examined. Pacca (2007) points out that in every research paper there are different assumptions, which make the results almost impossible to compare, highlighting the need to use the same parameters and the same assumptions for both the centralized and the local photovoltaic stations. Some authors [23,24] attribute the major environmental effect on the photovoltaic panel fabrication and system construction regardless of where they are mounted (farms or roofs of existing buildings). Ren et al. [25] compared two cases of standalone and grid-connected systems and concluded that for standalone systems, economic and environmental benefits do not coincide, while for grid-connected systems, highest cost and environmental benefits are achieved for the same configuration. Special focus is given to local buildings’ cases [26,27,28,29] and to centralized/industrial cases [30,31], but not in direct comparison. However, the importance of the location of the photovoltaic installation has been acknowledged especially with regards to the extent that this influences their efficiency and consequently, affects the overall environmental impact. Many papers have been reviewed, which analyzed detailed cases of photovoltaics in specific regions of the world [32,33,34,35,36] and applied LCA on photovoltaics; for example, comparing the three generations of them [37], focusing on different photovoltaic technologies [38,39,40], and combining green roofs with photovoltaics [30,41]. However, an LCA comparing directly actual operating photovoltaics on the field in both ground-mounted photovoltaic farms under the same climate conditions have not been found. In the reports [42,43], Fthenakis et al. refer to the LCA of photovoltaics and focus on the energy payback time, the primary energy demand and the greenhouse gas emissions. Their contribution is fundamental because they investigated in detail the material and energy inputs and outputs based on actual measurements from photovoltaic production plants. Their work is also comprehensive because they did not restrict their study on one type of photovoltaic, but they included the life cycles of Si PVs (photovoltaics), viz., multi-Si, mono-Si highlighting differences in efficiencies and production methods. It seems that there is a need for a peer-reviewed publication that analyzes the environmental impacts of such two photovoltaic systems, and investigates which solution is less harmful for the environment especially regarding climate change.
For this reason, data for a 500 kW ground-mounted photovoltaic installation and for five roof-mounted installations of 10 kW capacity, each from the same area at the prefecture of Greece were gathered. Then, an LCA was performed and the results for 12 environmental impact categories including the impacts to climate change were compared. This paper continues with the Materials and Methods section describing how the LCA was performed, followed by the Results and Discussion sections which present the outputs of the LCA along with a sensitivity analysis. This analysis investigates under which circumstance the additional transmission/distribution requirements can render the ground-mounted photovoltaic farm impacts greater than the residential roof-mounted impacts.

2. Materials and Methods

The LCA methodology was followed, which according to the ISO14040 and ISO14044 [44,45] has four phases and “addresses the environmental aspects and potential environmental impacts throughout a product’s life cycle from raw material acquisition through production, use, end-of-life treatment, recycling and final disposal”. In the first phase, the goal and scope are defined and at the second phase, the necessary input/output data are specified, collected and compiled into the Life Cycle Inventory (LCI). Then, at the third phase, the Life Cycle Impact Assessment phase (LCIA), additional information is provided to help assess a product system’s LCI results for a better understanding of their environmental significance. At the final phase of life cycle interpretation, the results of an LCI or an LCIA, or both, are summarized and discussed as a basis for conclusions, recommendations, and decision-making. More specifically, Section 2.1 presents the systems under study and Section 2.2, Section 2.3 and Section 2.4 analyze the LCA phases in details.

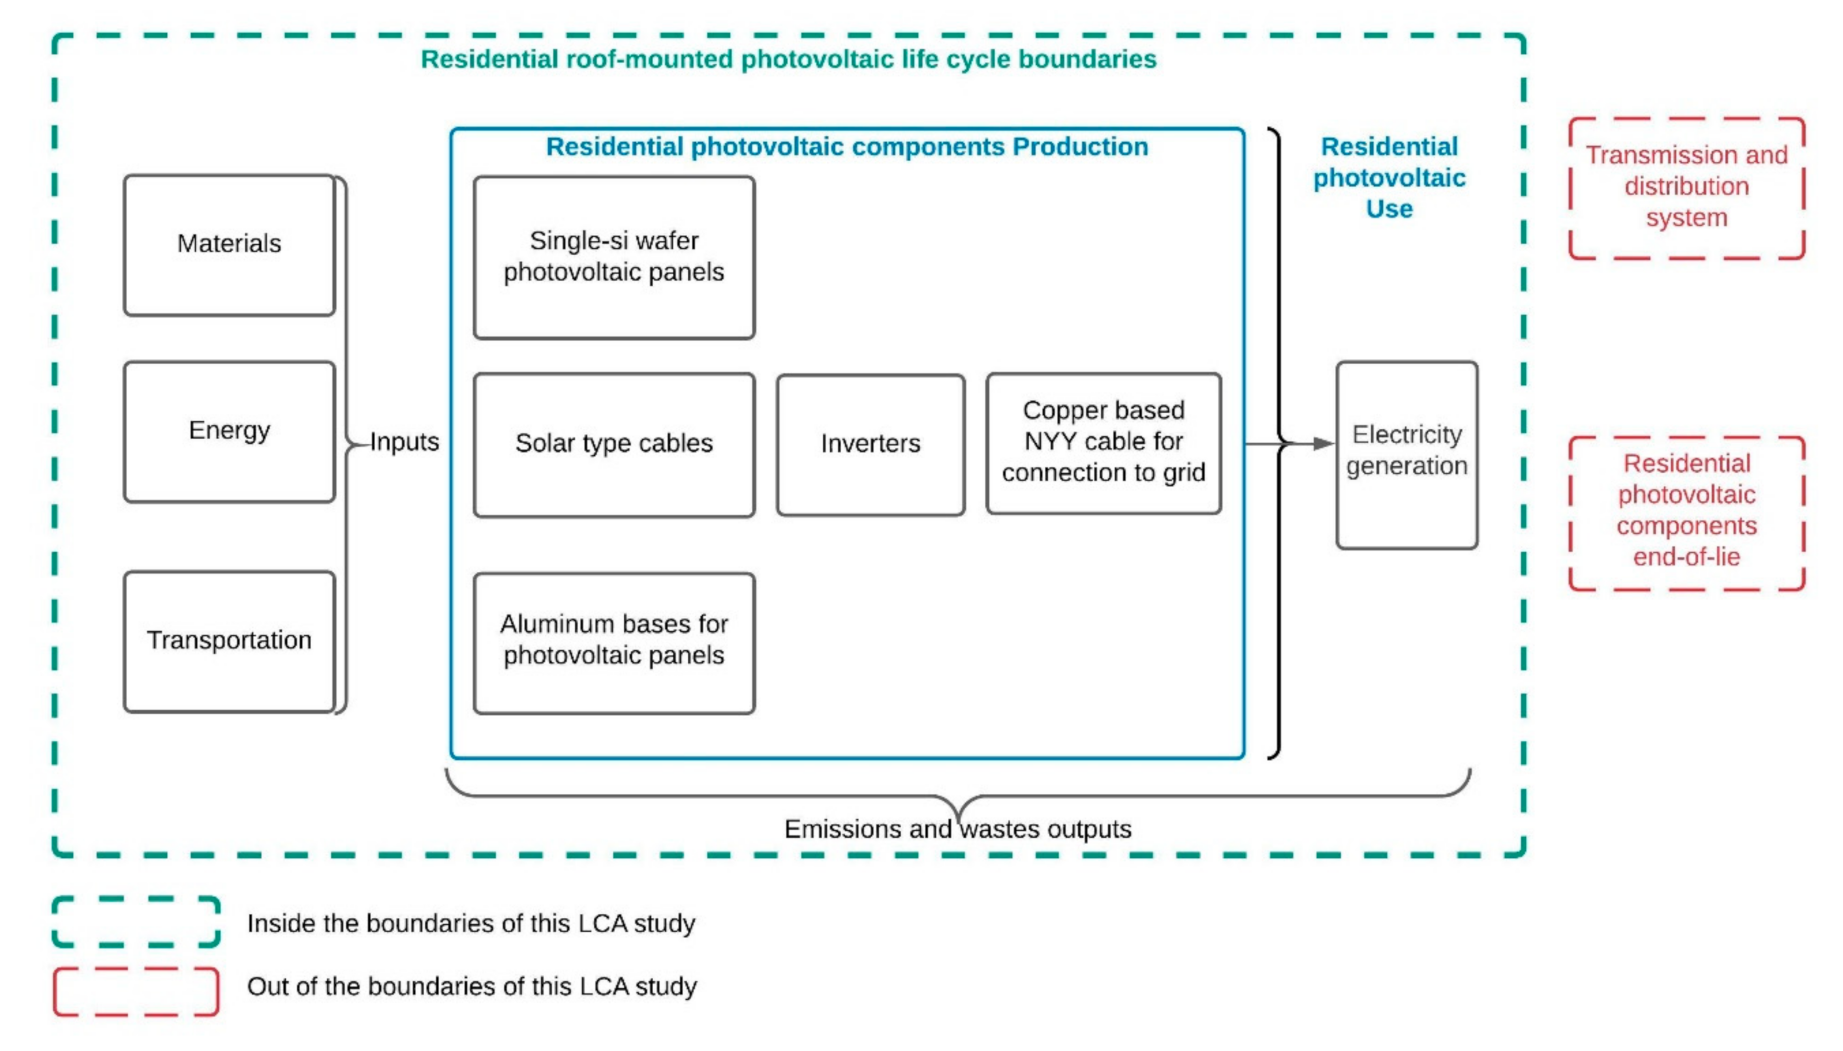
2.1. System Description

The two photovoltaic systems of the case study are both located in the Prefecture of Pella in Northern Greece and are shown in the photographs of Figure 1.
As shown in Figure 2, the 500 kW ground-mounted photovoltaic farm is in the area of Arnissa in the east and the five sets of 10 kW roof-mounted photovoltaics are in the town of Edessa and the villages of Vryta, Peraia and Platani at a maximum distance of 20 km. The proximity of these locations increases the comparability of the two systems in terms of the solar irradiance. The data used to estimate the systems performance comes from the same weather data source in Thessaloniki, Greece.
The 500 kW photovoltaic farm has a nominal power capacity of 499.95 kW and it was built on permanent ground bases using 1515 multi-crystalline photovoltaic panels of 330 W each. These panels are made by Eging PV [46] and they follow the ISO9001, IEC 61215, IEC 61730 standards. According to the NREL PV Watts® Calculator, this farm is estimated to generate 696,680 kWh/year. The roof-mounted 10 kW photovoltaic sets have a nominal capacity between 9.87 to 9.945 kW and they are installed on buildings utilizing 39–44 panels of 225–255 W each. These panels are made by Bosch Solar Energy AG and MAGE Solar AG [47,48] and they also follow the ISO9001, IEC 61215, IEC 61730 standards. According to the NREL PV Watts® Calculator, these roof-mounted photovoltaics are estimated to generate from 13,593 to 13,696 kWh/year. The electricity generation estimates are based on a 30°Array Tilt, south orientation, 14.08% system losses and 96% inverter efficiency.

2.2. LCA Goal and Scope

The goal of this LCA is to compare the potential environmental consequences from the two described photovoltaic systems, and the functional unit is set as the generation and provision of 1 kWh of electricity to the consumer. Within the ground-mounted photovoltaic farm model boundaries, the activities for the development of the photovoltaic farm were included such as the earth works and the components for the supporting infrastructure as well as the panels, the bases, the inverters, the cables and the parts for the transmission network. Within the residential roof-mounted photovoltaic systems boundaries, the panels, bases, cables and inverter were included and since they are installed on the existing building, which is connected to the grid, no building work and no transmission network is considered. In addition, because the two different types of photovoltaic systems are developed in the same area, it can be assumed that the impacts for the transportation of the components from areas out of the Prefecture area are not considered explicitly. As there are five different actual installation configurations for the roof-mounted photovoltaics, a range for the environmental impacts can be obtained, and for the comparison with the ground photovoltaic farm, their average values are used.

2.3. Life Cycle Inventory

The LCI has been based on the datasets available in the ecoinvent database version 3.5 [49] and the model was created based on the data collected for the specific cases investigated. The information about the specific cases is provided in the description of the cases (farm and residential) in Section 2.3.1 and is presented in the accompanying tables. For both photovoltaic systems, a lifetime of 30 years has been considered and the data from the NREL for the electricity generation and capacity factors were used. The end-of-life stage has not been considered as it is unknown whether the photovoltaic systems owners would like to extend their lifetime, re-power the system with more state-of-the-art technology, and how the disposed materials will be treated. More analytical details are provided in the separate subsections that follow.

2.3.1. Ground-Mounted Photovoltaic Farm

For the 500 kW ground-mounted photovoltaic farm, the materials and components required were estimated and scaled to match the generation of 1 kWh. The components required for the whole farm are shown in Figure 3 and, more specifically, these are: (i) 500 m of copper cable NYY 5 × 16 mm2, (ii) two 500 kW inverters because it has been considered that each inverter has a lifetime of 15 years, (iii) 3,409 kg of aluminum for the 1515 panel bases, which weigh 2.25 kg each, (iv) approximately 3860 m2 of multi-Si wafer photovoltaic panels and (v) the farm’s supporting infrastructure, which is analyzed separately. Moreover, the model can take into account the transmission and distribution medium voltage network, but it was only considered in the sensitivity analysis and made in the assumption that in the base case scenario, the farm is located very near to a grid connection point.
For the supporting infrastructure, the following components were considered based on the actual data provided by the project developer: (i) base for substation and shed, (ii) cable installation, (iii) earthmoving works, (iv) fencing for photovoltaic farm, (v) inverters and control unit (including installation), (vi) lighting and cameras for the security, (vii) substation installation, (viii) panel base installation, (ix) panel cable (including installation), (x) panel installation, (xi) road opening, (xii) telemetry. Due to the sensitive nature of these commercial data, they are not described in detail in the main text, but they can be asked from the authors. For the modeling of the above components, the ecoinvent (version 3.5) datasets have been utilized for the energy inputs (mainly diesel for the excavating and other earthwork machinery, gasoline for the concrete mixer) and the material inputs, which are shown in Table 1, excluding the ones that have a total mass less than 5 kg.
The cables have been modeled based on the type and share of materials given by the developer. To the authors’ best knowledge, this is the first LCA model for a ground-mounted photovoltaic farm in Greece and the data collection was as detailed as possible to ensure the results’ representativeness. During the 30 years of the use phase of the photovoltaics, approximately 400 kg of water are required for the cleaning of the panels and this is the only additional input for this phase which is in sync with the ecoinvent models for the generation of electricity from a ground-mounted photovoltaic farm.

2.3.2. Residential Roof-Mounted Photovoltaics

The residential roof-mounted photovoltaics are installed on existing buildings and their characteristics are shown in Table 2.
Each one of them was modeled in GaBi (version 9.2) [50] using ecoinvent dataset [49] according to the inputs shown in Table 2. The auxiliary water for cleaning and, more importantly, the infrastructure, modeled in the same way, followed for the ground-mounted photovoltaic farm but in this case, the photovoltaic panels are made of single-Si wafer. The components required for the whole farm are shown in Figure 4.

2.4. Life Cycle Impact Assessment

Using the GaBi software [50], the ecoinvent database [51] and CML 2001 impact assessment method [52], the impacts for the 500-kW ground-mounted photovoltaic farm and the five 10 kW residential roof-mounted photovoltaic systems were calculated. The CML 2001 LCIA method is one of the most widely used and it was chosen because many popular studies, which were found in the literature, used the same method. In addition, this method provides transparency by keeping the results for 11 life cycle environmental impact categories disaggregated without weighting. The 12 impact categories include Abiotic Depletion Potential—elements (ADP elements), Abiotic Depletion Potential—fossil (ADP fossil), Acidification Potential (AP), Eutrophication Potential (EP), Freshwater Aquatic Ecotoxicity Potential (FAETP), Global Warming Potential (GWP), Global Warming Potential, excluding biogenic carbon (GWPexcbio), Human Toxicity Potential (HTP), Marine Aquatic Ecotoxicity Potential (MAETP), Ozone Layer Depletion Potential (ODP), Photochemical Oxidant Creation Potential (POCP) and Terrestrial Ecotoxicity Potential (TETP).

3. Results

In this section, the life cycle environmental impacts for the two different types of installations are compared totally and following a per stage process.

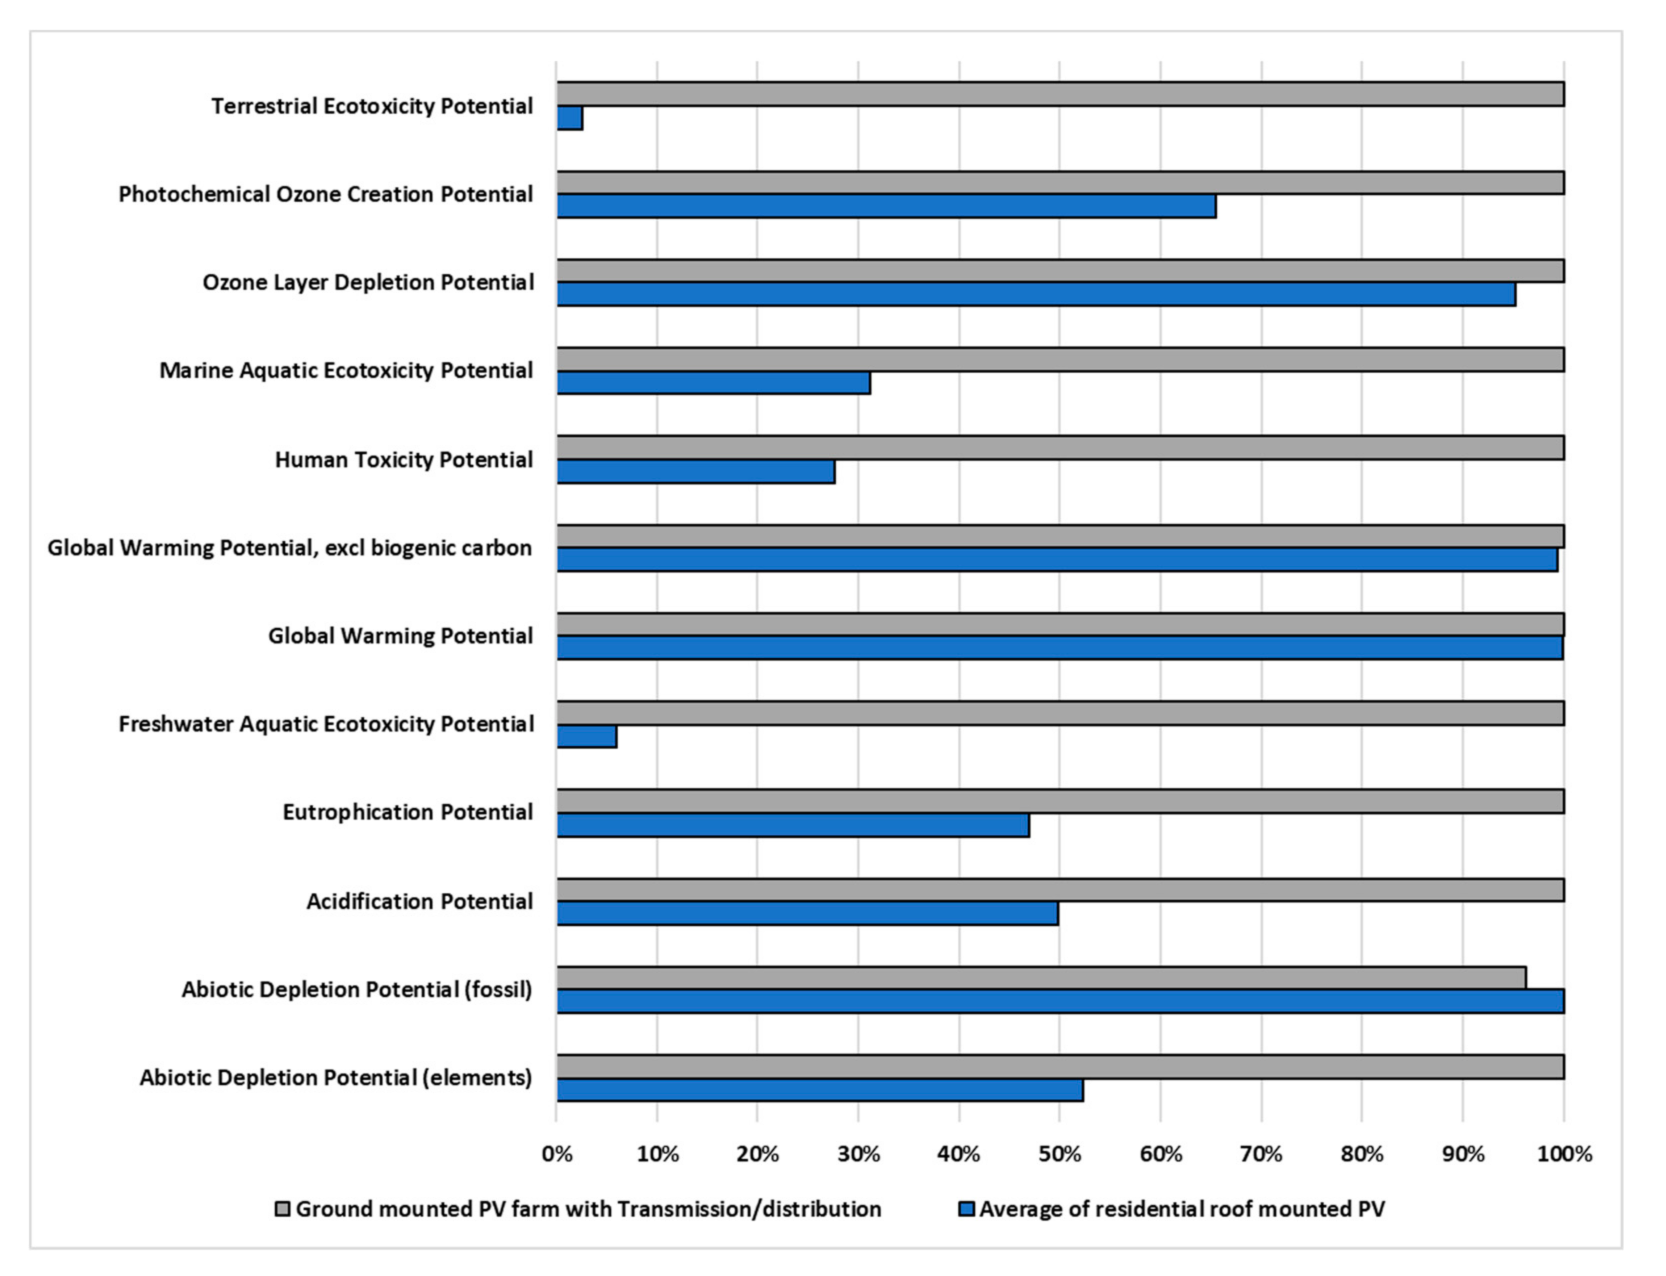
3.1. Life Cycle Environmental Impacts Comparison

The analytical results for all installations are given in Table 3. In these, the environmental impact categories, which are met in literature, are calculated for five installations. More information about the nature of the impacts is provided in the relevant literature [52].
As expected, the impact values for the five different roof-mounted photovoltaics are very similar, if not identical, and the minor deviations from the average which come up to 4.47% are due to the differences in the number and surface of the panels used, length of the cables, weight of the aluminum bases and generated electricity. As climate change is one of the main reasons for the proliferation of the photovoltaic farms, it is worth noting that the GWP for both types is low as expected for a renewable energy technology and is 42.7 g CO2-eq for the ground-mounted photovoltaic farm and 54.2–54.5 g CO2-eq for the roof-mounted photovoltaics. To aid the reader, the comparison of the impacts for the average values of the roof-mounted photovoltaics and the ground-mounted photovoltaic farm is illustrated in Figure 5.
It is shown that the roof-mounted residential photovoltaic have higher impacts than the ground-mounted photovoltaic farm, except in the case of the Terrestrial Ecotoxicity Potential (TETP), where the ground-mounted photovoltaic farm shows a 25.6% higher value than the average residential roof-mounted photovoltaic values. The highest difference in the values is the Abiotic Depletion Potential (ADP elements) (31.6%) and the Eutrophication Potential (31.1%). The lowest difference occurs for the Ozone Layer Depletion Potential (ODP) (6.8%) and the Photochemical Ozone Creation Potential (POCP) (19.4%). The rest of the impacts have a difference in the impacts that fall within the range of 28.5% (MAETP) to 21.4% (GWP). To further the investigation, the reasons for these differences and the analysis of the contribution of each stage to the impacts follows in the next subsection.

3.2. Life Cycle Impact Per Stage

The contribution of each stage to the overall impacts of the ground-mounted photovoltaic farm is shown in Figure 6.
It becomes evident that for all the environmental impact categories, the highest contribution can be attributed to the production of the photovoltaic panels except the TETP. The maximum contribution is for the ODP (91.10%) and the lowest for HTP (46.50%), and all the rest lie between 71.4% and 89.0%. The burdens for the TETP come mainly from the photovoltaic supporting infrastructure (51.50%) with the fencing being responsible for the majority (43.83%) and that could be explained by the use of 2.26 tons of steel and 22.4 m3 of concrete. The photovoltaic panels are the second highest contributor with 35.2%. The photovoltaic supporting infrastructure is the second highest contributor to all other environmental impacts ranging from 4.26% to 25.7%, apart from the EP, where the Inverters score (9.11%) is slightly higher than that (9.02%). The Inverters, otherwise, have the third higher scores ranging from 2.37% for ODP to 16% for HTP. Then, the Aluminum photovoltaic bases and the NYY Cables follow with contributions ranging from 0.62% for ADP elements and 6.02% MAETP, and 0.12% ODP and 7.03% HTP, respectively.
The contribution of each stage to the overall impacts of the residential roof-mounted photovoltaics is shown in Figure 7.
Similar to the case of the ground-mounted photovoltaic farm, the photovoltaic panels are the main contributor to all the impact categories, except one, but in this case, it is the HTP where they score the lowest and come second with 39.24%. The maximum contribution is for the ODP (90.8%) and all the rest lie between 53.52% and 89.00%. The Inverters come second in all categories, and their lowest score (6.09%) is for ODP and their highest (43.52%) is for HTP which is the only category for the highest contributor. Then, the Aluminum photovoltaic bases and the NYY Cables follow with contributions ranging from 0.6% for ADP elements and 6.11% MAETP, and 0.14% ODP and 6.93% HTP, respectively. The Solar cables score even lower with values ranging from 0.15% for ODP to 5.26% for HTP. Lastly, the Electricity for installation has negligible contribution which scores less than 0.01% in all categories.

3.3. Sensitivity Analysis

In this subsection, sensitivity analysis is performed where it is assumed that the ground-mounted photovoltaic farm is not near a point of connection to the grid and additional infrastructure for the transmission and distribution of the electricity is required at medium voltage. The ecoinvent dataset which describes the infrastructure (poles, cables, etc.) of the electricity transmission network and which includes the high-to-medium voltage switching stations was used. The matter of the distance is important because it is a point of concern that can be easily highlighted by potentially opposing stakeholders and it has an additional interest from an environmental point of view because the switching stations use SF6 which has been listed by the Intergovernmental Panel on Climate Change (IPCC) as a greenhouse gas with a global warming potential of 23,900 times greater than that of CO2 over a 100-year period [53].
The focus, initially, is the GWP, because avoiding the potential adverse climate change impact has been the impetus of this work. Therefore, the dataset was incorporated in the presented model and the distance where the GWP of the ground-mounted photovoltaic farm equalizes with the GWP for the residential roof-mounted photovoltaic was investigated. First, the difference between the GWP for the ground-mounted photovoltaic farm and the residential roof-mounted photovoltaic was calculated. This difference was divided by the GWP for 1 km of transmission network construction from medium voltage electricity from ecoinvent database (version 3.5) and the result is the unknown distance. This distance is approximately 10.22 km and when this value is used, the results shown in the comparison graph in Figure 8 are obtained.
As shown in the graph, at a distance of 10.22 km, the GWP for the average residential roof-mounted photovoltaics and for the ground-mounted photovoltaic farm become equal. In addition, at this distance, the ground-mounted photovoltaic farm shows the highest environmental impacts in all categories except the ADP. For the ADP, the residential photovoltaics score the highest (100%) and the ground-mounted photovoltaic farm follows with 96.23%. The scores are close for the ODP as well, where the value of the average residential roof-mounted photovoltaic is 95.18% of the score of the ground-mounted photovoltaic farm. For the rest of the environmental impacts, the average residential roof-mounted photovoltaic scores vary from 2.63% to 65.50%. Especially, for environmental impacts of AP, EP, FAETP, HTP, MAETP and TETP, the scores of the average residential roof-mounted photovoltaic scores are less than 50%. In all the cases, ground-mounted photovoltaics achieve the highest scores. The most significant differences concern the TETP, FAETP, MAETP and HTP impacts. In these four categories, the differences between the two types of photovoltaics vary between 69–94%. In four impacts, the differences are lower than 10%, while for the remaining, the differences vary between 35–54%.

4. Discussion

The aim of this study was to compare the life cycle environmental impacts between the ground-mounted photovoltaic farm and the five residential roof-mounted photovoltaics. The results show that in the base case scenario, where no transmission/distribution is required, the majority of the impacts per generated kWh are lower for the ground-mounted photovoltaic farm. Especially for GWP, the difference is approximately 21.5% and this highlights the importance of economies of scale and, potentially, the higher efficiency that ground-mounted photovoltaic farms can benefit from. If this efficiency is high enough, it can justify the additional requirements for the development of the supporting infrastructure. On the other hand, this does not mean that the supporting infrastructure should be underestimated, as it is the second highest contributor. So, concerns about their contribution to the environmental impacts could be valid, but this contribution should not be translated into a negation of the benefits achieved. However, based on the results from the investigation, in cases where the distance between the ground-mounted photovoltaic farm and the grid connection point is more than 10.22 km, the previous argument could be overturned. In this specific case, the GWP is equalized and this renders the farm solution a worse option for many categories. This finding highlights the need for careful siting and well-designed ground-mounted photovoltaic farms, so that they are close to the grid and their remoteness should not negate the benefits. As far as the bases, electricity for installation, and solar cables are concerned, they have very low scores and they could be incorporated into the whole supporting infrastructure in future studies. The common and most important contributor to the impacts—overall—has been the photovoltaic panels, so any attempts to lower their environmental impacts further should affect significantly the whole LCA. Future versions of the model could include more stages of the life cycle such as the end-of-life, a better estimation of the photovoltaic panels’ efficiency (possibly based on historic electricity generation data) and an expanded study, where more sites, especially from other regions, could be included. On that point, it is important to note that the above results cannot be generalized, as photovoltaic electricity generation may vary across regions and countries.

5. Conclusions

This study can help the readers understand the parameters affecting the life cycle environmental impacts of two different ways of generating electricity using photovoltaics. The results have shown that in both ways, the highest contribution to the environmental burden can be attributed to the production of the photovoltaic panels. The comparison between the ground-mounted photovoltaic farm and the five residential roof-mounted photovoltaics show that the farm has lower impacts per kWh for the majority of the categories examined, under the specific circumstances. However, the sensitivity analysis has shown that when the distance between the ground-mounted photovoltaic farm and the grid connection point is more than 10.22 km, the GWP becomes equal and the farm scores become worse for many categories. It could be then recommended that if a ground-mounted photovoltaic farm is closer than approximately 10 km to a grid connection point, then they should be preferred because that could help to tackle climate change more. However, other criteria that are not covered by an LCA should also be considered too, such as the potential ecosystem disruption and other socioeconomic, health and safety issues.
Although the current LCA study was based on actual and representative data collected on the site and estimations using the developers’ expertise, there are certain limitations in our analysis. These limitations are mainly associated with the actual electricity generation because the project is new and there are not available data for the whole year, something that might introduce uncertainties to the results. All energy generation-based calculations are estimates based on realistic assumptions, and the results of detailed calculations could be updated after the full accounting year in future studies. Future studies could reveal variations compared to the expected actual generation where parameters like the shading due to the distance between the panels or outage due to maintenance or accidents or even solar irradiation due to the weather changes could have an effect. This effect can be direct because of the actual generated electricity which can change the amount of the photovoltaic installation, which is required to deliver the 1 kWh, as that is the functional unit used in the current analysis. However, the modeling can be easily updated by taking into account the described above parameters and even more possible factors, so that the new, more accurate results can be used to facilitate a future comparison.

Author Contributions

Conceptualization, V.K., A.K., A.P., G.T. and G.A.; methodology, V.K. and A.P.; validation, V.K., A.P. and G.T.; formal analysis, V.K., A.P. and G.T.; investigation, V.K., A.K., A.P., G.T. and G.A.; resources, V.K., A.K., A.P., G.A. and G.T.; data curation, V.K., A.P. and G.T.; writing—original draft preparation, V.K., A.K., A.P. and G.T.; writing—review and editing, V.K., A.K., A.P., G.T. and G.A.; visualization, V.K. and G.T.; supervision, V.K., G.T. and G.A.; project administration, V.K., A.P. and G.T. All authors have read and agreed to the published version of the manuscript.

Funding

This research received no external funding.

Conflicts of Interest

The authors declare no conflict of interest except A.P. who worked for the developer of the photovoltaic projects of this paper and who provided the actual on-site data for them.

References

  1. Assembly, U.G. Global Indicator Framework for the Sustainable Development Goals and Targets of the 2030 Agenda for Sustainable Development; United Nations Statistics Division: New York, NY, USA, 2017. [Google Scholar]
  2. Global energy mix from 1990 to 2035—F Énergies.pdf. Available online: https://www.planete-energies.com/en/medias/infographics/global-energy-mix-1990-2035 (accessed on 15 September 2020).
  3. Renewables Provided Record 35% of EU Power in 2019 as Coal Collapsed-Report—Recharge.pdf. Available online: https://www.rechargenews.com/transition/renewables-provided-record-35-of-eu-power-in-2019-as-coal-collapsed-report/2-1-750790 (accessed on 15 June 2020).
  4. Agora Energiewende and Sandbag. The European Power Sector in 2019: Up-to-Date Analysis on the Electricity Transition. Available online: https://www.agora-energiewende.de/fileadmin2/Projekte/2019/Jahresauswertung_EU_2019/172_A-EW_EU-Annual-Report-2019_Web.pdf (accessed on 12 September 2020).
  5. EurObserv’ER Consortium. The State of Renewable Energies in Europe. 2018. Available online: https://www.isi.fraunhofer.de/content/dam/isi/dokumente/ccx/2019/The_State_of_RES_in_Europe-2018-GB.pdf (accessed on 12 September 2020).
  6. Agora Energiewende. European Energy Transition 2030: The Big Picture. Ten Priorities for the next European Commission to meet the EU’s 2030 targets and accelerate towards 2050. 2019. Available online: https://www.agora-energiewende.de/fileadmin2/Projekte/2019/EU_Big_Picture/153_EU-Big-Pic_WEB.pdf (accessed on 12 September 2020).
  7. European Commission. The European Green Deal. Communication from the Commission to the European Parliament, the European Council, the European Economic and Social Committee of the Regions. 2019. Available online: https://eur-lex.europa.eu/resource.html?uri=cellar:b828d165-1c22-11ea-8c1f-01aa75ed71a1.0002.02/DOC_1&format=PDF (accessed on 12 September 2020).
  8. International Energy Agency Electricity Information. Available online: https://webstore.iea.org/electricity-information-2018 (accessed on 26 November 2018).
  9. Statista Installed Power Capacity Shares by Source Greece. 2020. Available online: https://www.statista.com/statistics/1153677/installed-power-capacity-share-by-source-greece/ (accessed on 12 September 2020).
  10. ADMIE IPTO Ariadne-Interconnection. Available online: http://www.ariadne-interconnection.gr/en/home-en/ (accessed on 15 September 2020).
  11. ADMIE IPTO Interconnection of Crete with the Peloponnese. Available online: https://www.admie.gr/en/erga/erga-diasyndeseis/diasyndesi-tis-kritis-me-tin-peloponniso (accessed on 15 September 2020).
  12. Boulaxis, N.G.; Manolkidis, S.; Latta, M.; Karakatsani, N.; Anagnostopoulos, I.; Gotsias, A.; Zervos, T. Regulation and Performance of the Electricity Market and the Natural Gas Market in Greece, in 2018. 2019. Available online: http://www.rae.gr/site/file/system/docs/ActionReports/national_2019 (accessed on 12 September 2020).
  13. Apostolou, I. Renewable Energy Sources in Greece: Energy Trends and Predictions; University of Pireaus: Pireaus, Greece, 2018. [Google Scholar]
  14. Greece MINOS 50 MW Tower Concentrated Solar Power Project EPC Contract Awarded. Available online: http://helioscsp.com/greece-minos-50mw-tower-concentrated-solar-power-project-epc-contract-awarded/ (accessed on 15 September 2020).
  15. European Commission Hydro Pump Storage in Greece—Amfilochia. Available online: https://ec.europa.eu/eipp/desktop/en/projects/project-32.html (accessed on 15 September 2020).
  16. Hellenic Association of Photovoltaic Companies. Photovoltaic statistics for Greece. 2020. Available online: https://energypress.gr/sites/default/files/media/pv-stats_greece_2019_31mar2020 (accessed on 12 September 2020).
  17. Voudoukis, N.F. Photovoltaic Technology and Innovative Solar Cells. Eur. J. Electr. Eng. Comput. Sci. 2018, 2. [Google Scholar] [CrossRef] [Green Version]
  18. International Renewable Energy Agency. Future of Solar Photovoltaic: Deployment, Investment, Technology, Grid Integration and Socio-Economic Aspects (A Global Energy Transformation: Paper); International Renewable Energy Agency: Abu Dhabi, UAE, 2019. [Google Scholar]
  19. European Commission H2020 Project “Energy Efficiency Project Development for South Attica. Available online: https://cordis.europa.eu/project/id/754171 (accessed on 15 September 2020).
  20. Kaldellis, J.K.; Kapsali, M.; Kaldelli, E.; Katsanou, E. Comparing recent views of public attitude on wind energy, photovoltaic and small hydro applications. Renew. Energy 2013, 52, 197–208. [Google Scholar] [CrossRef]
  21. Newspost. Photovoltaic Parks as Wildlife Shelters. Available online: https://newpost.gr/enviroment/5c1257d456dccb7e13df7d05/fwtobolta-ka-parka-ws-katafygia-ths-agrias-zwhs (accessed on 15 September 2020).
  22. Pacca, S.; Sivaraman, D.; Keoleian, G.A. Parameters affecting the life cycle performance of PV technologies and systems. Energy Policy 2007, 35, 3316–3326. [Google Scholar] [CrossRef]
  23. Asdrubali, F.; Baldinelli, G.; D’Alessandro, F.; Scrucca, F. Life cycle assessment of electricity production from renewable energies: Review and results harmonization. Renew. Sustain. Energy Rev. 2015, 42, 1113–1122. [Google Scholar] [CrossRef]
  24. Fouad, M.M.; ElSayed, A.G.; Shihata, L.A.; Kandil, H.A.; Morgan, E.I. Life cycle assessment for photovoltaic integrated shading system with different end of life phases. Int. J. Sustain. Energy 2019, 38, 821–830. [Google Scholar] [CrossRef]
  25. Ren, M.; Mitchell, C.R.; Mo, W. Dynamic life cycle economic and environmental assessment of residential solar photovoltaic systems. Sci. Total Environ. 2020, 722, 137932. [Google Scholar] [CrossRef]
  26. Bazán, J.; Rieradevall, J.; Gabarrell, X.; Vázquez-Rowe, I. Low-carbon electricity production through the implementation of photovoltaic panels in rooftops in urban environments: A case study for three cities in Peru. Sci. Total Environ. 2018, 622–623, 1448–1462. [Google Scholar] [CrossRef]
  27. Corcelli, F.; Fiorentino, G.; Petit-Boix, A.; Rieradevall, J.; Gabarrell, X. Transforming rooftops into productive urban spaces in the Mediterranean. An LCA comparison of agri-urban production and photovoltaic energy generation. Resour. Conserv. Recycl. 2019, 144, 321–336. [Google Scholar] [CrossRef] [Green Version]
  28. Martinopoulos, G. Are rooftop photovoltaic systems a sustainable solution for Europe? A life cycle impact assessment and cost analysis. Appl. Energy 2020, 257, 114035. [Google Scholar] [CrossRef]
  29. Souliotis, M.; Arnaoutakis, N.; Panaras, G.; Kavga, A.; Papaefthimiou, S. Experimental study and Life Cycle Assessment (LCA) of Hybrid Photovoltaic/Thermal (PV/T) solar systems for domestic applications. Renew. Energy 2018, 126, 708–723. [Google Scholar] [CrossRef]
  30. Bany Mousa, O.; Kara, S.; Taylor, R.A. Comparative energy and greenhouse gas assessment of industrial rooftop-integrated PV and solar thermal collectors. Appl. Energy 2019, 241, 113–123. [Google Scholar] [CrossRef]
  31. Wu, P.; Ma, X.; Ji, J.; Ma, Y. Review on Life Cycle Assessment of Energy Payback of Solar Photovoltaic Systems and a Case Study. Energy Procedia 2017, 105, 68–74. [Google Scholar] [CrossRef]
  32. Eskew, J.; Ratledge, M.; Wallace, M.; Gheewala, S.H.; Rakkwamsuk, P. An environmental Life Cycle Assessment of rooftop solar in Bangkok, Thailand. Renew. Energy 2018, 123, 781–792. [Google Scholar] [CrossRef]
  33. Fu, Y.; Liu, X.; Yuan, Z. Life-cycle assessment of multi-crystalline photovoltaic (PV) systems in China. J. Clean. Prod. 2015, 86, 180–190. [Google Scholar] [CrossRef]
  34. Nordin, A.H.M.; Sulaiman, S.I.; Shaari, S.; Mustapa, R.F. Life-cycle assessment of residential-scale grid-connected photovoltaic system in Malaysia based on monocrystalline silicon modules. Int. J. Power Electron. Drive Syst. IJPEDS 2020, 11, 677. [Google Scholar] [CrossRef]
  35. Rahman, M.M.; Alam, C.S.; Ahsan, T.M. A life cycle assessment model for quantification of environmental footprints of a 3.6 kWp photovoltaic system in Bangladesh. Int. J. Renew. Energy Dev. 2019, 8, 113. [Google Scholar] [CrossRef]
  36. Sumper, A.; Robledo-García, M.; Villafáfila-Robles, R.; Bergas-Jané, J.; Andrés-Peiró, J. Life-cycle assessment of a photovoltaic system in Catalonia (Spain). Renew. Sustain. Energy Rev. 2011, 15, 3888–3896. [Google Scholar] [CrossRef]
  37. Muteri, V.; Cellura, M.; Curto, D.; Franzitta, V.; Longo, S.; Mistretta, M.; Parisi, M.L. Review on Life Cycle Assessment of Solar Photovoltaic Panels. Energies 2020, 13, 252. [Google Scholar] [CrossRef] [Green Version]
  38. Blanco, C.F.; Cucurachi, S.; Guinée, J.B.; Vijver, M.G.; Peijnenburg, W.J.G.M.; Trattnig, R.; Heijungs, R. Assessing the sustainability of emerging technologies: A probabilistic LCA method applied to advanced photovoltaics. J. Clean. Prod. 2020, 259, 120968. [Google Scholar] [CrossRef]
  39. Celik, I.; Song, Z.; Cimaroli, A.J.; Yan, Y.; Heben, M.J.; Apul, D. Life Cycle Assessment (LCA) of perovskite PV cells projected from lab to fab. Sol. Energy Mater. Sol. Cells 2016, 156, 157–169. [Google Scholar] [CrossRef] [Green Version]
  40. Kim, J.; Rivera, J.L.; Meng, T.Y.; Laratte, B.; Chen, S. Review of life cycle assessment of nanomaterials in photovoltaics. Sol. Energy 2016, 133, 249–258. [Google Scholar] [CrossRef]
  41. Shafique, M.; Luo, X.; Zuo, J. Photovoltaic-green roofs: A review of benefits, limitations, and trends. Sol. Energy 2020, 202, 485–497. [Google Scholar] [CrossRef]
  42. Fthenakis, V.; Kim, H.C.; Frischknecht, R.; Raguei, M.; Sinha, P.; Stucki, M. Life Cycle Inventories and Life Cycle Assessments of Photovoltaic Systems; International Energy Agency (IEA): Paris, France, 2011. [Google Scholar]
  43. Fthenakis, V.; Frischknecht, R.; Raguei, M.; Kim, H.C.; Alsema, E.; Held, M.; de Wild-Scholten, M. Methodology Guidelines on Life Cycle Assessment of Photovoltaic Electricity; International Energy Agency (IEA): Paris, France, 2011. [Google Scholar]
  44. International Standard Organization. ISO 14040:2006—Environmental Management—Life Cycle Assessment—Principles and Framework; International Standard Organization: Geneva, Switzerland, 2006. [Google Scholar]
  45. International Standard Organization. ISO 14044: 2006—Environmental Management—Life Cycle Assessment—Requirements and Guidelines; International Standard Organization: Geneva, Switzerland, 2006. [Google Scholar]
  46. EGING PV EG-P72 325-345 Polycrystalline 72-Cell Module Specification Datasheet 2018. Available online: https://www.enfsolar.com/pv/panel-datasheet/crystalline/34145 (accessed on 12 September 2020).
  47. Bosch Solar Energy AG Bosch Solar Module M60 c-Si Technical Datasheet 2012. Available online: https://pdf.directindustry.com/pdf/bosch-solar-energy-ag/c-si-m-60-eu42117-i-eu42123-245-260wp/54351-916972.html (accessed on 12 September 2020).
  48. MAGE SOLAR AG Photovoltaic Modules MAGE POWERTEC PLUS 245-255/5MR Technical Datasheet 2011. Available online: http://dopplergreenenergy.gr/tmp/MAGE_POWERTEC_PLUS_245-255_5_MR_EN.pdf (accessed on 12 September 2020).
  49. Wernet, G.; Bauer, C.; Steubing, B.; Reinhard, J.; Moreno-Ruiz, E.; Weidema, B. The ecoinvent database version 3 (part I): Overview and methodology. Int. J. Life Cycle Assess. 2016, 21, 1218–1230. [Google Scholar] [CrossRef]
  50. Thinkstep, A.G. GaBi Software; Baden-Württemberg, Germany; Available online: http://www.gabi-software.com/ (accessed on 12 September 2020).
  51. Frischknecht, R.; Jungbluth, N.; Althaus, H.-J.; Doka, G.; Dones, R.; Heck, T.; Hellweg, S.; Hischier, R.; Nemecek, T.; Rebitzer, G.; et al. The ecoinvent Database: Overview and Methodological Framework (7 pp). Int. J. Life Cycle Assess. 2005, 10, 3–9. [Google Scholar] [CrossRef]
  52. CML-IA Characterisation Factors. Available online: https://www.universiteitleiden.nl/en/research/research-output/science/cml-ia-characterisation-factors (accessed on 4 March 2019).
  53. Ozin, G. SF6 Worries—The Most Potent and Persistent Greenhouse Gas. Available online: https://www.advancedsciencenews.com/sf6-worries-the-most-potent-and-persistent-greenhouse-gas/#:~:text=%20Today%2C%20SF6%20has%20been,not%20absorbed%20or%20destroyed%20naturally (accessed on 15 September 2020).
Figure 1. (a) Arnissa ground-mounted photovoltaic farm; (b) One of the five roof-mounted installations of 10 kW capacity.
Sustainability 12 09120 g001
Figure 2. Map with the ground-mounted and roof-mounted photovoltaic systems locations. (Source: Google Maps).
Sustainability 12 09120 g002
Figure 3. Arnissa 500 kWp ground-mounted photovoltaic farm components.
Sustainability 12 09120 g003
Figure 4. Roof-mounted photovoltaic system life cycle boundaries.
Sustainability 12 09120 g004
Figure 5. Life Cycle Assessment Impact results for the comparison between ground-mounted and roof-mounted photovoltaics.
Sustainability 12 09120 g005
Figure 6. Contribution of the ground-mounted photovoltaic farm component per life cycle environmental impact category.
Sustainability 12 09120 g006
Figure 7. Contribution of the average roof-mounted photovoltaic component per impact category.
Sustainability 12 09120 g007
Figure 8. Life cycle environmental impact results for the comparison between ground-mounted including transmission/distribution and roof-mounted photovoltaics.
Sustainability 12 09120 g008
Table 1. Commercial ground-mounted photovoltaic farm supporting infrastructure LCI.
Material/ProcessQuantityUnit
Machine operation, diesel127hours
Sand120,600kg
Lorry transportation2213ton-km
Energy1869MJ
Steel139tons
Concrete30cubic meters
Reinforcing iron480kg
Polyurethane361kg
Polyvinylchloride508kg
Rubber166kg
Copper525kg
Electrical/electronic equipment50kg
Router1pieces
Data cable120m
High density polyethylene9kg
Cement tiles1440kg
Aluminum1645kg
Polyethylene100kg
Table 2. Residential roof-mounted photovoltaic system components LCI.
Photovoltaic SystemLocationPhotovoltaic System Capacity (kW)Panel Nominal Capacity (w)Number of PanelsSingle-Si Wafer Panel Area (m2)Inverter Capacity (kW)Solar Cable (m)Aluminum Panel Bases (kg)Cables AC NYY 5 × 16 (m)
Roof PV 1Platani9.8702354272.71101309510
Roof PV 2Edessa9.8702354272.71101469520
Roof PV 3Peraia9.9452553973.26101208815
Roof PV 4Vryta9.9002254472.93101209910
Roof PV 5Edessa9.8702354272.71101409510
Table 3. LCA results for commercial ground-mounted and residential roof-mounted photovoltaics.
Environmental Impact CategoriesArnissa PV FarmRoof PV 1Roof PV 2Roof PV 3Roof PV 4Roof PV 5
Abiotic Depletion (ADP elements) [kg Sb eq.]1.31 × 10−61.91 × 10−61.95 × 10−61.91 × 10−61.90 × 10−61.91 × 10−6
Abiotic Depletion (ADP fossil) [MJ]5.80 × 10−17.44 × 10−17.46 × 10−17.42 × 10−17.44 × 10−17.44 × 10−1
Acidification Potential (AP) [kg S O2 eq.]2.44 × 10−43.26 × 10−43.34 × 10−43.27 × 10−43.25 × 10−43.26 × 10−4
Eutrophication Potential (EP) [kg Phosphate eq.]1.37 × 10−41.97 × 10−42.03 × 10−41.99 × 10−41.97 × 10−41.98 × 10−4
Freshwater Aquatic Ecotoxicity Pot. (FAETP inf.) [kg DCB eq.]4.21 × 10−25.37 × 10−25.52 × 10−25.38 × 10−25.36 × 10−25.38 × 10−2
Global Warming Potential (GWP 100 years) [kg C O2 eq.]4.27 × 10−25.43 × 10−25.45 × 10−25.42 × 10−25.43 × 10−25.43 × 10−2
Global Warming Potential (GWP 100 years), excl. biogenic carbon [kg C O2 eq.]4.27 × 10−25.44 × 10−25.45 × 10−25.42 × 10−25.44 × 10−25.44 × 10−2
Human Toxicity Potential (HTP inf.) [kg DCB eq.]7.22 × 10−29.53 × 10−21.01 × 10−19.66 × 10−29.48 × 10−29.57 × 10−2
Marine Aquatic Ecotoxicity Pot. (MAETP inf.) [kg DCB eq.]1.05 × 10+21.46 × 10+21.50 × 10+21.46 × 10+21.46 × 10+21.46 × 10+2
Ozone Layer Depletion Potential (ODP, steady state) [kg R11 eq.]5.02 × 10−95.39 × 10−95.39 × 10−95.37 × 10−95.39 × 10−95.39 × 10−9
Photochem. Ozone Creation Potential (POCP) [kg Ethene eq.]2.29 × 10−52.83 × 10−52.88 × 10−52.83 × 10−52.83 × 10−52.84 × 10−5
Terrestric Ecotoxicity Potential (TETP inf.) [kg DCB eq.]6.76 × 10−44.98 × 10−45.18 × 10−45.03 × 10−44.96 × 10−45.00 × 10−4
Publisher’s Note: MDPI stays neutral with regard to jurisdictional claims in published maps and institutional affiliations.

