Abstract
The study investigates a predictive exchange rate effect on value-added trade flows on global value chains. We theoretically review the role of exchange rates on international trade based on insular, open, and global value chained economies. This paper empirically confirms a retro forecasting rule of the exchange rate on exports and trade balance using the value-added data for the period from 1995 to 2015. The first result is that real effective exchange rates have predictive elasticity information for the value-added trade flows. The second is that exchange rates have two practical effects on trade flows. The value-added exchange rate hurts the value-added trade balance due to increased intermediate trades, but the exchange rate has a positive effect on the gross trade balance. We would expect that value-added exports with trade balance can be improved in all sample countries when the value-added exchange rate is increasing. The main contribution is further evidence on distinguishing the currency depreciation on the value-added trade from the depreciation on the gross trade to achieve higher growth.
1. Introduction
Recent advances in international trade statistics show where value-added is created along global value chains (GVCs). GVCs trade represents around 70% of all global trade. By this fact, we must consider trade flows in value-added to avoid a double-counting problem in gross trade flows raised from increased intermediate goods trades. In the sense of value-added perspectives, also we can distinguish the value-added real effective exchange rate (VAREER) and discuss the role of VAREER on value-added trade flows, which will contribute to sustainable world free trade.
The purpose of this study is to investigate the predictive effects of VAREER on value-added trade flows and then suggest a forecasting rule to anticipate a value-added trade surplus or deficit for boosts in exports or the improvement of the trade balance. We review three broad approaches to help systemize our study. The traditional approach assures a positive effect of exchange rate changes on gross trade balance, where Ricardo and Heckscher-Ohlin assumed the endogenous exchange rate to trade balance. The elasticity approach illustrates that trade balance is adjusted on the demand price elasticities for exports and imports in the case of domestic depreciation impact on trade balance with Marshall-Lerner condition and the J-curve effect. Also, the absorption approach shows that trade balance will improve if domestic output growth exceeds absorption in response to domestic depreciation, assuming that trade balance is a function of real income and absorption, which is endogenous to the exchange rate.
The monetary approach such as Johnson [1] and Frenkel [2] finds that domestic depreciation can improve the balance of payment by its effect on real money supply, with increasing domestic prices of tradable goods and reducing real money supply where the exchange rate is endogenous to the real money supply. On the contrary, there are some studies about little effect of the exchange rate on trade balance. The asset market approach of McKinnon [3] assumes that the exchange rate is endogenous to monetary policies, such as monetary easing, stabilization programs, and intervention announcements. It assures that domestic depreciation cannot efficiently adjust trade balance in an open economy, but the exchange rate can play a useful role in an insular economy where the exchange rate and monetary policy are separable.
In the recent GVCs approach, Ahmed et al. [4] find that GVC participation reduces the exchange rate’s elasticity of manufacturing exports. Ollivaud et al. [5] find that in the Organization for Economic Cooperation and Development countries, firms’ increasing participation in GVCs reduces the exchange rate pass-through to the terms of trade, which may contribute to reducing the response of trade balances to exchange rate changes. Still, large currency depreciation may be required for an amicable settlement of trade imbalance, according to the International Monetary Fund [6]. Exchange rates are not disconnected from both trade flows and significant impacts on the trade balance.
Moreover, the value-added trade statistics are introduced by the decomposition of value-added accounting identities of Hummels et al. [7] and Koopman et al. [8]. Gross exports consist of GVCs-produced exports and non-GVCs-produced exports. GVCs exports are simply divided into domestic value-added content and foreign value-added content on the supply chain. Non-GVCs exports comprise domestic value-added content on the demand side. Similarly, gross imports consist of GVCs imports and non-GVCs imports. And the IMF [6] remarks that, as the foreign value-added portion (measured by the foreign value-added of exports plus the domestic value-added of imports) declines corresponding to a larger domestic value-added contribution, the spillover size from a depreciation rises, and vice versa.
Also, there are value-added statistics for exchange rates. The real effective exchange rate (REER) is a demand-based indicator of competitiveness, defined as a change in demand for a country’s output induced by international relative price changes. Bahmani-Oskooee [9] find that REER has had a long-run equilibrium relationship with the trade balance. Patel et al. [10] show that REER is not enough to reflect GVCs. Bems and Johnson [11,12] develop the VAREER pertaining to GVCs by applying the conventional REER into the simultaneous supply and demand side approach, where the extended framework incorporated three key features: value-added trade flow weights, GDP deflator price indices, and country-specific trade elasticities. As the IMF [6] remarks, if production to price changes are less responsive than final demand, countries with more participating in GVCs, and more trading in intermediate inputs, will represent lower aggregate trade elasticities than countries with more trading in final consumption, and vice versa.
Particularly, the effect of value-added exchange rates on value-added trade flows may be significantly different from the exchange rate effect on gross trade flows because some imports are inputs into the production of exports and some imports are complements in domestic value-added production. In this matter, Choi et al. [13] find that domestic depreciation from the value-added exchange rate has a positive effect on value-added exports but a negative effect on gross exports because of huge intermediate goods trade and double-counting problem.
With this study, our objective is an investigation of some further evidence on the forecasting rules of value-added exchange rates on the value-added trade flows using new retroactive procedures. If the trade balance is predicted to be an increasing function of the exchange rate, agents can justify a feasible trade balance by using a predictive exchange rate. A predictive exchange rate appreciation causes a real appreciation to raise the import price relative to the export price, which decreases imports and increases exports, and then improves the trade balance. However, the predictive effect of exchange rate changes on trade flows may be more complex and empirically questionable. Therefore, we illustrate whether the value-added trade balance is to be predicted as an increasing function of the VAREER.
The rest of the paper is organized as follows: In the next section, the exchange rate forecasting model on trade flows is discussed based on the value-added framework. Section 3 reports the empirical testing results. The results answer the objectives of this research. Section 4 concludes the paper with policy implications.
2. Materials and Methods
In this section, we review four sequential topics to explain the forecasting rule of VAREER on the value-added trade balance and present its empirical model. The forecast is an expectation of what is likely to happen, and the projection is what one hopes will happen.
The first topic is the balance-of-payment theory of the exchange rate. The fundamental balance of payment identity from national income identities is CA = S − I, where CA represents current account, S represents national savings, and I represent a domestic investment. A country whose investments exceed savings tends to run a current account deficit. Also, the current account deficit reflects the fiscal deficit, which is often financed by monetary expansion, thus offsetting the impact of the real exchange rate of a nominal exchange rate appreciation by inflation. Additionally, accumulating the current account deficit leads to a negative net foreign assets position of a debtor country, because CAt = NFAt − NFAt−1 is the flow balance and NFAt = NFAt−1 + CAt is the stock wealth, where CAt represents current account at time t, NFAt represents net foreign assets at t, and NFAt−1 represents net foreign assets at t − 1.
Focusing on a flexible exchange rate in international trade, the current account position between home and foreign countries is presented as a function of equilibrium REER (R*) and full employment output of the home (Y) and foreign economies (Y*). Then, the current account (CA) is equated to the capital flow (KA) at equilibrium over the medium term, as CA = f (R*, Y, Y*) = KA, where f(.) is the functional notation. Here, what exports and imports react depends on two main questions: (1) how large is the elasticity of substitution between domestic and foreign goods with the J-curve and the Marshall-Lerner condition?; (2) how much pass-through is there of the exchange rate to consumer prices in which exports fix their prices? Also, existing studies of net export performance are extended by including the real exchange rate misalignment, as shown in Jongwanich [14], Obeysekera and Ekanayake [15], Toulaboe [16], etc. Traditionally, in the long run, when all prices fluctuate completely, the effects of the exchange rate misalignment on the international trade flows are insignificant because they hardly change relative prices under the assumptions of no market distortion from the information problem, entering costs into the exports market, etc. In the short run, however, the exchange rate misalignment changes the relative prices and affects the trade flows as well as the resource allocations between the tradable and the non-tradable. The short-term effects of the exchange rate misalignment are more complicated.
The second topic is about the trade effects of changes in the exchange rate. In an insular economy, which is featured under the limited capital flow and trade, exchange rate changes do not affect domestic prices and domestic absorption directly. But they do affect trade flows conventionally. A currency depreciation boosts exports and reduces imports, and then improves trade balance with a small increase of indirect domestic absorption from the trade surplus.
In an open economy, which is featured under the free markets for capital flow and trade, exchange rate changes affect domestic prices, domestic absorption, and trade balance. A currency depreciation improves trade balance and thus increases domestic absorption unless price effects cause an increase in imports and a slump in exports. And currency depreciation could result in a weaker decrease in investment and consumption, and thus decrease domestic absorption due to the rise in import prices and production costs.
In a global value-chained open economy prevailing today, exchange rate changes affect domestic prices, domestic absorption, and trade balance in a value-added perspective. Currency depreciation increases both gross exports and value-added exports as a conventional result. But, the value-added trade effect of the exchange rate might be smaller than the trade effect of the exchange rate because of the segmentation of GVCs-traded production. Additionally, the value-added trade approach, which is supported by Johnson & Noguera [17], Koopman et al. [8,18], and UNCTAD [19], can express a trade balance as CA = = , where CA represents the value-added trade balance, X represents value-added exports, M represents value-added imports, Bs represents a supply of foreign assets, and Bd represents a demand for foreign assets.
The third topic is about the forecasting rule of fundamentalists. Fundamentalists choose a fundamentals-based forecasting rule. They will make a retrospective prediction for the future exchange rate by using the following equation. Set+1 = St − θ(St − S−), 0< θ <1, where Set+1 represents the future expected exchange rate at time t + 1, St represents the exchange rate at t, S− represents the equilibrium exchange rate, and θ is a forecasting-adjustment coefficient. Agents use an estimate of the equilibrium exchange rate because they do not know the exact fundamental value.
Furthermore, we can extend the fundamentals-based forecasting equation to the value-added one. Then, VRet+1 = VRt − θ (VRt − VR*), 0 < θ < 1 or ∆VRet+1 = −θ (VRt − VR*), where VRet+1 represents the expected future VAREER at time t + 1, VRt represents the VAREER at t, VR* represents the equilibrium VAREER, and ∆ represents the change in the form of first difference. This implies that currency depreciation will be expected, with a decreased supply of foreign exchange and an increased demand for foreign exchange when the VAREER is higher than the equilibrium VAREER. A currency appreciation will be predicted when the VAREER is lower than the equilibrium VAREER.
The final topic is about the predictive relationship of the exchange rate with trade flows. The response of trade flows is additionally focused on the exchange rate volatility in the 1970–1990s and by the exchange rate misalignment in the 2000s. Yet, the effects of exchange rate changes on trade flows are difficult to predict.
In today’s GVCs economies, we claim that VAREER (VR) can be used as a predictor for adjusting the GVCs-related trade balance because the exchange rate cannot be separated from domestic price and absorption, and it is endogenous to a monetary policy and investment decision. If the VR decreases or the VR is less than 100, then we may expect the growth of exports and the improvement of the trade balance. If the VR increases or the VR is more than 100, we may expect the contraction of exports and the worse of the trade balance. Similarly, the VAREER misalignment (mVR) position can be used to predict a future trade balance. Normally, countries located in the situation of VR < VR* or the mVR being less than 0, can expect gains in their trade balance from the currency depreciation. Countries located in the situation of the VR > VR* or the mVR being more than 0, can expect a loss in their trade balance from the currency appreciation.
We can use the traditional approach to focus on the accuracy of predictions as we review. So, we perform the traditional regression to identify a significant predictive effect of VR. In another word, a possible way to assess the relative contribution of VR is described in the following conventional regression model, if we write the trade balance as a partially reduced form like CA = f (VR, Y, Y*), where the net impact of VR is summarized as , where X is the exports and M is the imports. Then, the reduced form model predicts that domestic currency depreciation improves the trade balance in the long-run.
where CAt represents the value-added trade balance at time t, VRt repesents the VAREER at t, Yt represents the domestic income at t, Y*t represents the foreign income at t, α is the constant, β is the coefficients, and εt is the error term at t. Here, regression is the standard approach to modeling the relationship between one outcome variable and several input variables.
CAt = α + β1VRt + β2Yt + β3Y*t + εt
3. Results
This section estimates the predictive value-added responses of trade flows to exchange rate changes and then summarizes our empirical findings. By the way, a forecast is merely a prediction about the future values of data. Regression analysis for forecasting is a statistical technique to analyze quantitative data, which estimates parameters and makes forecasts by using the regression line under the assumption that the relationship which existed in the past between the variables will continue to exist in the future.
We use the yearly data of all logarithmic variables available from the OECD-WTO for value-added trade statistics, and the FRED (Federal Reserve Economic Data-St. Louis Fed) for other economic statistics for the period between 1995 and 2015. We adopt the narrow REER with 2010 = 100, published by the Bank of International Settlement to measure the VAREER, computed by REER with the narrow method plus China. In response to the value-added trade data measured by the OECD-WTO, we calculate the series of VAREER as the exchange rate corresponding to a group of countries instead of one partner only, following the weighting criteria where the share of the bilateral value-added trade to the total value-added trade volume is given by using the narrow method plus China of the Bank of International Settlement, according to Bems and Johnson [11,12]. Beyond the data availability for VAREER computation, to pay attention on the different effects between the vehicle currency of the USD, the major currency of the JPY, and the non-major currency of the KRW, we analyze the US, Japan, and Korea, and not a wider range of countries.
Based on the log-linearized form of the above Equation (1), the econometric methods for time-series analysis are employed in sequence. First, in the stationarity testing stage, core economic series used in models were tested for unit roots. The results by using the unit root tests of both Dickey and Fuller [20] and Zivot andAndrews [21] for the whole sample period are presented in Table 1.

Table 1.
Results of Unit Root Tests.
Here, common unit root tests, such as the Augmented Dickey and Fuller test, have low power in small samples and ignore the presence of breaks in time-series. So, we perform the Zivot–Andrews test, which assumes the presence of one or more breaks, allowing for breaks in intercept and trend.
Table 1 presents the results of unit root tests. The Dickey–Fuller test indicates that all the level variables are nonstationary at the significant level except for the trade balance of the US and Korea, while all the variables are first-difference stationary except for the REER, VAREER, and income of the US. On the other hand, the Zivot–Andrews test confirming each break, which indicates that all the level variables are nonstationary at the significant level except for the trade balances, as well as the REER and VAREER of Korea, while all the variables are first-difference stationary except for the REER of the US.
Second, the cointegration tests are performed to check out the relationships in the long run. Their models are based on Equation (1) such as CAt = f (Rt, Yt, Y*t) for gross trade balance and CAt = f (VRt, Yt, Y*t) for value-added trade balance. The results, by using the Engle and Granger [22] test allowing for the constant plus the trend, are presented in Table 2.
Table 2.
Results of Cointegration Tests.
Table 2 shows the results of the long-run relationship tests. The Engle and Granger [22] test indicated that the gross and value-added variables in the US and Korea are cointegrated for their long-run relationship, but the gross and value-added variables in Japan are not cointegrated. Therefore, we use the level stationary variables for the estimation of the US and Korea, and the differenced stationary variables for the estimation of Japan.
As a preliminary test, we include the time series graphs for the trade balance, REER, and VAREER in Figure 1. It would be interesting to visually examine the predictive power of exchange rates to the trade balance over time in in-sample and out-sample forecasts, however, the out-sample forecast better reflects the information available.
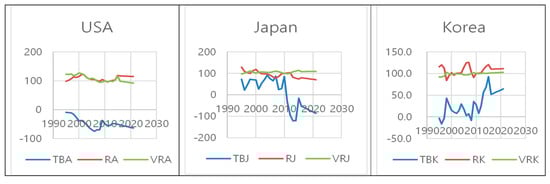
Figure 1.
Trade Balance & Exchange Rate.
Note that TBA represents the (value-added) trade balance calculated by ten billion-dollars unit in the US, RA represents REER in the US, and VRA represents VAREER in the US. TBJ represents the (value-added) trade balance calculated by billion-dollars unit in Japan, RJ represents REER in Japan, and VRJ represents VAREER in Japan. TBK represents the (value-added) trade balance calculated by billion-dollars unit in Korea, RK represents REER in Korea, and VRK represents VAREER in Korea. Here, out-samples are the forecast data computed by a 95% confidence level for the period 2016 to 2021.
Finally, we perform regression tests based on Equation (1). The results for gross and value-added models for trade balance are presented in Table 3. The regression analysis shows a statistical association or correlation between variables rather than a causal relationship between variables. So, we confirm that our empirical models consist of significant dependent and independent variables by using the Granger causality test and the principal component factor analysis.
Table 3.
Estimation Results for Trade Balance Regression.
Table 4 represents the statistically significant results for gross and value-added trade balance for the whole sample period. We find that the REER and VAREER are statistically significant and affect the trade balance. This explains that the trade balance changes highly negatively or positively to changes in the REER or VAREER. These results suggest that the REER and VAREER probably have predictive information for the trade balance.
Table 4.
Results for Predictive Effect of Exchange Rate on Trade Balance.
For the gross trade balance, REER has a negative relationship with the trade balance, implying the positive effect of domestic currency depreciation on the trade balance in Japan and Korea, while REER has a positive relationship with the trade balance in the US. For value-added trade balance, however, VAREER has a negative effect on the value-added trade balance in all countries since the influence of trade transaction costs and intermediate exports. Also, domestic income has a negative effect and foreign income has a positive effect, as we expect.
To explain the predictive effect, we use the SIC (Schwarz Information Criterion) method for a model selection, and form a model of probability according to P(M1) = , where P(M1) indicates the probability of Model 1, SIC1 is the SIC of Model 1, SIC2 is the SIC of Model 2, and −0.5·SIC approximates the Bayesian marginal likelihood, which is a theoretically rigorous statistic allowing for model comparison and model averaging. The most interesting question is whether the use of the value-added REER outperforms models with the standard REER by using a Bayes Factor computed from the relative BIC of each model.
Table 4 represents the statistically significant forecasting results to anticipate variation in the trade balance. First, the best model in a regression model is one that satisfies the criteria of a uniform minimum variance unbiased estimator. Here, the definition of the best model is considered the model of probability. Modeling comparison is performed between the REER and VAREER. We find that there are little differences between the gross and value-added models, according to the SIC method. We would expect that the value-added models with VAREER not to out-perform gross models with the standard REER. This implies that both models are statistically significant, but their meanings are economically different.
Second, we calculate forecast error statistics on a series of in-sample one-step forecasts. Forecasting comparison was performed between the REER and VAREER. We find that there are little differences between the gross models with REER and value-added models with VAREER in the US and Korea, according to the root mean square errors. This implies that both models have similar predictive power.
Therefore, we can explain the predictive effects of REER and VAREER for the trade balance. The first result is that we would expect that the depreciation of the domestic currency with REER has a positive effect on the trade balance in Japan and Korea, but a negative effect on the trade balance in the US. The second result is that we would expect that the depreciation of the domestic currency with VAREER has a negative effect on the value-added trade balance due to enlarged intermediate trades on GVCs.
Besides, we assessed what the percentage of variance is that is explained by the predictor of REER or VAREER. The proportional reduction in error (PRE) statistic indicates the predictive power of REER or VAREER, according to Judd, McClelland, and Ryan [23].
Table 5 represents the statistical forecasting results for the predictive power, by computing the proportional reduction of error (PRE) with PRE = {(E1 – E2) ÷ E1}, where E1 represents the number of categorizing mistakes made without considering the predictor of the REER or VAREER, and E2 represents the number of categorizing mistakes made with considering the predictor of the REER or VAREER. This may support that, mostly, the predictors of REER and VAREER are significant.
Table 5.
Additional Results for Predictive Effect of Exchange Rate on Trade Balance.
Finally, we summarize the main outcomes, which would be desirable to clarify potential results. The first is that VAREER has predictive elasticity information for the value-added trade flows. The second is that VAREER harms the value-added trade balance due to increased intermediate trades, but REER has a positive effect on the gross trade balance. We would expect that value-added exports with trade balance can be improved in all sample countries when the VAREER is increasing.
4. Conclusions
This study evaluates the predictive effect of the exchange rate on the value-added trade balance and assesses possible policy implications using a sample of yearly trade figures spanning the period from 1995 to 2015 focused on the current GVCs state of the literature concerning the effects of exchange rate movements on the trade balance. The study shows that higher attention should be given to the most plausible dynamic theory in this field, known as value-added trade flows. The evidence is consistent with the asset market literature on how the determination of exchange rates establishes a direct relationship between changes in the exchange rate and the current account or trade balance account.
We investigate the predictive effects of the exchange rate for the value-added trade along GVCs to anticipate a value-added trade surplus or deficit. Our first finding is that REER and VAREER have the predictive elasticity information for the trade flows. The second is that exchange rates have two practical effects on trade. The value-added exchange rate hurts the value-added trade balance due to increased intermediate trades, while the exchange rate has a positive effect on the gross trade balance, as the depreciation of local currency makes the cost of importing goods more expensive, which could decrease imports.
Accordingly, we would expect that the depreciation of the domestic currency with VAREER harms the value-added trade balance in all sample countries. This implies that we may expect the improvement of value-added trade balance and the increase of value-added exports when the VAREER that is computed by value-added trade weights is increasing due to the increased intermediate goods trades. Therefore, for trade policy, we need to distinguish the currency depreciation on the trade flows in value-added perspectives from the depreciation on the gross trade.
Also, we would expect that the depreciation of the domestic currency with REER has a positive effect on the trade balance in Japan and Korea but a negative effect on the trade balance in the US. In other words, we may expect the improvement of trade balance and the increase of exports in Japan and Korea, but the deterioration of trade balance and the decrease of exports in the US when the REER that is computed by gross trade weights is decreasing.
Many of the research and implications detailed in this article can be considered laudable and can satisfy the general criteria of theoretical parsimony. Empirical illustrations are given to value-added trade issues and certain forecasting contrasts are drawn. Practical implications reducing uncertainty could strengthen a key channel for the transmission of monetary policy by increasing the boost in exports or improving the value-added trade balance. Although future research may test other countries to avoid any extrapolated outcomes, our results will give a clear answer to whether the value-added trade data are more suitable for the creation of an appropriate free trade policy, which will help better understand the contributions of the current paper to the existing literature.
Funding
This work was supported by the Ministry of Education of the Korea and the National Research Foundation of Korea (NRF-2017S1A5A2A01026990).
Conflicts of Interest
The author declares no conflict of interest.
References
- Johnson, H.G. The monetary approach to balance of payment theory. J. Financ. Quant. Anal. 1972, 7, 1555–1572. [Google Scholar] [CrossRef]
- Frenkel, J.A.; Rodriguez, C.A. Portfolio equilibrium and the balance of payment: A monetary approach. Am. Econ. Rev. 1975, 65, 674–688. [Google Scholar]
- Mckinnon, R.I. The exchange rate and the trade balance-insular versus open economies. Open Econ. Rev. 1990, 1, 17–37. [Google Scholar] [CrossRef]
- Ahmed, S.; Appendino, M.; Ruta, M. Global value chains and the exchange rate elasticity of exports. BE J. Macroecon. 2016, 17. [Google Scholar] [CrossRef]
- Ollivaud, P.; Rusticelli, E.; Schwellnus, C. The Changing Role of the Exchange Rate for Macroeconomic Adjustment; OECD Economics Department: Paris, France, 2015. [Google Scholar]
- IMF. World Economic Outlook: Adjusting to Lower Commodity Prices Chapter 3; IMF: Washington, DC, USA, 2015. [Google Scholar]
- Hummels, D.; Ishii, J.; Kei-Mu, Y. The nature and growth of vertical specialisation in world trade. J. Int. Econ. 2001, 54, 75–96. [Google Scholar] [CrossRef]
- Koopman, R.; Powers, W.; Wang, Z.; Wei, S. Give Credit to Where Credit Is Due: Tracing Value Added in Global Production Chains; NBER WP 16426; National Bureau of Economic Research: Cambridge, MA, USA, 2010. [Google Scholar]
- Bahmani-Oskooee, M. Is there a long-run relation between the trade balance and the real effective exchange rate of the LDCs? Econ. Lett. 1991, 36, 403–407. [Google Scholar] [CrossRef]
- Patel, N.; Wang, Z.; Wei, S.J. Global value chains and effective exchange rates at the country-sector level. J. Money Credit Bank. 2019, 51, 7–42. [Google Scholar] [CrossRef]
- Bems, R.; Johnson, R. Value-Added Exchange Rates; NBER WP 18498; National Bureau for Economic Research: Cambridge, MA, USA, 2012. [Google Scholar]
- Bems, R.; Johnson, R. Demand for Value Added and Value-Added Exchange Rates. Am. Econ. J. Macroecon. 2015, 9, 45–90. [Google Scholar] [CrossRef]
- Choi, M.S.; Sung, B.; Song, W. The effects of the exchange rate on value-added international trade to enhance free trade sustainability in GVCs. Sustainability 2019, 11, 2740. [Google Scholar] [CrossRef]
- Jongwanich, J. Equilibrium Real Exchange Rate, Misalignment, and Export Performance in Developing Asia ADB Economics Working Paper 151; ADB: Manila, Philippines, 2009. [Google Scholar]
- Obeysekera, S.; Ekanayake, H. The impact of real exchange rate and its misalignment on export performance in Sri Lanka. Cent. Bank Sri Lanka Staff Stud. 2016, 46, 1–25. [Google Scholar] [CrossRef]
- Toulaboe, D. Real exchange rate misalignments and U.S. exports to Asia. J. Appl. Bus. Econ. 2016, 18, 103–116. [Google Scholar]
- Johnson, R.; Noguera, G. Accounting for intermediates: Production sharing and trade in value added. J. Int. Econ. 2012, 86, 224–236. [Google Scholar]
- Koopman, R.; Wang, Z.; Wei, S. Tracing value-added and double counting. Am. Econ. Rev. 2014, 104, 459–494. [Google Scholar]
- UNCTAD. Global Value Chains and Development; UNCTAD: Geneva, Switzerland, 2013. [Google Scholar]
- Dickey, D.A.; Fuller, W.A. Distribution of the estimators for autoregressive time series with a unit root. J. Am. Stat. Assoc. 1979, 74, 427–431. [Google Scholar]
- Zivot, E.; Andrews, D. Further evidence on the great crash, the oil-price shock, and the unit-root hypothesis. J. Bus. Econ. Stat. 2002, 20, 25–44. [Google Scholar] [CrossRef]
- Engle, R.F.; Granger, C.W.J. Cointegration and error correction: Representation, estimation and testing. Econometrica 1987, 55, 1251–1276. [Google Scholar] [CrossRef]
- Judd, C.M.; McClelland, G.H.; Ryan, C.S. Data Analysis: A Model Comparison Approach, 2nd ed.; Routledge: New York, NY, USA, 2009. [Google Scholar]

Publisher’s Note: MDPI stays neutral with regard to jurisdictional claims in published maps and institutional affiliations. |
© 2020 by the author. Licensee MDPI, Basel, Switzerland. This article is an open access article distributed under the terms and conditions of the Creative Commons Attribution (CC BY) license (http://creativecommons.org/licenses/by/4.0/).