Article

Is Financial Information Influencing the Reporting on SDGs? Empirical Evidence from Central and Eastern European Chemical Companies

Department of Accounting and Auditing, Faculty of Accounting and Management Information Systems, Bucharest University of Economic Studies, Piața Romană 6, 1st District, 010374 Bucharest, Romania
*
Author to whom correspondence should be addressed.
Sustainability 2020, 12(21), 9251; https://doi.org/10.3390/su12219251
Submission received: 9 September 2020 / Revised: 3 November 2020 / Accepted: 4 November 2020 / Published: 6 November 2020

Abstract

:
Since the adoption of the sustainable development goals (SDGs) endorsed by United Nations in 2015, which envision an ambitious representation of what the world could look like in the upcoming years, companies have been employing different approaches to identify and report on their contributions to the SDGs, albeit facing various difficulties due to the goals’ novelty, legislative deficiencies, and the complexity of connections between SDGs and business performance. In this context, the relationship between sustainability practices and firms’ financial performance has attracted much attention among researchers. Consequently, this research is focusing on determining to what extent the financial indicators disclosed in the annual reports are impacting the quality of non-financial reporting based on SDGs in the case of chemical companies operating in Central and Eastern European countries (Czech Republic, Hungary, Poland, Romania and Slovakia), within the time frame of 2015–2019. To reach our objective, a score-based content analysis was applied to assess the measure of SDGs achievement, and subsequently, the SDG score was used in multiple linear regression models with several financial data-based independent variables. The main findings highlight the companies’ contribution to the SDGs, particularly to those addressing the environment and decent work conditions for employees, and suggest that the research and development costs and other intangibles represent the most influential variable in explaining the variation in the firms’ SDG score. Academics, businesses and legislative bodies may find these results valuable in their corresponding activities: theoretical, pragmatic or statutory.

1. Introduction

The United Nations (UN) Agenda [1] proposes 17 ambitious sustainable development goals (SDGs) for a better life (as disclosed in Appendix A, Table A1) envisioning a mixture of global thinking and local acting. Additionally, the UN Agenda opens up the considerations about sustainable development and the call for new approaches to measure performance, to develop business models oriented toward sustainability, and to integrate sustainable procedures with the reporting structures.
Sometimes, improvement towards one goal might reinforce or even harm progress towards another SDG and it is, therefore, critical to understand the SDGs’ relationships and to construct the most original arrangement to achieve the maximum for each goal. The interlinked nature of the goals has been researched and confirmed by recent studies [2,3,4,5,6,7].
At the business level, the preference on reporting SDGs is through non-financial information, under a variety of labels, recurrently as: Sustainability Report, Corporate Responsibility Report, Integrated Report, CSR Report, Non-financial Performance Statement, for the reason that the multi-faceted construction of the SDGs is analogous with non-financial reporting, which includes information concerning economic performance, environmental and social impact, health matters, demonstrating the link between corporate strategy and commitment to a sustainable global economy [8].
A valuable non-financial report should include both positive and negative impact on the surroundings where the company is based, the company’s environmental and social data, and the relationship to sustainable development. In these circumstances, the European Union (EU) decided to make mandatory the disclosure of non-financial information provided by large companies and groups (defined based on the number of employees, namely, higher than 500), publishing in 2014 the Non-Financial Reporting Directive (Directive 2014/95/EU) [9].
The relationship between sustainability practices and the financial performance of companies has attracted much attention among researchers [10,11,12,13,14,15,16,17,18,19,20,21]. Although the sustainability reports have been increasing in number [22,23,24,25,26], several authors have expressed concern with respect to the degree to which sustainability reports accurately and completely portray corporate social and environmental impacts [24,27,28].
The current study aims to determine to what extent the corporates’ financial indicators impact the quality of sustainability reporting based on SDGs in the case of chemical companies operating in Central and Eastern European (CEE) countries during 2015–2019. To this end, firstly, we developed and assigned an SDG score using information disclosed in the non-financial reports, considering both qualitative and quantitative aspects. Secondly, we extracted financial data in order to measure their influence on the SDGs reporting, by applying four multiple linear regression models, that have the previously computed SDG score series as dependent variable, demonstrating the accounting rigorousness to be an essential feature for attaining financial results consistent with the goals of sustainable development [29,30,31,32].
The main conclusions highlight the preoccupation shown by companies on reporting the goals, with an emphasis on guaranteeing decent and proper work conditions for employees, the implementation of a sustainable supply chain, promoting activities for reducing the pollution of water, air, as well as waste management. The corresponding SDGs were allocated with the maximum score level (5), this also being explained by the fact that the analysed companies operate in the chemical sector. With respect to the influence of financial indicators on the quality of SDGs reporting, return on assets has the lowest impact on the quality of sustainability reporting based on the SDG score, whereas the contribution of research and development (R&D) costs and other intangibles resulted to be substantial, as a consequence of the essential role played by R&D in the advancements to innovation and technology within the chemical industry.
The remainder of this paper is structured as follows. The next section reviews the relevant literature debating SDGs reporting and sets the background of the study. This is followed by the presentation of data and research methodology used in the investigation. The fourth section shows the empirical findings and discusses the results. The final section provides some concluding remarks, implications and limitations of the research.
This exploration might be noteworthy from several perspectives: for scholars, by enriching the academic literature discussing the association of financial and non-financial reporting related to SDGs; for investors, with an increased interest in environmental, social and governance information by helping them understand what SDG reporting they should be looking for and requesting from the companies they intend to invest in; for decision makers, by offering assistance in ascertaining the financial indicators that have the greatest impact in contributing to the achievement of the Sustainable Development Goals.

2. Literature Review

Sustainable development refers to the overall impact of sustainable action and was initially only characterised as responsible use of natural resources [33]. The idea of sustainability resides in three pillars: “economic development,” “social development” and “environmental protection,” known as the “Triple Bottom Line” approach. In 1996, Deegan and Rankin [34] alerted that only a display of environmental information is solely favourable to the corporation’s image, but in order to be sustainable, companies should extensively act on all three pillars of contemporary performance: financial, environmental and social, generating a helix of transformational effects, objectively reporting both positive and negative facts and figures.
The pathways to sustainable development will not be identified through a top-down approach, but through highly strengthening our era by building a networked problem-solving system that engages the world’s universities, businesses, nongovernmental organisations, governments, and especially young people, who should become the experts and leaders of these new and profoundly challenging times [35]. The involvement of the new talented generations will contribute to creating symbiosis and harmony between the economic, social and environmental pillars [36], in order for them to naturally and synchronically progress together as a triple helix. This approach comes as a necessity in a global context characterised by the influence of social media and information technology, where problem-solving networks involving governments, international institutions, private business, academia working together for achieving sustainable development will play a crucial role in the years ahead.
Sustainable development goals may require a new way of thinking, because the goals are complex and interconnected, and their success likely depends on partnerships between business, governments and civil society [24]. According to PwC’s survey [26], more and more companies perceive strategic value in SDG; this study, based on 470 companies from 17 countries operating in six broad industries, endorsed PwC to conclude that 62% companies mentioned SDGs in their reporting. An additional study conducted by Corporate Citizenship agency [23] found that 41% of the 240 analysed companies have done some form of mapping or prioritization of the SDGs to which they most contribute. On the other hand, KPMG’s survey published in 2018 [25] underlines that 75% of 250 largest companies included in their study discuss the impact of SDGs on their business, but reporting is predominantly unbalanced with most entities providing their positive impacts, but not the negative effects.
The SDGs make available a common framework that guides corporations to be more accountable about their influences and performance to their stakeholders, as well as to improve partnership and collaboration opportunities to address sustainable challenges. Different companies have been employing different approaches to identify and report on their contributions to the SDGs, as well as to identify opportunities to align their business strategies with the SDGs, for the reason that each corporation has its own personality and history just as a person does. Its body of knowledge and expertise is unique and its circumstances are characteristic to its own experience and environment [37,38]. Mori et al.’s research [38] found that significant and transparent disclosure on the measurement of any contribution made with respect to the SDGs is not yet common practice among the assessed companies because non-financial reporting is newly regulated. In Europe, the UN Parliament adopted in 2014 the Non-Financial Reporting Directive (Directive 2014/95/EU10), which requires Europe’s largest corporations to publish sustainable reports. This directive is a cornerstone of the evolution of sustainability reporting, but not the only frontier in which such reporting is taking shape as a well-regulated framework [39,40]. Managing corporate sustainability entails the analysis of the impacts of social and environmental initiatives on the overall corporate profitability [41].
The benefits of sustainability reporting go beyond relating business financial risk and opportunity to performance along economic, social and planet dimensions and establishing certification to operate. Sustainability disclosure can serve as a differentiator in competitive industries and foster investors’ confidence, trust and employees’ loyalty [42]. Tenuta [43] advocates that the sustainability report is the most operative instrument to relate the business with its stakeholders. Investors often consider a company’s sustainability disclosures in their assessment of portfolios [44,45], and reporting may provide corporations with better access to capital [46]. In a review of more than 7000 sustainability reports from around the globe, researchers found that sustainability disclosures are being used to help analysts determine corporations’ values and that sustainability disclosures may reduce forecast inaccuracy by approximately 10% [47].
Decades ago, Belkaoui [48] and Sturdivant and Ginter [49] investigated the relationship between sustainability, in terms of corporate social responsibility, and performance, validating not only an association between management values and corporate social responsiveness, but also that companies with strong social involvement generally enjoy better financial performance than their less responsive industry counterparts. Similarly, the positive relationship between sustainability and performance was confirmed by Ameer and Othman [11], as well as Alshehhi et al. [10] when they investigated the sustainability practices influence on financial ratios, defined as return on assets, profit before taxation, and cash flow from operations. Bnouni [50] demonstrates a positive, but marginal, relationship between sustainability (as CSR) and financial performance across 80 French small and medium-sized enterprises, and reaches the conclusion that the positive effect of sustainability does not just occur in large organisations. Systematic review piloted by Muhmad and Muhamad [51] highlighted that about 96% of the publications reported a positive relationship between sustainability practices and the financial performance of companies.
On the contrary, Lopez et al. [52] studies the influence of economic, environmental and social indicators of 55 companies on the Dow Jones Sustainability Index and 55 companies on the Dow Jones Global Index, concluding with a negative relationship between sustainability and corporate performance within the analysed time frame of 1998–2004.
Contemporary times lead to improvements of reporting non-financial aspects with respect to environment, people, ethics and governance, and, nowadays, the corporate social responsibility is shaped and converted into sustainable development goals (SDGs). In 2017, KPMG [40] identified the increasing role of the SDGs for corporate responsibility as a key trend and the study published by PwC in 2015 [53] acknowledged that 71% of surveyed businesses plan on developing measures to attempt meeting the SDGs. Therefore, the academic literature is growing in assessing the progress in the corporates’ accomplishment of SDGs, either in single-country analyses [36,38,54,55,56,57,58] or multi-countries analyses [28,59,60].
Investigations of SDGs by industries are conducted by Cosma et al. [61] proving considerations from SDG reporting by European banks, Jones et al. [62] outlining the concept of SDG in information technology and communications (ITC), and Rao et al. [63] addressing the contribution of agriculture and allied activities towards achieving the SDGs. At the chemical industry-level, Zimara and Eidam [58] examined the sustainability disclosure highlighting the diverse structure of the 14 selected companies’ reports. Complementarily, this research states that more than 70% of the companies commit themselves to the principles on human rights, labour standards, environmental protection, and fight against corruption.
The model of sustainable development is unfamiliar for companies operating in CEE countries and, in some way, this is considered a targeted development challenge [64,65]. For countries part of CEE, the post-communist era (1990 upward) has come with many structural ups and downs accompanied by uncertainties; these countries face socioeconomic difficulties, as high unemployment rates, high rate of emigration, low purchasing power of households, political hesitations and the quality of legislation, to name a few.
To our knowledge, non-financial reporting, in general, and SDGs reporting, in particular, are scarce when it comes to European emerging economies. In this setting, the current investigation intends to provide answers to the following research questions concerning chemical companies operating in Czech Republic (CZ), Hungary (HU), Poland (PL), Romania (RO) and Slovakia (SK):
  • Employing a score-based approach, what are these companies’ advancements in achieving the SDGs?
  • To what degree do financial data influence the SDGs reporting, measured in terms of the previously defined score?

3. Research Methodology

The research methodology is structured hereafter in three main subsections. The first relates to the data collection process and sample details, the second corresponds to the SDG score computation based on content analysis, and a third section refers to the empirical approach for testing the influence of financial indicators on sustainability reporting, based on several multiple linear regression models.
The analysis is focused on the chemical sector companies. Generally, the SDG prioritization depends on the company’s industry level. There are industries where a direct link can be easily identified between one goal and the characteristics of the companies’ activities within a sector, such as food companies—SDG 2 Zero hunger, pharmaceutical firms—SDG 3 Good health and well-being, or energy corporates—SDG 7 Affordable and clean energy [66], but also industries with harmful effects on the environment, implying indirect connections to more different goals. Moreover, the chemical sector is an important supplier of products and services to practically every other industry, being one of the most diversified of all industries [67], and thus it interacts with an extensive number of SDGs [68], such as SDG 6 Clean water and sanitation, SDG 7 Affordable and clean energy and SDG 13 Climate action. According to the European Environment Agency (EEA) [69], the chemical industry is one of the top 10 main polluting industries, in terms of air and water pollution, as well as waste generation, hence having a significant impact on the sustainable development goals.
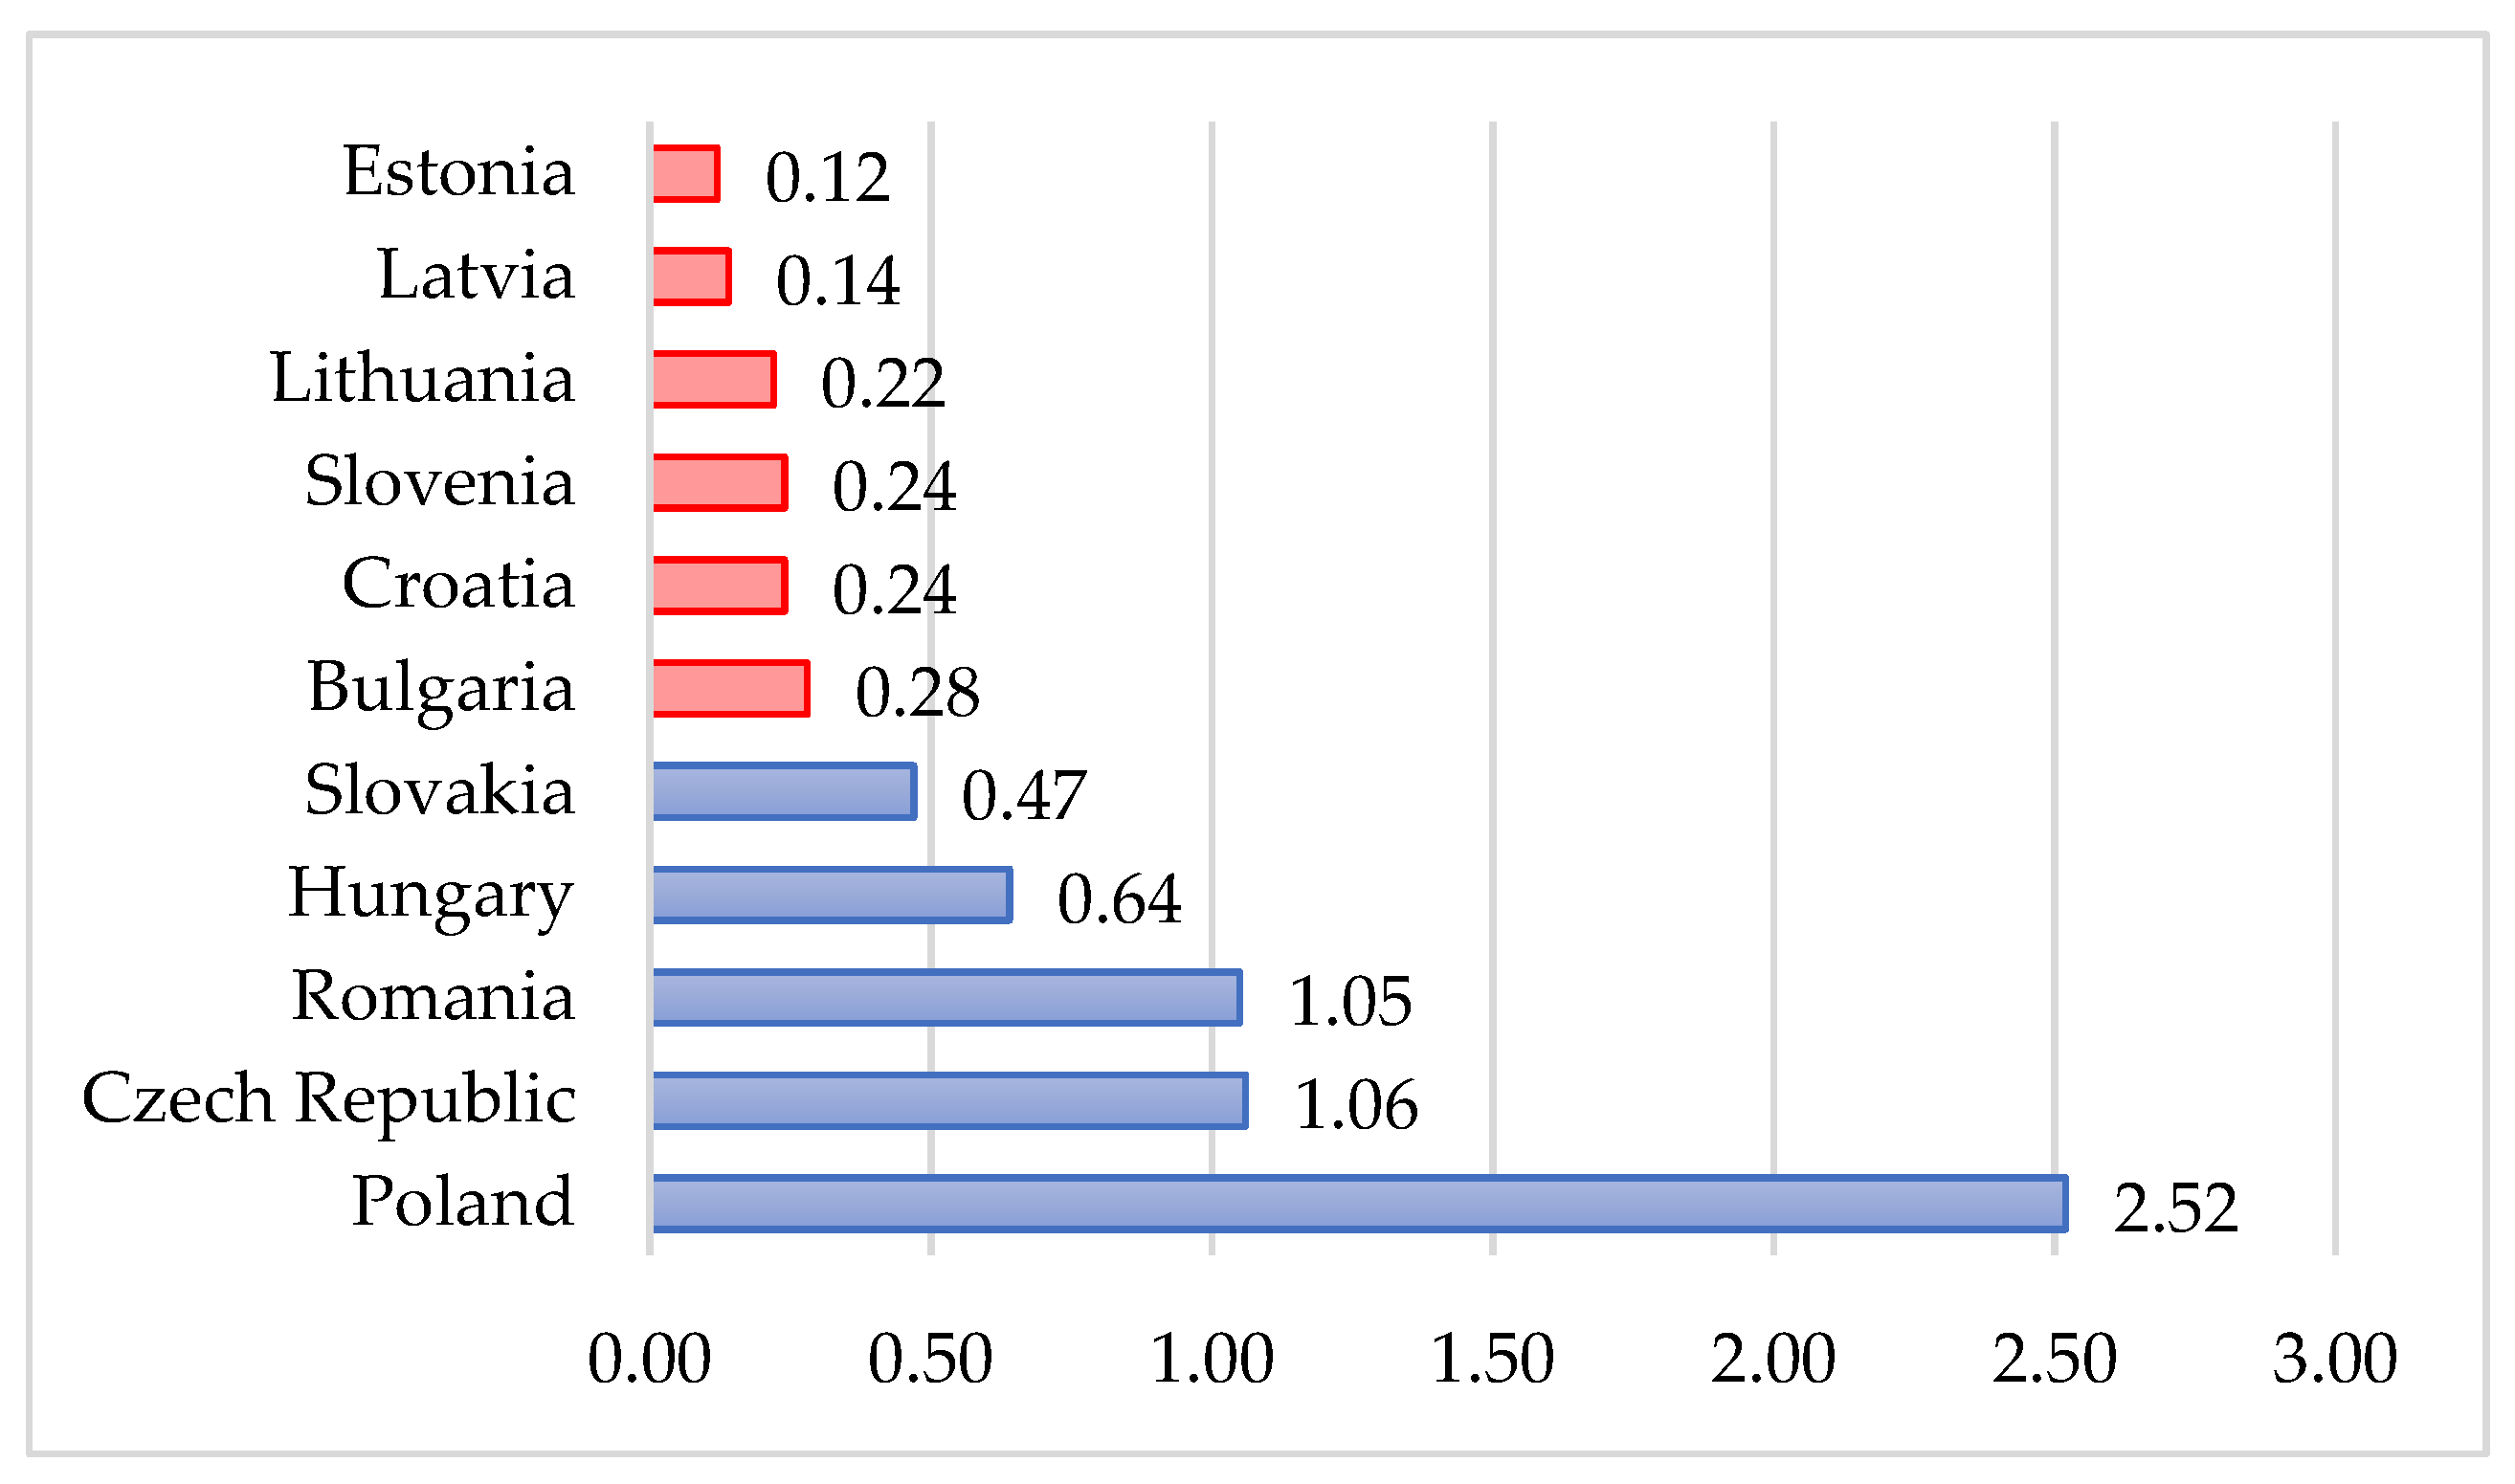
In addition, with reference to the choice of the 5 CEE countries included in the analysis, based on the same data provided by the EEA interactive platform, the countries’ industrial pollution profiles show that Poland, Czech Republic, Romania, Hungary and Slovakia are the greatest contributors from the Central and Eastern European region in terms of gross value added (GVA), as revealed in Figure 1.
Accordingly, CEE countries add up to 6.98% of the European GVA from industry, of which 5.74%—representing 82.23% of the CEE countries contribution—comes from the first five countries included in the analysed sample (PL, CZ, RO, HU and SK). The rest of 93.02% of the total GVA from industrial activities is generated by the other European countries.

3.1. Data Collection and Sample Information

The sample of firms used in this study was initially drawn from the ISI Emerging Markets Group’s EMIS platform database [70], the first 20 companies operating in the chemicals industry and sorted by their operating revenue being selected for each of the 5 CEE countries included in the analysis. We focus on the time frame of 2015–2019, which is the period immediately following the UN announcement of the 17 sustainable development goals. After identifying the firms, several screens were applied in selecting the final sample. Firstly, we checked for the availability of the companies’ reports in English on their websites. To this respect, all types of reports were considered, from sustainability and CSR reports to annual financial reports, and other information published on their websites. Secondly, if individual data were not available, the group reports were used instead. In order to ensure the quality of the research data, we excluded from the initial sample firms where information was non-available or missing, as well as those showing reports written in other languages than English (to avoid any biases associated with translation) [71]. Hence, of the 100 companies considered at first, only 47 were left in the final sample used for the SDG score analysis, after applying the selection criteria previously mentioned, resulting in a number of 171 firm-year observations as disclosed in Table 1. Also, Appendix B, Table A2 shows the remaining firms by countries and operating revenues.
The following step of the selection methodology is related to the second part of the study, referring to the analysis of the influence that financial information exerts on sustainability reporting. For this section, the previous 47 firms included in the SDG score analysis were subsequently checked for the availability of financial data disclosed in the annual reports of the considered period 2015–2019. As indicated in Appendix B, Table A2, this additional selection criterion led to a remaining number of 38 companies which published the necessary financial indicators for the multiple linear regression analysis, resulting in a number of 153 firm-year observations. Along with the above, as part of the regression analysis, the resulted outliers have been truncated, leading to a final sample of 36 firms and 147 firm-year observations. The country and year breakdown of this sample are presented in Table 2.
Both samples reveal a balanced structure of the firm-year observations on countries and years, with the greatest representation from Hungary (22.81% for the SDG score and 25.85% for the regression), and the lowest representation from the Czech Republic for the SDG score analysis (17.54%) and equally from the Czech Republic and Romania for the regression analysis, with 16.33% each.
In terms of the number of documents that have been analysed during the data collection process, Table 3 emphasises a total of 166 reports, with details regarding their types, structure, as well as their number by years during 2015–2019. Figure 2 reveals the graphical representation of the reports’ structure by type.
For 2018, 38 reports were included in the sample, this also being the greatest number analysed within the 5 years. The lowest number of reports is shown in 2015. In respect of their types, between 2017–2019 the number of non-financial reports was the highest, whereas in 2015–2016 the annual financial reports had the greatest representation.
The structure of the analysed reports is almost equally spread between the sustainability reports, other non-financial reports, and annual financial reports (approximately 27% for each category), complemented by the CSR reports with 12% and integrated reports with approximately 7%. These findings are similar to the ones obtained by Yu et al. [57].
In addition to the hand collection of information related to the SDG score, the companies’ annual financial statements were analysed in order to extract the financial indicators used for defining the variables included in the regression models for the second part of the study. During the process of hand-collecting the financial indicators, only the information disclosed in the restated version of the financial statements was considered, in such cases. Moreover, as the financial indicators were extracted from reports disclosing data in various currencies, all the amounts have been converted in EUR using the official exchange rates published by the European Central Bank [72] for each year end between 2015–2019.

3.2. Methods Used for the Assessment of the Quality SDG Score Based on a Content Analysis Approach

The first step in applying the research methods consists in determining an annual SDG score for the sampled firms, designed to assess the quality of the companies’ sustainability reporting. For gathering the necessary information on SDGs disclosed in the corporates’ reports, a textual and content analysis on the selected reports was performed [73,74,75,76,77,78]. This is a widely adopted technique for such academic research [79], as it is designed “for making replicable and valid inferences from texts (or other meaningful matter) to the contexts of their use” (p. 18), and it consists of a scientific tool that “provides new insights, increases a researcher’s understanding of particular phenomena, or informs practical actions” [74] (p. 18). In terms of analysing corporate reports, Wen [80] draws the attention on three main methods that are usually used to analyse texts: individual word-count systems that quantify word frequencies and other text characteristics, human-based content analysis which allows researchers to look more closely at the aspects disclosed in the documents, and computer-aided qualitative data analysis systems that use artificial intelligence to analyse text documents [80], citing [81]. Considering these options, similar to Cosma et al. [61], the manual content analysis and interpretation was the chosen method for this study, without the use of any specific software. Taking into account that information regarding the SDGs found in the firms’ reports is frequently associated with the 17 icons corresponding to the goals, the use of content analysis software might not have led to accurate results.
Thus, all public reports of the companies available on their official websites were screened in full and reviewed [75,82], in order to identify the sustainable development goals that they are addressing, as well as the qualitative and quantitative targets, efforts, or measurements for each SDG [56,78]. By applying search queries for the occurrence of key words, such as “sustainable,” “sustainability,” “SDG,” the textual analysis [75,76] was conducted in order to determine whether the sampled companies addressed the SDGs in their reports. This was followed by the content analysis for the score’s assessment. The entire data collection process was carefully supervised and cross validated between all team members to ensure the quality, comparability and reliability of the research [78].
In order to measure the engagement of the selected chemical sector companies in reporting their SDG achievements, a score-based approach using a scale from 0 to 5 was developed and applied, considering the targets, the efforts and the measurements companies have set and have monitored during the analysed period, as shown in Table 4 (detailed information and examples are provided in Appendix C, Table A3). The used scoring methodology is consistent with other similar studies [61,75,77,78,83,84].
Consequently, the SDG score was assigned to a sustainable development goal either by allocating it based on the targets and actions addressing it, or by taking into account the clearly specified SDGs from the analysed reports. This process was applied for each firm-year observation. Furthermore, a score was allocated to an SDG if companies disclosed in their reports that at least one target or indicator addressing that particular SDG was impacted by the firms’ actions.
Additionally, as shown in Table 4, the score was assigned differentially based on qualitative and quantitative aspects reported by companies. Such a distinction was necessary as determining the quantitative goals indicates the extent to which the concept of sustainable development is being implemented [63]. In line with the previous, setting quantitative targets and monitoring their achievements reflects the effective practices applied by companies in integrating the sustainability development goals with their business strategies [77].
As previously mentioned, identifying each SDG was based on three possible scenarios: clearly specified SGDs in the sustainability/annual reports, allocated SDGs based on the targets set by the United Nations or both mentioned and allocated goals.
As revealed in Figure 3, almost a quarter of the total number of companies clearly specified the SDGs they were addressing, 14% particularly mentioned some SDGs, but they also presented information about other SDGs without specifying them, while most of the firms preferred to disclose sustainability aspects without naming the related SDGs.

3.3. Methods Applied for the Analysis of the Influence of Financial Information on Sustainability Reporting Based on the Multiple Linear Regression Model

The academic literature shows many empirical studies that have examined the relationship between companies’ social performance and their financial performance [85,86]. The findings of such research papers are mostly mixed. Some studies found a negative relationship [87,88], some found a positive relationship [17,85,89,90,91], and others reported inconclusive or insignificant results [92]. However, given the broad range of motives for corporate social responsibility activities, it might not come as surprising that empirical studies analysing this association find mixed results [93].
In this context, for the analysis of the extent to which financial information is influencing sustainable development reporting, a methodology based on multiple linear regression models is applied. This section mentions hereafter the research design used in the study, starting with the definition and measurement of the variables, and afterwards presenting the research models.

3.3.1. Defining the Dependent Variable—Measurement of the Sustainable Development Indicator

The dependent variable, namely the sustainable development goals quality score (SDGS), is defined as a measure of the sustainability reporting quality and it is derived from the previous section of the methodology. Using similar methods to the ones applied in prior studies [61,77,78,83], SDGS is a continuous variable constructed as follows:
SDGS it = j = 1 17 S D G j it
where i = firm, t = year, j = goals from 1 to 17 and SDG = score from 0 to 5 assigned for each one of the 17 SDGs.

3.3.2. Defining the Independent Variables—Measurement of the Financial Performance Indicators

Consistent with prior studies as indicated below next to each variable, the independent continuous variables used in the regression models are defined in Table 5.
To avoid scale problems, we applied the common practice of using the natural logarithm on some of the variables [99].

3.3.3. Defining the Control Variables

Following previous research, our study controlled for firm size [86,87,92,95,96,100,101] and leverage [17,91,94,95,96,100,101]. Additionally, we use two dichotomous variables to control for the availability of sustainability reporting [77], and whether the firms’ auditor is a Big 4 company or not, assuming that statements assured by the Big 4 auditing companies are of higher quality [101]. Moreover, in order to reduce concerns on any associations between dependent and independent variables, dummy variables for countries and years were used as well [99,102,103]. No control for industry was necessary, as all the sampled companies are operating in the same sector. Accordingly, all control variables included in the regression models are defined as disclosed in Table 6.
The choice of the financial indicator as a measure of the corporates’ size was influenced by the Pearson correlation coefficient obtained for the variables. Although most of the similar academic work uses total assets [85,86,95,101,104,105] and/or sales [85,92,105] as control variables for firm size, these financial indicators did not represent an option in our case, as both resulted to be strongly positively correlated with two of the independent variables, INT and RDOINT, with a Pearson correlation coefficient above 0.8, significant at the 0.01 level (2-tailed). Hence, to avoid any multicollinearity issues [106], considering the recommended Pearson cut-off value [107], a variable based on the value of property, plant and equipment was chosen instead, as an alternative measurement of size.

3.3.4. Regression Models

Therefore, based on the previously defined variables, the following multiple linear regression models were developed and applied:
SDGSit = α0 + α1ROAit + α2SRit + α3LEVit + α4PPEit + α5AUDit + α6COUNTRYkit +
α7YEARit + εit,
SDGSit = α0 + α1CFTURNit + α2SRit + α3LEVit + α4PPEit + α5AUDit + α6COUNTRYkit +
α7YEARit + εit,
SDGSit = α0 + α1INTit + α2SRit + α3LEVit + α4PPEit + α5AUDit + α6COUNTRYkit +
α7YEARit + εit,
SDGSit = α0 + α1RDOINTit + α2SRit + α3LEVit + α4PPEit + α5AUDit + α6COUNTRYkit +
α7YEARit + εit,
where i = firm; t = year; k = 1 to 4 (number of countries minus one); all variables included in the equations are consistent with the prior definitions.
For compiling the multiple linear regression models, as well as other necessary statistical procedures, IBM SPSS Statistics 27 was used as software resource. In order to ensure the statistical validity of the regression models, several procedures were applied for testing the following assumptions [108]:
  • there is a linear relationship between the dependent variable and each of the independent variables, as well as the dependent variable and the independent variables collectively; this was checked by plotting a scatterplot of the studentized residuals against the (unstandardized) predicted values for the first assumption, and partial regression plots between each independent variable and the dependent variable for the second;
  • data show homoscedasticity of residuals, also checked using the plot of the studentized residuals against the unstandardized predicted values;
  • data show no multicollinearity, insuring there are no problems in understanding which independent variable contributes to the variance explained in the dependent variable, as well as technical issues in calculating a multiple regression model; we detect for multicollinearity through an inspection of correlation coefficients and Tolerance/ variance inflation factor (VIF) values [109], as well as the analysis of the Pearson correlation matrix;
  • there are no significant outliers, high leverage points or highly influential points; this assumption was verified by: detecting outliers using casewise diagnostics and studentized deleted residuals, and examining whether these residuals are greater than ±3 standard deviations; checking for leverage points considering leverage values less than 0.2 as safe, 0.2 to less than 0.5 as risky, and values of 0.5 and above as dangerous [110]; and checking for influential points using Cook’s distance as a measure of influence, by determining if any values are above 1 [111]; furthermore, in order to detect any multivariate outliers, the Mahalanobis distance was used [112];
  • the residuals are approximately normally distributed, checked by inspecting histograms with superimposed normal curve and P-P plot, as well as normal Q-Q plot of the studentized residuals.
After verifying the resulted outliers based on the abovementioned procedures, 6 of the 153 firm-year observations were truncated, leading to the final sample of 147 observations. The 6 deleted observations included the ones showing a negative value of stockholder’s equity [100]. There were no studentized deleted residuals greater than ±3 standard deviations, no leverage values greater than 0.2, and values for Cook’s distance above 1. The mentioned truncated observations were multivariate outliers detected by applying the Mahalanobis distance.
The results of the tests revealed that all the assumptions were verified and all the statistical criteria were met in order to run the multiple linear regressions. Details related to these results are found in Appendix D.

4. Results and Discussion

4.1. Results Related to the SDG Score Quality Based on the Content Analysis Approach

4.1.1. Descriptive Statistics on SDGs Reporting at the Country Level and Maximum SDG Score Achievements

The country-level analysis revealed that 16 of the 17 SDGs were reported by all countries, SDG 16 being the only goal that was missing from the Hungarian companies’ reports, as illustrated in Figure 4. Although the scores achieved by the companies on each SDG were relatively close for three of the goals, indicating a great interest in promoting activities for reducing the pollution of water, air and managing the waste (SDG 6, SDG 13 and SDG 12), the diversity shown by companies in reporting the other goals is noteworthy. Considering all the SDGs, Hungary and Poland obtained the highest score on five different goals, Slovakia and Romania achieved the maximum score for three various SDGs, while the Czech Republic had only one goal with the best score. Thus, Hungarian companies were involved predominantly in environment protection (SDG 7, SDG 13, SDG 14), in supporting industry innovation (SDG 9) and developing partnerships to achieve the goals (SDG 17), whereas Polish entities were preoccupied primarily by supporting health, education and community activities (SDG 3, SDG 4 and SDG 11), offering decent work for their employees (SDG 8) and implementing procedures for assuring responsible consumption and production (SDG 12). Slovak firms were interested in achieving gender equality (SDG 5), protecting terrestrial ecosystems (SDG 15) and implementing codes to reduce corruption (SDG 16), while Romanian companies paid more attention to ending poverty and hunger (SDG 1 and SDG 2) as well as reducing inequality (SGD 10). The Czech Republic succeeded to rank first for ensuring availability and sustainable management of water (SDG 6).
Furthermore, the analysis was conducted to assess to what extent the companies managed to achieve the maximum score of 5 for each SDG they were reporting. This score has a particular representativity, since only by setting engagement objectives, implementing procedures, and measuring the effects can companies prove their commitment to achieving the sustainability development goals and provide a quantitative assessment of their progress towards the SDGs.
As shown in Figure 5, the information related to promoting decent work (SDG 8) obtained the maximum score by most companies, as they invested considerable efforts to ensure the health of their employees and continuously monitored the mitigation of the work accidents. Then once again, we detected a significant interest in reporting sustainable information related on SDG 6, SDG 12 and SDG 13, followed by SDG 7. Around 20 companies presented quantitative targets on water and waste management, gas emissions and energy consumption together with their achievement stages. This may be explained by the fact that these chemical companies are polluting the environment by the nature of their activities and they try to remove the negative consequences by setting targets and monitoring the results, being aware of the sustainable environment’s importance. At the opposite side, the goals for which just a few companies managed to achieve the highest score were SDG 1, SDG 2, and SDG 14. For goals related to ending poverty and hunger, this may be acceptable to some extent, considering that it is difficult to set quantitative targets, especially when these involve sponsorships, whose voluntary character is intrinsic. For SDG 14, the score is significantly influenced by the companies’ locations and their pollution zones: companies operating near oceans, seas or rivers are more involved in conserving biodiversity in marine and coastal ecosystems.

4.1.2. SDGs Correlation Analysis

For assessing the interactions among the goals, Pearson’s and Spearman’s correlation coefficients were computed. Notably, all the correlation coefficients were positive showing direct associations between SDGs, which is in line with the UN’s report [113] mentioning a dominance of positive over negative interactions. The correlation coefficients are statistically significant at the level of 1%.
Figure 6 illustrates the associations based on correlation coefficients with values above the mean. It can be easily noticed that five goals form a core structure of association relationships available under both Pearson and Spearman correlation methods, but with stronger Spearman correlation coefficients, as well as an extended core area.
The common core structure of interactions implied SDG 5, SDG 6, SDG 7, SDG 12 and SDG 13. Thus, each of the five goals is interlinked to the other four SDGs.
The interactive association between SDG 7 and SDG 6 is consistent with Mainali et al. [114] findings, as modern energy is required in pumping the ground water, for water treatment and its distribution (7.1, 7.2 with 6.1, 6.3). Yet again, water is crucial for most forms of energy production and the way water is managed could impact on the energy production (6.4 is linked with 7.2). This is also stated by Nilsson et al. [115], according to which the expansion of renewables may include hydropower, which interacts strongly with freshwater ecosystems. Furthermore, improvement in energy efficiency required by target 7.3 positively influences the achievements related to SDG 12 and promoting investments in energy infrastructure and clean energy technology (7.A) increases progress for SDG 13. A significant increase in renewables and energy efficiency is essential for keeping global warming within limits, so that providing access to modern energy services to all (7.1), including women and girls (SDG 5), will not exacerbate climate change [5].
Meeting SDG 6, SDG 13 and SDG 12 targets together is an efficient plan that leads to more effects with less efforts. For example, substantially increasing water-use efficiency across all sectors (6.4) impacts positively the achievement of the sustainable management and efficient use of natural resources (12.2). Withal improving wastewater treatment makes a significant contribution to SDG 13 by reducing greenhouse gas emissions. In this regard, Lahmouri et al. [116] showed that decentralizing wastewater management generates the least carbon footprint during both construction and operation phases. Not least, providing adequate and equitable sanitation and hygiene to all, but paying special attention to the needs of women and girls (6.2) enhances the progress for SDG 5.
The synergy between SDG 12 and 13 was expected. The efforts made to reach the environmentally sound management of chemicals and all wastes throughout their life cycle, as required by the law, and substantially reduce their release to air according to 12.4 target create great premises for reducing the air emissions under SDG 13. Moreover, SDG 12 focuses on the development and implementation of specific tools to monitor sustainable development impacts for sustainable tourism, which creates jobs and promotes local culture and products (12.B). This leads to a great opportunity to achieve two key targets from SDG 5: empowering women (5.B) and ensuring women’s participation for leadership at all levels of decision-making (5.5), especially as it is well known that the tourism industries employ more female than male workers [117], both in formal and informal jobs. It is important to highlight that although most people employed in tourism worldwide are female, women are not well represented in the leadership positions in the tourism industry according to United Nations World Tourism Organization (UNWTO) [118]. Therefore, it becomes necessary to pay carefully attention to tourism, which has great potential to contribute to greater gender equality. Another way to empower women is related to the SDG 13 target: promoting mechanisms for raising capacity for effective climate change-related planning and management, including focusing on women (13.B).
In addition, the Spearman correlation matrix also indicated the interactions of SDG 9 with the five goals detailed above. This may be argued by the fact that investments in clean and environmentally sound technologies (9.4) related to SDG 9 include those in energy infrastructure, clean energy technology (7.A), but also recycling and reuse technologies (6.A), showing the connections to SDG 7 and SDG 6. Moreover, all these efforts are fundamental for SDG 12 and SDG 13, as they represent a source of significantly reducing adverse impacts on the environment (12.4) and climate change (13.3). Not least, developing quality, reliable, sustainable and resilient infrastructure with a focus on affordable and equitable access for all (9.1), including women and girls, positively impacts targets related to SDG 5.
Besides this core structure of associations, both Pearson and Spearman statistics revealed two pairs of links. On the one hand, interlinkages between SDG 1 and SDG 2 were identified. Ensuring access to safe, nutritious, and sufficient food for all people is inextricably linked to poverty eradication (ICSU 2017 [5]), but eradicating poverty for all people in all its forms (1.1–1.3) also helps in reaching the SDG 2 targets related to ending hunger and malnutrition (2.1–2.3) [114]. On the other hand, interactions among SDG 14 and SDG 15 were indicated, as there is indeed connection between promoting appropriate access to the utilization of genetic resources (15.6) and providing access for small-scale artisanal fishers to marine resources (14.B).

4.2. Results Related to the Influence of Financial Information on Sustainability Reporting Based on the Multiple Linear Regression Model

4.2.1. Descriptive Statistics and Correlation Analysis

Table 7 shows the means, medians, standard deviations, minimum and maximum values for our independent, dependent, and control variables included in the regression models, for the entire sample comprising 147 observations.
As Table 7 emphasises, the highest value of the SDGS is of 79 (representing 92.9% of the maximum score level for a firm-year observation), and the lowest value is 4 (representing 4.7% of the maximum achievement level of the annual score). Furthermore, the dependent variable shows a mean of 48.580, which is also very close to the median of this variable’s data series. In terms of the availability of sustainability reports, the SR variable discloses a mean value of 0.630, hence more than half of the companies included in the sample published sustainable development or related non-financial reports. Moreover, we can observe that the majority of companies had their annual reports audited by Big 4 firms, with a mean of the AUD variable of 0.840.
In order to determine the bivariate association between variables, as well as to assess the multicollinearity assumption, the Pearson correlation analysis was applied. Table 8 presents the Pearson correlation matrix for the variables included in the regression models.
Although our findings indicate some statistically significant correlations at both the 1% and 5% levels, none of the variance inflation factors (VIF) exceed the critical value of 10, as reported in Appendix D, Table A4. On the one hand, the correlation matrix highlights a medium positive correlation between our dependent variable (SDGS) and interest expenses (INT), of 0.505 significant at the 1% level, but also a stronger positive correlation of SDGS with the R&D and other intangibles variable (RDOINT), of 0.656 at the 1% statistical significance level.
On the other hand, negative correlations above average are found between SDGS and property, plant and equipment (PPE), our control variable for firm size, but also between PPE and two of the independent variables, INT and RDOINT, respectively. All the mentioned negative correlations are significant at the 1% level.
As the Pearson coefficient reveals, there is a strong positive correlation of 0.824, statistically significant at the 1% level, between the independent variables INT and RDOINT, hence running a regression with all independent variables as a set [17,96] might have faced multicollinearity biases.
The study analysed the Pearson correlation coefficients to check for multicollinearity issues in accordance with previous studies that are also using binary variables (such as SR, AUD) [75,77,95]. However, for a more relevant interpretation of the correlations involving this type of variables, the Spearman’s rho coefficients are disclosed as well in Table 9.
The Spearman’s rho coefficients present the same or similar correlations to the Pearson’s matrix. In terms of the dichotomous variables, the strongest positive correlation with the auditor type is shown for R&D and other intangibles, with a significant (1% level) medium correlation coefficient of 0.490 for the relationship between RDOINT and AUD. The availability of sustainability reporting discloses only a weak correlation of 0.250 with the same RDOINT variable, this result being significant at the 1% level.

4.2.2. Regression Results

Similar to previous studies, we initially applied the four regression models only on the independent variables, without including the control factors [103], the obtained results being disclosed in Table 10.
Our findings show that the regression models are statistically significant at the level of 10% for ROA, and 1% for CFTURN, INT and RDOINT. Of the four independent variables, ROA has the lowest contribution on the quality of sustainability reporting based on the SDG score, with an R2 of 2.1%. This financial performance variable is followed by CFTURN (R2 of 11%), INT (R2 of 25%) and RDOINT, the latter disclosing the highest representativity of the four models, with an R2 of 43%. The fact that RDOINT is the most influential variable in explaining the variation in the companies’ SDG score might be a consequence of the association between research and development advancements and their contribution to innovation and technology. Hence, the more involved the firm is in research and development activities, the highest its achievements of the SDG targets will be. This result is also consistent with the previous findings referring to the interactions of SDG 9 with the other goals, as emphasised in Section 4.1.2 of the paper.
Table 11 shows the multiple linear regression results related to the goodness of fit and coefficients for the four models, after entering the control variables.
With respect to the models’ goodness of fit, after introducing the control variables, the hierarchy of the independent variables influencing the variation of the SDG quality score is the same as the previous, starting from an R2 of 56.6% for the regression on ROA, followed by 57.4% for CFTURN, then 59.6% obtained for the regression on INT, and the highest R2 of 63.4% achieved for the regression on RDOINT, respectively. All four models are statistically significant at the 1% level. Once again, the most influential variable is RDOINT, contrary to Seifert [90], who found no effects of R&D intensity.
In terms of the variables’ association with the variation of the sustainable development reporting quality, based on the regression coefficients disclosed in Table 11, both INT and RDOINT show a positive and statistically significant impact on SDGS at the level of 1%. On the opposite side, we find that ROA has a negative association with SDGS, but the coefficient is not significant, whereas for CFTURN there is a positive but very weak influence on the dependent variable variation explained by the model, significant at the 10% level. For ROA, the influence on the analysed phenomenon is negative, in accordance with some of the previous studies [88,119], but the result is insignificant, similar to Seifert et al. [92]. Regarding CFTURN, although very weak, the positive correlation is consistent with Seifert et al. [91]. Moreover, referring to the positive influence of the financing cost, measured through the INT variable, the results are opposed to the ones found by Orens et al. [97], which showed a negative relationship between the cost of financing and CSR disclosure. In the same line, Hoepner et al. [98] find insignificant results on the relationship between sustainability performance and the cost of debt.
Consistent with prior research [101], leverage has a negative association with sustainability reporting, shown by the negative coefficients obtained for the LEV variable, statistically significant at the level of 5% for model 3 and at the level of 10% for model 4. This implies that the larger the leverage is, the less likely it is that a firm will disclose sustainability reporting of higher quality.
Our control measure for firm size, PPE, discloses a negative and significant influence on the evolution of the SDG quality metric, with negative coefficients at the 1% significance level for the first 3 regression models and 10% for model 4, although some of the prior studies show the opposite [17,85,99,101]. This result might be explained by the fact that large firms that have already achieved a certain level of their PPE might not be willing or interested to concentrate their efforts in additional investments.
Table 11 also reveals that the variable measuring the influence of the Big 4 auditors (AUD) obtained positive significant coefficients, at the level of 1% for model 1 and 2, and 10% for model 3. Therefore, companies that have their financial statements audited by Big 4 firms are more likely to disclose a higher quality of sustainable reporting on SDGs.
The SR variable is not statistically significant for any of the four models, interpreting these findings as evidence that the availability of sustainability or similar non-financial reports does not influence the quality of sustainability reporting practices on SDGs. These findings are in opposition to the ones of Fonseca and Carvalho [77], where a similar SR dichotomous variable showed a positive significant impact on their measure of SDG quality index.
We also used dummy variables for COUNTRY and YEAR to control for their fixed effects. In this respect, of the five countries included in the analysis (CZ, HU, PL, RO, SK), we kept as reference of comparison Romania, and from the five years included in the period 2015–2019, the year chosen as reference was 2015, in order to highlight the evolution of the phenomenon compared to the first year the SDGs were set. Findings show that the country plays a statistically significant part in the evolution of the SDG score in most of the cases. The resulting coefficients show a negative influence for HU and PL, compared to RO at the level of 1% in all regression models. Furthermore, for CZ and SK, only model 4, involving RDOINT as independent variable, shows a significant negative association at the 5% level. The rest of the coefficients for these two countries are also negative, except for the one of SK in the first model, where ROA was the independent variable. Additionally, in terms of the years’ impact on the variation of the SDGs reporting quality, all the obtained coefficients are positive, and most of them are statistically significant at the 5% and 10% level, showing an improvement on the quality of sustainability reporting based on SDGs compared to 2015, when the goals were first set by the UN. This favourable finding is also sustained by the fact that the years’ coefficients are mostly increasing in values and statistical significance from 2016 to 2019, with the exception of the 2019 coefficient in model 1 which uses ROA as independent variable.
Additional details related to the regression results and coefficients statistics, with and without using the control variables are found in Appendix E, Table A5, Table A6, Table A7 and Table A8.

5. Conclusions and Limitations

This study was undertaken in order to investigate to what extent financial indicators influence sustainability reporting on SDGs, and which are those financial indicators that have the highest impact on the quality of SDG reporting. For conducting the analysis, the methodology involved two approaches, one related to determining the SDG reporting quality score, which consists of the dependent variable included in the second part of the research, and the other was based on applying multiple linear regression models involving financial performance indicators.
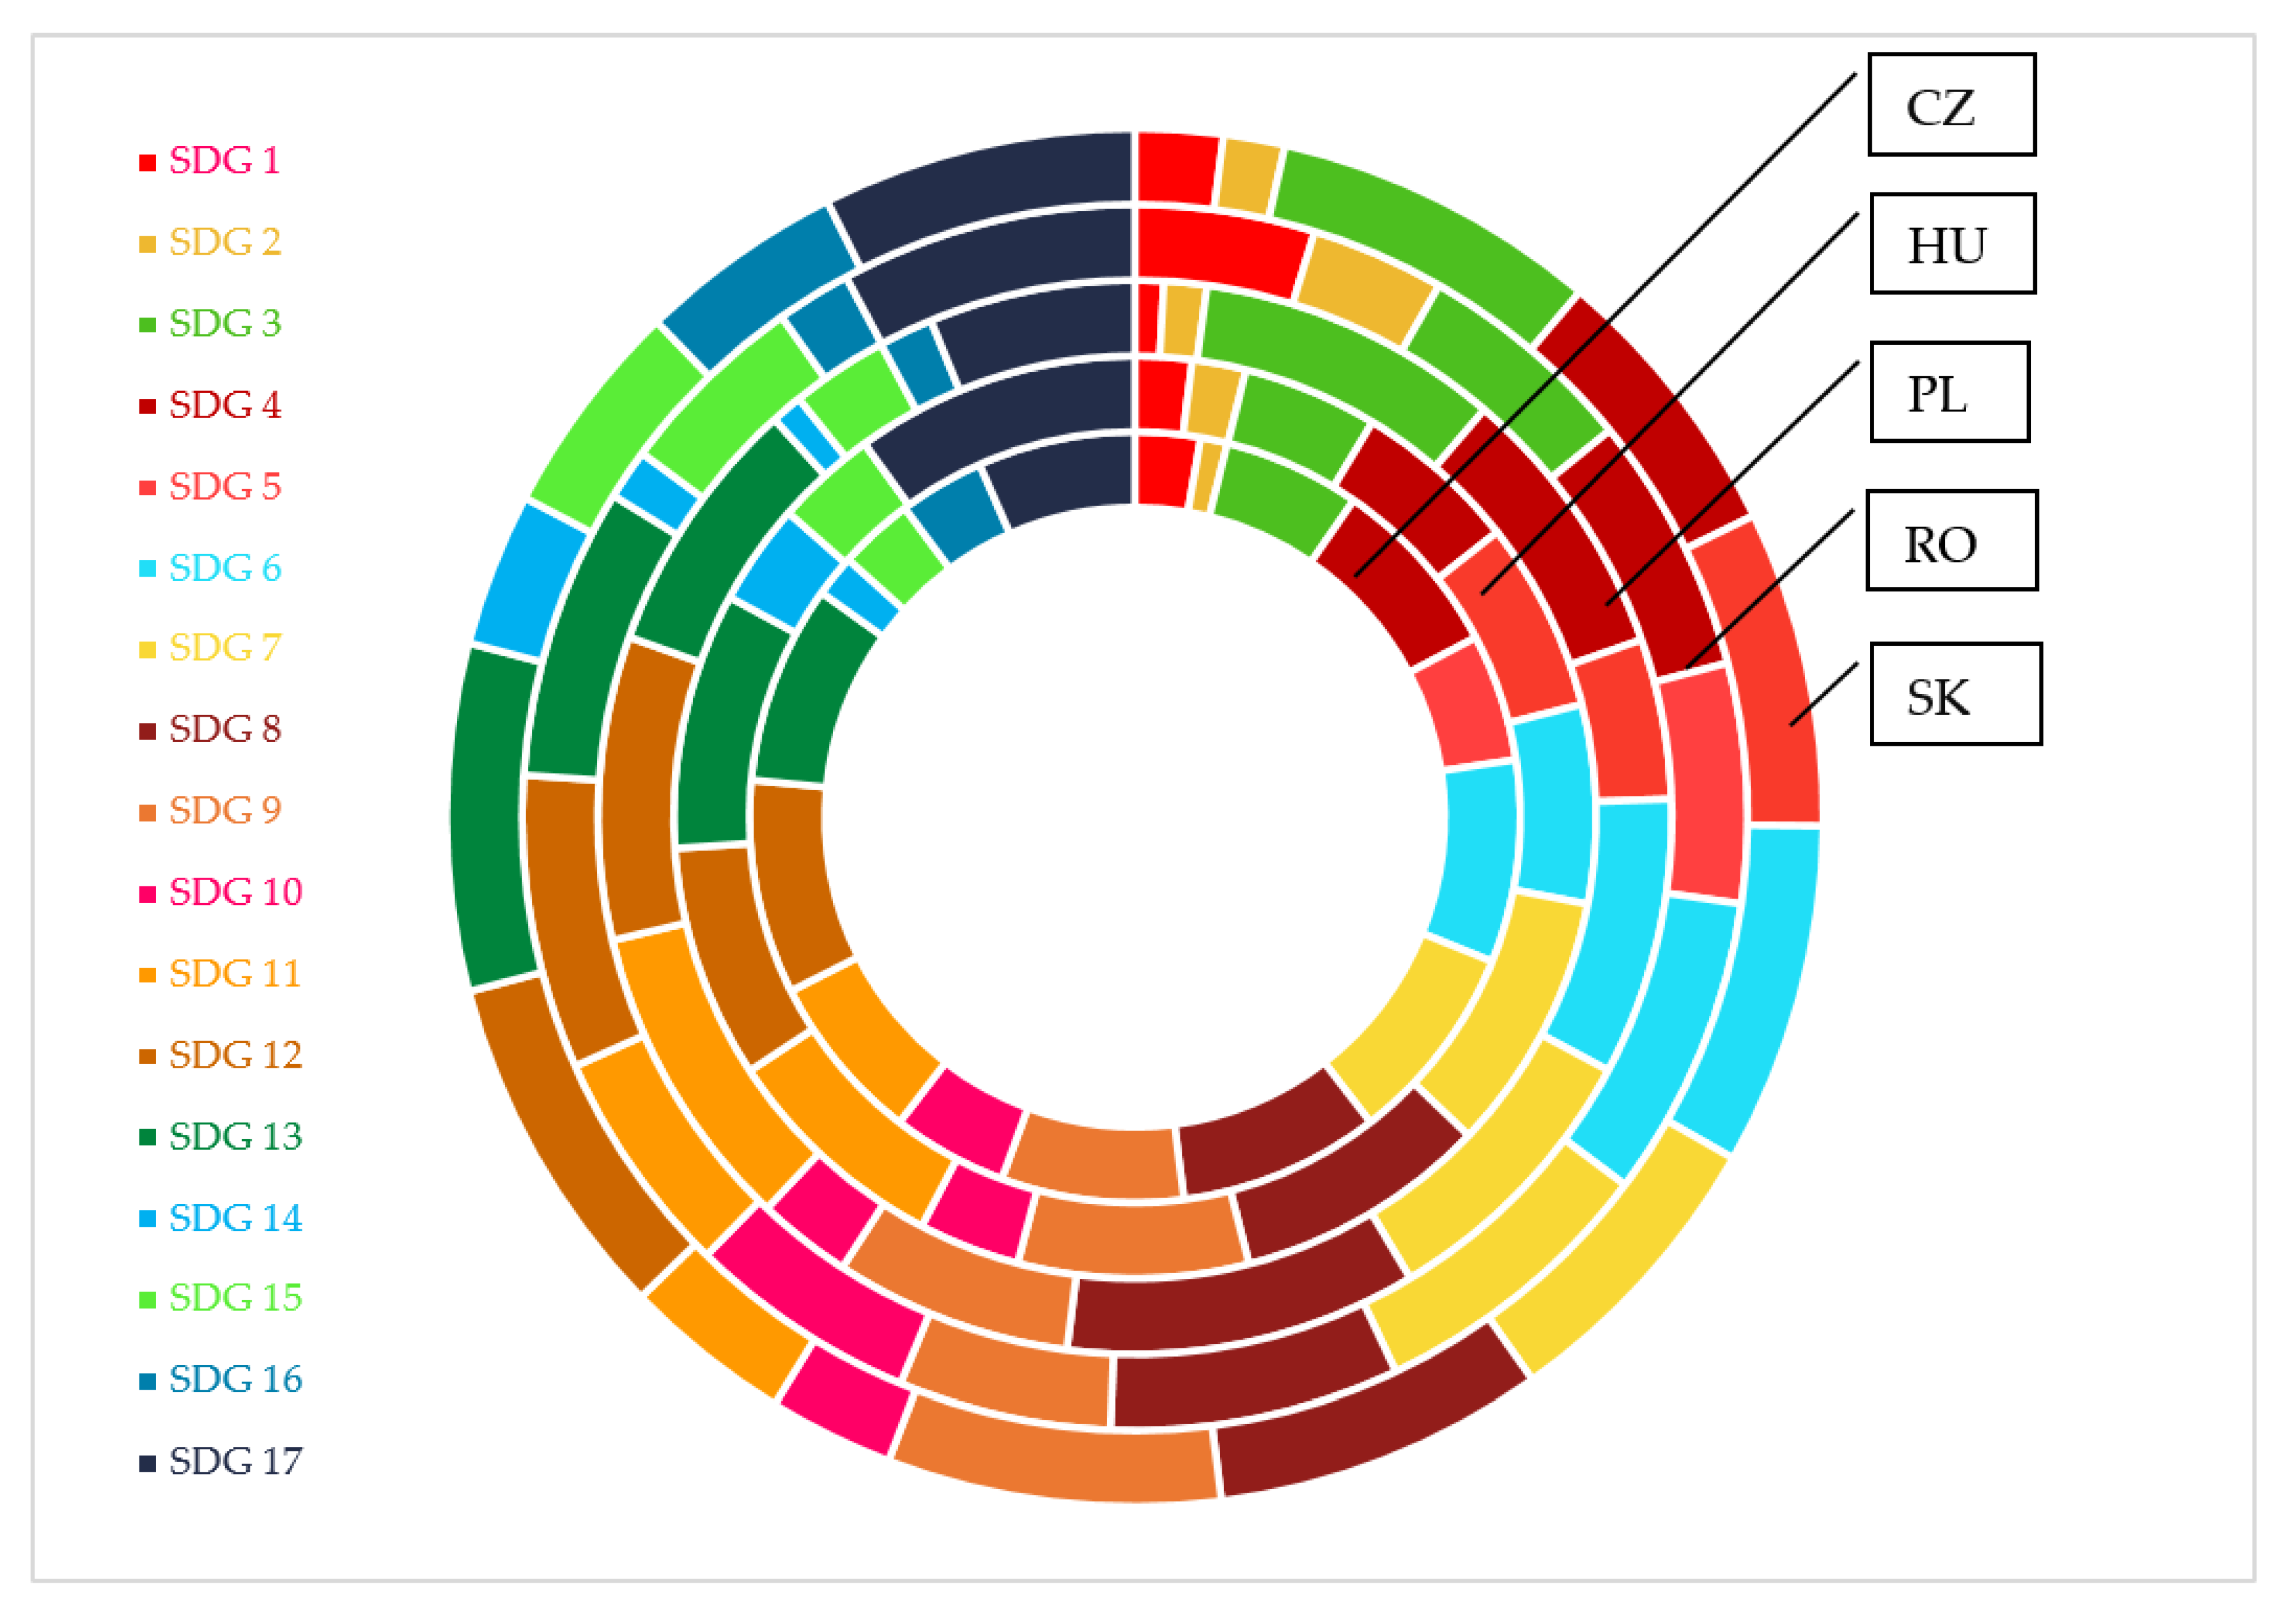
The findings related to the first section emphasise the firms’ interest in reporting SDGs by countries, by the SDGs that were allocated with the maximum score level (5), as well as interlinkages among SDGs.
The country-level analysis indicated a great interest in promoting activities for reducing the pollution of water, air and managing the waste accordingly to SDG 6, SDG 13 and SDG 12, respectively. However, the diversity of the preoccupation shown by companies on reporting the goals is also noteworthy. Thus, considering all the SDGs, Hungary and Poland reached the maximum score on five different goals (SDG 7, SDG 13, SDG 14, SDG 9, SDG 17 versus SDG 3, SDG 4, SDG 11, SDG 8, SDG 12), Slovakia and Romania achieved the highest score for three various SDGs (SDG 5, SDG 15, SDG 16 versus SDG 1, SDG 2, SGD 10), while the Czech Republic had only one goal with the best score (SDG 6).
Then, analysis was conducted to assess the number of companies that succeeded to reach the maximum score of 5 for each reported SDG, allocated only if both quantitative target and quantitative/qualitative measurement of the results were disclosed, hence showing the companies’ commitment to achieving the sustainability development goals. The information related to promoting decent work (SDG 8) has obtained the maximum score by most of the companies, and an active involvement of companies was noticed in reporting quantitative targets on water and waste management (SDG 6 and SDG 12), gas emissions (SDG 13) and even energy consumption (SDG 7) together with their achievement stages. Operating in a polluting sector, chemical companies understood the sustainable environment’s importance and they try to eliminate the negative impacts by setting targets and monitoring the results. On the contrary, just a few companies showed interest in achieving the highest score for SDG 1, SDG 2 and SDG 14.
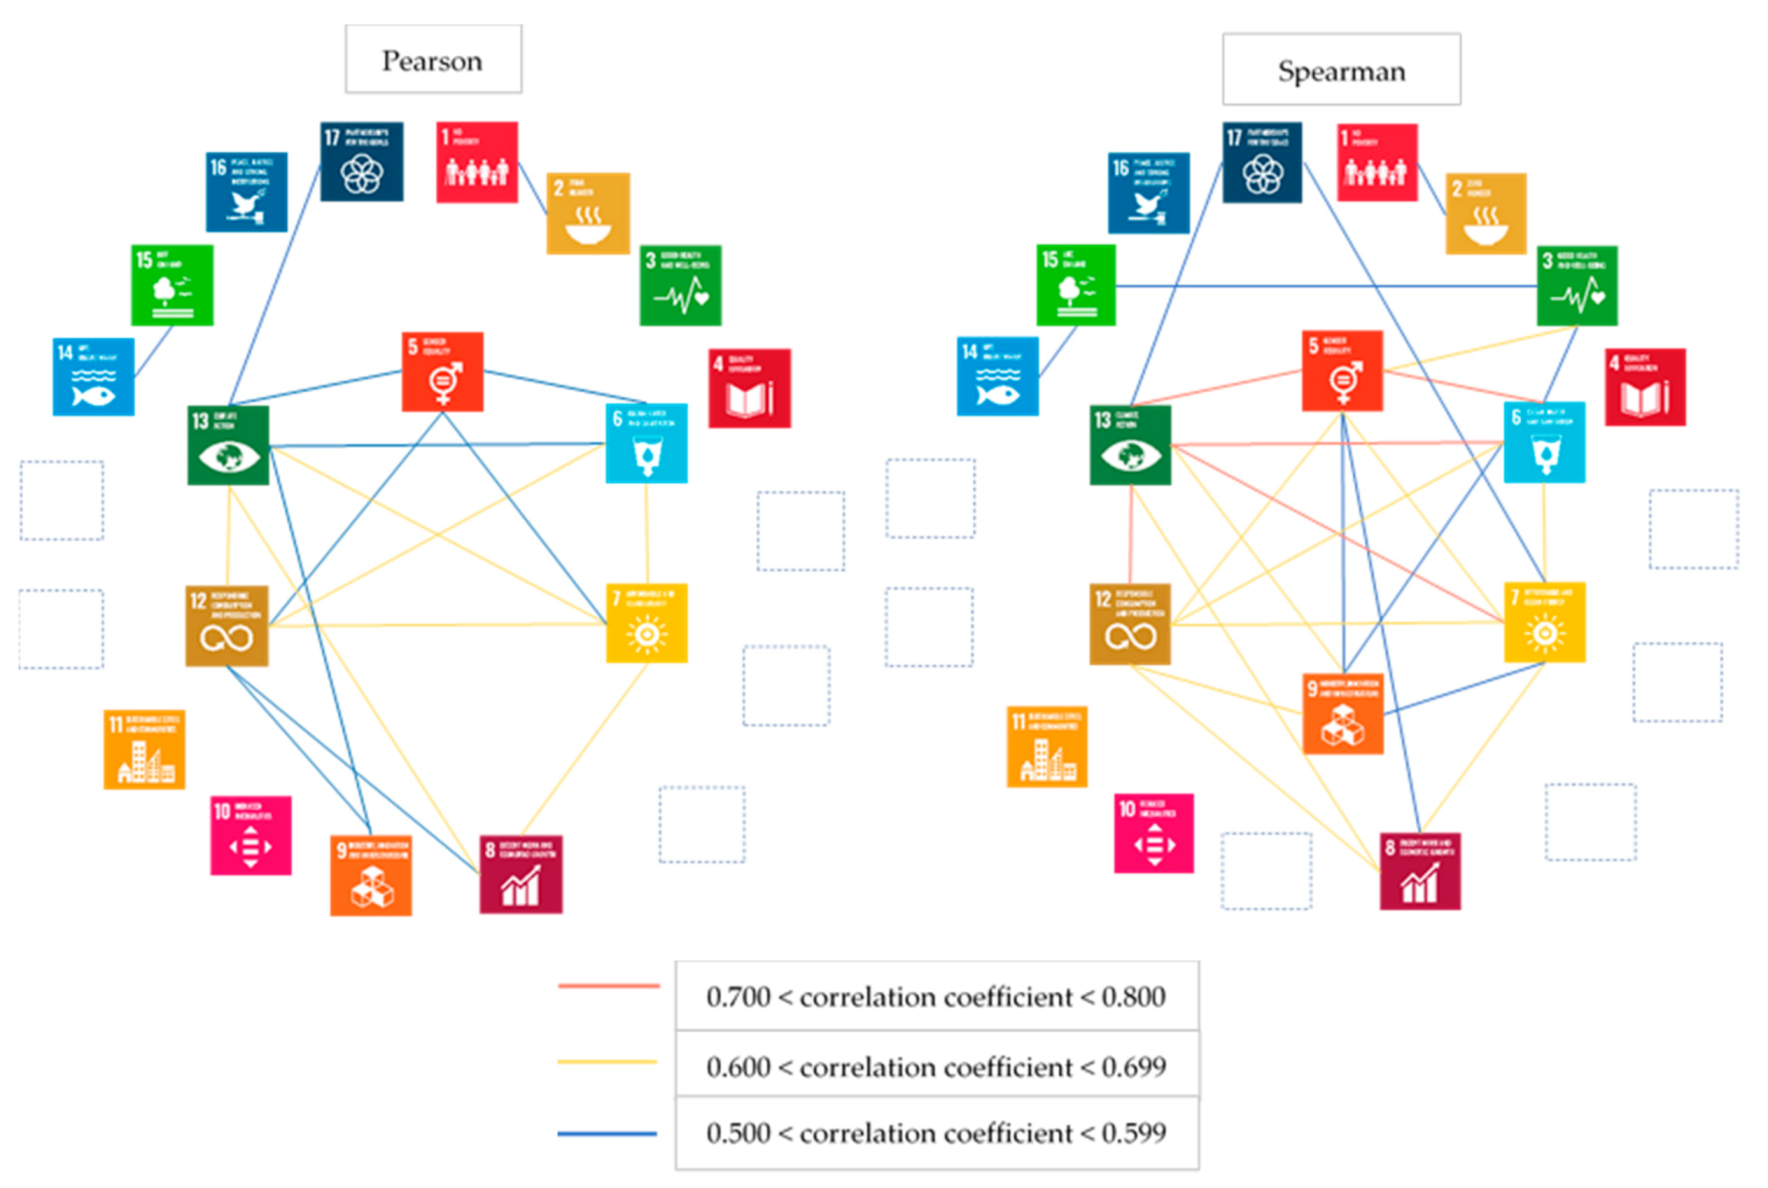
In many cases the achievement of one goal’s targets depends on the progress of another SDG due to the interactive nature of the goals. Hence, using Pearson and Spearman correlation methods, the interactions among SDGs were tested. The findings were consistent with recent studies, as indicated in Section 4.1.2. All the correlation coefficients were positive, highlighting direct associations between SDGs, and it was identified that there is a core structure of association relationships between five goals (SDG 5, SDG 6, SDG 7, SDG 12 and SDG 13) with some extension to another goal (SDG 9) under the Spearman correlation matrix. The statistics also revealed connections between SDG 1 and SDG 2 on one hand, and SDG 14 and SDG 15 on the other hand. Detailed information was provided regarding the linkages among the targets of each of these sustainable development goals.
In addition to the previous findings related to the SDGs analysis, the second section of the paper discloses the results obtained after applying the four multiple regression models. These were developed by regressing the SDGS dependent variable to each of the four independent variables based on the following financial indicators: return on assets (ROA), cash flows divided by turnover (CFTURN), interest expenses (INT), research and development costs and other intangibles (RDOINT). To control for the availability of sustainability reporting, leverage, firms’ size, as well as the influence of Big 4 auditors, the regression models also involved the following control variables: SR, LEV, PPE, AUD. Moreover, we used dummy variables to control for the fixed effects of countries and years (COUNTRY and YEAR). Our findings in terms of the models’ goodness of fit show that of the four independent variables, ROA has the lowest contribution on the quality of sustainability reporting based on the SDG score, starting from an R2 of 56.6%, followed by 57.4% for CFTURN, then 59.6% obtained for the regression on INT, and the highest R2 of 63.4% achieved for the regression on RDOINT, respectively. All four models are statistically significant at the 1% level. Hence, contrary to Seifert et al. [90], who found no effects of the R&D intensity, RDOINT is the most influential variable in explaining the variation in the companies’ SDG score, which might be explained by the association between research and development advancements and their contribution to innovation and technology. With respect to the coefficients’ statistics, both INT and RDOINT show a positive and statistically significant impact on SDGS at the level of 1%. The findings related to the INT variable are contrary to those indicated by Orens et al. [96], which were highlighting a negative relationship between the cost of financing and CSR disclosure. However, these results are statistically significant, as opposed to Hoepner et al. [98], who found that the relationship between sustainability performance and the cost of debt is insignificant.
On the opposite side, the study provides empirical evidence that ROA has a negative association with SDGS, but the result is not significant, which is consistent with some of the previous research [88,92,119]. Similar to Seifert et al. [90], for CFTURN we found a positive but very weak influence on the dependent variable variation explained by the model, significant at the 10% level.
The regression models’ coefficients show that the country plays a statistically significant part in almost all the cases in the evolution of the SDG score, showing negative coefficients for all the other analysed countries compared to RO (which was set as the reference country), with the exception of the SK coefficient in model 1. In terms of the years’ impact on the variation of the SDGs reporting quality, all the obtained coefficients are positive and show an increasing trend both in terms of values and statistical significance. These results reflect an improvement on the quality of sustainability reporting based on SDGs compared to 2015, when the goals were first set by the UN.
Like all empirical research, our study has several limitations which have to be considered while interpreting its results [86]. First of all, the research is based on a limited sample, which was a consequence of the reports’ unavailability for half of the companies initially considered in the analysis. This was also related to the fact that the sample selection did not take into account whether the firms were listed or private, as including only publicly trading entities would have probably led to an increase of the reports’ availability, hence, of the sample. Secondly, subjectivity is an issue in any approach that involves textual or content analysis as a research method. This is also the case when dealing with data hand collection, which is prone to biases.
Further studies might focus on expanding the sample and emphasising a comparison between private and listed companies. Additionally, a development of the SDG score methodology could be suitable for an in-depth assessment of the SDGs’ reporting quality.

Author Contributions

All authors wrote the paper, but their primary individual contributions were as follows: introduction, E.N., C.L.M. and E.-M.N.; literature review, E.-M.N.; methodology, E.N.; data collection, E.N., C.L.M., E.-M.N., A.-M.I. and D.M.; software, E.N. and C.L.M.; validation, E.N.; results E.N. and C.L.M.; conclusions E.N. and C.L.M.; writing—review and editing, E.N., C.L.M., E.-M.N., A.-M.I. All authors have read and agreed to the published version of the manuscript.

Funding

This research received no external funding.

Acknowledgments

This research paper has been prepared as a part of the Human Capital Operational Program 2014–2020, project number POCU/380/6/13/125245 no. 36482/23.05.2019, “Excellence in interdisciplinary Ph.D. and post-Ph.D. research, career alternatives through entrepreneurial initiative (EXCIA)”, coordinated by the Bucharest University of Economic Studies.

Conflicts of Interest

The authors declare no conflict of interest.

Appendix A

Table A1. List of sustainable development goals as defined by the UN’s 2030 Agenda.
Goal No.Goal NameGoal Description
SDG 1No povertyEnd poverty in all its forms everywhere
SDG 2Zero hungerEnd hunger, achieve food security and improved nutrition and promote sustainable agriculture
SDG 3Good health and well-beingEnsure healthy lives and promote well-being for all at all ages
SDG 4Quality educationEnsure inclusive and equitable quality education and promote lifelong learning opportunities for all
SDG 5Gender equalityAchieve gender equality and empower all women and girls
SDG 6Clean water and sanitationEnsure availability and sustainable management of water and sanitation for all
SDG 7Affordable and clean energyEnsure access to affordable, reliable, sustainable and modern energy for all
SDG 8Decent work and economic growthPromote sustained, inclusive and sustainable economic growth, full and productive employment and decent work for all
SDG 9Industry, innovation and infrastructureBuild resilient infrastructure, promote inclusive and sustainable industrialization and foster innovation
SDG 10Reduced inequalitiesReduce inequality within and among countries
SDG 11Sustainable cities and communitiesMake cities and human settlements inclusive, safe, resilient and sustainable
SDG 12Responsible consumption and productionEnsure sustainable consumption and production patterns
SDG 13Climate actionTake urgent action to combat climate change and its impacts
SDG 14Life below waterConserve and sustainably use the oceans, seas and marine resources for sustainable development
SDG 15Life on landProtect, restore and promote sustainable use of terrestrial ecosystems, sustainably manage forests, combat desertification, and halt and reverse land degradation and halt biodiversity loss
SDG 16Peace, justice and strong institutionsPromote peaceful and inclusive societies for sustainable development, provide access to justice for all and build effective, accountable and inclusive institutions at all levels
SDG 17Partnerships for the goalsStrengthen the means of implementation and revitalize the global partnership for sustainable development
Source: UN 2030 Agenda [1].

Appendix B

Table A2. Sampled firms by countries and operating revenues.
Company Index (Based on Country Code)Operating Revenues (USD) 1Included in the Regression Analysis
CZ 15,968,704,830Yes
CZ 2802,022,732No
CZ 3386,388,584Yes
CZ 4262,469,955Yes
CZ 5256,880,073No
CZ 6226,364,682Yes
CZ 7220,639,000No
CZ 8209,550,213Yes
CZ 9191,404,081Yes
HU 101,665,506,988Yes
HU 111,367,451,539Yes
HU 121,261,032,841Yes
HU 131,163,178,061Yes
HU 14682,894,884Yes
HU 15595,539,660No
HU 16590,802,508Yes
HU 17291,996,860Yes
HU 18259,406,869Yes
HU 19226,168,200Yes
HU 20178,725,209Yes
PL 212,961,877,789Yes
PL 222,157,861,581Yes
PL 231,670,422,975Yes
PL 241,489,296,585Yes
PL 25953,582,868Yes
PL 26856,937,347No
PL 27760,174,322Yes
PL 28738,711,505Yes
PL 29629,529,943Yes
RO 303,481,218,877Yes
RO 31387,078,394No
RO 32346,516,670No
RO 33239,220,901Yes
RO 34173,969,181Yes
RO 35132,282,460Yes
RO 3693,737,228Yes
RO 3770,431,109Yes
RO 3843,210,526Yes
SK 394,635,832,605Yes
SK 40232,277,026No
SK 41203,633,573Yes
SK 42146,635,175Yes
SK 43143,273,702Yes
SK 44137,150,959Yes
SK 45124,474,698Yes
SK 46120,772,521No
SK 4788,712,119Yes
Number of companies included in the SDG score analysis47
Number of companies included in the regression analysis (before outliers check)38
1 As reported on ISI Emerging Markets Group’s EMIS platform [70]: https://www.emis.com/countries.

Appendix C

Table A3. Details regarding the SDGs score assessment.
ScoreTargetsMeasurementsDescriptionExampleParticular Case: Donations/SponsorshipsParticular Case: Partnerships
0--No information disclosed with respect to a specific goal/no target to fulfil
1Tc-SDG with qualitative target, but no results measured and reported yet: there is a qualitative ambition for the company (i.e., narrative description about company plans to take action on those targets), but no information about reporting any obtained results on the progress towards the SDG target.As SDG target 12.5 explains, substantially reducing waste generation is a priority for society, and the company wants to engage in/agrees to take actions/supports/starts projects addressing the decrease of waste generation.As SDG target 12.5 explains, substantially reducing waste generation is a priority for society, and the company wants to/agrees to/plans to make a donation/sponsorship for the decrease of waste generation.As SDG target 12.5 explains, substantially reducing waste generation is a priority for society, and the company wants to/plans to build partnerships for the decrease of waste generation.
2Tc + Eq-SDG with qualitative target and quantitative efforts invested, but no results measured and reported yet: there is a qualitative ambition for the company (i.e., narrative description about company plans to take action on those targets) and investments were made, but no information about reporting any obtained results on the progress towards the SDG target.As SDG target 12.5 explains, substantially reducing waste generation is a priority for society, the company wants to engage in/agrees to take actions/supports/starts projects and has invested the amount of X € for the decrease of waste generation.Not applicable for donations/sponsorships/partnerships.
Tq-SDG with quantitative target, but no results measured and reported yet: there is a quantitative ambition for the company (i.e., company has set quantified measures that it is aiming for in the future), but no information about reporting any obtained results on the progress towards the SDG target.As SDG target 12.5 explains, substantially reducing waste generation is a priority for society, and the company wants to ensure a decrease of waste generation with 20% (by 2025).As SDG target 12.5 explains, substantially reducing waste generation is a priority for society, and the company plans to donate/provide a sponsorship of X €/donate twice as many as the previous year to ensure the decrease of waste generation.As SDG target 12.5 explains, substantially reducing waste generation is a priority for society, and the company wants to/plans to sign X partnerships/twice as many partnerships as the previous year for the decrease of waste generation.
3TcMcSDG with qualitative target and qualitative measurement of the result(s) reported on the progress: there is a qualitative ambition for the company (i.e., narrative description about company plans to take action on those targets) and a qualitative assessment of the obtained results on the progress towards the SDG target is disclosed (i.e., narrative description of the effects of those actions).As SDG target 12.5 explains, substantially reducing waste generation is a priority for society, the company wants to engage in/supports the decrease of waste generation and the entity succeeded in keeping the waste generation below the limit imposed by the legislation/the target was achieved/the target is partially achieved.As SDG target 12.5 explains, substantially reducing waste generation is a priority for society, and the company donated goods/made a donation/provided a sponsorship for the decrease of waste generation, without mentioning any figures.As SDG target 12.5 explains, substantially reducing waste generation is a priority for society, and the company signed partnerships for the decrease of waste generation.
4TcMqSDG with qualitative target and quantitative measurement of the result(s) reported on the progress: there is a qualitative ambition for the company (i.e., narrative description about company plans to take action on those targets) and a quantitative assessment of the obtained results on the progress towards the SDG target is disclosed.As SDG target 12.5 explains, substantially reducing waste generation is a priority for society, the company wants to engage in/supports the decrease of waste generation and the entity succeeded in reducing it with 20%/with 4% compared to the previous year.As SDG target 12.5 explains, substantially reducing waste generation is a priority for society, and the company donated a number of X goods/made a donation/provided a sponsorship in amount of X € for the decrease of waste generation.As SDG target 12.5 explains, substantially reducing waste generation is a priority for society, and the company signed partnerships which led to the decrease of waste generation with 5%.
5TqMcSDG with quantitative target and qualitative measurement of the result(s) reported on the progress: there is a quantitative ambition for the company and a qualitative assessment of the obtained results on the progress towards the SDG target is disclosed (i.e., narrative description of the effects of those actions).As SDG target 12.5 explains, substantially reducing waste generation is a priority for society, the company wants to engage in/supports the decrease of waste generation with 50% (by 2025) and the entity succeeded in keeping the waste generation below the limit imposed by the legislation/the target was achieved/the target is partially achieved.As SDG target 12.5 explains, substantially reducing waste generation is a priority for society, the company wants to/planned to donate X €/twice more than the previous year for the decrease of waste generation and the entity reached/partially reached its target (qualitative assessment).As SDG target 12.5 explains, substantially reducing waste generation is a priority for society, the company wants to/planned to sign X partnerships/X%/twice more partnerships than the previous year for the decrease of waste generation and the entity reached/partially reached its target (qualitative assessment).
TqMqSDG with quantitative target and quantitative measurement of the result(s) reported on the progress: there is a quantitative ambition for the company and a quantitative assessment of the obtained results on the progress towards the SDG target is disclosed.As SDG target 12.5 explains, substantially reducing waste generation is a priority for society, the company wants to engage in/supports the decrease of waste generation with 50% (by 2025) and the entity succeeded in reducing it with 20%/with 4% compared to the previous year.As SDG target 12.5 explains, substantially reducing waste generation is a priority for society, the company wants to/planned to donate X €/twice more than the previous year for the decrease of waste generation and the entity donated 20% of the planned amount/donated Y € (quantitative assessment).As SDG target 12.5 explains, substantially reducing waste generation is a priority for society, the company wants to/planned to sign X partnerships/X%/twice more partnerships than the previous year for the decrease of waste generation and the entity signed two partnerships/achieved 20% of its target up to date (qualitative assessment).
Tc = Qualitative target; Tq = Quantitative target; Eq = Quantitative effort invested; Mc = Qualitative measurement of the result; Mq = Quantitative measurement of the result.

Appendix D

As mentioned in Section 3.3.4., Appendix D discloses the results of statistical tests applied in order to ensure the validity of the regression models.
In order to assess the linear relationship between the dependent and the independent variables, as well as the homoscedasticity assumption, the plots of studentized residuals against the predicted values in Figure A1 were analysed. The visual inspection lead to the assessment that the two assumptions are met.
Figure A1. Plots of studentized residuals against the predicted values for linearity and homoscedasticity checks.
Sustainability 12 09251 g0a1
To test the validity of the multiple linear regression models in relation to the assumption that the sampled date should not show multicollinearity, we analysed the tolerance and VIF indicators [109].
Table A4. Tolerance and variance inflation factors (VIF) statistics of the four regression models.
Model/Independent VariableModel 1, Equation (2)Model 2, Equation (3)Model 3, Equation (4)Model 4, Equation (5)
ROACFTURNINTRDOINT
ToleranceVIFToleranceVIFToleranceVIFToleranceVIF
Independent variable0.8011.2490.6141.6290.4562.1920.2513.983
SR0.7711.2970.7551.3240.7531.3280.7511.332
LEV0.8761.1410.9021.1080.8101.2350.8811.135
PPE0.7631.3110.7781.2860.5731.7470.3333.004
AUD0.7481.3370.7771.2870.7311.3680.5941.685
CZ0.5541.8060.5491.8210.5551.8030.5461.832
HU0.4552.2000.4632.1610.4022.4880.4182.395
PL0.5271.8970.5281.8930.5291.8910.5301.888
SK0.4662.1450.3552.8140.4582.1850.4332.311
20160.5991.6680.5991.6690.5991.6690.5991.669
20170.5661.7670.5711.7500.5691.7580.5691.759
20180.5751.7400.5751.7380.5761.7370.5751.740
20190.5701.7550.5831.7140.5841.7120.5811.720
As shown in Table A4, tolerance and VIF statistics of the four regression models., the tolerance and VIF statistical indicators for all the variables included in all four regression models are within the normal intervals to conclude that the data reflects no multicollinearity issues (tolerance is greater than 0.1 and VIF is smaller than 10).
Furthermore, in order to test the normality of residuals, the histograms and P-Plots disclosed in Figure A2 were inspected.
Figure A2. Histograms and P-Plots for the normality of residuals assumption check.
Sustainability 12 09251 g0a2aSustainability 12 09251 g0a2b
The visual inspection of the histograms and P-Plots leads to the assessment that the normality of residuals is met.

Appendix E

Table A5, Table A6, Table A7 and Table A8 disclose the detailed coefficients statistics of the 4 multiple linear regression models.
Table A5. Coefficients statistics for the regression model of SDGS on ROA.
Model 1, Equation (2)BStd. ErrorStandardized BetatSig.
Without control variables:
Intercept45.7352.089 21.8920.000
ROA46.240 *26.4720.1441.7470.083
With control variables:
Intercept62.746 ***4.464 14.0560.000
ROA−15.51020.553−0.048−0.7550.452
SR−2.5452.150−0.077−1.1840.239
LEV−0.4860.464−0.064−1.0480.297
PPE−45.658 ***5.616−0.532−8.1300.000
AUD7.762 ***2.8480.1802.7260.007
Czech Republic−4.3223.309−0.100−1.3060.194
Hungary−8.658 ***3.084−0.238−2.8080.006
Poland−18.128 ***3.073−0.464−5.8980.000
Slovakia0.1643.3070.0040.0500.961
20163.0752.9540.0771.0410.300
20175.598 *2.9660.1431.8870.061
20185.94 **2.9430.1522.0180.046
20194.8783.0300.1221.6100.110
Significance at the level of: *** p < 0.01; ** p < 0.05; * p < 0.10.
Table A6. Coefficients statistics for the regression model of SDGS on CFTURN.
Model 2, Equation (3)BStd. ErrorStandardized BetatSig.
Without control variables:
Intercept47.102 ***1.296 36.3450.000
CFTURN0.000 ***0.0000.3324.2440.000
With control variables:
Intercept61.378 ***4.156 14.7690.000
CFTURN0.000 *0.0000.1281.7670.079
SR−3.0392.152−0.092−1.4120.160
LEV−0.3560.453−0.047−0.7870.433
PPE−43.825 ***5.510−0.510−7.9540.000
AUD7.705 ***2.7670.1792.7850.006
Czech Republic−4.7983.292−0.111−1.4580.147
Hungary−8.506 ***3.027−0.234−2.8100.006
Poland−18.278 ***3.041−0.468−6.0110.000
Slovakia−3.0523.753−0.077−0.8130.418
20163.1812.9270.0791.0870.279
20175.331 *2.9240.1361.8230.071
20186.15 **2.9140.1572.1110.037
20195.487 *2.9660.1371.8500.067
Significance at the level of: *** p < 0.01; ** p < 0.05; * p < 0.10.
Table A7. Coefficients statistics for the regression model of SDGS on INT.
Model 3, Equation (4)BStd. ErrorStandardized BetatSig.
Without control variables:
Intercept−5.8717.822 −0.7510.454
INT3.061 *0.4350.5057.0370.000
With control variables:
Intercept32.730 ***9.784 3.3450.001
INT1.603 ***0.4950.2643.2400.002
SR−1.4032.099−0.042−0.6680.505
LEV−0.916 **0.466−0.120−1.9680.051
PPE−34.321 ***6.255−0.400−5.4870.000
AUD5.008 *2.7790.1161.8020.074
Czech Republic−4.4813.190−0.104−1.4050.162
Hungary−12.068 ***3.164−0.331−3.8140.000
Poland−17.428 ***2.960−0.446−5.8870.000
Slovakia−1.2303.221−0.031−0.3820.703
20163.3112.8510.0831.1610.248
20176.005 **2.8550.1542.1040.037
20186.079 **2.8370.1562.1430.034
20195.543 *2.8870.1381.9200.057
Significance at the level of: *** p < 0.01; ** p < 0.05; * p < 0.10.
Table A8. Coefficients statistics for the regression model of SDGS on RDOINT.
Model 4, Equation (5)BStd. ErrorStandardized BetatSig.
Without control variables:
Intercept−18.148 ***6.461 -2.8090.006
RDOINT3.273 ***0.3130.65610.4540.000
With control variables:
Intercept6.38111.660 0.5470.585
RDOINT2.624 ***0.5230.5255.0170.000
SR−0.8022.002−0.024−0.4010.689
LEV−0.788 *0.425−0.104−1.8530.066
PPE−15.129 *7.813−0.176−1.9360.055
AUD0.0752.9370.0020.0250.980
Czech Republic−6.183 **3.063−0.143−2.0180.046
Hungary−13.000 ***2.957−0.357−4.3970.000
Poland−18.429 ***2.817−0.472−6.5410.000
Slovakia−4.0653.155−0.103−1.2880.200
20163.3992.7150.0851.2520.213
20176.308 **2.7190.1612.3200.022
20185.513 **2.7040.1412.0390.043
20196.302 **2.7570.1572.2860.024
Significance at the level of: *** p < 0.01; ** p < 0.05; * p < 0.10.

References

  1. United Nations. Transforming our world: The 2030 Agenda for Sustainable Development 2015. Available online: https://sustainabledevelopment.un.org/content/documents/21252030%20Agenda%20for%20Sustainable%20Development%20web.pdf (accessed on 30 August 2020).
  2. Barbier, E.B.; Burgess, J.C. The Sustainable Development Goals and the Systems Approach to Sustainability. In Economics Discussion Papers; Kiel Institute for the World Economy: Kiel, Germany, 2017; p. 28. [Google Scholar]
  3. Pradhan, P.; Costa, L.; Rybski, D.; Lucht, W.; Kropp, J.P. A systematic study of Sustainable Development Goal (SDG) interactions. Earth Future 2017, 5, 1169–1179. [Google Scholar] [CrossRef] [Green Version]
  4. ICSU. A Guide to SDG Interactions: From Science to Implementation. Available online: https://council.science/wp-content/uploads/2017/05/SDGs-Guide-to-Interactions.pdf (accessed on 5 November 2020).
  5. Singh, G.G.; Cisneros-Montemayora, A.M.; Swartz, W.; Cheung, W.; Guy, J.A.; Otak, Y. A rapid assessment of co-benefits and trade-offs among Sustainable Development Goals. Mar. Policy 2018, 93, 223–231. [Google Scholar] [CrossRef]
  6. Nerini, F.; Tomei, J.; To, L.S.; Bisaga, I.; Parikh, P.; Black, M.; Borrion, A.; Spataru, C.; Broto, V.; Anandarajah, G.; et al. Mapping synergies and trade-offs between energy and the Sustainable Development Goals. Nat. Energy 2018, 3, 10–15. [Google Scholar] [CrossRef] [Green Version]
  7. Fonseca, L.M.; Domingues, J.P.; Dima, A.M. Mapping the Sustainable Development Goals Relationships. Sustainability 2020, 12, 3359. [Google Scholar] [CrossRef] [Green Version]
  8. European Union. EU Reporting on Sustainability and UN Development Goals Still Lacking, Warn Auditors. Available online: https://www.eca.europa.eu/en/Pages/NewsItem.aspx?nid=12287 (accessed on 30 July 2020).
  9. Directive 2014/95/EU of the European Parliament and of the Council. Disclosure of non-financial and diversity information by certain large undertakings and groups. Off. J. Eur. Union 2014, 57, 4–5. Available online: https://eur-lex.europa.eu/eli/dir/2014/95/oj (accessed on 10 November 2020).
  10. Alshehhi, A.; Nobanee, H.; Khare., N. The Impact of Sustainability Practices on Corporate Financial Performance: Literature Trends and Future Research Potential. Sustainability 2018, 10, 494. [Google Scholar] [CrossRef] [Green Version]
  11. Ameer, R.; Othman, R. Sustainability Practices and Corporate Financial Performance: A Study Based on the Top Global Corporations. J. Bus. Ethics 2012, 108, 61–79. [Google Scholar] [CrossRef]
  12. Arlow, P.; Gannon, M. Social responsiveness, corporate structure, and economic performance. Acad. Manag. Rev. 1982, 7, 235–241. [Google Scholar] [CrossRef]
  13. Burhan, A.H.N.; Rahmanti, W. The impact of sustainable reporting on companies’ performance. J. Econ. Bus. Acc. Ventur. 2012, 15, 257–272. [Google Scholar] [CrossRef]
  14. Cho, C.H.; Patten, D.M. The role of environmental disclosures as tools of legitimacy: A research note. Acc. Organ. Soc. 2007, 32, 639–647. [Google Scholar] [CrossRef]
  15. Herremans, I.; Akathaporn, P.; McInnes, M. An investigation of corporate social responsibility Reputation and economic performance. Account. Organ. Soc. 1993, 18, 587–604. [Google Scholar] [CrossRef]
  16. Laskar, N.; Chakraborty, T.K.; Maji, S.G. Corporate Sustainability Performance and Financial Performance: Empirical Evidence from Japan and India. Manag. Labour Stud. 2017, 42, 88–106. [Google Scholar] [CrossRef]
  17. McGuire, J.B.; Sundgren, A.; Schneeweis, T. Corporate Social Responsibility and Firm Financial Performance Source. Acad. Manag. J. 1988, 31, 854–872. [Google Scholar]
  18. McWilliams, A.; Siege, D. Corporate Social Responsibility and Financial Performance: Correlation or Misspecification? Strateg. Manag. J. 2000, 21, 603–609. [Google Scholar] [CrossRef]
  19. Ortas, E.; Gallego-Alvarez, I.; Etxeberria, I.A. Financial factors influencing the quality of corporate social responsibility and environmental management disclosure: A quantile regression approach. Corp. Soc. Responsib. Environ. Manag. 2015, 22, 362–380. [Google Scholar] [CrossRef]
  20. Siew, R.Y.J.; Balatbat, M.C.A.; Carmichael, D.G. The relationship between sustainability practices and financial performance of construction companies. Smart Sustain. Built Environ. 2013, 2, 6–27. [Google Scholar] [CrossRef]
  21. Ullmann, A. Data in search of a theory: A critical examination of the relationships among social performance, social disclosure, and economic performance. Acad. Manag. Rev. 1985, 10, 540–577. [Google Scholar]
  22. Brown, H.S.; de Jong, M.; Levy, D.L. Building institutions based on information disclosure: Lessons from GRI’s sustainability reporting. J. Clean. Prod. 2009, 17, 571–580. [Google Scholar] [CrossRef]
  23. Corporate Citizenship. The SDGs: Materially impacting the bottom line 2018 Annual Review of Progress on the Global Goals. 2018. Available online: https://corporate-citizenship.com/wp-content/uploads/The-SDGs-Materially-Impacting-the-Bottom-Line-FINAL.pdf (accessed on 20 August 2020).
  24. EY. Why Sustainable Development Goals should be in Your Business Plan. 2017. Available online: www.ey.com/en_gl/assurance/why-sustainable-development-goals-should-be-in-your-business-plan (accessed on 20 August 2020).
  25. KPMG. How to Report on the SDGs: What Good Looks Like and Why it Matters. 2018. Available online: https://home.kpmg/xx/en/home/insights/2018/02/how-to-report-on-the-sdgs.html (accessed on 20 August 2020).
  26. PwC. SDG Reporting Challenge 2017. Exploring Business Communication on the Global Goals. 2017. Available online: https://www.pwc.com/gx/en/sustainability/SDG/pwc-sdg-reporting-challenge-2017-final.pdf (accessed on 20 August 2020).
  27. Adams, C.A.; Frost, G.R. Integrating sustainability reporting into management practices. Account. Forum 2008, 32, 288–302. [Google Scholar] [CrossRef]
  28. Ching, H.Y.; Gerab, F.; Toste, T.H. The Quality of Sustainability Reports and Corporate Financial Performance: Evidence from Brazilian Listed Companies. SAGE Open 2017, 1–9. [Google Scholar] [CrossRef]
  29. Firmansyah, I. The Role of Accountants in Achieving Sustainable Development Goals: Academics Perspective. J. Ilm. Akunt. Dan Bisnis 2019, 14, 2. [Google Scholar]
  30. Makarenko, I.; Plastun, A. The role of accounting in sustainable development. Account. Financ. Control 2017, 1, 2. [Google Scholar] [CrossRef] [Green Version]
  31. Schaltegger, S.; Etxeberria, I.A.; Ortas, E. Innovating Corporate Accounting and Reporting for Sustainability—Attributes and Challenges. Sustain. Dev. 2017, 25, 113–122. [Google Scholar] [CrossRef] [Green Version]
  32. Wackernagel, M.; Hanscom, L.; Lin, D. Making the Sustainable Development Goals Consistent with Sustainability. Front. Energy Res. 2017, 5, 18. [Google Scholar] [CrossRef] [Green Version]
  33. Beddoe, R.; Costanza, R.; Farley, J.; Garza, E.; Kent, J.; Kubiszewski, I.; Martinez, L.; McCowen, T.; Murphy, K.; Myers, N.; et al. Overcoming systemic road-blocks to sustainability: The evolutionary redesign of worldviews, institutions, and technologies. Proc. Natl. Acad. Sci. USA 2009, 106, 2483–2489. [Google Scholar] [CrossRef] [PubMed] [Green Version]
  34. Deegan, C.; Rankin, M. Do Australian companies report environmental news objectively? An analysis of environmental disclosures by firms prosecuted successfully by the Environmental Protection Authority. Account. Audit. Account. J. 1996, 9, 52–69. [Google Scholar] [CrossRef]
  35. Sachs, J.D. From Millennium Development Goals to Sustainable Development Goals. Lancet 2012, 379, 2206–2211. [Google Scholar] [CrossRef]
  36. Maciková, L.; Smorada, M.; Dorčák, P.; Beug, B.; Markovič, P. Financial Aspects of Sustainability: An Evidence from Slovak Companies. Sustainability 2018, 10, 2274. [Google Scholar] [CrossRef] [Green Version]
  37. Koch, F. The New Corporate Philanthropy. How Society and Business Can Profit; Plenum Press: New York, NY, USA, 1979. [Google Scholar]
  38. Mori, R., Jr.; Wyatt, R.; Nuttall, A. ASX 20 Disclosures on the Sustainable Development Goals Commitment, Structure, Action and Measurement. Research Report. Available online: https://www.researchgate.net/profile/Renzo_Junior/publication/337335851_SDG_Measurement_and_Disclosure_By_ASX150/links/5dd340644585156b351e9180/SDG-Measurement-and-Disclosure-By-ASX150.pdf (accessed on 5 November 2020).
  39. EY. Sustainability Reporting—The Time is Now. 2014. Available online: https://www.ey.com/Publication/vwLUAssets/EY-Sustainability-reporting-the-time-is-now/$FILE/EY-Sustainability-reporting-the-time-is-now.pdf (accessed on 20 August 2020).
  40. KPMG. The Road Ahead The KPMG Survey of Corporate Responsibility Reporting. 2017. Available online: https://assets.kpmg/content/dam/kpmg/xx/pdf/2017/10/kpmg-survey-of-corporate-responsibility-reporting-2017.pdf (accessed on 20 August 2020).
  41. Epstein, M.J.; Roy, M.J. Sustainability in action: Identifying and measuring key performance drivers. Long Range Plan. 2001, 34, 585–604. [Google Scholar] [CrossRef]
  42. EY and Boston College Center for Corporate Citizenship. Value of Sustainability Reporting; Boston College Center for Corporate Citizenship: Boston, MA, USA, 2016. [Google Scholar]
  43. Tenuta, P. The measurement of sustainability. Rev. Bus. Res. 2010, 10, 163–171. [Google Scholar]
  44. Spicer, B.H. Investors, corporate social performance, and information disclosure: An empirical study. Account. Rev. 1978, 53, 94–111. [Google Scholar]
  45. Schramade, W. Investing in the UN Sustainable Development Goals: Opportunities for Companies and Investors. J. Appl. Corp. Financ. 2017, 29, 87–99. [Google Scholar] [CrossRef]
  46. Dhaliwal, D.S.; Li, O.Z.; Tsang, A.; Yang, Y.G. Voluntary nonfinancial disclosure and the cost of equity capital: The Initiation of Corporate Social Responsibility Reporting. Account. Rev. 2011, 86, 59–100. [Google Scholar] [CrossRef]
  47. Dhaliwal, D.S.; Radhakrishnan, S.; Tsang, A.; Yang, Y.G. Nonfinancial disclosure and analyst Forecast Accuracy: International Evidence on Corporate Social Responsibility Disclosure. Account. Rev. 2012, 87, 723–759. [Google Scholar] [CrossRef]
  48. Belkaoui, A. The Impact of the Disclosure of the Environmental Effects of Organizational Behavior on the Market. Financ. Manag. 1976, 5, 26–31. [Google Scholar] [CrossRef]
  49. Sturdivant, F.D.; Ginter, J.L. Corporate Social responsiveness: Management Attitudes and Economic Performance. Calif. Manag. Rev. 1977, 19, 30–39. [Google Scholar] [CrossRef]
  50. Bnouni, I. Corporate Social Responsibility (CSR) and Financial Performance (FP): Case of French SMEs. Ph.D. Thesis, University of Valenciennes and Hainaut Cambresis, Valenciennes, France, 2010. [Google Scholar]
  51. Muhmad, S.N.; Muhamad, R. Sustainable business practices and financial performance during pre- and post-SDG adoption periods: A systematic review. J. Sustain. Financ. Invest. 2020. [Google Scholar] [CrossRef]
  52. Lopez, V.M.; Garcia, A.; Rodriguez, L. Sustainable development and corporate performance: A study based on the Dow Jones sustainability index. J. Bus. Ethics 2007, 75, 285–300. [Google Scholar] [CrossRef]
  53. PwC. Make it your business: Engaging with the Sustainable Development Goals. 2015. Available online: https://www.pwc.com/gx/en/sustainability/SDG/SDG%20Research_FINAL.pdf (accessed on 20 August 2020).
  54. Galli, A.; Durovic, G.; Hanscom, L.; Knezevic, J. Think globally, act locally: Implementing the sustainable development goals in Montenegro. Environ. Sci. Policy 2018, 84, 159–169. [Google Scholar] [CrossRef]
  55. Izzo, M.F.; Ciaburri, M.; Tiscini, R. The Challenge of Sustainable Development Goal Reporting: The First Evidence from Italian Listed Companies. Sustainability 2020, 12, 3494. [Google Scholar] [CrossRef] [Green Version]
  56. Nechita, E.; Manea, C.L.; Irimescu, A.M.; Nichita, E.M. The content analysis of reporting on sustainable development goals. Audit Financ. 2020, 18, 160. [Google Scholar]
  57. Yu, S.; Sial, M.S.; Tran, D.K.; Badulescu, A.; Thu, P.A.; Sehleanu, M. Adoption and Implementation of Sustainable Development Goals (SDGs) in China—Agenda 2030. Sustainability 2020, 12, 6288. [Google Scholar] [CrossRef]
  58. Zimara, V.; Eidam, S. The benefits of social sustainability reporting for companies and stakeholders—Evidence from the German chemical industry. J. Bus. Chem. 2015, 12, 85–100. [Google Scholar]
  59. Ali, S.; Hussain, T.; Zhang, G.; Nurunnabi, M.; Li, B. The Implementation of Sustainable Development Goals in “BRICS” Countries. Sustainability 2018, 10, 2513. [Google Scholar] [CrossRef] [Green Version]
  60. Van Zanten, J.A.; van Tulder, R. Multinational enterprises and the Sustainable Development Goals: An institutional approach to corporate engagement. J. Int. Bus. Policy 2018, 1, 208–233. [Google Scholar] [CrossRef]
  61. Cosma, S.; Venturelli, A.; Schwizer, P.; Boscia, V. Sustainable Development and European Banks: A Non-Financial Disclosure Analysis. Sustainability 2020, 12, 6146. [Google Scholar] [CrossRef]
  62. Jones, P.; Wynn, M.; Hillier, D.; Comfort, D. The Sustainable Development Goals and Information and Communication Technologies. Indones. J. Sustain. Account. Manag. 2017, 1, 1–15. [Google Scholar] [CrossRef]
  63. Rao, N.C.; Bathla, S.; Kumar, A.; Jha, G.K. Agriculture and sustainable development goals: An overview and issues. Agric. Econ. Res. Rev. 2018, 31, 1–7. [Google Scholar] [CrossRef]
  64. Raszkowski, A.; Bartniczak, B. Sustainable Development in the Central and Eastern European Countries (CEECs): Challenges and Opportunities. Sustainability 2019, 11, 1180. [Google Scholar] [CrossRef] [Green Version]
  65. Zlinszky, J.; Pulay, B.H.; Bonifert, M.S. Implementation of the sustainable development goals—Experience transfer from Central and Eastern European countries to the EU. Iustum Aequum Salut. 2018, 14, 141–155. [Google Scholar]
  66. Mhlanga, R.; Gneiting, U.; Agarwal, N. Walking the Talk: Assessing Companies’ Progress from SDG Rhetoric to Action. 2018. Available online: https://oxfamilibrary.openrepository.com/bitstream/handle/10546/620550/dp-walking-the-talk-business-sdgs-240918-en.pdf (accessed on 26 July 2020).
  67. Aga, R. The strength of the chemical industry: Managing multidisciplinary business and R&D. Chem. Ind. 2012, 505, 20–29. [Google Scholar]
  68. World Business Council for Sustainable Development (WBCSD). Chemical Sector SDG Roadmap. Available online: https://docs.wbcsd.org/2018/07/Chemical_Sector_SDG_Roadmap.pdf (accessed on 30 June 2020).
  69. European Environment Agency. Industrial Pollution Country Profiles. Available online: https://www.eea.europa.eu/themes/industry (accessed on 30 August 2020).
  70. ISI Emerging Markets Group’s EMIS Platform Database. Available online: https://www.emis.com/industries/Chemicals (accessed on 4 August 2020).
  71. Warwick, P.; Nh, C. The ‘Cost’ of Climate Change: How Carbon Emissions Allowances are Accounted for Amongst European Union Companies. Aust. Account. Rev. 2012, 22, 54–67. [Google Scholar] [CrossRef] [Green Version]
  72. European Central Bank. Available online: https://www.ecb.europa.eu/stats/html/index.en.html (accessed on 4 August 2020).
  73. Baier, P.; Berninger, M.; Kiesel, F. Environmental, social and governance reporting in annual reports: A textual analysis. Financ. Mark. Inst. Instrum. 2020, 29, 93–118. [Google Scholar] [CrossRef]
  74. Krippendorff, K. Content Analysis: An Introduction to its Methodology, 2nd ed.; SAGE Publications: Thousand Oaks, CA, USA, 2004. [Google Scholar]
  75. Hummel, K.; Szekely, M. Reporting on the Sustainable Development Goals—Early Evidence from Europe. 2019. Available online: https://ssrn.com/abstract=3411017 (accessed on 20 July 2020).
  76. Li, F. Textual Analysis of Corporate Disclosures: A survey of Literature. J. Account. Lit. 2010, 29, 143–165. [Google Scholar]
  77. Fonseca, L.; Carvalho, F. The Reporting of SDGs by Quality, Environmental, and Occupational Health and Safety-Certified Organizations. Sustainability 2019, 11, 5797. [Google Scholar] [CrossRef] [Green Version]
  78. Nichita, E.-M.; Nechita, E.; Manea, C.L.; Manea, D.; Irimescu, A.M. Reporting on Sustainable Development Goals. A score based-approach with company-level evidence from Central-Eastern Europe economies. J. Account. Manag. Inf. Syst. 2020, 19, 501–541. [Google Scholar]
  79. Nicolò, G.; Zanellato, G.; Tiron-Tudor, A. Integrated Reporting and European State-Owned Enterprises: A Disclosure Analysis Pre and Post 2014/95/EU. Sustainability 2020, 12, 1908. [Google Scholar] [CrossRef] [Green Version]
  80. Wen, J. A Business Analytics Approach to Corporate Sustainability Analysis. Master of Environmental Studies Capstone Projects 62. 2014. Available online: http://repository.upenn.edu/mes_capstones/62 (accessed on 20 August 2020).
  81. van den Bogaerd, M.; Aerts, W. Applying machine learning in accounting research. Expert Syst. Appl. 2011, 38, 13414–13424. [Google Scholar] [CrossRef]
  82. Manes-Rossi, F.; Tiron-Tudor, A.; Nicolò, G.; Zanellato, G. Ensuring More Sustainable Reporting in Europe Using Non-Financial Disclosure—De Facto and De Jure Evidence. Sustainability 2018, 10, 1162. [Google Scholar] [CrossRef] [Green Version]
  83. PwC. From Promise to Reality: Does Business Really Care about the SDGs? And What Needs to Happen to Turn Words into Action; PwC: London, UK, 2018. [Google Scholar]
  84. Ionașcu, E.; Mironiuc, M.; Anghel, I.; Huian, M.C. The Involvement of Real Estate Companies in Sustainable Development—An Analysis from the SDGs Reporting Perspective. Sustainability 2020, 12, 798. [Google Scholar] [CrossRef] [Green Version]
  85. Goll, I.; Rasheed, A.A. The moderating effect of environmental munificence and dynamism on the relationship between discretionary social responsibility and firm performance. J. Bus. Ethics 2004, 49, 41–54. [Google Scholar] [CrossRef]
  86. Hussain, N.; Rigoni, U.; Cavezzali, E. Does it pay to be sustainable? Looking inside the black box of the relationship between sustainability performance and financial performance. Corp. Soc. Responsib. Environ. Manag. 2018, 25, 1198–1211. [Google Scholar] [CrossRef] [Green Version]
  87. Jaggi, B.; Zhao, R. Environmental performance and reporting: Perceptions of managers and accounting professionals in Hong Kong. Int. J. Account. 1996, 31, 333–346. [Google Scholar] [CrossRef]
  88. Makni, R.; Francoeur, C.; Bellavance, F. Causality between corporate social performance and financial performance: Evidence from Canadian firms. J. Bus. Ethics 2009, 89, 409–422. [Google Scholar] [CrossRef]
  89. Hart, S.L.; Ahuja, G. Does it pay to be green? An empirical examination of the relationship between emission reduction and firm performance. Bus. Strategy Environ. 1996, 5, 30–37. [Google Scholar] [CrossRef]
  90. Seifert, B.; Morris, S.A.; Bartkus, B.R. Having, giving, and getting: Slack resources, corporate philanthropy, and firm financial performance. Bus. Soc. 2004, 43, 135–161. [Google Scholar] [CrossRef]
  91. Mahoney, L.; LaGore, W.; Scazzero, J.A. Corporate social performance, financial performance for firms that restate earnings. Issues Soc. Environ. Account. 2008, 2, 104–130. [Google Scholar] [CrossRef]
  92. Seifert, B.; Morris, S.A.; Bartkus, B.R. Comparing big givers and small givers: Financial correlates of corporate philanthropy. J. Bus. Ethics 2003, 45, 195–211. [Google Scholar] [CrossRef]
  93. Christensen, H.B.; Hail, L.; Leuz, C. Economic Analysis of Widespread Adoption of CSR and Sustainability Reporting Standards, Research Report. 2018. Available online: https://ssrn.com/abstract=3315673 (accessed on 30 August 2020).
  94. Mohamad Malo-Alain, A.; Melegy, M.A.H.; Ghoneim, M.R.Y. The Effects of Sustainability Disclosure on the Quality of Financial Reports in Saudi Business Environment. Acad. Account. Financ. Stud. J. 2019, 23, 5. [Google Scholar]
  95. Grimaldi, F.; Caragnano, A.; Zito, M.; Mariani, M. Sustainability Engagement and Earnings Management: The Italian Context. Sustainability 2020, 12, 4881. [Google Scholar] [CrossRef]
  96. Reverte, C. Determinants of Corporate Social Responsibility Disclosure Ratings by Spanish Listed Firms. J. Bus. Ethics 2009, 88, 351–366. [Google Scholar] [CrossRef]
  97. Orens, R.; Aerts, W.; Cormier, D. Web-based non-financial disclosure and cost of finance. J. Bus. Financ. Account. 2010, 37, 1057–1093. [Google Scholar] [CrossRef]
  98. Hoepner, A.; Oikonomou, I.; Scholtens, B.; Schröder, M. The effects of corporate and country sustainability characteristics on the cost of debt: An international investigation. J. Bus. Financ. Account. 2016, 43, 158–190. [Google Scholar] [CrossRef]
  99. Mion, G.; Loza Adaui, C.R. Mandatory Nonfinancial Disclosure and Its Consequences on the Sustainability Reporting Quality of Italian and German Companies. Sustainability 2019, 11, 4612. [Google Scholar] [CrossRef] [Green Version]
  100. Cho, S.Y.; Lee, C.; Pfeiffer, R.J. Corporate social responsibility performance and information asymmetry. J. Account. Public Policy 2013, 32, 71–83. [Google Scholar] [CrossRef]
  101. Kuzey, C.; Uyar, A. Determinants of sustainability reporting and its impact on firm value: Evidence from the emerging market of Turkey. J. Clean. Prod. 2017, 143, 27–39. [Google Scholar] [CrossRef]
  102. Mummolo, J.; Peterson, E. Improving the Interpretation of Fixed Effects Regression Results. Political Sci. Res. Methods 2018, 6, 829–835. [Google Scholar] [CrossRef] [Green Version]
  103. Bartlett, B.D. The Effect of Corporate Sustainability Reporting on Firm Valuation. CMC Senior Theses. Paper 489. 2012. Available online: http://scholarship.claremont.edu/cmc_theses/489 (accessed on 30 August 2020).
  104. Weber, O. Corporate sustainability and financial performance of Chinese banks. Sustain. Account. Manag. Policy J. 2017, 8, 358–385. [Google Scholar] [CrossRef] [Green Version]
  105. Mishra, S.; Suar, D. Does corporate social responsibility influence firm performance of Indian companies? J. Bus. Ethics 2010, 95, 571–601. [Google Scholar] [CrossRef]
  106. Osborne, J.W.; Waters, E. Four assumptions of multiple regression that researchers should always test. Pract. Assess. Res. Eval. 2002, 8, 2. [Google Scholar]
  107. Berry, W.D.; Feldman, S. Multiple Regression in Practice. In Sage University Paper Series on Quantitative Applications in the Social Sciences; Series No. 07-050; Sage: Newbury Park, CA, USA, 1985. [Google Scholar]
  108. Laerd Statistic. Statistical Tutorials and Software Guides. 2015. Available online: https://statistics.laerd.com/ (accessed on 30 August 2020).
  109. Hair, J.F.; Black, W.C.; Babin, B.J.; Anderson, R.E. Multivariate Data Analysis, 7th ed.; Pearson: Harlow, UK, 2014. [Google Scholar]
  110. Huber, P.J. Robust Statistics; John Wiley & Sons: New York, NY, USA, 1981. [Google Scholar]
  111. Cook, R.D.; Weisberg, S. Residuals and Influence in Regression; Chapman & Hall: New York, NY, USA, 1982. [Google Scholar]
  112. Ghorbani, H. Mahalanobis distance and its application for detecting multivariate outliers. Facta Univ. Ser. Math. Inf. 2019, 34, 583–595. [Google Scholar] [CrossRef]
  113. United Nations. Independent Group of Scientists appointed by the Secretary-General. Global Sustainable Development Report 2019: The Future is Now—Science for Achieving Sustainable Development. Available online: https://sustainabledevelopment.un.org/content/documents/24797GSDR_report_2019.pdf (accessed on 20 August 2020).
  114. Mainali, B.; Luukkanen, J.; Silveira, S.; Kaivo-oja, J. Evaluating Synergies and Trade-Offs among Sustainable Development Goals (SDGs): Explorative Analyses of Development Paths in South Asia and Sub-Saharan Africa. Sustainability 2018, 10, 815. [Google Scholar] [CrossRef] [Green Version]
  115. Nilsson, M.; Chisholm, E.; Griggs, D.; Howden-Chapman, P.; McCollum, D.; Messerli, P.; Neumann, B.; Stevance, A.-S.; Visbeck, M.; Stafford-Smith, M. Mapping interactions between the sustainable development goals: Lessons learned and ways forward. Sustain. Sci. 2018, 13, 1489–1503. [Google Scholar] [CrossRef] [Green Version]
  116. Lahmouri, M.; Drewes, J.E.; Gondhaleka, D. Analysis of Greenhouse Gas Emissions in Centralized and Decentralized Water Reclamation with Resource Recovery Strategies in Leh Town, Ladakh, India, and Potential for Their Reduction in Context of the Water–Energy–Food Nexus. Water 2019, 11, 906. [Google Scholar] [CrossRef] [Green Version]
  117. Eurostat, Tourism industries—Employment. 2018. Available online: https://ec.europa.eu/eurostat/statistics-explained/index.php/Tourism_industries_-_employment (accessed on 20 August 2020).
  118. World Tourism Organization (UNWTO) and United Nations Entity for Gender Equality and the Empowerment of Women. In Global Report on Women in Tourism 2010; UNWTO: Madrid, Spain, 2011.
  119. Jaggi, B.; Freedman, M. An examination of the impact of pollution performance on economic and market performance: Pulp and paper firms. J. Bus. Financ. Account. 1992, 19, 697–713. [Google Scholar] [CrossRef]
Figure 1. Central and Eastern European (CEE) countries and their contribution to gross value added (GVA) from industry (%), based on data from EEA [70].
Sustainability 12 09251 g001
Figure 2. Structure of sampled reports by type.
Sustainability 12 09251 g002
Figure 3. Structure of the SDGs identified in the reports.
Sustainability 12 09251 g003
Figure 4. SDGs reporting at the country level.
Sustainability 12 09251 g004
Figure 5. Number of companies achieving maximum score on each SDG.
Sustainability 12 09251 g005
Figure 6. SDGs correlations analysis.
Sustainability 12 09251 g006
Table 1. Descriptive statistics related to the SDG score sample.
Country BreakdownNumber of Firm-Year ObservationsPercentage of Firm-Year Observations
CZ3017.54%
HU3922.81%
PL3319.30%
RO3520.47%
SK3419.88%
Total171100.00%
Table 2. Descriptive statistics related to the regression sample.
Number of Firm-Year ObservationsPercentage of Firm-Year Observations
Country breakdown:
CZ2416.33%
HU3825.85%
PL3121.09%
RO2416.33%
SK3020.41%
Total147100.00%
Year breakdown:
20152718.37%
20162919.73%
20173121.09%
20183121.09%
20192919.73%
Total147100.00%
Table 3. Analysed reports included in the sample, by type and years.
Type of ReportYearReports
20152016201720182019NumberPercentage
Annual report10137884627.71%
CSR report355522012.05%
Integrated report23222116.63%
Other non-financial report441112144527.11%
Sustainability report9791184426.51%
Total2832343834166100%
Table 4. Sustainable development goals (SDG) score assessment methodology.
5
4TqTq
3TcMcMq
2TcMq
1Tc + EqTqMc
0Tc
No information disclosedSDG with qualitative target onlySDG with qualitative target and quantitative efforts invested, but no results measuredSDG with quantitative target, but no results measuredSDG with qualitative target and qualitative measurement of the result(s)SDG with qualitative target and quantitative measurement of the result(s)SDG with quantitative target and qualitative measurement of the result(s)SDG with quantitative target and quantitative measurement of the result(s)
Note: Tc = Qualitative target; Tq = Quantitative target; Eq = Quantitative effort invested; Mc = Qualitative measurement of the result; Mq = Quantitative measurement of the result.
Table 5. List of independent variables.
VariableMeasurement
ROAReturn on assets—net income divided by total assets [17,91,94,95,96]
CFTURNTotal cash flow divided by sales (turnover) [90]
INTNatural logarithm of interest expenses [97,98], cited by [86]
RDOINTNatural logarithm of research and development costs and other intangibles [86,90]
Table 6. List of control variables.
VariableMeasurement
PPEProperty, plant, and equipment scaled by total assets
LEVLeverage—Total liabilities divided by equity book value
SRIndicator variable for the availability of sustainability reports; if the sustainability report is disclosed on the company’s website the indicator equals 1, and 0 otherwise
AUDIndicator variable that equals 1, if the firm’s auditor is Big 4, and 0 otherwise
COUNTRYBinary dummy variable for each country (RO omitted, set as reference); the variable equals 1 if country is k (where k = 1–4, for each of the countries CZ, HU, PL and SK), and 0 otherwise
YEARBinary dummy variable for each year (2015 omitted, set as reference); the variable equals 1 if the year is k (where k = 1–4, for each of the years 2016, 2017, 2018 and 2019), and 0 otherwise
Table 7. Descriptive statistics (N = 147).
VariableMeanMedianStd. DeviationMinimumMaximum
SDGS48.58048.00015.994479
ROA0.0610.05690.050−0.1140.202
CFTURN (mil.)2255.20133.5428121.092−24,013.97936,982.277
INT17.78918.0052.63610.56821.657
RDOINT20.38520.2593.20312.01424.774
SR0.6301.0000.48401
LEV1.7041.1922.1030.14615.160
PPE0.3180.2990.1860.0480.688
AUD0.8401.0000.37101
Table 8. Pearson correlation matrix.
VariablesSDGSROACFTURNINTRDOINTSRLEVPPE
SDGS-
ROA0.144-
CFTURN0.332 **0.138-
INT0.505 **0.0100.252 **-
RDOINT0.656 **0.216 **0.332 **0.824 **-
SR0.164 *0.0510.164 *0.1470.247 **-
LEV0.020−0.163 *0.0630.222 **0.1010.060-
PPE−0.596 **−0.190 *−0.251 **−0.523 **−0.736 **−0.375 **−0.020-
AUD0.264 **0.248 **0.1250.360 **0.512 **0.236 **−0.043−0.209 *
** Correlation is significant at the 0.01 level (2-tailed); * Correlation is significant at the 0.05 level (2-tailed).
Table 9. Spearman’s rho correlation matrix.
VariablesSDGSROACFTURNINTRDOINTSRLEVPPE
SDGS-
ROA0.147-
CFTURN0.261 **0.218 **-
INT0.623 **0.1250.326 **-
RDOINT0.677 **0.259 **0.350 **0.868 **-
SR0.1390.0210.0820.1460.250 **-
LEV0.097−0.249 **0.0190.406 **0.166 *0.071-
PPE−0.603 **−0.176 *−0.240 **−0.587 **−0.753 **-0.367 **−0.069-
AUD0.240 **0.262 **0.228 **0.396 **0.490 **0.236 **0.067−0.221 **
** Correlation is significant at the 0.01 level (2-tailed); * Correlation is significant at the 0.05 level (2-tailed).
Table 10. Model summary on the regression of the SDGS on each independent variable without control variables.
Independent VariableROACFTURNINTRDOINT
R20.0210.1100.2550.430
Adjusted R20.0140.1040.2490.426
F-stat, df (1, 145)3.051 *18.007 ***49.515 ***109.286 ***
Significance at the level of: *** p < 0.01; * p < 0.10.
Table 11. Comparison of results obtained for the four multiple linear regression models on the sustainable development goals quality score (SDGS) dependent variable with control variables.
Model/Independent VariableModel 1, Equation (2)Model 2, Equation (3)Model 3, Equation (4)Model 4, Equation (5)
ROACFTURNINTRDOINT
Goodness of fit:
R20.5660.5740.5960.634
Adjusted R20.5240.5330.5570.598
F-stat, df (13, 133)13.356 ***13.807 ***15.109 ***17.700 ***
Coefficients:
Intercept62.746 ***61.378 ***32.730 ***6.381
Independent variable 1−15.5100.000 *1.603 ***2.624 ***
Control variables:
SR−2.545−3.039−1.403−0.802
LEV−0.486−0.356−0.916 **−0.788 *
PPE−45.658 ***−43.825 ***−34.321 ***−15.129 *
AUD7.762 ***7.705 ***5.008 *0.075
CZ−4.322−4.798−4.481−6.183 **
HU−8.658 ***−8.506 ***−12.068 ***−13.000 ***
PL−18.128 ***−18.278 ***−17.428 ***−18.429 ***
SK0.164−3.052−1.230−4.065
20163.0753.1813.3113.399
20175.598 *5.331 *6.005 **6.308 **
20185.940 **6.15 **6.079 **5.513 **
20194.8785.487 *5.543 *6.302 **
Country FEYesYesYesYes
Year FEYesYesYesYes
Number of firms36363636
Number of observations147147147147
1 Independent variable as per each model; significance at the level of: *** p < 0.01; ** p < 0.05; * p < 0.10.
Publisher’s Note: MDPI stays neutral with regard to jurisdictional claims in published maps and institutional affiliations.

