Abstract
For beekeepers, the beehive stock represents a fundamental means of ensuring the continuity of their activity, whether they are professionals or hobbyists. The evaluation of this asset for economic purposes requires knowledge of the rhythms and adaptations of honey bee colonies during the annual seasons. As in any breeding activity, it is necessary to establish the numerical and economic size of the species bred. Beekeepers are interested in this evaluation to monitor beehive stock. For keeping economic accounts of stock, a specific tool has been developed and proposed, here called the “Honey Bee Colony Inventory (HBCI)”. The HBCI can be used as either a final or preventive scheme to assess the numbers of honey bee colonies and nuclei, and the mortality rate, in order to calculate the monetary value. This tool allows the strength of honey bee colony stocks to be monitored, including fluctuations throughout the year, and will prove useful for determining solutions to maintain or increase how long stocks last. Data can be registered in countries such as Italy where the veterinary authorities request data on the stock owned and its variations. Due to widespread Varroa mite infestations, in recent years, beekeepers have experimented with a range of different biotechniques that have included queen caging as well as drone and total brood removal. To verify its effectiveness for gathering honey bee colony data, the HBCI was used in nine beekeeping farms applying different biotechniques to control Varroa mites: chemical treatment, total brood removal, queen caging and old queen replacement by royal cell insertion. The results are compared and discussed. Out of the nine farms, seven showed negative monetary value according to the HBCI, as expected, due to multiple factors such as the unfavorable climate trend of 2017 in the studied area. The positive aspect is that the application of this tool will allow farmers to monitor, manage and maintain their beehive stocks.
1. Introduction
Honey bees (Apis mellifera L.) are of huge importance globally because of their pollination services, essential for agricultural productivity, biodiversity conservation, and honey production [1,2]. Pollination is also important for enhancing the quality of oilseed plants as well as the proportion of bioactive compounds in medicinal plant seeds [3,4,5]. One previous economic study demonstrated that the total economic value of pollination services globally amounts to approximately €153 billion annually [6], corresponding to about 9% of the total economic value of agricultural crops grown for human consumption. A total of 90.6 million hives were recorded in 2016, with about 1.8 million tons of honey reported by the FAO [7,8]; there are about 15.7 million and 1.3 million hives within the European Union and Italy, respectively [9].
The numbers of managed honey bees have been declining over recent years due to various influences. A number of authors have therefore quantified the vulnerability of world agriculture due to declines in pollinators [6,10] and the consequent economic impacts. Databases have recorded a decrease in honey and other bee products [11]. Despite this, the demand for honey worldwide [12,13] and in Europe [14] is growing, and consumers are showing interest [15,16] in honey that is high quality, certified organic or with a protected designation of origin [17,18,19].
Amongst known threats, the Varroa mite (Varroa destructor Anderson and Trueman) is severe for beekeeping [20,21,22,23,24] thus, chemical, biological, and biotechnical methods, as well as integrated pest management strategies are used to keep the mite populations under control [25,26,27,28,29,30]. The use of synthetic acaricides leads to a risk of residues within bee products and the development of resistance [31,32]; instead, natural compounds such as organic acids exhibit a high degree of efficacy against Varroa mites and also present low hive-contamination risks [33,34]. The organic acid most commonly applied in recent years is oxalic acid (OA), used either alone or in combination with biotechnical techniques to create broodless conditions to increase efficacy [35,36]. Associated biotechniques include queen caging, drone brood removal and, most recently, total brood removal; the effectiveness of all these approaches for Varroa mite control has been demonstrated in previous research [37,38,39]. Organic beekeeping farms are required to use friendly biological and biotechnical methods in order to conform with organic regulations.
To date, limited research has addressed measuring the economic results of beekeeping [11,39,40,41,42,43,44] and the impacts of Varroa mites on beekeeping farms [45]. To evaluate the annual economic value of colonies, variations in colony size and number during the year, the creation of new colonies through nuclei, and the replacement of colonies dying for different reasons (diseases, climate change, lack of feeding, etc.) must be measured at the beekeeping-farm scale. Previous research has shown how difficult it is to quantify the monetary value of honey bee colony stock and stated that an improvement in the calculation methodology would be very useful [45]. Methods are available for the assessment of the structure of many honey bee colonies for applied and fundamental scientific research purposes, such as the recently published ColEval method [46], or methods developed by Liebefeld [47]. However, to the best of our knowledge, no method is currently available to monitor the flows through the year to measure the economic value of the colony stock at the end of the year.
The aim of this study, under the Interreg Alcotra Project “INNOV’API”, was to finetune a tool, named Honey Bee Colony Inventory, able to monitor the evolution of beehive stocks at the beekeeping-farm, scale in order to quantify the monetary value of the honey bees. The method should be easy for the beekeeper to use: the records must be simple both when performing management operations in the field during the year and when drawing up an economic and financial statement at the end of the year. The recorded data can be used for different purposes—firstly, to assess the economic value of the honey bee stock on an economic balance sheet. The collected data are also useful for veterinary medical services monitoring bee diseases and for comparing colony performance according to the type of Varroa control biotechnique applied.
2. Materials and Methods
Information about beekeeping organizations regarding strategies for controlling Varroa mites highlights how farmers carry out their activities in a more efficient way, at least in terms of increases in productivity and decreases in production costs. It is therefore important to consider that beekeepers do aim to achieve high honey production while, at the same time, maintaining or increasing colony numbers. Hence, nine beekeeping farms adopting different techniques to control Varroa mites were investigated, regarding the economic data of 1 March 2017 to 28 February 2018. The data were collected a posteriori, after the conclusion of the analyzed year. The farms analyzed are located in the Piedmont Region within Cuneo and Turin provinces (north west of Italy), inside territories included within the Alcotra Space, in the context of Interreg project (Figure 1). The Varroa control techniques implemented in the farms were chemical treatment (CT), total brood removal (TBR), queen caging (QC) and old queen replacement by royal cell insertion (CI) (Table 1). TBR and QC and CI are normally used in organic beekeeping farms.
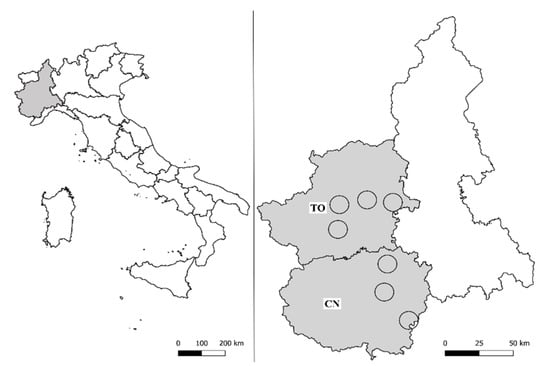
Figure 1.
The location of the nine beekeeping farms within the Cuneo (CN) and Turin (TO) provinces of the Piedmont region, north west Italy [45].

Table 1.
Identification codes, provinces, methods of keeping bees, and Varroa control methods of the beekeeping farms.
A tool has been developed, starting from the drawing up of the inventory, the classic tool used in companies and farms to establish the size of the fixed and circulating capital present at a given time of the year, usually at the end [48]. This inventory, adapted to the species of animals bred, reports the stock and flows of animals present at the beginning and end of the year. As far as honey bees are concerned, the evaluation requires adjustments in the counting of colonies: individuals cannot be counted, but only colonies and nuclei can be counted; fluctuations occur throughout the year but are concentrated at certain times. The tool for keeping numerical and economic accounts of beehive stock is here called the “Honey Bees Colony Inventory (HBCI)”. The tool could be implemented in different ways, on the basis of demand for economic knowledge and the time of data collection by the farmer—ex ante, ex post, or during the year—to build a balance sheet for preventive forecasting or final use, or to create another technical scheme that is more simple, to keep and record technical and economic data.
In north west Italy, the most important work in beekeeping farms generally starts at the beginning of March, with inspections of the beehives and their strength on 01/03/y (e.g., 01/03/2017, starting inventory, SI), where the colonies and nuclei present in the apiary are counted. During the spring–summer, nuclei are made to increase the beehive stock and/or control Varroa mites in the case of TBR and the application of other biotechniques.
On 15/08/y (e.g., 15/08/2017, summer inventory), the beehive stock is assessed again since the most important part of honey production and the treatments allowed in beekeeping farms are completed as established by the Regional Control Plan for Varroa [49,50]. Throughout the beekeeping season, there are many fluctuations due to mortality and/or new colony and nucleus formation.
At the end of the active beekeeping season, on 15/10/y (e.g., 15/10/2017, pre-winter inventory), a pre-winter inventory is taken at the time of the wintering operations for the colonies and nuclei.
At the end of the winter, on 28/02/y + 1 (e.g., 28/02/2018, final inventory, FI), an inventory of the colonies and nuclei is made, which is also useful for calculating the rate of winter mortality.
In this study, in each of the nine farms, the beekeeper was interviewed, focusing on the numbers of colonies and nuclei at these four times. The beekeeper can use this scheme, proposed in Excel, to collect annual data at the field–farm scale. As part of the technical assistance, this pre-filled scheme can be suggested to facilitate the overall evaluation of the beehive stock and its intra-annual variations, as well as multi-annual variations if performed consistently for at least three years.
This approach comprises the use of the HBCI as either a final or preventive scheme from an economic point of view, to assess the numbers of honey bee colonies and nuclei, and mortality, in order to assess their monetary value. The HBCI is derived from the scheme of calculating a farm’s assets and their variations during the year. In this study, the HBCI was applied to calculate the benefits or losses of honey bee colonies per farm over the course of the beekeeping season. It is noteworthy that the HBCI model can only be used for data collection when monitoring stocks of honey bee colonies and nuclei; however, it is also possible to add additional data (e.g., climate conditions, food resources, swarming, and Varroa infestation rates) to better understand annual fluctuations in honey bee colony stocks and mortality rates. The HBCI value must be included in any economic balance sheet in order to develop a global analysis, as this approach incorporates total colony stocks as well as the replacement of lost ones via production by self-nucleation or market purchases. This tool includes schemes of both final (FI) and starting inventories (SI) that encompass the numbers of colonies and nuclei, their unitary price, and their total value, as well as purchase (Pu) and sales (Sa) schemes that record the numbers of honey bee colonies and nuclei. The colony replacement (CR) element (1) is a key element of the assessment, highlighting the replacement of colonies by nuclei self-produced in the beekeeping farm during the analyzed period of time. In fact, these honey bees reinforce existing stock and do not generate new colonies. Another important component of the data recorded was the mortality rate of honey bee colonies at the end of each year. This allows us to calculate both the growth and decline in stocks over time. Thus, by applying Equation (1), we were able to define increases and decreases in the HBCI to establish a value of the honey bee colony stocks within a farm throughout each year, as follows:
where:
HBCI = (F I − S I) − CR + (Sa − Pu)
FI includes the value of both the colonies and nuclei at the end of the year (28/02/y + 1, e.g., 28/02/2018); FI = ;
SI includes the value of both colonies and nuclei at the start of the year (01/03/y, e.g., 01/03/2017);
SI = ;
CR represents the value of the colony and nucleus replacement (using the self-produced stock, assessed by market price) during the year, uncounted in the SI and FI;
CR = ;
Sa is the value of the colonies, nuclei, queens, and royal cells sold during the year considered, and Pu is the value of the colonies, nuclei, queens, and royal cells purchased during the year considered (01/03/2017–28/02/2018).
The time period analyzed in this study spanned 1st March 2017 to 28th February 2018, encompassing the beekeeping season. The first part of the equation, “(FI − SI) − CR)”, refers to the stock dimension of the colonies and nuclei; the second part, “(Sa − Pu)”, calculates the flow of elements (from outside to inside the farm and vice versa).
We underline that in Italy both colony and nucleus prices differ such that the conventional farming price in 2017 and 2018 was €190 per colony and €110 per nucleus, while the organic farming prices at this time were €220 per colony and €130 per nucleus. It is also the case that the Italian market tends to be more agreeable to higher organic farm prices; farms of this type were therefore assessed here for the application of biotechniques. The prices of colonies and nuclei in the study area (Piedmont, Italy) were the same regardless of the subspecies of Apis mellifera used by the beekeepers. It is useful to underline also that the prices referred to the Italian market. The HBCI tool can be used in each country adopting the prices referred to the local market.
Finally, it is also noteworthy that Italian estimates for honey bee colonies and nuclei were not readily available, while these data were easily obtained for honey. The HBCI could be zero when no events are registered during the year, while it might be positive if a beekeeping farm increases its stock of colonies and nuclei, or negative otherwise. Thus, if part of a balance sheet, this value will be included within the “gross marketable output value”. If the HBCI is negative, the value of the colonies decreases; if part of a balance sheet, this result will be included within the “cost production” section.
3. Results
The situation of beehive stocks that emerged in the nine beekeeping farms analyzed is shown in Figure 2. Generally, all nine beekeeping farms recorded winter mortality in colonies and nuclei, and there were no sales and purchases at the farm level. In particular, beekeeping farm number one showed an SI (01/03/2017) equal to 1070 (1000 colonies and 70 nuclei). During the spring and summer, another 70 nuclei were obtained by breeding and a further 200 nuclei were produced by the TBR technique applied to fight Varroa mites (TBR nuclei); in the record concerning the summer period (15/08/2017), 1,000 colonies and 340 nuclei were present in the beekeeping farm stock. In the pre-winter time (15/10/2017) some colonies died and others were used for replacement (40); the stock consisted of 990 colonies, 100 nuclei and 180 TBR nuclei. The FI (28/02/2018) was equal to 880 colonies + 250 nuclei, 170 of which originated from TBR. The winter mortality rate was 11%. Farm number two presented 750 colonies and 250 nuclei in the SI. In the summer, 850 colonies and 250 nuclei (100 of which were derived by TBR) were counted in the stock. In the pre-winter time, the stock consisted of 843 colonies and 200 nuclei; 80 nuclei originated from TBR. A total of 60 colonies were used for replacement. In the FI, 780 colonies and 190 nuclei (60 of which were TBR nuclei) were present, and the winter mortality rate was 14%. In farm number three, 190 colonies and 20 nuclei were counted in the SI, while 50 nuclei were produced by applying TBR, and another 45 nuclei and 190 colonies were present in the summer time. In the pre-winter inventory, there were 186 colonies and 65 nuclei (35 of which were TBR nuclei); 15 colonies were employed for replacement. The FI showed a stock consisting of 165 colonies, 25 nuclei, and 24 TBR nuclei, and the winter mortality rate was 15%.
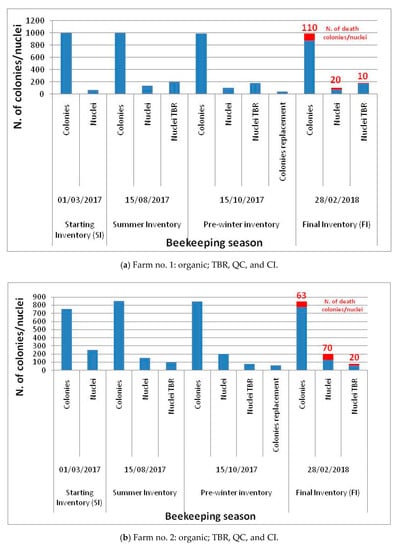
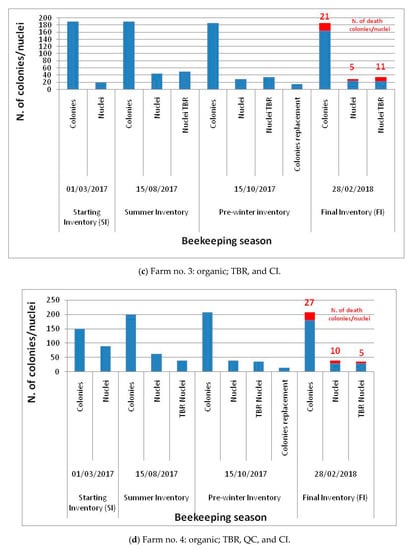
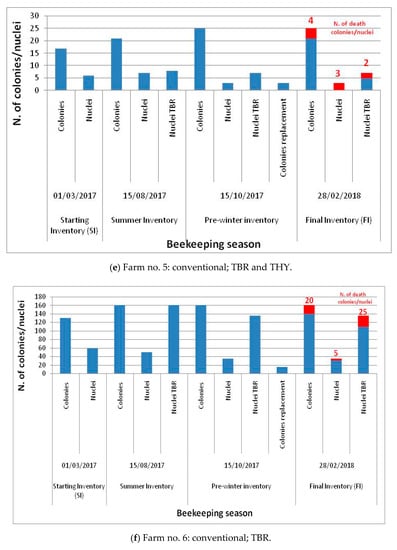
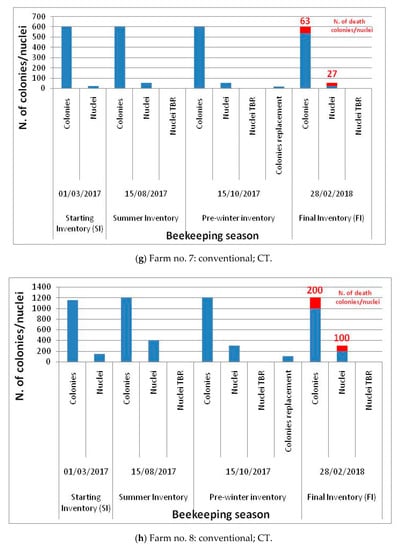
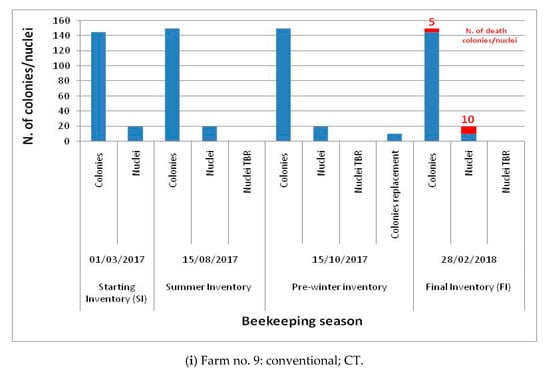
Figure 2.
Fluctuations of beehive stocks in the nine beekeeping farms (a–i) that highlight the situations at the four points in time: starting inventory (SI), summer inventory, pre-winter inventory, and final inventory (FI). Legend: TBR: Total Brood Removal; QC: queen caging; CI: royal cell insertion; THY: thymol treatment; CT: chemical treatments.
Farm number four displayed an SI equal to 150 colonies and 90 nuclei. In the summer inventory, the TBR technique was applied and 40 TBR nuclei were created in addition to 62 other nuclei and 200 colonies registered in the beehive stock. Later, in the pre-winter stock, 207 colonies, 40 nuclei, and 35 TBR nuclei were counted, and 15 colonies were utilized for replacement. The numbers of colonies and nuclei in the FI were 180 and 60 (30 TBR nuclei) and the mortality rate was 15%. Farm number five was a small beekeeping farm and, in fact, had few beehives. In the SI, 17 colonies and six nuclei were present, which became 21 and 15 (eight TBR nuclei) in the summer inventory and 25 and 10 (seven TBR nuclei) in the pre-winter inventory, and the replacement was equal to three colonies. FI consisted in 21 colonies and 5 TBR nuclei, and the mortality rate was 26%. In farm number six, the stock presented in the SI was 130 colonies and 60 nuclei. The summer inventory included 160 colonies, 50 nuclei, and 160 TBR nuclei because of the total Varroa control represented by TBR being applied on all the beehives. Only 135 TBR nuclei survived and formed the pre-winter inventory when added to 35 other nuclei and 160 colonies, considering that 15 colonies were used for replacement. At the end of the winter, 140 colonies, 30 nuclei, and 110 TBR nuclei were present in the beehive stock, with a mortality rate of 15%. The other farms, numbers seven to nine, were conventional beekeeping farms, and considering that they used chemical methods to fight Varroa, no nuclei derived by biotechniques were present in the stock. In the SI and FI of farm number seven, 603 colonies and 26 nuclei, and 540 colonies and 28 nuclei were registered, respectively. The summer inventory confirmed the number of 603 colonies, but the nuclei reached 55, also validated in the pre-winter time, and 20 colonies were used for replacement, to maintain stock. The mortality rate was 14%. Farm number eight showed an SI equal to 1300 (1150 colonies and 150 nuclei). During the spring and summer, 1200 colonies and 400 nuclei were present in the beekeeping farm stock. In the pre-winter time, some colonies and nuclei died, others were used for replacement (100), and the stock consisted of 1200 colonies and 300 nuclei. The FI was 1000 colonies and 200 nuclei, while the winter mortality rate was 20%. For farm number nine, 145 colonies and 20 nuclei were counted in the SI, and 20 nuclei and 150 colonies were present in summer inventory. The pre-winter inventory showed 150 colonies and 20 nuclei, and 10 colonies were employed for replacement. The FI showed a stock consisting of 145 colonies and 10 nuclei, and the winter mortality rate was 9%. On the basis of our HBCI Equation (1), the value of the total inventory for each beekeeping farm is shown in Table 2. Farm numbers one, two, three, four, seven, eight and nine showed negative values for the HBCI, ranging from EUR 34,000 to EUR 140. On the contrary, farm numbers five and six showed positive values, ranging from EUR 320 to EUR 8930.
Table 2.
Honey Bee Colony Inventory (HBCI) value calculated for the nine beekeeping farms and size farm (colonies + nuclei).
4. Discussion
As the graphs in Figure 2 show, the evolution of the beekeeping stock varies throughout the year and can be put under pressure by multiple factors. This is highlighted by the HBCI calculation (Table 2), with seven out of nine farms showing negative monetary value, indicating a decrease in beehive stock value. In cases of negative HBCI, mortality was recorded at both the colony and nucleus levels.
The results highlight the fact that additional attention must be afforded to fluctuations throughout the year linked to the techniques used as well as sales, purchases, replacement, and mortality. The use of the HBCI tool in the nine case studies allowed us to analyze ex post fluctuations in honey bee colony stocks within a single farm over the course of a beekeeping season. Environmental conditions, the health and strength of colonies, and the management capabilities of beekeepers might also influenced the results obtained during the year. Nevertheless, the HBCI tool is flexible because it can be employed for the preventive evaluation of farm size for subsequent years; applying this approach means that beekeepers are able to assess the available biotechniques on the basis of the results obtained and identify the most appropriate solutions to assure either stock maintenance or increase.
The use of this approach also allowed us to easily collect mortality rate data. We are therefore able to conclude that the HBCI is useful, as it enables beekeepers to monitor their stocks from both numerical and economic perspectives. This approach is also important in countries such as Italy where the law mandates that data regarding both the stock owned and associated fluctuations have to be presented to veterinary authorities. In this context, the use of the HBCI enables the easy collection of relevant information. Nevertheless, as beekeepers vary their farming techniques to control Varroa mites throughout the year, the preliminary results presented here are relevant for only the 2017–2018 season. Honey bee colony stocks should be counted and discussed over a medium period of time, e.g., 3–5 years. This means that a pluri-annual model including a range of variables (e.g., climate data, colony strengths, honey production, and Varroa infestation rates) [11] is advisable in combination with a range of different management strategies, including biotechniques to fight Varroa. The final economic results obtained by the beekeeping farms examined here could be positive, even if a decrease in stock is calculated. This is the case as stated in Mancuso et al. [45], where the use of TBR, compared with other techniques, led to an increase in total revenue varying from 11% to 28%. The difference is due to multiple factors such as the average honey production per hive, variation in bee stock, types of production, and sales channels adopted. It should be noted that the different biotechniques implemented by the beekeeping farms to fight Varroa, could be evaluated positively, even if the economic parameter HBCI is negative, considering the great sanitary advantage.
Author Contributions
Conceptualization, T.M., M.V. and L.C.; methodology, T.M., M.V., and L.C.; formal analysis T.M.; validation, T.M.; investigation, M.V. and L.C.; data curation, L.C. and M.V.; writing—original draft preparation, T.M., M.V., and L.C.; writing—review and editing, T.M. and M.V.; supervision, T.M.; project administration (related to the WP4), T.M.; funding acquisition, T.M. All authors have read and agreed to the published version of the manuscript.
Funding
This research was funded by the European Union, INTERREG V-A France–Italie (ALCOTRA) (2014–2020)—“INNOV’API (n. 1580)—Innovation sanitaire pour la durabilité des exploitations apicoles”.
Acknowledgments
We thank the European Union for funding the project “EU Interreg V-A France–Italie (ALCOTRA) (2014–2020)-INNOV’API (1580)-Innovation sanitaire pour la durabilité des exploitations apicoles”. The authors thank all the Beekeepers that supplied the data of their farms, the Beekeepers Association of Piedmont (Italy) ASPROMIELE and the UNAAPI, the Beekeepers National Association (and Partner of the Innov’Api Project) for providing the contact of the beekeeping farms.
Conflicts of Interest
The authors declare no conflict of interest. The funder had no role in the design of the study; in the collection, analyses, or interpretation of data; in the writing of the manuscript, or in the decision to publish the results.
References
- Klein, A.M.; Vaissière, B.E.; Cane, J.H.; Steffan-Dewenter, I.; Cunningham, S.A.; Kremen, C.; Tscharntke, T. Importance of pollinators in changing landscapes for world crops. Proc. R. Soc. B Biol. Sci. 2007, 274, 303–313. [Google Scholar] [CrossRef]
- Potts, S.G.; Biesmeijer, J.C.; Kremen, C.; Neumann, P.; Schweiger, O.; Kunin, W.E. Global pollinator declines: Trends, impacts and drivers. Trends Ecol. Evol. 2010, 25, 345–353. [Google Scholar] [CrossRef]
- Bommarco, R.; Marini, L.; Vaissière, B.E. Insect pollination enhances seed yield, quality, and market value in oilseed rape. Oecologia 2012, 169, 1025–1032. [Google Scholar] [CrossRef]
- Salami, M.; Rahimmalek, M.; Ehtemam, M.H.; Sabzalian, M.R. Variation in bioactive compounds and anatomical characteristics of different fennel (Foeniculum vulgare Mill.) populations as affected by self-pollination. J. Appl. Bot. Food Qual. 2016, 89, 38–48. [Google Scholar]
- Ferrazzi, P.; Vercelli, M.; Chakir, A.; Romane, A.; Mattana, M.; Consonni, R. Pollination effects on antioxidant content of Perilla frutescens seeds analysed by NMR spectroscopy. Nat. Prod. Res. 2017, 31, 2705–2711. [Google Scholar] [CrossRef]
- Gallai, N.; Salles, J.M.; Settele, J.; Vaissière, B.E. Economic valuation of the vulnerability of world agriculture confronted with pollinator decline. Ecol. Econ. 2009, 68, 810–821. [Google Scholar] [CrossRef]
- FAO. Faostat-Production: Live Animals. Available online: http://www.fao.org/faostat/en/#data/QA (accessed on 30 July 2019).
- FAO. Faostat-Production: Livestock Primary. Available online: http://www.fao.org/faostat/en/#data/QL (accessed on 30 July 2019).
- European Commission. National Apiculture Programmes. European Commission- Agricultural and Rural Development. Available online: https://ec.europa.eu/agriculture/honey/programmes (accessed on 21 September 2020).
- Hein, L. The Economic Value of the Pollination Service, a Review Across Scales. Open Ecol. J. 2009, 2, 74–82. [Google Scholar] [CrossRef]
- European Commission; Deloitte. Evaluation of Measures for the Apiculture Sector; Final Report; Publications Office of the EU: Luxembourg, 2014. [Google Scholar]
- FAO. Food and Agriculture Data. Available online: http://www.fao.org/faostat/en/#data (accessed on 4 September 2020).
- UNComtrade. United Nations Commodity Trade Statistic Database. Available online: https://comtrade.un.org/data (accessed on 4 September 2020).
- Pippinato, L.; Di Vita, G.; Brun, F. Trade and comparative advantage analysis of the eu honey sector with a focus on the italian market. Qual. Access Success 2019, 20, 485–492. [Google Scholar]
- Brščić, K.; Šugar, T.; Poljuha, D. An empirical examination of consumer preferences for honey in Croatia. Appl. Econ. 2017, 49, 5877–5889. [Google Scholar] [CrossRef]
- Ványi, G.Á.; Csapó, Z.; Kárpáti, L. Evaluation of consumers’ honey purchase habits in Hungary. J. Food Prod. Mark. 2011, 17, 227–240. [Google Scholar] [CrossRef]
- Brun, F.; Zanchini, R.; Mosso, A.; Di Vita, G. Testing consumer propensity towards novel optional quality terms: An explorative assessment of “mountain” labelled honey. AIMS Agric. Food 2020, 5, 190–203. [Google Scholar] [CrossRef]
- Cosmina, M.; Gallenti, G.; Marangon, F.; Troiano, S. Reprint of “Attitudes towards honey among Italian consumers: A choice experiment approach”. Appetite 2016, 106, 110–116. [Google Scholar] [CrossRef]
- Wu, S.; Fooks, J.R.; Messer, K.D.; Delaney, D. Consumer demand for local honey. Appl. Econ. 2015, 47, 4377–4394. [Google Scholar] [CrossRef]
- Barroso-Arévalo, S.; Fernández-Carrión, E.; Goyache, J.; Molero, F.; Puerta, F.; Sánchez-Vizcaíno, J.M. High load of deformed wing virus and Varroa destructor infestation are related to weakness of honey bee colonies in Southern Spain. Front. Microbiol. 2019, 10, 1331. [Google Scholar] [CrossRef]
- vanEngelsdorp, D.; Evans, J.D.; Saegerman, C.; Mullin, C.; Haubruge, E.; Nguyen, B.K.; Frazier, M.; Frazier, J.; Cox-Foster, D.; Chen, Y.; et al. Colony collapse disorder: A descriptive study. PLoS ONE 2009, 4, e6481. [Google Scholar] [CrossRef]
- Nazzi, F.; Brown, S.P.; Annoscia, D.; Del Piccolo, F.; Di Prisco, G.; Varricchio, P.; Vedova, G.D.; Cattonaro, F.; Caprio, E.; Pennacchio, F. Synergistic parasite-pathogen interactions mediated by host immunity can drive the collapse of honeybee colonies. PLoS Pathog. 2012, 8, e1002735. [Google Scholar] [CrossRef]
- Lee, K.V.; Steinhauer, N.; Rennich, K.; Wilson, M.E.; Tarpy, D.R.; Caron, D.M.; Rose, R.; Delaplane, K.S.; Baylis, K.; Lengerich, E.J.; et al. A national survey of managed honey bee 2013–2014 annual colony losses in the USA. Apidologie 2015, 46, 292–305. [Google Scholar] [CrossRef]
- Ramsey, S.D.; Ochoa, R.; Bauchan, G.; Gulbronson, C.; Mowery, J.D.; Cohen, A.; Lim, D.; Joklik, J.; Cicero, J.M.; Ellis, J.D.; et al. Varroa destructor feeds primarily on honey bee fat body tissue and not hemolymph. Proc. Natl. Acad. Sci. USA 2019, 116, 1792–1801. [Google Scholar] [CrossRef]
- Delaplane, K.S.; Berry, J.A.; Skinner, J.A.; Parkman, J.P.; Hood, W.M. Integrated pest management against Varroa destructor reduces colony mite levels and delays treatment threshold. J. Apic. Res. 2005, 44, 157–162. [Google Scholar] [CrossRef]
- Genersch, E.; Evans, J.D.; Fries, I. Honey bee disease overview. J. Invertebr. Pathol. 2010, 103, S2–S4. [Google Scholar] [CrossRef] [PubMed]
- Rosenkranz, P.; Aumeier, P.; Ziegelmann, B. Biology and control of Varroa destructor. J. Invertebr. Pathol. 2010, 103, S96–S119. [Google Scholar] [CrossRef]
- Mondet, F.; de Miranda, J.R.; Kretzschmar, A.; Le Conte, Y.; Mercer, A.R. On the Front Line: Quantitative Virus Dynamics in Honeybee (Apis mellifera L.) Colonies along a New Expansion Front of the Parasite Varroa destructor. PLoS Pathog. 2014, 10, e1004323. [Google Scholar] [CrossRef]
- Nazzi, F.; Le Conte, Y. Ecology of Varroa destructor, the Major Ectoparasite of the Western Honey Bee, Apis mellifera. Annu. Rev. Entomol. 2016, 61, 417–432. [Google Scholar] [CrossRef]
- Pusceddu, M.; Piluzza, G.; Theodorou, P.; Buffa, F.; Ruiu, L.; Bullitta, S.; Floris, I.; Satta, A. Resin foraging dynamics in Varroa destructor-infested hives: A case of medication of kin? Insect Sci. 2019, 26, 297–310. [Google Scholar] [CrossRef] [PubMed]
- Milani, N. The resistance of Varroa jacobsoni Oud. to acaricides. Apidologie 1999, 30, 229–234. [Google Scholar] [CrossRef]
- Sammataro, D.; Untalan, P.; Guerrero, F.; Finley, J. The resistance of varroa mites (Acari: Varroidae) to acaricides and the presence of esterase. Int. J. Acarol. 2005, 31, 67–74. [Google Scholar] [CrossRef]
- Floris, I.; Satta, A.; Cabras, P.; Garau, V.L.; Angioni, A. Comparison between two thymol formulations in the control of Varroa destructor: Effectiveness, persistence, and residues. J. Econ. Entomol. 2004, 97, 187–191. [Google Scholar] [CrossRef] [PubMed]
- Bogdanov, S. Contaminants of bee products. Apidologie 2006, 37, 1–18. [Google Scholar] [CrossRef]
- Aliano, N.P.; Ellis, M.D. Bee-to-bee contact drives oxalic acid distribution in honey bee colonies. Apidologie 2008, 39, 481–487. [Google Scholar] [CrossRef]
- Gregorc, A.; Alburaki, M.; Werle, C.; Knight, P.R.; Adamczyk, J. Brood removal or queen caging combined with oxalic acid treatment to control varroa mites (Varroa destructor) in honey bee colonies (Apis mellifera). Apidologie 2017, 48, 821–832. [Google Scholar] [CrossRef]
- Giacomelli, A.; Pietropaoli, M.; Carvelli, A.; Iacoponi, F.; Formato, G. Combination of thymol treatment (Apiguard®) and caging the queen technique to fight Varroa destructor. Apidologie 2016, 47, 606–616. [Google Scholar] [CrossRef]
- Gregorc, A.; Adamczyk, J.; Kapun, S.; Planinc, I. Integrated varroa control in honey bee (Apis mellifera carnica) colonies with or without brood. J. Apic. Res. 2016, 55, 253–258. [Google Scholar] [CrossRef]
- Saner, G.; Engindeniz, S.; Tolon, B.; Cukur, F. The economic analysis of beekeeping enterprise in sustainable development: The case study of Turkey. Apiacta 2004, 38, 342–351. [Google Scholar]
- Kasina, J.M.; Mburu, J.; Kraemer, M.; Holm-Mueller, K. Economic benefit of crop pollination by bees: A case of kakamega small-holder farming in Western Kenya. J. Econ. Entomol. 2009, 102, 467–473. [Google Scholar] [CrossRef]
- Leonhardt, S.D.; Gallai, N.; Garibaldi, L.A.; Kuhlmann, M.; Klein, A.M. Economic gain, stability of pollination and bee diversity decrease from southern to northern Europe. Basic Appl. Ecol. 2013, 14, 461–471. [Google Scholar] [CrossRef]
- Bixby, M.; Baylis, K.; Hoover, S.E.; Currie, R.W.; Melathopoulos, A.P.; Pernal, S.F.; Foster, L.J.; Guarna, M.M. A Bio-Economic Case Study of Canadian Honey Bee (Hymenoptera: Apidae) Colonies: Marker-Assisted Selection (MAS) in Queen Breeding Affects Beekeeper Profits. J. Econ. Entomol. 2017, 110, 816–825. [Google Scholar] [CrossRef]
- Blanc, S.; Brun, F.; Di Vita, G.; Mosso, A. Traditional beekeeping in rural areas: Profitability analysis and feasibility of pollination service. Qual. Success 2018, 19, 72–79. [Google Scholar]
- Hoover, S.E.; Ovinge, L.P. Pollen collection, honey production, and pollination services: Managing honey bees in an agricultural setting. J. Econ. Entomol. 2018, 111, 1509–1516. [Google Scholar] [CrossRef]
- Mancuso, T.; Croce, L.; Vercelli, M. Total brood removal and other biotechniques for the sustainable control of varroa mites in honey bee colonies: Economic impact in beekeeping farm case studies in Northwestern Italy. Sustainabilty 2020, 12, 2302. [Google Scholar] [CrossRef]
- Hernandez, J.; Maisonnasse, A.; Cousin, M.; Beri, C.; Le Quintrec, C.; Bouetard, A.; Castex, D.; Decante, D.; Servel, E.; Buchwalder, G.; et al. ColEval: Honeybee colony structure EVALuation for field surveys. Insects 2020, 11, 41. [Google Scholar] [CrossRef]
- Delaplane, K.S.; Van Der Steen, J.; Guzman-Novoa, E. Standard methods for estimating strength parameters of Apis mellifera colonies. J. Apic. Res. 2013, 52, 1–2. [Google Scholar] [CrossRef]
- Iacoponi, L.; Romiti, R. Economia e Politica Agraria; Edagricole, Ed.; Edagricole: Bologna, Italy, 2001. [Google Scholar]
- FNOVI. Tabella Degli Acaricidi Consentiti in Italia. Available online: https://www.fnovi.it/sites/default/files/TABELLA_DEGLI_ACARICIDI_CONSENTITI_IN_ITALIA aggiornata al 21.01.2019 %282%29.pdf (accessed on 12 September 2020).
- Piedmont Region. Piano Regionale per il Controllo Dell’infestazione da Varroa Destructor 2019. 2019. Available online: https://www.regione.piemonte.it/web/sites/default/files/media/documenti/2019-04/piano_varroa_2019.pdf (accessed on 12 September 2020).
Publisher’s Note: MDPI stays neutral with regard to jurisdictional claims in published maps and institutional affiliations. |
© 2020 by the authors. Licensee MDPI, Basel, Switzerland. This article is an open access article distributed under the terms and conditions of the Creative Commons Attribution (CC BY) license (http://creativecommons.org/licenses/by/4.0/).