Machine Learning Technologies for Sustainability in Smart Cities in the Post-COVID Era


Abstract
:1. Introduction
2. Materials and Methods
- A.
- Smart City/Cities + Machine Learning + 2015–2019 + articles + science technology = 170 publications.
- B.
- Smart City/Cities + Open Data + 2015–2019 + articles + science technology = 91 publications.
- − The content of the article was outside the scope of the study.
- − The paper did not describe a data application.
3. Results
- A bibliometric analysis of the publications database.
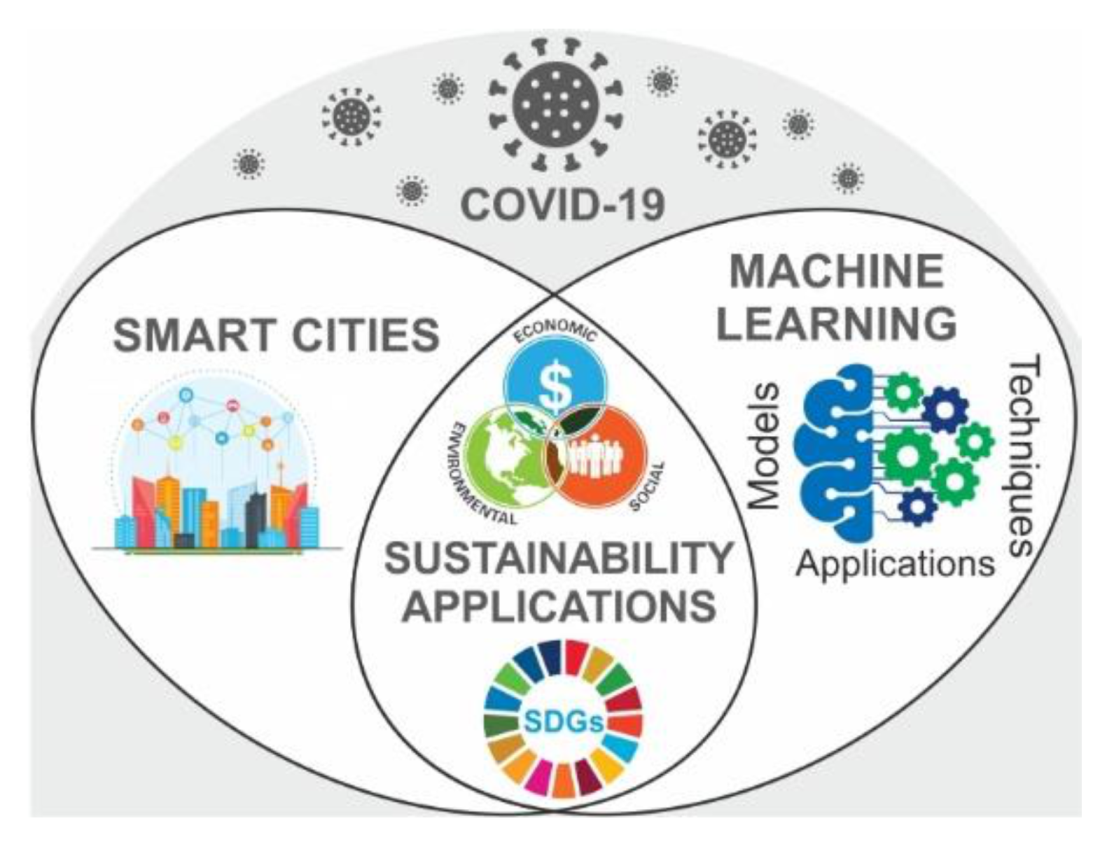
- A conceptual framework that provides an inclusive perspective on the applicability, domains and dimensions of sustainability, SDGs, tools, data types and machine learning techniques.
- A case study with the proposed model applied to the city of Malaga.
3.1. Bibliographic Results
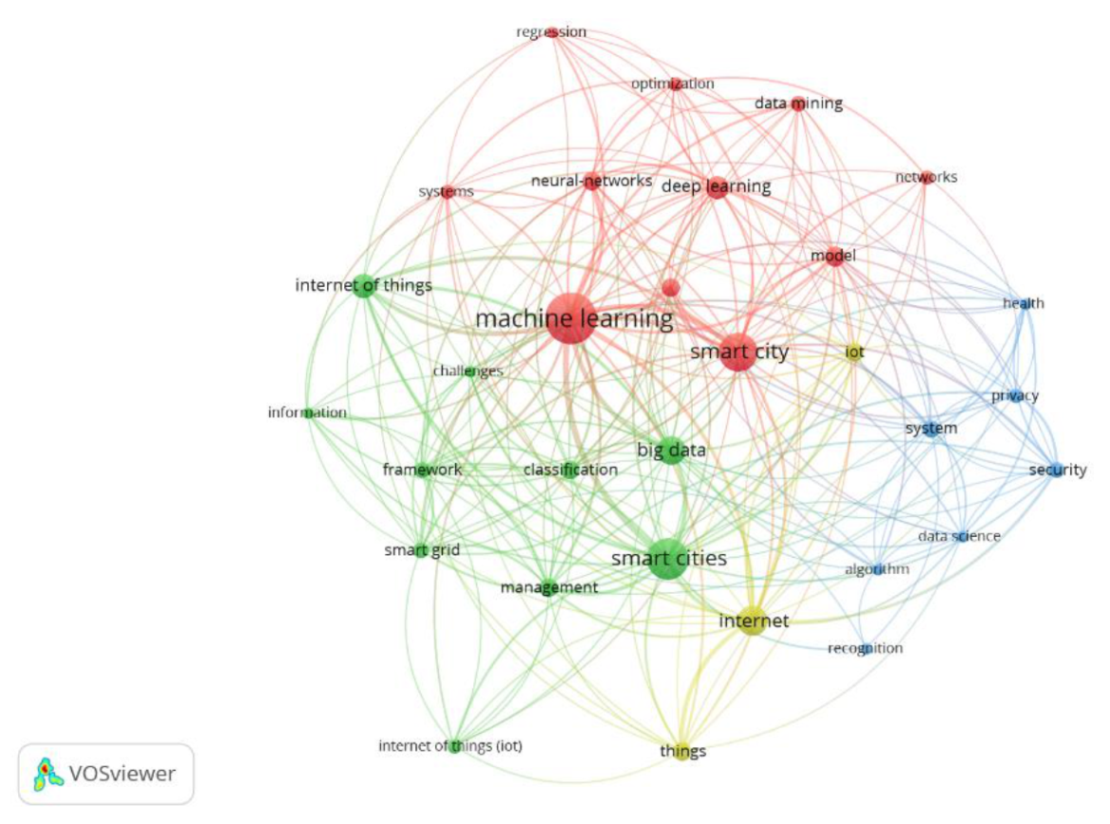
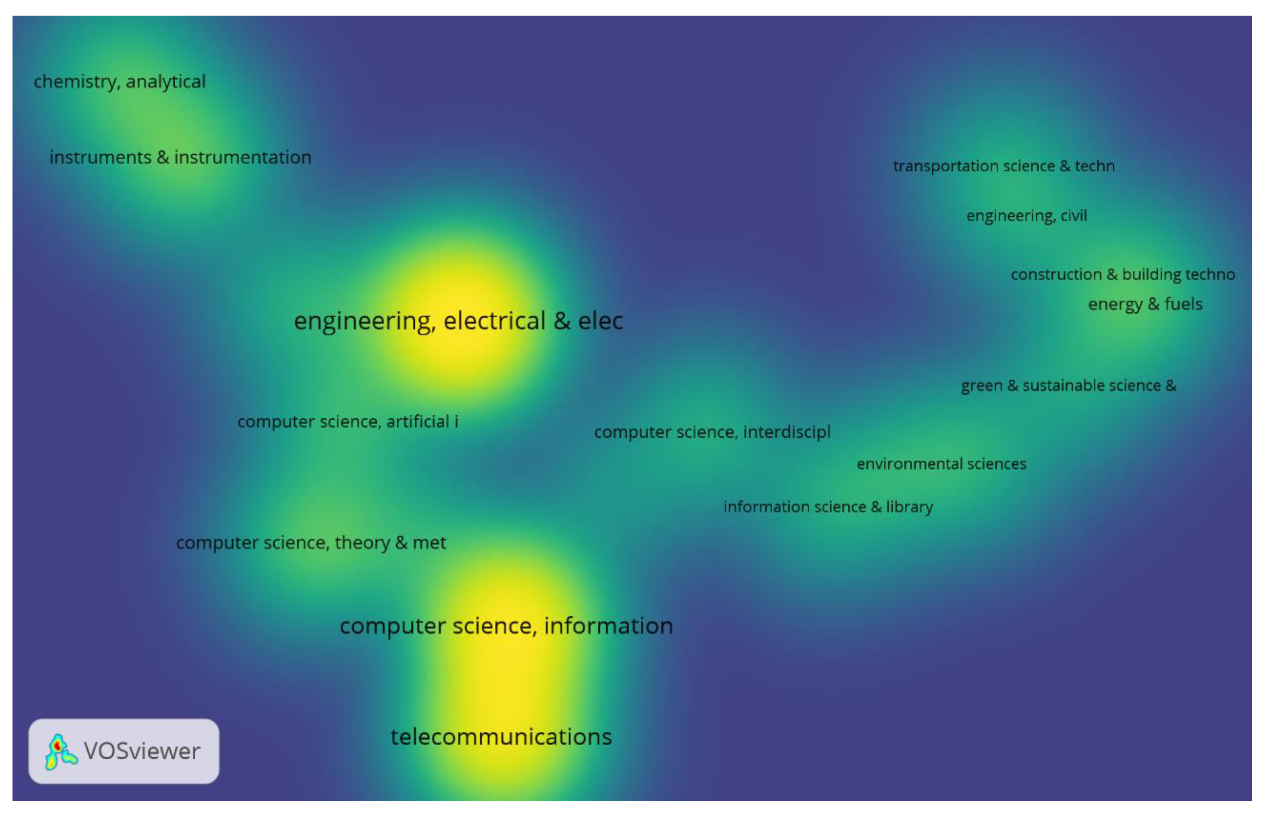
3.1.1. Bibliometric Analysis
- Co-occurrence analysis: used to measure the co-occurrence of “keyword authors”, it bases its analysis on determining the number of documents in which they appear together.
- Bibliographic coupling analysis: this type of analysis was applied to the authors of publications. The relationship between authors is measured according to the number of bibliographic references they share among their publications.
- Co-authorship analysis: this analysis measures the relationship of the items based on the number of co-authorships in the documents. This type of analysis was applied to the reference organizations of the authors of the publications analyzed.
- Citation analysis: this analysis, performed for the “source” variable, i.e., journals and publishers in which the documents are published, determines the relationship based on the number of times they are cited.
- Co-citation analysis: applied to the “sources”, this analysis explains the relationships according to the number of times the “sources” are cited together.
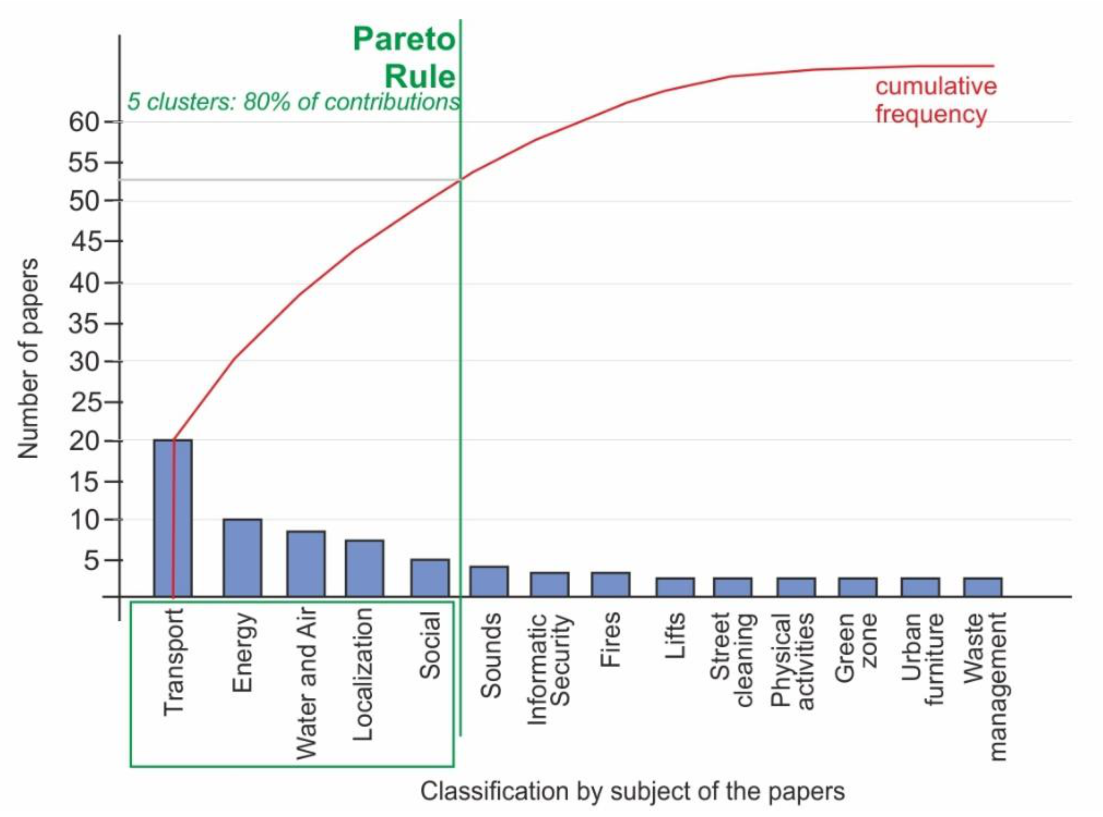
3.1.2. Bibliographic Analysis for the Conceptual Framework Proposal
- Transport
- Energy
- Water and Air
- Location
- Social transformation.
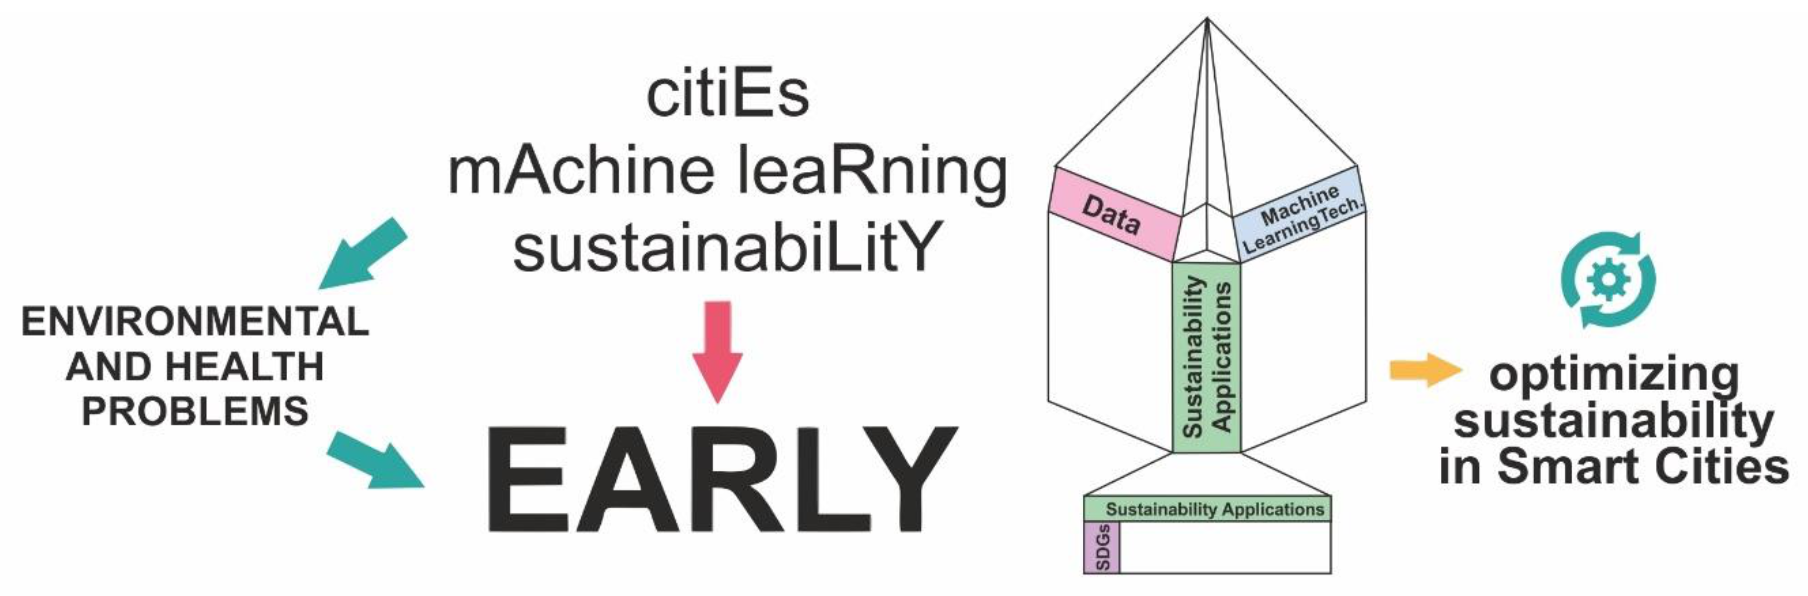
3.2. A New Conceptual Framework for Implementing Machine Learning Techniques in Smart Cities. EARLY
3.2.1. Relationship SDG-Sustainability
3.2.2. Application of Sustainability–Data Relationship
3.2.3. Relationship between Sustainability Applications and Machine Learning Techniques
4. Discussion and Case Study
4.1. Contribution Discussion
- A bibliometric analysis of the publications database.
- A conceptual framework that provides an inclusive perspective on the applicability, domains and dimensions of sustainability, SDGs, tools, data types and machine learning techniques.
- A case study with the proposed model applied to the city of Malaga.
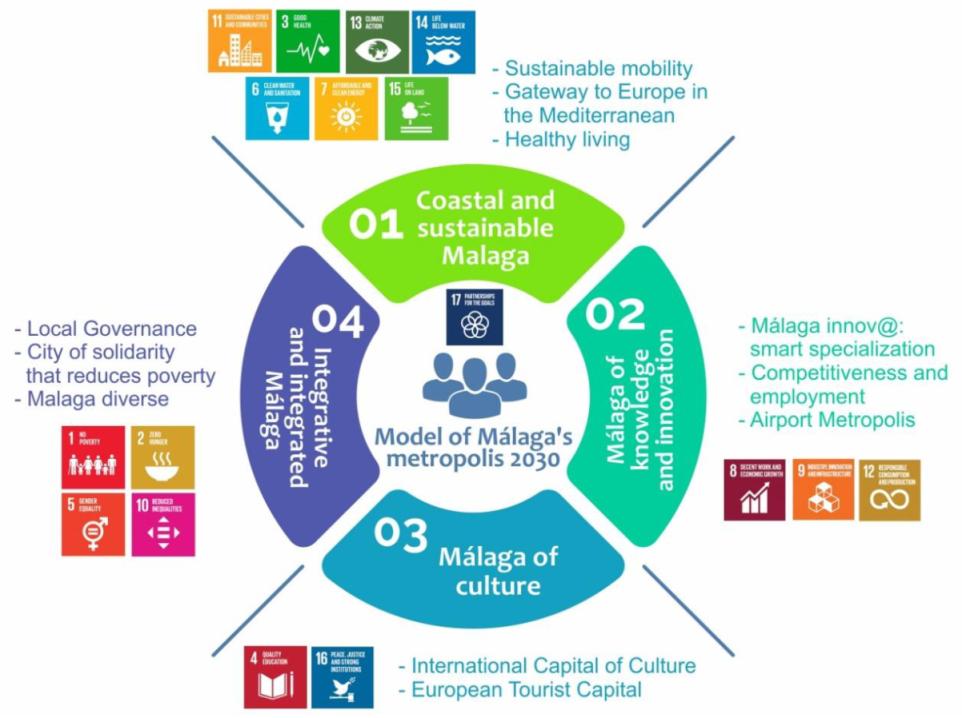
4.2. Case Study. Malaga City
4.2.1. Application
- Use of infrastructure.
- Fast charging at authorized points with exhaustive control.
- Energy optimization by using night hours to recharge electric vehicles.
- Active demand management, both for electric vehicle recharging processes and for other types of consumption.
- Quality of supply and service and guarantee of system stability.
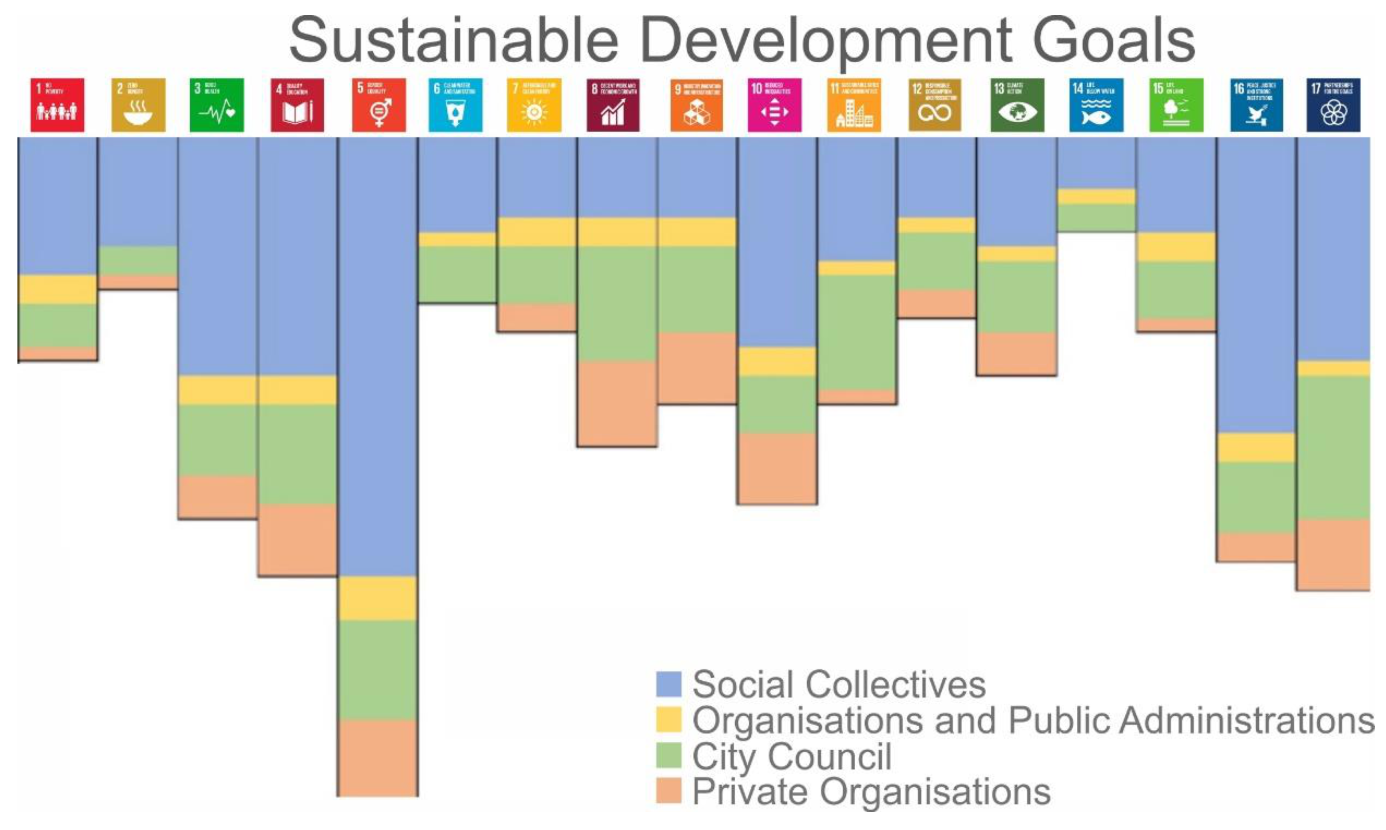
4.2.2. SDGs
4.2.3. Data
4.2.4. Machine Learning
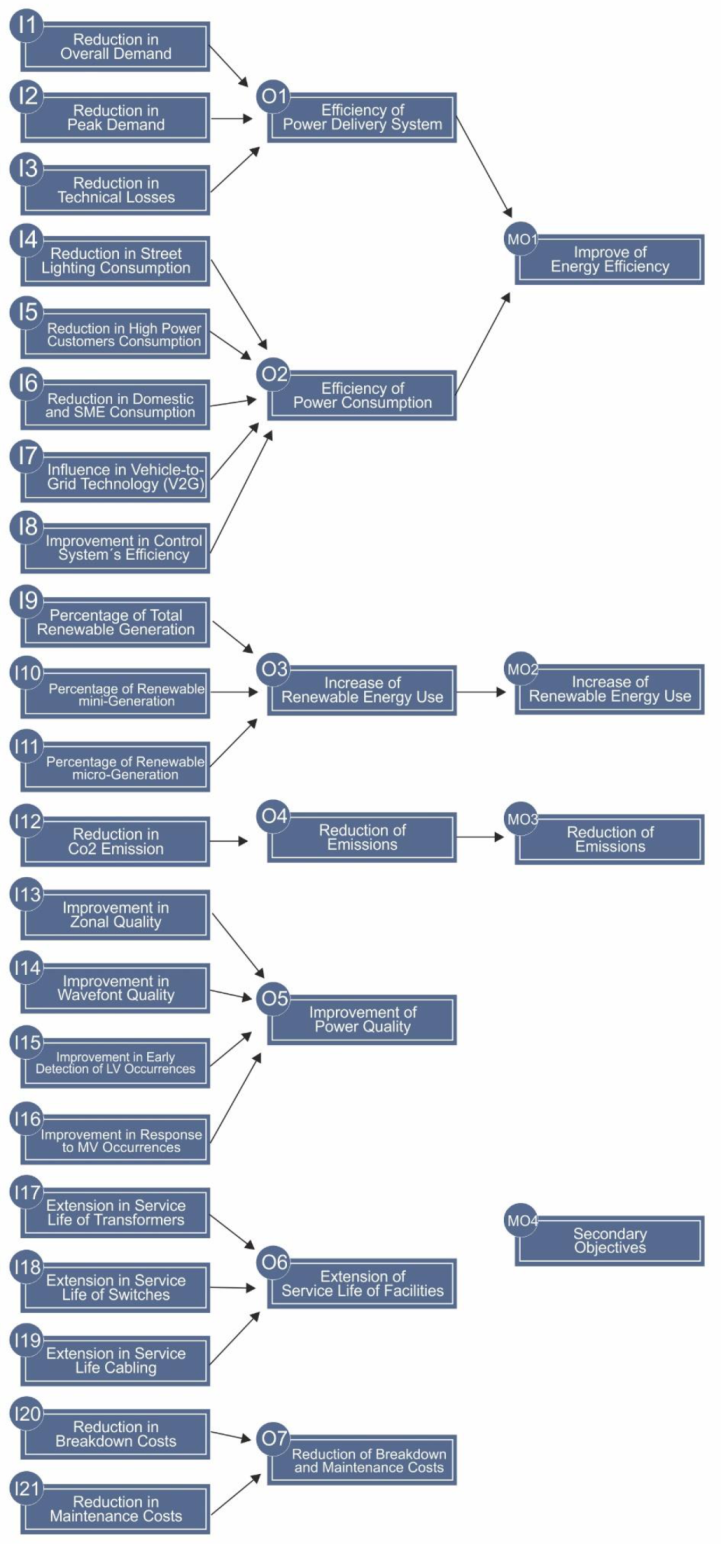
4.2.5. Evaluation
5. Conclusions
Author Contributions
Funding
Conflicts of Interest
References
- United Nations, Department of Economic and Social Affairs, Population Division. World Urbanization Prospects: The 2018 Revision (ST/ESA/SER.A/420); United Nations: New York, NY, USA, 2019; ISBN 978-92-1-148319-2. [Google Scholar]
- Lytras, M.; Visvizi, A. Who Uses Smart City Services and What to Make of It: Toward Interdisciplinary Smart Cities Research. Sustainability 2018, 10, 1998. [Google Scholar] [CrossRef] [Green Version]
- General Assembly of United Nations Transforming Our World: The 2030 Agenda for Sustainable Development. Resolution Adopted by the General Assembly on 25 September 2015. Available online: http://www.un.org/ga/search/view_doc.asp?symbol=A/RES/70/1&Lang=E (accessed on 7 November 2018).
- Sachs, J.D. From Millennium Development Goals to Sustainable Development Goals. Lancet 2012, 379, 2206–2211. [Google Scholar] [CrossRef]
- Zamora-Polo, F.; Sánchez-Martín, J.; Corrales-Serrano, M.; Espejo-Antúnez, L. What Do University Students Know about Sustainable Development Goals? A Realistic Approach to the Reception of this UN Program Amongst the Youth Population. Sustainability 2019, 11, 3533. [Google Scholar] [CrossRef] [Green Version]
- Marcos, T. Más normas para las ciudades inteligentes. AENOR Rev. Norm. Certif. 2015, 209, 28–31. [Google Scholar]
- Won Sonn, J.; Lee, J.K. The smart city as time-space cartographer in COVID-19 control: The South Korean strategy and democratic control of surveillance technology. Eurasian Geogr. Econ. 2020, 1–11. [Google Scholar] [CrossRef]
- Yi, H.-B.; Nie, Z. Mobility Innovation through an Efficient Mobile System for Bike Sharing on Campus. In Proceedings of the 2017 International Conference on Network and Information Systems for Computers (ICNISC), Shanghai, China, 14–16 April 2017; pp. 153–157. [Google Scholar]
- De Vos, J. The effect of COVID-19 and subsequent social distancing on travel behavior. Transp. Res. Interdiscip. Perspect. 2020, 5, 100121. [Google Scholar] [CrossRef]
- Chin, J.; Callaghan, V.; Lam, I. Understanding and personalising smart city services using machine learning, the Internet-of-Things and Big Data. IEEE Int. Symp. Ind. Electron. 2017, 2050–2055. [Google Scholar] [CrossRef] [Green Version]
- United Nations. The Sustainable Development Goals Report; United Nations Publications: New York, NY, USA, 2020; ISBN 978-92-1-004960-3. [Google Scholar]
- International Monetary Fund. Transcript of Kristalina Georgieva’s Participation in the World Health Organization Press Briefing. 2020. Available online: https://www.imf.org/en/News/Articles/%0A2020/04/03/tr040320-transcript-kristalina-georgieva-participation-world-health-organization-pressbriefing (accessed on 25 June 2020).
- ILO. COVID-19 and World of Work: Impacts and Responses 2020; International Labour Organization: Geneva, Switzerland, 2020. [Google Scholar]
- Lenzen, M.; Li, M.; Malik, A.; Pomponi, F.; Sun, Y.Y.; Wiedmann, T.; Faturay, F.; Fry, J.; Gallego, B.; Geschke, A.; et al. Global socio-economic losses and environmental gains from the coronavirus pandemic. PLoS ONE 2020, 15, 1–13. [Google Scholar] [CrossRef]
- Harari, Y. The world after coronavirus. Financ Times. 2020. Available online: https://www.ft.com/content/19d90308-6858-11ea-a3c9-1fe6fedcca75 (accessed on 12 October 2020).
- Mozur, P.; Zhong, R.; Krolik, A. Coronavirus Fight, China Gives Citizens a Color Code, with Red Flags. New York Times. 2020. Available online: https://www.nytimes.com/2020/03/01/business/china-coronavirus-surveillance.html (accessed on 10 October 2020).
- Mahbubani, R. More than 100 Wild Animals in China Died from Poisoning in A Mass Die-Off Seemingly Triggered by Coronavirus Disinfectant. Bussines Insid. Available online: https://www.businessinsider.in/science/news/more-than-100-wild-animals-died-from-poisoning-in-a-mass-die-off-seemingly-triggered-by-coronavirus-disinfectant/articleshow/74250392.cms (accessed on 10 October 2020).
- Bao, R.; Zhang, A. Does lockdown reduce air pollution? Evidence from 44 cities in northern China. Sci. Total Environ. 2020, 731, 139052. [Google Scholar] [CrossRef]
- Watermeyer, R.; Crick, T.; Knight, C.; Goodall, J. COVID-19 and digital disruption in UK universities: Afflictions and affordances of emergency online migration. High. Educ. 2020. [Google Scholar] [CrossRef]
- Šagát, P.; Bartík, P.; Prieto González, P.; Tohănean, D.I.; Knjaz, D. Impact of COVID-19Quarantine on Low Back Pain Intensity, Prevalence, and Associated Risk Factors among Adult Citizens Residing in Riyadh (Saudi Arabia): A Cross-Sectional Study. Int. J. Environ. Res. Public Health 2020, 17, 7302. [Google Scholar] [CrossRef] [PubMed]
- Stresses, S.-G. We Are Only as Strong as the Weakest; United Nations: New York, NY, USA, 2020. [Google Scholar]
- School of Computer Science Canergie Mellon University. Available online: www.cs.cmu.edu (accessed on 25 October 2020).
- Goodfellow, I.; Bengio, Y.; Courville, A. Deep Learning; MIT Press: Cmabridge, MA, USA, 2016; ISBN 978-0262035613. [Google Scholar]
- Koza, J.R.; Bennett, F.H.; Andre, D.; Keane, M.A. Automated Design of Both the Topology and Sizing of Analog Electrical Circuits Using Genetic Programming. In Artificial Intelligence in Design ’96; Springer: Dordrecht, The Netherlands, 1996; pp. 151–170. [Google Scholar]
- Petrillo, F.; Sardaro, R. Urbanizzazione in chiave neoliberale e progetti di sviluppo a grande scala. Sci. Reg. 2014, 125–134. [Google Scholar] [CrossRef]
- Komninos, N.; Mora, L. Exploring the big picture of smart city research. Sci. Reg. 2018, 17, 15–38. [Google Scholar] [CrossRef]
- De las Heras García de Vinuesa, A.; Aguayo González, F.; Cördoba Roldan, A. Propuesta de marco de trabajo para la evaluación de la sostenibilidad de productos desde el paradigma de la economía circular basada en la industria 4.0 (parte 1). DYNA Ing. E Ind. 2018, 93, 360–364. [Google Scholar] [CrossRef]
- Ferraris, A.; Santoro, G.; Pellicelli, A.C. “Openness” of public governments in smart cities: Removing the barriers for innovation and entrepreneurship. Int. Entrep. Manag. J. 2020. [Google Scholar] [CrossRef]
- Ferraris, A.; Santoro, G.; Bresciani, S.; Carayannis, E.G. HR practices for explorative and exploitative alliances in smart cities: Evidences from smart city managers’ perspective. Manag. Decis. 2018, 56, 1183–1197. [Google Scholar] [CrossRef]
- Aldekoa, A. Las Ciudades Tras el COVID 19. Available online: https://www.eixoatlantico.com/es/noticias/opinion/4639-las-ciudades-tras-el-covid-19 (accessed on 1 May 2020).
- Tranfield, D.; Denyer, D.; Smart, P. Towards a Methodology for Developing Evidence-Informed Management Knowledge by Means of Systematic Review. Br. J. Manag. 2003, 14, 207–222. [Google Scholar] [CrossRef]
- Sorrell, S. Improving the evidence base for energy policy: The role of systematic reviews. Energy Policy 2007, 35, 1858–1871. [Google Scholar] [CrossRef]
- Zamora-Polo, F.; Luque-Sendra, A.; Sánchez-Martín, J.; Aguayo-González, F. Conceptual framework for the use of building information modeling in engineering education. Int. J. Eng. Educ 2019, 35, 744–755. [Google Scholar]
- Grosfeld-Nir, A.; Ronen, B.; Kozlovsky, N. The Pareto managerial principle: When does it apply? Int. J. Prod. Res. 2007, 45, 2317–2325. [Google Scholar] [CrossRef]
- Zhao, D.; Strotmann, A. Analysis and Visualization of Citation Networks. Synth. Lect. Inf. Concepts Retr. Serv. 2015, 7, 1–207. [Google Scholar] [CrossRef]
- de Souza, J.T.; de Francisco, A.C.; Piekarski, C.M.; do Prado, G.F. Data mining and machine learning to promote smart cities: A systematic review from 2000 to 2018. Sustainability 2019, 11, 1077. [Google Scholar] [CrossRef] [Green Version]
- Gupta, P.; Chauhan, S.; Jaiswal, M.P. Classification of Smart City Research—A Descriptive Literature Review and Future Research Agenda. Inf. Syst. Front. 2019, 21, 661–685. [Google Scholar] [CrossRef]
- Le Blanc, D. Towards Integration at Last? The Sustainable Development Goals as a Network of Targets. Sustain. Dev. 2015, 23, 176–187. [Google Scholar] [CrossRef]
- Verborgh, R.; De Wilde, M. Using OpenRefine; Pack Publishing Ltd.: Birmingham, UK, 2013; ISBN 9781783289080. [Google Scholar]
- van Eck, N.J.; Waltman, L. {VOSviewer} manual. Leiden Univeristeit Leiden 2013, 1, 1–53. [Google Scholar]
- van Eck, N.J.; Waltman, L. Visualizing Bibliometric Networks. In Measuring Scholarly Impact; Springer International Publishing: Cham, Switzerland, 2014; pp. 285–320. [Google Scholar]
- van Eck, N.J.; Waltman, L. Software survey: VOSviewer, a computer program for bibliometric mapping. Scientometrics 2010, 84, 523–538. [Google Scholar] [CrossRef] [PubMed] [Green Version]
- van Eck, N.J.; Waltman, L.; Dekker, R.; van den Berg, J. A comparison of two techniques for bibliometric mapping: Multidimensional scaling and VOS. J. Am. Soc. Inf. Sci. Technol. 2010, 61, 2405–2416. [Google Scholar] [CrossRef] [Green Version]
- Donner, P.; Rimmert, C.; van Eck, N.J. Comparing institutional-level bibliometric research performance indicator values based on different affiliation disambiguation systems. Quant. Sci. Stud. 2020, 1, 150–170. [Google Scholar] [CrossRef]
- Lom, M.; Pribyl, O.; Svitek, M. Industry 4.0 as a part of smart cities. In Proceedings of the 2016 Smart Cities Symposium Prague (SCSP), Prague, Czech Republic, 26–27 May 2016; pp. 1–6. [Google Scholar]
- Luque, A.; De Las Heras, A.; Ávila-Gutiérrez, M.J.; Zamora-Polo, F. ADAPTS: An Intelligent Sustainable Conceptual Framework for Engineering Projects. Sensors 2020, 20, 1553. [Google Scholar] [CrossRef] [Green Version]
- Ontiveros, E.; Vizcaíno, D.; Sabater, V.L. Las Ciudades del Futuro: Inteligentes, Digitales y Sostenibles; Ariel y Fundación Telefónica: Barcelona, Spain, 2016; ISBN 9788408170242. [Google Scholar]
- Ismagiloiva, E.; Hughes, L.; Rana, N.; Dwivedi, Y. Role of Smart Cities in Creating Sustainable Cities and Communities: A Systematic Literature Review. In ICT Unbounded, Social Impact of Bright ICT Adoption. TDIT 2019. IFIP Advances in Information and Communication Technology; Springer: Cham, Switzerland, 2019; pp. 311–324. ISBN 9783030206710. [Google Scholar]
- González-Domínguez, J.; Sánchez-Barroso, G.; Zamora-Polo, F.; García-Sanz-Calcedo, J. Application of Circular Economy Techniques for Design and Development of Products through Collaborative Project-Based Learning for Industrial Engineer Teaching. Sustainability 2020, 12, 4368. [Google Scholar] [CrossRef]
- Chammas, M.; Makhoul, A.; Demerjian, J. An efficient data model for energy prediction using wireless sensors. Comput. Electr. Eng. 2019, 76, 249–257. [Google Scholar] [CrossRef] [Green Version]
- Fenza, G.; Gallo, M.; Loia, V. Drift-Aware Methodology for Anomaly Detection in Smart Grid. IEEE Access 2019, 7, 9645–9657. [Google Scholar] [CrossRef]
- Pérez-Chacón, R.; Luna-Romera, J.; Troncoso, A.; Martínez-Álvarez, F.; Riquelme, J. Big Data Analytics for Discovering Electricity Consumption Patterns in Smart Cities. Energies 2018, 11, 683. [Google Scholar] [CrossRef] [Green Version]
- Idowu, S.; Saguna, S.; Åhlund, C.; Schelén, O. Applied machine learning: Forecasting heat load in district heating system. Energy Build. 2016, 133, 478–488. [Google Scholar] [CrossRef]
- Rodríguez Fernández, M.; González Alonso, I.; Zalama Casanova, E. Online identification of appliances from power consumption data collected by smart meters. Pattern Anal. Appl. 2016, 19, 463–473. [Google Scholar] [CrossRef]
- Zang, M.; Xing, Z.; Tan, Y. IoT-based personal thermal comfort control for livable environment. Int. J. Distrib. Sens. Netw. 2019, 15, 155014771986550. [Google Scholar] [CrossRef] [Green Version]
- Zhang, W.; Liu, F.; Fan, R. Improved thermal comfort modeling for smart buildings: A data analytics study. Int. J. Electr. Power Energy Syst. 2018, 103, 634–643. [Google Scholar] [CrossRef]
- Vázquez-Canteli, J.R.; Ulyanin, S.; Kämpf, J.; Nagy, Z. Fusing TensorFlow with building energy simulation for intelligent energy management in smart cities. Sustain. Cities Soc. 2019, 45, 243–257. [Google Scholar] [CrossRef]
- Siryani, J.; Tanju, B.; Eveleigh, T.J. A Machine Learning Decision-Support System Improves the Internet of Things’ Smart Meter Operations. IEEE Internet Things J. 2017, 4, 1056–1066. [Google Scholar] [CrossRef]
- Shamshirband, S.; Hadipoor, M.; Baghban, A.; Mosavi, A.; Bukor, J.; Várkonyi-Kóczy, A.R. Developing an ANFIS-PSO Model to Predict Mercury Emissions in Combustion Flue Gases. Mathematics 2019, 7, 965. [Google Scholar] [CrossRef] [Green Version]
- Ameer, S.; Shah, M.A.; Khan, A.; Song, H.; Maple, C.; Islam, S.U.; Asghar, M.N. Comparative Analysis of Machine Learning Techniques for Predicting Air Quality in Smart Cities. IEEE Access 2019, 7, 128325–128338. [Google Scholar] [CrossRef]
- Dutta, D.; Pradhan, A.; Acharya, O.P.; Mohapatra, S.K. IoT based pollution monitoring and health correlation: A case study on smart city. Int. J. Syst. Assur. Eng. Manag. 2019, 10, 731–738. [Google Scholar] [CrossRef]
- Martínez-España, R.; Bueno-Crespo, A.; Timón, I.; Soto, J.; Muñoz, A.; Cecilia, J.M. Air-pollution prediction in smart cities through machine learning methods: A case of study in Murcia, Spain. J. Univers. Comput. Sci. 2018, 24, 261–276. [Google Scholar]
- Lin, B.; Huangfu, Y.; Lima, N.; Jobson, B.; Kirk, M.; O’Keeffe, P.; Pressley, S.; Walden, V.; Lamb, B.; Cook, D. Analyzing the Relationship between Human Behavior and Indoor Air Quality. J. Sens. Actuator Netw. 2017, 6, 13. [Google Scholar] [CrossRef] [Green Version]
- Malik, M.N.; Azam, M.A.; Ehatisham-Ul-Haq, M.; Ejaz, W.; Khalid, A. ADLAuth: Passive Authentication Based on Activity of Daily Living Using Heterogeneous Sensing in Smart Cities. Sensors 2019, 19, 2466. [Google Scholar] [CrossRef] [Green Version]
- Verde, L.; De Pietro, G.; Alrashoud, M.; Ghoneim, A.; Al-Mutib, K.N.; Sannino, G. Leveraging Artificial Intelligence to Improve Voice Disorder Identification Through the Use of a Reliable Mobile App. IEEE Access 2019, 7, 124048–124054. [Google Scholar] [CrossRef]
- Serrano, E.; Bajo, J. Deep neural network architectures for social services diagnosis in smart cities. Futur. Gener. Comput. Syst. 2019, 100, 122–131. [Google Scholar] [CrossRef]
- Estrada, E.; Maciel, R.; Ortíz Zezzatti, C.A.O.; Bernabe-Loranca, B.; Oliva, D.; Larios, V. Smart City Visualization Tool for the Open Data Georeferenced Analysis Utilizing Machine Learning. Int. J. Comb. Optim. Probl. Inform. 2018, 9, 25–40. [Google Scholar]
- Gong, Z.; Li, X.; Liu, J.; Gong, Y. Machine learning in explaining nonprofit organizations’ participation: A driving factors analysis approach. Neural Comput. Appl. 2019, 31, 8267–8277. [Google Scholar] [CrossRef]
- Ahmed, U.; Mumtaz, R.; Anwar, H.; Shah, A.A.; Irfan, R.; García-Nieto, J. Efficient Water Quality Prediction Using Supervised Machine Learning. Water 2019, 11, 2210. [Google Scholar] [CrossRef] [Green Version]
- Preciado, J.C.; Prieto, Á.E.; Benitez, R.; Rodríguez-Echeverría, R.; Conejero, J.M. A High-Frequency Data-Driven Machine Learning Approach for Demand Forecasting in Smart Cities. Sci. Program. 2019, 2019, 1–16. [Google Scholar] [CrossRef]
- D’Amico, B.; Myers, R.J.; Sykes, J.; Voss, E.; Cousins-Jenvey, B.; Fawcett, W.; Richardson, S.; Kermani, A.; Pomponi, F. Machine Learning for Sustainable Structures: A Call for Data. Structures 2019, 19, 1–4. [Google Scholar] [CrossRef]
- Perrotta, F.; Parry, T.; Neves, L.C.; Mesgarpour, M. A machine learning approach for the estimation of fuel consumption related to road pavement rolling resistance for large fleets of trucks. In Life Cycle Analysis and Assessment in Civil Engineering: Towards an Integrated Vision, Proceedings of the Sixth International Symposium on Life-Cycle Civil Engineering (IALCCE 2018), Ghent, Belgium, 28–31 October 2018; CRC Press: Boca Raton, FL, USA, 2019; pp. 2011–2015. [Google Scholar]
- Cabot, M.I.; Luque, A.; de las Heras, A.; Aguayo, F. Aspects of sustainability and design engineering for the production of interconnected smart food packaging. PLoS ONE 2019, 14. [Google Scholar] [CrossRef]
- Nabavi-Pelesaraei, A.; Rafiee, S.; Mohtasebi, S.S.; Hosseinzadeh-Bandbafha, H.; Chau, K. Integration of artificial intelligence methods and life cycle assessment to predict energy output and environmental impacts of paddy production. Sci. Total Environ. 2018, 631–632, 1279–1294. [Google Scholar] [CrossRef] [PubMed]
- Kaab, A.; Sharifi, M.; Mobli, H.; Nabavi-Pelesaraei, A.; Chau, K. Combined life cycle assessment and artificial intelligence for prediction of output energy and environmental impacts of sugarcane production. Sci. Total Environ. 2019, 664, 1005–1019. [Google Scholar] [CrossRef]
- Sharif, S.A.; Hammad, A. Developing surrogate ANN for selecting near-optimal building energy renovation methods considering energy consumption, LCC and LCA. J. Build. Eng. 2019, 25, 100790. [Google Scholar] [CrossRef]
- Li, Y.; Zhang, H.; Roy, U.; Lee, Y.T. A data-driven approach for improving sustainability assessment in advanced manufacturing. In Proceedings of the 2017 IEEE International Conference on Big Data (Big Data), Boston, MA, USA, 11–14 December 2017; pp. 1736–1745. [Google Scholar]
- Wisthoff, A.; Ferrero, V.; Huynh, T.; DuPont, B. Quantifying the Impact of Sustainable Product Design Decisions in the Early Design Phase Through Machine Learning. In Proceedings of the Volume 4: 21st Design for Manufacturing and the Life Cycle Conference; 10th International Conference on Micro- and Nanosystems, Charlotte, NC, USA, 21–24 August 2016; American Society of Mechanical Engineers. [Google Scholar]
- Feng, K.; Lu, W.; Wang, Y. Assessing environmental performance in early building design stage: An integrated parametric design and machine learning method. Sustain. Cities Soc. 2019, 50, 101596. [Google Scholar] [CrossRef]
- Khan, S.; Muhammad, K.; Mumtaz, S.; Baik, S.W.; de Albuquerque, V.H.C. Energy-Efficient Deep CNN for Smoke Detection in Foggy IoT Environment. IEEE Internet Things J. 2019, 6, 9237–9245. [Google Scholar] [CrossRef]
- AL Zamil, M.G.H.; Samarah, S.; Rawashdeh, M.; Karime, A.; Hossain, M.S. Multimedia-oriented action recognition in Smart City-based IoT using multilayer perceptron. Multimed. Tools Appl. 2019, 78, 30315–30329. [Google Scholar] [CrossRef]
- Zhang, N.; Chen, H.; Chen, X.; Chen, J. Forecasting Public Transit Use by Crowdsensing and Semantic Trajectory Mining: Case Studies. ISPRS Int. J. Geo-Inf. 2016, 5, 180. [Google Scholar] [CrossRef] [Green Version]
- Almisreb, A.A.; Jamil, N.; Din, N.M. Utilizing AlexNet Deep Transfer Learning for Ear Recognition. In Proceedings of the 2018 Fourth International Conference on Information Retrieval and Knowledge Management (CAMP), Kota Kinabalu, Malaysia, 26–28 March 2018; pp. 1–5. [Google Scholar]
- Salavati, P.; Mohammadi, H.M. Obstacle Detection Using GoogleNet. In Proceedings of the 2018 8th International Conference on Computer and Knowledge Engineering (ICCKE), Mashhad, Iran, 25–26 October 2018; pp. 326–332. [Google Scholar]
- Hashemi, M. Reusability of the Output of Map-Matching Algorithms Across Space and Time Through Machine Learning. IEEE Trans. Intell. Transp. Syst. 2017, 18, 3017–3026. [Google Scholar] [CrossRef]
- Hossen, M.I.; Michael, G.K.O.; Connie, T.; Lau, S.H.; Hossain, F. Smartphone-Based Context Flow Recognition for Outdoor Parking System with Machine Learning Approaches. Electronics 2019, 8, 784. [Google Scholar] [CrossRef] [Green Version]
- Abbas, S.; Khan, M.A.; Falcon-Morales, L.E.; Rehman, A.; Saeed, Y.; Zareei, M.; Zeb, A.; Mohamed, E.M. Modeling, Simulation and Optimization of Power Plant Energy Sustainability for IoT Enabled Smart Cities Empowered with Deep Extreme Learning Machine. IEEE Access 2020, 8, 39982–39997. [Google Scholar] [CrossRef]
- Li, C. Designing a short-term load forecasting model in the urban smart grid system. Appl. Energy 2020, 266, 114850. [Google Scholar] [CrossRef]
- Chui, K.T.; Lytras, M.D.; Visvizi, A. Energy Sustainability in Smart Cities: Artificial Intelligence, Smart Monitoring, and Optimization of Energy Consumption. Energies 2018, 11, 2869. [Google Scholar] [CrossRef] [Green Version]
- Li, Z.; Al Hassan, R.; Shahidehpour, M.; Bahramirad, S.; Khodaei, A. A Hierarchical Framework for Intelligent Traffic Management in Smart Cities. IEEE Trans. Smart Grid 2019, 10, 691–701. [Google Scholar] [CrossRef]
- Fiore, U.; Florea, A.; Pérez Lechuga, G. An Interdisciplinary Review of Smart Vehicular Traffic and Its Applications and Challenges. J. Sens. Actuator Netw. 2019, 8, 13. [Google Scholar] [CrossRef] [Green Version]
- Huang, Q. Review: Energy-Efficient Smart Building Driven by Emerging Sensing, Communication, and Machine Learning Technologies. Eng. Lett. 2018, 26, 5. [Google Scholar]
- Bapin, Y.; Zarikas, V. Smart Building’s Elevator with Intelligent Control Algorithm based on Bayesian Networks. Int. J. Adv. Comput. Sci. Appl. 2019, 10. [Google Scholar] [CrossRef] [Green Version]
- Gonçalves, D.; Sheikhnejad, Y.; Oliveira, M.; Martins, N. One step forward toward smart city Utopia: Smart building energy management based on adaptive surrogate modelling. Energy Build. 2020, 223, 110146. [Google Scholar] [CrossRef]
- Panagiotopoulou, M.; Kokla, M.; Stratigea, A. Conceptualizing Small and Medium-Sized Smart Cities in the Mediterranean Region. Int. J. E-Plan. Res. 2019, 8, 17–41. [Google Scholar] [CrossRef]
- Mora, L.; Bolici, R.; Deakin, M. The First Two Decades of Smart-City Research: A Bibliometric Analysis. J. Urban Technol. 2017, 24, 3–27. [Google Scholar] [CrossRef]
- Málaga, A. de Plan Estratégico de Innovación Tecnológica. Available online: http://malagasmart.malaga.eu/opencms/export/sites/msmart/.content/galerias/documentos/Plan_Estrategico_de_Innovacion_bajares.pdf (accessed on 1 July 2020).
- Fundación Ciedes La Alineación del Plan Estratégico de Málaga con la Agenda 2030 de Naciones Unidas. El Proceso de Elaboración de la Agenda ODS Málaga 2030. Available online: https://ciedes.es/el-plan/agenda-ods-2030.html (accessed on 20 June 2020).
- Endesa Proyecto PASTORA. Available online: https://lasciudadesinteligentes.com/generacion-electrica/big-data-deep-learning-energia-pastora/ (accessed on 26 June 2020).
- Endesa PASTORA, Inteligencia Artificial en la Red de Distribución. Available online: https://www.endesa.com/es/proyectos/todos-los-proyectos/transicion-energetica/redes-inteligentes/pastora-inteligencia-artificial-red-distribucion (accessed on 1 July 2020).
- Endesa, F. Smart Cities. Available online: https://www.fundacionendesa.org/es/recursos/a201908-smart-city (accessed on 29 June 2020).
- Sanchez Molina, P. Endesa Usa la Inteligencia Artificial en la Red de Distribución. Available online: https://www.pv-magazine.es/2019/01/09/endesa-usa-la-inteligencia-artificial-en-la-red-de-distribucion/ (accessed on 1 July 2020).
- Endesa Consejos Eficiencia Coche Eléctrico. Available online: https://lasciudadesinteligentes.com/movilidad-sostenible/consejos-eficiencia-coche-electrico/ (accessed on 1 July 2020).


| Position | Organization | Number of Documents |
|---|---|---|
| 1 | University of Ottawa | 6 |
| 2 | Sejong University | 4 |
| 3 | Huazhong University Science & technology | 3 |
| 4 | University of Florence | 3 |
| 5 | Nanyang Technology University | 3 |
| 6 | Northeastern University | 3 |
| 7 | University of Thessaly | 3 |
| 8 | University of Málaga | 3 |
| Position | Organization | Citations |
|---|---|---|
| 1 | La Trobe University | 93 |
| 2 | University of Ottawa | 88 |
| 3 | Imperial College of London | 65 |
| 4 | King Abdulaziz University | 57 |
| 5 | Canadian University of Dubai | 45 |
| 6 | Lulea University Technology | 44 |
| 7 | University of Edinburgh | 44 |
Publisher’s Note: MDPI stays neutral with regard to jurisdictional claims in published maps and institutional affiliations. |
© 2020 by the authors. Licensee MDPI, Basel, Switzerland. This article is an open access article distributed under the terms and conditions of the Creative Commons Attribution (CC BY) license (http://creativecommons.org/licenses/by/4.0/).
Share and Cite
De Las Heras, A.; Luque-Sendra, A.; Zamora-Polo, F. Machine Learning Technologies for Sustainability in Smart Cities in the Post-COVID Era. Sustainability 2020, 12, 9320. https://doi.org/10.3390/su12229320
De Las Heras A, Luque-Sendra A, Zamora-Polo F. Machine Learning Technologies for Sustainability in Smart Cities in the Post-COVID Era. Sustainability. 2020; 12(22):9320. https://doi.org/10.3390/su12229320
Chicago/Turabian StyleDe Las Heras, Ana, Amalia Luque-Sendra, and Francisco Zamora-Polo. 2020. "Machine Learning Technologies for Sustainability in Smart Cities in the Post-COVID Era" Sustainability 12, no. 22: 9320. https://doi.org/10.3390/su12229320