Abstract
The aircrafts’ engine performance deteriorates sharply during the take-off and landing at high plateau airport. This situation increases the take-off or landing distance, aggravating the hidden danger of birdstrikes at high plateau airport. This paper first used GIS to classify and rasterize the bird data and calculated the monthly Birdstrike Risk Index (BRI) within 6, 13, and 25 km radii of Lhasa Airport, based on the bird observation data of Tibet and the birdstrike data of Lhasa Airport from 2015 to 2019. The spatiotemporal relationships between the BRI and the environmental factors around Lhasa Airport were compared by the Geographically or Temporally Weighted Regression (GWR or TWR) model and Geographically and Temporally Weighted Regression (GTWR) model. The results showed that the temporal nonstationary effect of environmental factors was more significant than that of spatial nonstationary at Lhasa Airport. Besides, the composition of land types had positive impacts on birdstrike risk within the 6 km radius, and this scope was broader than that of the plain airport. Within the 13 km and 25 km ranges, the water distribution and the altitude during dry season also positively impacted birdstrike risk. Moreover, the key factor to birdstrike risk was the water distribution in December.
1. Introduction
High plateau airport is an airport with an altitude of more than 2438 m (8000 feet). Due to the complex and harsh terrain and meteorological conditions, the aircraft’s engine performance is reduced, such as difficulty to start, thrust reduction, and other problems. Therefore, the runway length, thickness, and width of the high plateau airport are higher than those of the plain airport [1,2]. As a result, aircraft occupy runways and airways for a long time during take-off and landing at high plateau airports, resulting in a higher birdstrike risk than plain airports. Thus, the hidden danger of birdstrike in the high plateau airport is one of the important factors affecting the airport’s safe operation.
At present, the assessment methods of birdstrike risk at the airport are mainly based on the risk matrix with the combination of occurrence probability and historical severity. For example, the airport specific data was used to evaluate birdstrike risk by creating a simple probability-time-severity matrix [3]. Furthermore, Ning et al. [4] used the real-time bird radar data of Beijing Capital International Airport in 2014 to evaluate the birdstrike hazard degree by combining the Delphi Method and Analytic Hierarchy Process. The probability estimation model was used to determine the birdstrike probability based on the relative position of the flock and the runway, the flock and the height of the aircraft, the aircraft route, and the bird avoidance ability to evaluate birdstrike risk in the airfield area. However, Cecilia et al. [5] used the Birdstrike Risk Index (BRI) to describe the airport birdstrike risk according to the actual bird existence data, taking into account the relative risk of birds across species, and provided information for the priority of airport management actions. They improved the BRI in the following year [6] by adding two groups of wild animal species, changing the application of the effect on flight, and conducting a contrastive analysis in Italy to avoid the flattening of large-scale wildlife impact on aircraft while maintaining a comparable airport risk assessment. It can be seen that the existing studies on birdstrike risk are mainly based on plain airports, without considering the particularity of aircraft take-off and landing at high plateau airports. Therefore, this paper improves the BRI [7] by reclassifying Lhasa Airport birds, adding the height index of birds and aircraft. We will use takeoffs and landings instead of flight volume to generate a monthly Birdstrike Risk Index (mBRI) to suit the birdstrike risk assessment at Lhasa Airport.
Besides, there are many studies on the influencing factors of birdstrike at the plain airport, such as the bird richness and migration of the restoration areas around the airport are estimated by using the morphology, geographical relations, ecological characteristics, and uses of the restoration areas as explanatory variables, according to the bird statistics of the restoration sites in the open waters [8]. Moreover, when Morgan et al. [9] assessed the risk of collisions between wild animals and aircraft in military airports in 2018, they found that birds’ weight also had different effects on the damage probability of each aircraft. In the same year, the landscape structure’s influence around the airport on the birdstrike rate was investigated. It was found that the landscape structure and composition around the airport were important factors for predicting the airport birdstrike rate on multi-spatial scales [10]. Furthermore, other researchers have found that human population density affects the Normalized Difference Vegetation Index (NDVI). In contrast, NDVI has an impact on bird species richness [11]. Nevertheless, Zhang et al. [12] used non-spatial multiple and multiple spatial regression to analyze the birds on the Qinghai-Tibet Plateau based on different groups. They found that the terrain ruggedness significantly affected overall bird diversity distribution in the Qinghai-Tibet Plateau than other environmental factors. It also shows that the mechanism of the influence of the particular geographical location and environment in the high plateau airport on the birdstrike may differ from that of the plain airport. Therefore, we selected five environmental factors from previous research combined with the high plateau airport’s special environment: human population density, land type, water distribution, vegetation coverage, and altitude to analyze their temporal and spatial effects on the birdstrike risk in high plateau airports.
However, birdstrike research has also gradually considered the impact of spatial and seasonal variations around the airport in recent years. For example, Richard [13] analyzed the American Civil Aviation Birdstrike Database from 1990 to 2009, which showed that the destructive birdstrike rate higher than 500 ft (153 m) increased from 2.5 to 4. He proposed that more extraordinary efforts should be made to eliminate bird attractors within the 5 km radius from the airport. Moreover, Francesca et al. [7] developed a generalized linear model with binomial distribution to estimate habitats’ attractiveness to birds within 13 km around the airport. They found that habitat diversity and seasonal changes around the airport significantly impacted the attraction risk model. However, the above analysis of the spatial influence on birdstrike is mostly studied using mathematical statistics or linear models. Still, the process is inevitably complicated and tedious, and it is impossible to carry out an excellent visual analysis. Based on the traditional Geographically Weighted Regression (GWR) model, Huang et al. [14] proposed an extended GWR model in 2010, the Geographically and Temporally Weighted Regression (GTWR) model, which effectively dealt with the spatial and temporal nonstationarity of real estate market data. After that, most of the major disciplines have used this method for spatiotemporal mining and data analysis. For example, Ma et al. [15] used the GTWR model in 2018 to explore the spatiotemporal influence of the built environment on bus travel. They highlighted the importance of time characteristics in spatiotemporal data and compared them with the Temporally Weighted Regression (TWR) model. Thus, it can be seen that the GTWR model has been well applied in the fields of economy, environment, and transportation. Additionally, the GTWR model has higher goodness-of-fit than the global Ordinary Least Squares and GWR model and can visually analyze the results in time and space [16]. The analysis of the factors that affect the birdstrike risk is also a typical spatiotemporal geography issue. Therefore, this paper will use the GTWR model to deeply explore the spatiotemporal influence mechanism of environmental factors on birdstrike risk in high altitude airports.
In this paper, Lhasa Kongga International Airport is used as the research airport. We use the bird situation analysis report of Lhasa Airport from 2015 to 2019 and the bird observation data in Tibet to evaluate the birdstrike risk due to the lack of bird detection radar and the inability to achieve artificial bird observation. The bird observation data includes observation location, time, bird species, and number. First of all, bird observation data are statistically classified and rasterized by GIS technology. The BRI existing research is improved to generate the mBRI suitable for Lhasa Airport. Secondly, taking the calculated mBRI as the dependent variable and the selected five environmental factors as independent variables, the traditional GWR model, TWR model, and GTWR model are used to compare and analyze the relationship. Finally, the spatiotemporal effect of environmental factors affecting birdstrike risk is visualized and analyzed based on the GTWR model results. The definition of acronyms frequently in this paper are shown in Appendix A (Table A1).
2. Materials and Methods
2.1. Study Area and Data Collection
Lhasa Kongga International Airport is located in Gongga County, Shannan City, southwest of Lhasa City, Tibet Autonomous Region, China. It is about 85 km away from the center of Lhasa City. The airport grade is 4E, the runway is 4000 m long and 45 m wide, and operates on a single runway. With an altitude of 3600 m, the airport is one of the world’s highest civil airports and the largest aviation hub in the Tibet Autonomous Region. Lhasa Airport is located on the south side of the Brahmaputra River valley, with complex topography, high mountains on both sides of the north and south, and poor clearance conditions. Within the range of the go-around point (about 13 km from the end of the runway), there are continuous mountains of more than 4000 m, affecting take-off and landing significantly. The annual average temperature of Lhasa Airport is 9 °C, the annual average relative humidity is 46.2%, the easterly wind prevails throughout the year, the yearly average wind speed is 2.5 m/s, and there are no distinct four seasons.
According to the Lhasa Airport’s flight procedures, which are different from those for an ordinary plain airport, the study area in this paper is a circular area within a 25 km radius from the airport center, and the whole study area is divided into 1*1 km grids. Moreover, the birdstrike risk of Lhasa Airport is estimated in three different circular buffers (6 km, 13 km, and 25 km). On this basis, the temporal and spatial distribution of the influencing factors is studied, and the schematic diagram of the study area is shown in Figure 1. Figure 1 was generated using ArcGIS software to extract the remote sensing monitoring data of land use status in China.
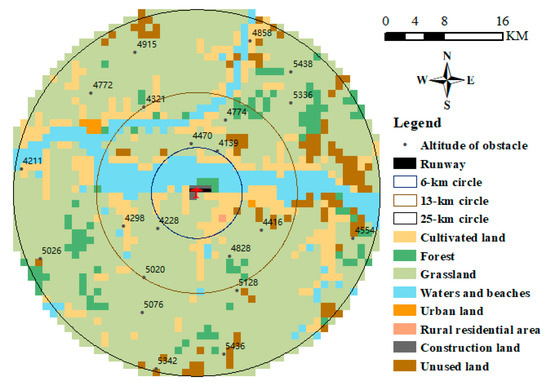
Figure 1.
Schematic diagram of land types in and around Lhasa airport.
Since Lhasa Airport is located between river valleys and surrounded by mountains, the geographical environment is complex. So it is difficult to observe birds. We used the bird situation analysis report of the Lhasa Airport airfield area from 2015 to 2019 and the bird observations of the entire Tibet area (eBird Observation Dataset [17]). Moreover, bird observation data covers the observation location, time, bird species, and number in Tibet from 2015 to 2019 (Table S1). It is rasterized using GIS technology to facilitate the following calculation. To simplify the data management, based on the bird population composition proposed by Soldatini et al. [6], we reclassified the bird data combined with the high altitude birds’ unique ecological features (habitat, foraging, weight, and clustering or not). The specific grouping is shown in Table 1. At the same time, we compared the bird situation analysis report of Lhasa Airport from 2015 to 2019. In the past five years, the most expelled birds were Turtle Dove, Ruddy Shelduck, Passer montanus, Bar-headed Goose, and Small Skylark, accounting for 21.59%, 16.99%, 14.16%, 12.91%, and 8.81% of all expelled birds, respectively. The number of manual monitoring and evictions peaked in August at the airfield area, showing a fluctuating trend as a whole. Considering the breeding and migration features of birds, according to the high plateau’s unique meteorological characteristics and our investigation, the research time is divided into two stages: the dry season (November–April) and the rainy season (May–October).

Table 1.
Grouping of bird species in the habitat of Lhasa airport.
2.2. Dependent Variable—Monthly Birdstrike Risk (mBRI) at Lhasa Airport
Based on the Birdstrike Risk Index (BRI) and the Attraction Risk Index of the airport by Cecilia [6] and Francesca et al. [7], the mBRI is proposed to evaluate the birdstrike risk within a 25 km radius from Lhasa Airport. The mBRI consists of the following components: (1) bird species factors, including species weight and population aggregation; (2) aircraft factors, including the effect of takeoffs and landings of aircrafts’ number on the birdstrike (Table S2); (3) historical birdstrike factors, including the impact degree of historical birdstrike on flights and the historical number of birdstrikes caused by different bird species (Table S3). For details, please refer to the classification criteria of Effect On Flight (EOF) proposed by Cecilia et al. (4) Height factors, including the flying height of birds and aircraft, may interfere with aircraft only when a group of species can reach the height of the aircraft passing over the study area. Therefore, we also introduce a height indicative variable h according to the bird flight altitude [18,19] and flight program of high plateau airport, which determines whether or not the species can reach the height of the aircraft to interfere with the aircraft. Multiplying h with its corresponding other evaluation indicators can exclude those bird species that are unlikely to cause interference to aircraft [7].
Based on the above factors, determine the bird species risk of the ith group, as shown in Equation (1).
where is the average weight of the ith bird species group, g. is the aggregation factor of the ith bird species group. is the monthly average number of birdstrike of the ith bird species group. is the monthly average takeoffs and landings of the airport. is the 95th percentile that the effect of a birdstrike on the flight in ith bird species group, and the specific bird information is shown in Table 1. Thus, the actual monthly bird species risk of group i in the nth grid can be calculated, as shown in Equation (2).
where is the bird species risk of group i in the nth grid, whether there is bird species group i in the nth grid is determined by nuclear density analysis and rasterization. If the density value of bird species group i in the nth grid is greater than 1, it is deemed to be present, otherwise considered to be absent. is the number of monthly occurrences of group i in the nth grid, this parameter of bird species group i in the nth grid is obtained by Kriging and rasterization of the observed numbers over the past five years in this paper.
Finally, combined with birds’ flying altitude, the altitude indicative variable h is introduced to obtain the mBRI in the nth grid, as shown in Equation (3).
where determines whether or not the ith group of bird species could reach the height of flight of aircraft over the nth grid area, it is 1 if it can be achieved, otherwise is 0. Figure 2 shows the average activity height of different bird species and aircraft flight altitude of the aircraft in the three circular buffers around the airport. The yellow-marked group is the monthly average bird species risk greater than 5 (See Table S4). That is, these bird species have a higher birdstrike risk.
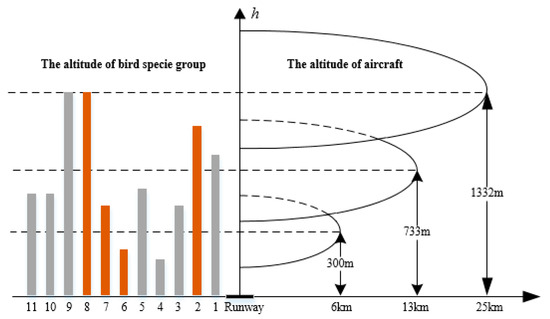
Figure 2.
Schematic diagram of bird species activity height and aircraft height. The yellow-marked group indicates these bird species have a higher birdstrike risk than other groups. These groups were bold in Table 1.
2.3. Independent Variable—Environmental Factors
(1) Vegetation coverage: Since vegetation provides food and habitat for herbivorous birds, the further analysis of vegetation coverage mainly considers the impact of vegetation coverage changes on the birdstrike risk. The Normalized Difference Vegetation Index (NDVI) is recognized as an effective parameter to characterize vegetation changes, and it contains useful information about vegetation coverage [20]. (2) Probability of birds appearing in different land types (PB): This paper makes a statistical analysis of bird observation data from 2015 to 2019 in Tibet. We found that different birds will forage in distinct habitats at different seasons, indicating that different land types have different attraction levels to birds. We have counted the proportions of 11 groups of birds in different land types in different months over the past five years, as the attraction of different land types to birds. Therefore, the sum of the attractiveness in different land types to 11 groups of birds is an explanatory variable to analyze the effect of the land composition around Lhasa Airport on the birdstrike risk. (3) Human population density (POP): This paper uses the population per square kilometer during the studied period as an explanatory variable to analyze the impact of human activities around the airport on the birdstrike risk. (4) Water distribution (WD): According to the well-known Tobler’s first law of geography [21], the assumption is that nearby water has a more significant effect on birds than water farther apart. Therefore, the reciprocal of the nearest Euclidean distance between different grids and the water body is used to describe the water distribution variable, and the influence of the water’s spatial distance on the birdstrike risk in different areas is considered. (5) Altitude (DEM): The Digital Elevation Model (DEM) information is directly used as the studied area’s altitude. The descriptive statistics of the independent variable data in 2018 used in the paper are shown in Table 2.
Table 2.
Descriptive statistics of environmental variables of birdstrike risk (2018).
2.4. Geographical and Temporal Weighted Regression (GTWR) Model
Firstly, the definition of the Geographical Weighted Regression (GWR) model will be more helpful for understanding the Geographical and Temporal Weighted Regression (GTWR) model. The GWR model is an extension based on the traditional global regression model, which embeds the data’s spatial characteristics into the model. It is a common spatial statistical method used to analyze the local changes of spatial phenomena. The fundamental equation of the GWR model [22] is described as Equation (4).
where is the coordinate of the center point of the ith grid, is the intercept term, is the kth regression parameter of the BRI of the ith grid, is the kth environment variable, is the random error term. The GWR model’s salient feature allows the estimated values of parameters to change with different spaces to measure its spatial nonstationarity.
However, the GWR model cannot solve the temporal nonstationarity, which is also an essential factor affecting the birdstrike risk [13]. The treatment of spatial variation in the GTWR model is similar to that in the GWR model. The GTWR model uses space-time distance to construct a space-time weight matrix to measure the relationship between birdstrike risk and different regions and time. The GTWR model is described as Equation (5).
where is the temporal attribute of the ith grid. Based on the Weighted Least Square regression, the unknown parameters of grid i are estimated, and the objective function is shown in Equation (6).
where is the spatiotemporal weight of grid i. The parameter estimates of the GTWR model at the grid are as in Equation (7).
It is still assumed that the data points “close” to the point i in the space-time coordinate system have a greater impact on the parameter estimation of the point i than the data points slightly farther away. In this sense, “closeness” here includes the proximity of space and time. Due to the different measurement units of space distance and time distance (in our research, location in meters and time in months), it is more practical to use the elliptical coordinate system to measure the “closeness” between the regression point i and its adjacent point j.
Then, spatial distance is and temporal distance is ; hence, the spatiotemporal distance between points i and j as Equation (8) [14].
where is a scale factor used to balance the different influences caused by the different measurement units of the distance of space and time. In fact, the essential effect of is to enlarge or reduce the temporal distance effect to match with spatial distance. Therefore, if appropriate adjustments are made to the parameter , the spatiotemporal distance can be used to measure the degree of “closeness” in spacetime.
As shown in Equation (9), the Gaussian kernel function based on distance attenuation is used to construct the spatiotemporal weight matrix .
where is the spatiotemporal bandwidth [15]. is the spatial bandwidth, is the temporal bandwidth.
Figure 3 shows the primary process of parameter estimation by the GTWR model [22]. First, the traditional GWR model is specified based on the input data of Equation (4). The goodness index is then fitted based on the cross-validation to define the optimal spatial bandwidth for each period. Secondly, the optimal time bandwidth is determined based on cross-validation again. Once the optimal spatial and temporal bandwidths are obtained, they can construct the spatiotemporal weight matrix . Then the Equation (7) can be used to estimate the local parameters .
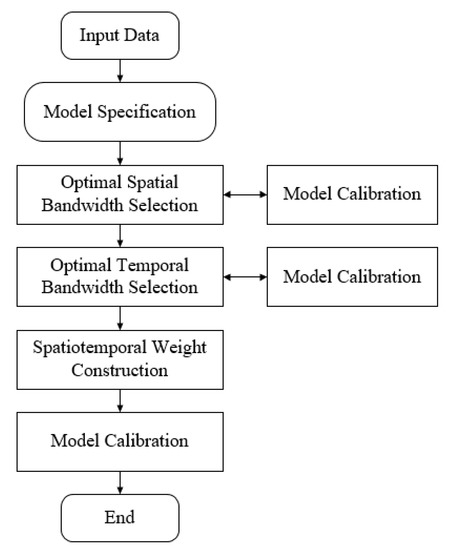
Figure 3.
The process of the GTWR model.
The selection of bandwidth is also an important step in revising the GTWR model. We use the cross-validation (CV) method to determine the bandwidth . When the bandwidth is , assuming that is the fitted value for with point i excluded from the GTWR model process, the sum of the squares of these errors can be expressed as Equation (10). Equation (10) is minimized to determine the optimal bandwidth.
3. Results and Discussion
3.1. Spatial and Temporal Feature of BRI
The monthly average Birdstrike Risk Index (BRI) of Lhasa Airport during the dry and rainy season is shown in Figure 4. The areas of high BRI value in the dry season are larger than that of the rainy season. Moreover, the dry season’s high-value regions clustered in the 13 km radius of the airport and approached the runway. However, in the rainy season, the high BRI areas are only distributed in a small part of the whole studied area and far away from the airport. When the aircraft lands at a horizontal distance of about 13 km from the runway, its flight height is about 730 m. As the aircraft continues to descend, it gradually enters the area of high birdstrike risk, which is most apparent in the dry season. The opposite is true during the take-off. Moreover, the fields with low BRI value are all distributed outside the 13 km radius of the airport, showing that the birdstrike risk is closely related to aircraft height.
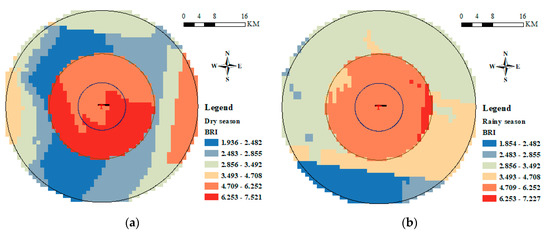
Figure 4.
Spatial distribution map of monthly average birdstrike risk index (BRI) in different seasons. (a) Dry season. (b) Rainy season.
Also, the minimum (Min.), the first quartile (1st Qu.), the median (Median), the mean (Mean), the third quartile (3rd Qu), and the maximum (Max.) six statistics are selected to describe the BRI of Airport based on the calculation results in Section 2.2. Furthermore, all the calculation results of BRI are shown in Table S4. Due to the lack of bird observation data in January and February (the reason may be that the coldest months are January and February on the Tibetan Plateau, with almost no bird activity), January and February will be ignored in the subsequent calculation. It can be seen from Figure 5 that, in general, the highest birdstrike risk occurred in December at Lhasa airport, which is different from the period with the plain airport [7,23]. Next, we will continue to explore why the difference in the pattern of manifestation over birdstrike risk between the high plateau airport and the plain airport.
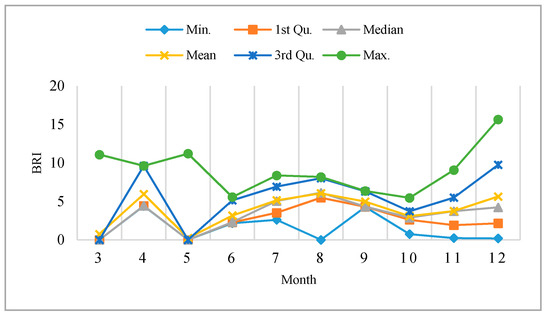
Figure 5.
The statistical description of the birdstrike risk index for different months at Lhasa Airport.
3.2. Model Comparison
Before establishing the model, the multicollinearity between explanatory variables should be tested. It will lead to model estimation distortion or inconsistent if there is serious multicollinearity in the model. The variance inflation factor of each variable in two periods is calculated respectively in this paper. The results showed that these five variables’ variance inflation factors were much less than 10 and floated at about 2 [24]. It indicated that these variables had no multicollinearity, and the spatiotemporal analysis could be continued.
The same data were used for GWR, TWR, and GTWR models analysis. As the effects of different environmental factors on birdstrike risk vary in space and time, the output data of the estimated coefficients of this series of local regression models are voluminous (all calculation results can be seen in Tables S5–S7). Moreover, the evaluation indexes of different models are also given in Figure 6, such as goodness-of-fit, residual sum of squares, and Akaike information criterion at the same time. It is worth noting that in the dry season, the goodness-of-fit of GTWR was 63.9% and 46.6% better than GWR and TWR models. It also increased by 44.9% and 25.1%, respectively, in the rainy season.
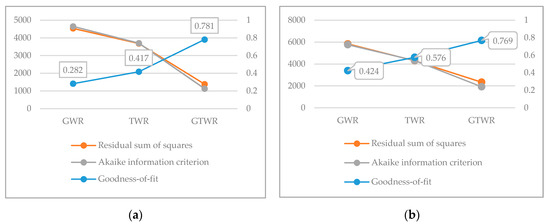
Figure 6.
Comparison of evaluation indexes from different models. (a) Dry season. (b) Rainy season.
Furthermore, by comparing the residual sum of squares and Akaike information criterion’s diminution, it is further shown that the GTWR model provided better fitting than the GWR and TWR models. We believe that this result is because the GTWR model can handle both spatial and temporal heterogeneity. On the other hand, it can be seen from Figure 6 that the TWR model showed better goodness-of-fit than the GWR model. It showed that the spatial nonstationary effect was not as significant as the temporal nonstationarity.
Besides, it is necessary to detect further the nonstationarity of each group of parameters in the GTWR model, that is, whether or not the parameters have significant differences in the study area. An effective method is to compare the twice standard error of global Ordinary Least Squares with the Inter Quartile Range of the GTWR model and the latter’s larger values indicating significant nonstationary [15,22]. As shown in Table 3, there were no extra local variations in the coefficients of DEM, POP, and WD variables in the TWR model. There were extra local variations in all GWR and GTWR models parameters, indicating that the estimation results of the GTWR model had significant spatiotemporal nonstationarity. Therefore, it is suggested to use the GTWR model to reveal the spatiotemporal variation of environmental factors on birdstrike risk at Lhasa Airport.
Table 3.
Nonstationarity tests of parameters from GWR, TWR, and GTWR models.
3.3. Spatial Feature of Coefficients
One of the essential features of this series of weighted regression models is that the local estimated parameters of spatial relationships are mappable and can be visualized. We grouped the regression coefficients into several intervals. We used different colors to visualize the spatial variations of these environmental factors’ effects on the birdstrike risk at Lhasa Airport. In this paper, the mean values of regression coefficients in different months at the same location were used to show the influencing effect’s spatial variation pattern. The GTWR model considers both temporal and spatial heterogeneity of each variable’s coefficients to vary with time. According to the GTWR model results, the human population density had almost no effect on the spatial distribution of birdstrike risk at Lhasa Airport, so the remaining four factors’ spatial variation was only depicted in the paper.
Figure 7 shows the spatial effects of vegetation coverage (NDVI). Given the spatial impact of vegetation coverage, the spatial influence patterns are very different in the two research periods. The NDVI had almost no positive effects on birdstrike risk in the entire study area in the dry season. However, in the rainy season, the positive effects’ areas were mainly clustered in the southern area between 6 km and 25 km away from the runway, which indicated that vegetation coverage in the rainy season had a more significant effect on the birdstrike risk. In the high plateau, the vegetation coverage in the rainy season is higher than that in the dry season. Correspondingly, Lucas et al. [25] also found that NDVI is the most crucial predictor of bird species richness. It shows that the high vegetation coverage in the rainy season attracts more birds in the high plateau airport and aggravates the birdstrike risk.
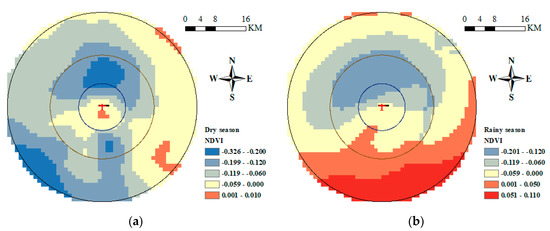
Figure 7.
The spatial distribution of the average coefficient for NDVI. (a) Dry season. (b) Rainy season.
Figure 8 shows the spatial effects of birds’ probability of appearing on different land types (PB). There were regions with significant positive effects, whether in the dry or the rainy season. In the dry season, the positive impacts’ regions were located in the southwest, extending to 25 km from the airport. In contrast, in the rainy season, they were mainly distributed in the airport’s 13 km radius. However, Morgan et al. [10] found that the increase in the diversity of land types in the 3 km radius of the plain airport will increase the birdstrike rate. Some experts have proposed to vigorously eliminate the bird attractants in the airport’s 5 km radius to reduce birdstrike occurrence in the plain airport [13]. However, this region expanded to 13 km in the rainy season at Lhasa Airport, even broadened to 25 km in the dry season. The reason for this phenomenon may consist of the following two parts: at first, the special geographical environment and bird species composition at the high plateau airport are very different from those in the plain airport. Secondly, the aircraft’s performance sharply declines when entering and leaving the Lhasa Airport due to the special geographical environment and harsh meteorological conditions of the high plateau. Therefore, when the aircraft lands at Lhasa Airport, it must enter the final approach fix ahead of time than those plain airports, and it also will take longer to complete the whole take-off process. Hence, the aircraft’s time to occupy the runway and low-altitude airway is longer, so the corresponding areas with high birdstrike risk are larger than that of the plain airport.
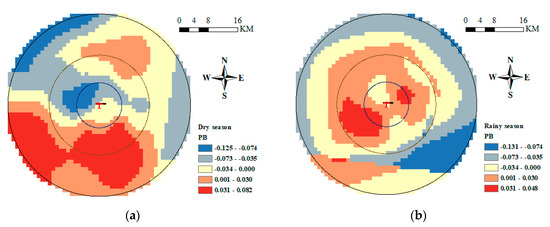
Figure 8.
The spatial distribution of the average coefficient for PB. (a) Dry season. (b) Rainy season.
Besides, in the dry season of Lhasa Airport, the grassland area accounts for 82.6% of the total regions where PB had positive effects on birdstrike risk, followed by 6.9% of the forest land. In the rainy season, the largest areas still were grassland, accounting for 57.1% of the total areas where PB had positive effects on birdstrike risk, but there was a sharp decline compared with the dry season. It was cultivated land, which accounted for 20.2%, and the water area also accounted for 16.6%. This change shows that in Lhasa Airport, the land type that needs to reduce birds’ attractiveness is grasslands. Other studies have shown that farmland and wetlands around plain airports are the primary reasons for the increase in the number of birds and birdstrike [7,10]. Concisely, due to the high plateau airport’s particular geographical environment, the birdstrike defense and measures to reduce birds’ attraction are different from those in the plain airport. The scope of prevention is also larger than that in the plain airport.
Figure 9 shows the spatial effects of water distribution (WD) affecting the birdstrike risk in different seasons. There was almost no effect on the birdstrike risk within the 6 km radius of Lhasa Airport for the water distribution. However, the areas that the WD had positive impacts were distributed on the west outside the 6 km scope, whether in the dry or rainy season. In the areas within the 13 km to 25 km radius, the positive influences’ regions gradually extended to the study area’s edge. The most positive significant areas were clustered in the southwest of the airport in the dry season; inversely, they were distributed in the northwest of the airport in the rainy season. This phenomenon may be related to the activity area of different bird species around Lhasa Airport. For example, among the high-risk bird species, the number of Laridae and Anatidae in the rainy season was significantly higher than that in the dry season at Lhasa Airport. Their active areas are in the vicinity of waters and wetlands. The Lhasa River, a tributary located in the northwest of the airport, is surrounded by wetlands and is more attractive to these waterfowls than the Brahmaputra River’s mainstream. Also, the most significant effect of WD in the dry season was higher than that in the rainy season. The reason probably may be that the YamdrokTso (one of the three sacred lakes in Tibet, which is the largest habitat for waterfowl in southern Tibet), is located about 25 km southwest of Lhasa Airport, is more attractive to waterfowls during the dry season.
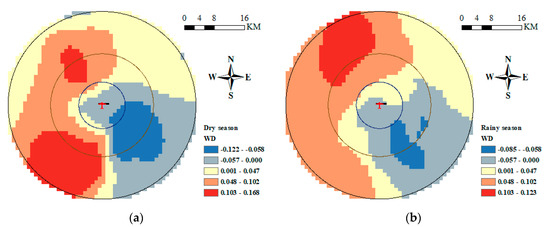
Figure 9.
The spatial distribution of the average coefficient for WD. (a) Dry season. (b) Rainy season.
In the previous study, some experts have proposed that the incidence of adverse birdstrike was closely affected by large areas of wetlands, waters, and crops within the 8 km and 13 km radius of the airport [10]. Given the WD, the areas with positive impacts on the birdstrike risk are still larger and more significant than that in the plain airport. Moreover, there are also studies that the possibility of birds using a pond other than its 8 km is zero [26]. On the other hand, this shows that no matter if they are in the plateau or the plain, the waters near the airport do have a close relationship with bird activities, which increases the probability of birdstrike. Therefore, the scope of water influence near Lhasa airport was much broader than that of the plain airport.
Figure 10 shows the spatial effects of altitude (DEM) affecting the birdstrike risk in different seasons. For the DEM, in the dry season, the most significant positive impact areas were distributed in the north and northwest of the airport, almost entirely within the airport’s 13 km radius. In the range from 13 km to 25 km radius of the airport, the positive influence degree decreased, but the area increased. However, in the rainy season, the DEM had almost no positive effect on birdstrike risk in the whole study area. The spatial variation between different seasons is also related that the activity regions and heights of birds are disparate in different seasons. Most of the birds that are active in areas with significant positive impacts on birdstrike risk in the dry season are small raptors (such as Falco tinnunculus) and flocking passerine (such as Montifringilla ruficollis and Eremophila alpestris). Nevertheless, during the rainy season, the numbers of passerine have declined. However, birds of the Falconiformes have a wide range of activities and are not restricted by terrain heterogeneity. The range of Passeriformes is relatively narrow, so the terrain plays a vital role in distributing passerine birds [12]. Another part of the reason may be that due to uneven solar illumination, there is a significant difference in the distribution of woodlands on both sides of the airport, which indirectly affects the distribution of passerine birds.
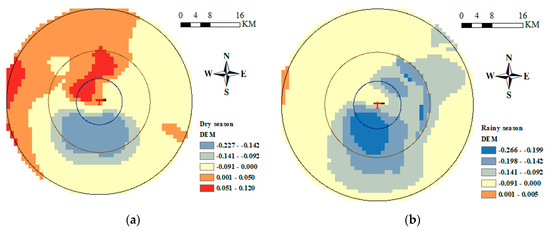
Figure 10.
The spatial distribution of the average coefficient for DEM. (a) Dry season. (b) Rainy season.
On the other hand, the National Wildlife Strike Database for civil aviation in the USA have been statistically analyzed. For birdstrike that causes severe damage to the aircraft at the plain airport, showed that 66% occurred at less than or equal to 500 ft (153 m), 29% of them between 501 ft and 3500 ft (153–1067 m), the height here is the height above the ground level [27]. However, there are peaks of more than 4000 m on both sides of Lhasa airport. Most of the aircraft is less than 500 ft away from these peaks when entering and leaving the airport, which increases the risk of some alpine birds (such as small raptors and Leucosticte brandti) colliding with aircraft, especially in the dry season.
3.4. Temporal Feature of Coefficients
By introducing the time dimension into the traditional GWR model to use the GTWR model, we can get the time series in which each factor’s coefficients vary with the month from the GTWR model results. In this context, the temporal variation of coefficients about different factors can be calculated and compared.
The estimated value of the birdstrike risk index from the GTWR model and the study area’s actual value is compared in Figure 11, which shows that the GTWR model has a better fitting advantage. Moreover, the months with relatively high birdstrike risk are April, August, and December at Lhasa Airport, which is also different from birdstrike at the plain airport. However, at ordinary plain airports, birds’ risk of colliding with aircraft is the lowest in winter [23]. More birdstrikes are caused by increased bird activity result from bird migration in spring and autumn [28,29]. Therefore, it is necessary to analyze the birdstrike risk at high plateau airport separately to enhance birdstrike defense capability at high plateau airport.
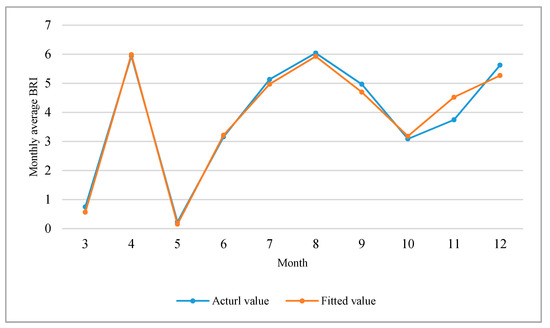
Figure 11.
The time variation of the actual and estimated BRI in the study area.
It can be seen from Figure 12 that the human population density had almost no effect on the birdstrike risk at Lhasa Airport as a whole but only showed a positive impact in May, and the coefficient value was only 0.1. The reason may be that the Lhasa airport is sparsely populated and far away from the urban area. Compared with other environmental factors, the POP has little influence on the birdstrike risk at Lhasa airport in the time dimension. Furthermore, the other four factors’ coefficients fluctuate greatly over time. Most of the monthly average coefficients swing in a negative direction. Vegetation coverage, the probability of birds appearing in different land types, and water distribution factors all showed positive effects in September and October. The reason may be that with the rise in temperature, the number of waterbirds and herbivorous birds has increased significantly. The risk of birdstrike has also increased compared with other months.
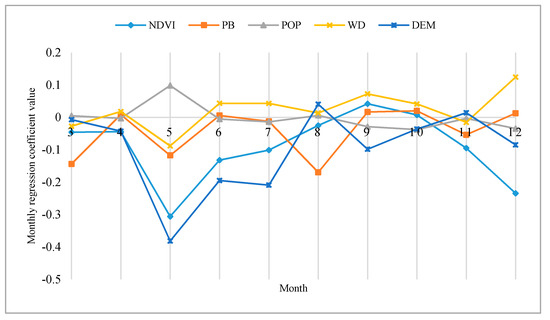
Figure 12.
The time variation of the coefficients of different factors in the study area.
Furthermore, the water distribution shows the most significant positive effect on birdstrike risk in December, which is related to the high plateau’s special environment. The water area in the dry season has a high aggregation of birds. Besides, altitude showed the most significant positive effect on birdstrike in August. However, the degree of influence was not significant compared with other factors. This change may be related to the number and distribution of small raptors and flocking passerine and perhaps also have something to do with the inconsistent solar illumination on both sides of Lhasa Airport.
In short, the temporal effects of different environmental factors have a specific influence on the birdstrike risk at Lhasa Airport, such as the factors’ greatest positive impact at Lhasa Airport is that the human population density (POP) in May, the vegetation coverage (NDVI) in September, the probability of birds looking in different land types (PB) in October, the water distribution (WD) in December, and the altitude (DEM) in August. Still, their significant degree is different, and the biggest is the effect of water distribution. According to the results, the Lhasa airport managers can make targeted arrangements and deployments for birdstrike prevention measures in advance in different months.
4. Conclusions
In this paper, the GTWR model was first used to analyze the relationship between the birdstrike risk and its environmental factors within the 25 km radius of Lhasa Airport, and further revealed the influence of environmental factors around the airport on the birdstrike risk in space and time. The bird observation data of Tibet and the birdstrike statistical data of Lhasa Airport from 2015 to 2019 were used to identify the spatiotemporal influence of environmental factors on the birdstrike risk. The main conclusions are as follows:
Firstly, the GTWR model has a better fitting and analytical ability than the GWR and TWR models, indicating that the effect of different environmental factors on birdstrike risk has significant spatial and temporal characteristics. Secondly, the temporal nonstationary effect was more significant than the spatial. Then, for the feature of spatial influence, the factors of altitude in the dry season and land type in the rainy season had significant positive impacts on birdstrike risk within the 6 km radius around Lhasa Airport. The influencing regions of this land type were larger than that of the plain airport. Moreover, the most significant positive effects were the water distribution within the 6 km to 25 km radius of Lhasa Airport. Lastly, the factors that positively affected birdstrike risk at Lhasa Airport vary significantly in different periods. The key factor was the water distribution in December, followed by the human population density in May.
According to the researched results, the Lhasa Airport planners and managers can apply targeted and suitable bird-repelling measures and preventive measures to create a safe airport environment with a low birdstrike risk. Moreover, other high plateau airports can also appropriately adjust their airfield’s precautionary measures to reduce the birdstrike risk based on our study. In the current GTWR model in this paper, we used the linear weighting method to combine spatial and temporal distances, and the advanced nonlinear weighting algorithm needs to be further studied.
Supplementary Materials
The following are available online at https://www.mdpi.com/2071-1050/12/22/9357/s1. Table S1: The bird observation data and grouping from 2015 to 2019 in Tibet. (XLSX). Table S2: The takeoffs and landings at Lhasa Airport from 2015 to 2019. (XLSX). Table S3: The number of birdstrike at Lhasa Airport from 2015 to 2019. (XLSX). Table S4: All variable data of the study area. (XLSX). Table S5: The results of the GTWR model. (XLSX). Table S6: The results of the GWR model. (XLSX). Table S7: The results of the TWR model. (XLSX). Table S8: Calculation example of Birdstrike Risk Index (BRI) in October. (XLSX). File S1: The explanation of Table S8. (TXT).
Author Contributions
Conceptualization, Q.S. and Y.Z.; Methodology, Q.S. and Y.Z.; Software, Y.Z.; Validation, Q.S. and Y.Z.; Formal Analysis, Y.Z. and P.Z.; Investigation, Y.Z.; Resources, Q.S.; Data Curation, Y.Z.; Writing—Original Draft Preparation, Y.Z.; Writing—Review and Editing, Q.S. and P.Z.; Visualization, Y.Z.; Supervision, Q.S.; Project Administration, Q.S.; Funding Acquisition, Q.S. All authors have read and agreed to the published version of the manuscript.
Funding
This research was funded by the National Basic Research Program of China, grant number 2018YFC0809500, the National Natural Science Foundation of China, grant number 71874081, and Qing Lan Project.
Conflicts of Interest
The authors declare no conflict of interest.
Appendix A
Table A1.
The definition of acronyms in the text.
Table A1.
The definition of acronyms in the text.
| Number | Acronyms | Definitions |
|---|---|---|
| 1 | BRI | Birdstrike Risk Index |
| 2 | mBRI | monthly Birdstrike Risk Index |
| 3 | GWR | Geographically Weighted Regression model |
| 4 | TWR | Temporally Weighted Regression model |
| 5 | GTWR | Geographically and Temporally Weighted Regression model |
| 6 | NDVI | Normalized Difference Vegetation Index |
| 7 | PB | Probability of birds appearing in different land types |
| 8 | POP | Human population density |
| 9 | WD | Water distribution |
| 10 | DEM | Altitude of studied area |
References
- Li, X. Flight performance analysis of plateau airport. J. Civ. Aviat. Univ. China 2005, 23, 91–102. [Google Scholar]
- Yao, G.; Hu, H.; Zhang, X. Speace Ground and Air Guarantees for the Operation of Highland Airports. J. Xi’an Aerotech. Coll. 2011, 29, 15–18. [Google Scholar]
- Allan, J. A heuristic risk assessment technique for birdstrike management at airports. Risk Anal. 2006, 26, 723–729. [Google Scholar] [CrossRef]
- Ning, H.; Chen, W. Bird strike risk evaluation at airports. Aircr. Eng. Aerosp. Technol. 2014, 86, 129–137. [Google Scholar] [CrossRef]
- Soldatini, C.; Georgalas, V.; Torricelli, P.; Albores-Barajas, Y.V. An ecological approach to birdstrike risk analysis. Eur. J. Wildl. Res. 2010, 56, 623–632. [Google Scholar] [CrossRef]
- Soldatini, C.; Albores-Barajas, Y.V.; Lovato, T.; Andreon, A.; Torricelli, P.; Montemaggiori, A.; Corsa, C.; Georgalas, V. Wildlife strike risk assessment in several Italian airports: Lessons from BRI and a new methodology implementation. PLoS ONE 2011, 6, e28920. [Google Scholar] [CrossRef]
- Coccon, F.; Zucchetta, M.; Bossi, G.; Borrotti, M.; Torricelli, P.; Franzoi, P. A land-use perspective for birdstrike risk assessment: The attraction risk index. PLoS ONE 2015, 10, e0128363. [Google Scholar] [CrossRef] [PubMed]
- Justin, D.H.; Alison, C.; John, R.A. Developing bird-strike risk assessment models for open-water restorations. Hum. Wildl. Confl. 2009, 3, 186–198. [Google Scholar]
- Pfeiffer, M.B.; Blackwell, B.F.; DeVault, T.L. Quantification of avian hazards to military aircraft and implications for wildlife management. PLoS ONE 2018, 13, e0206599. [Google Scholar] [CrossRef]
- Pfeiffer, M.B.; Kougher, J.D.; DeVault, T.L. Civil airports from a landscape perspective: A multi-scale approach with implications for reducing bird strikes. Landsc. Urban. Plan. 2018, 179, 38–45. [Google Scholar] [CrossRef]
- Koh, C.N.; Lee, P.F.; Lin, R.S. Bird species richness patterns of northern Taiwan: Primary productivity, human population density, and habitat heterogeneity. Divers. Distrib. 2006, 12, 546–554. [Google Scholar] [CrossRef]
- Zhang, C.; Lei, F. The distribution pattern of bird species richness in the Tibetan Plateau determined by topographic heterogeneity. In Proceedings of the The 12th National Ornithological Symposium and the 10th Cross-Straits Ornithological Symposium, Hangzhou, China, 8 November 2013; Zhejiang Association For Science and Technology: Hangzhou, China, 2013; p. 45. [Google Scholar]
- Dolbeer, R.A. Increasing trend of damaging bird strikes with aircraft outside the airport boundary: Implications for mitigation measures. Hum. Wildl. Interact. 2011, 5, 235–248. [Google Scholar] [CrossRef]
- Huang, B.; Wu, B.; Barry, M. Geographically and temporally weighted regression for modeling spatio-temporal variation in house prices. Int. J. Geogr. Inf. Sci. 2010, 24, 383–401. [Google Scholar] [CrossRef]
- Ma, X.; Zhang, J.; Ding, C.; Wang, Y. A geographically and temporally weighted regression model to explore the spatiotemporal influence of built environment on transit ridership. Comput. Environ. Urban. Syst. 2018, 70, 113–124. [Google Scholar] [CrossRef]
- Wei, Q.; Zhang, L.; Duan, W.; Zhen, Z. Global and geographically and temporally weighted regression models for modeling PM2.5 in Heilongjiang, China from 2015 to 2018. Int. J. Environ. Res. Public Health 2019, 16, 5107. [Google Scholar] [CrossRef]
- Levatich, T.; Ligocki, S. EOD—eBird Observation Dataset. Cornell Lab. Ornithol. 2020. Available online: https://www.gbif.org/ (accessed on 13 July 2020). [CrossRef]
- Shamoun-Baranes, J.; van Loon, E.; van Gasteren, H.; van Belle, J.; Bouten, W.; Buurma, L. A comparative analysis of the influence of weather on the flight altitudes of birds. Bull. Am. Meteorol. Soc. 2006. [Google Scholar] [CrossRef]
- Meinertzhagen, R. The speed and altitude of bird flight. Ibis1 1955, 97, 81–117. [Google Scholar] [CrossRef]
- Rugel, E.J.; Henderson, S.B.; Carpiano, R.M.; Brauer, M. Beyond the Normalized Difference Vegetation Index (NDVI): Developing a Natural Space Index for population-level health research. Environ. Res. 2017, 159, 474–483. [Google Scholar] [CrossRef] [PubMed]
- Tobler, W.R. A Computer Movie Simulating Urban Growth in the Detroit Region. Econ. Geogr. 1970, 46, 234. [Google Scholar] [CrossRef]
- Fotheringham, A.S.; Crespo, R.; Yao, J. Geographical and Temporal Weighted Regression (GTWR). Geogr. Anal. 2015, 47, 431–452. [Google Scholar] [CrossRef]
- Metz, I.C.; Ellerbroek, J.; Mühlhausen, T.; Kügler, D.; Hoekstra, J.M. The bird strike challenge. Aerospace 2020, 7, 26. [Google Scholar] [CrossRef]
- O’Brien, R.M. A caution regarding rules of thumb for variance inflation factors. Qual. Quant. 2007, 41, 673–690. [Google Scholar] [CrossRef]
- Leveau, L.M.; Isla, F.I.; Bellocq, M.I. Predicting the seasonal dynamics of bird communities along an urban-rural gradient using NDVI. Landsc. Urban. Plan. 2018, 177, 103–113. [Google Scholar] [CrossRef]
- Blackwell, B.F.; Schafer, L.M.; Helon, D.A.; Linnell, M.A. Bird use of stormwater-management ponds: Decreasing avian attractants on airports. Landsc. Urban. Plan. 2008, 86, 162–170. [Google Scholar] [CrossRef]
- Dolbeer, R.A. Height Distribution of Birds Recorded by Collisions with Civil Aircraft. J. Wildl. Manag. 2006, 70, 1345–1350. [Google Scholar] [CrossRef]
- Dekker, A.; van Gasteren, H. Eurbase: Military Bird Strike Frequency in Europe. Available online: https://canadianbirdstrike.ca/wp-content/uploads/2018/02/Dekker__van_Gasteren_2005.pdf (accessed on 2 November 2020).
- van Gasteren, H.; Krijgsveld, K.L.; Klauke, N.; Leshem, Y.; Metz, I.C.; Skakuj, M.; Sorbi, S.; Schekler, I.; Shamoun-Baranes, J. Aeroecology meets aviation safety: Early warning systems in Europe and the Middle East prevent collisions between birds and aircraft. Ecography 2019, 42, 899–911. [Google Scholar] [CrossRef]


Publisher’s Note: MDPI stays neutral with regard to jurisdictional claims in published maps and institutional affiliations. |
© 2020 by the authors. Licensee MDPI, Basel, Switzerland. This article is an open access article distributed under the terms and conditions of the Creative Commons Attribution (CC BY) license (http://creativecommons.org/licenses/by/4.0/).