1. Introduction
Urbanization transforms the natural surface into impervious surface, while a high population in urban area accelerates this transformation [
1,
2,
3]. This transformation was considered as one of the major causes for the phenomenon of urban heat island (UHI) [
4,
5]. The UHI refers to urban temperatures being higher than those in rural areas [
6]. This negatively affects the quality and health of inhabitants [
7,
8]. Thus, how to mitigate the UHI effects has attracted wide concern from scholars and government managers.
The urban thermal environment has been extensively investigated by scholars, and the UHI effects is influenced by many factors [
9,
10,
11,
12]. It is widely accepted that greater absorption of solar radiation, lower efficiency of longwave radiation emission, energy storage by buildings and paved surface, lower evaporative cooling, and anthropogenic heat release in the urban area together lead to the UHI effects [
13]. In addition, many studies have investigated relationships between urban (e.g., water bodies, roads, and built-up areas) and geographic (e.g., Normalized Difference Vegetation Index (NDVI), Normalized Difference Built-up Index (NDBI), and Normalized Difference Water Index (NDWI)) indicators and urban thermal environment [
8,
14,
15,
16,
17,
18]. Most of the existing research emphasized that built-up areas could increase the UHI effects, while water bodies and vegetation lands decrease it [
1,
17,
19,
20].
Urban parks, which mainly consist of grasses, trees, and water, are effective measures to mitigate the UHI effects [
14,
21,
22,
23]. They not only reduce the interiors’ temperature, but also reduce the surrounding area’s temperature [
24]. The UHI mitigation improvement achieved by urban parks also attracted the attention of many scholars [
21,
25,
26,
27,
28,
29]. Several scholars have investigated the relationship between park size and the cold island effect (CIE) based on site data and remote sensing data, noting that the CIE is stronger as the park size increases [
24,
30]. Park shape also affects the land surface temperature (LST) of the park [
24]. Generally, the more compact the shape, the better the CIE of the park [
24,
31]. Moreover, many scholars have pointed out that the CIE of the park is not only influenced by size and shape, but is also related to the interior landscape components [
31,
32]. Xu et al. (2017) emphasized that different landscape compositions and configurations of parks can affect the LST, and water bodies ratio and woodlands aggregation are considered to be the key influencing factors [
24]. Furthermore, the CIE of the park is influenced by the characteristics of the area around the park [
33,
34]. Lin et al. (2015) investigated the cooling extent of parks in Beijing, and pointed out that the characteristics of the area around the park is also a key factor affecting the CIE of the parks [
33]. Dai et al. (2018) also pointed out that landscape factors can affect the LST within or around parks [
34]. However, although many studies have investigated the relationship between shape, size and interior components and the CIE of parks, the impact of the neighboring landscape on the CIE of parks is still lacking.
Due to data availability, current research explored the influence of the surrounding two-dimensional surface elements, such as impervious surface and built-up areas, but little attention has been paid to three-dimensional surface elements, such as buildings. Fortunately, the development of high-resolution remote sensing imagery and Light Detection And Ranging (LiDAR) enables the requirement of building data, including building outline and height [
35,
36]. These data could provide data support for exploring the impacts of building on thermal environment [
37]. They could also provide fundamental data for investigating the impacts of neighboring buildings on the CIE of parks.
Most of the existing research has pointed out that buildings have different effects on LST [
38]. Buildings can affect LST by modifying the surface characteristics and regional radiation energy balance [
20,
38,
39,
40]. Buildings with different height and form also have different effects on LST [
29,
41,
42]. However, it is unclear that the impacts of the neighboring buildings (especially different types of buildings) on the CIE of parks. Thus, the impacts of neighboring buildings on the CIE of parks need to be investigated.
The objects of this study were (1) to investigate the LST difference among different parks; (2) to analysis the cool island footprint (CIF) of parks; (3) to further examine the composition of building neighboring parks; (4) to analyze LST difference between park and CIF; and (5) to investigate the effect of neighboring buildings on the CIE of parks. This study could provide guidance to urban planners on how to mitigate the UHI effects through the rational allocation of buildings.
2. Materials and Methods
2.1. Study Area
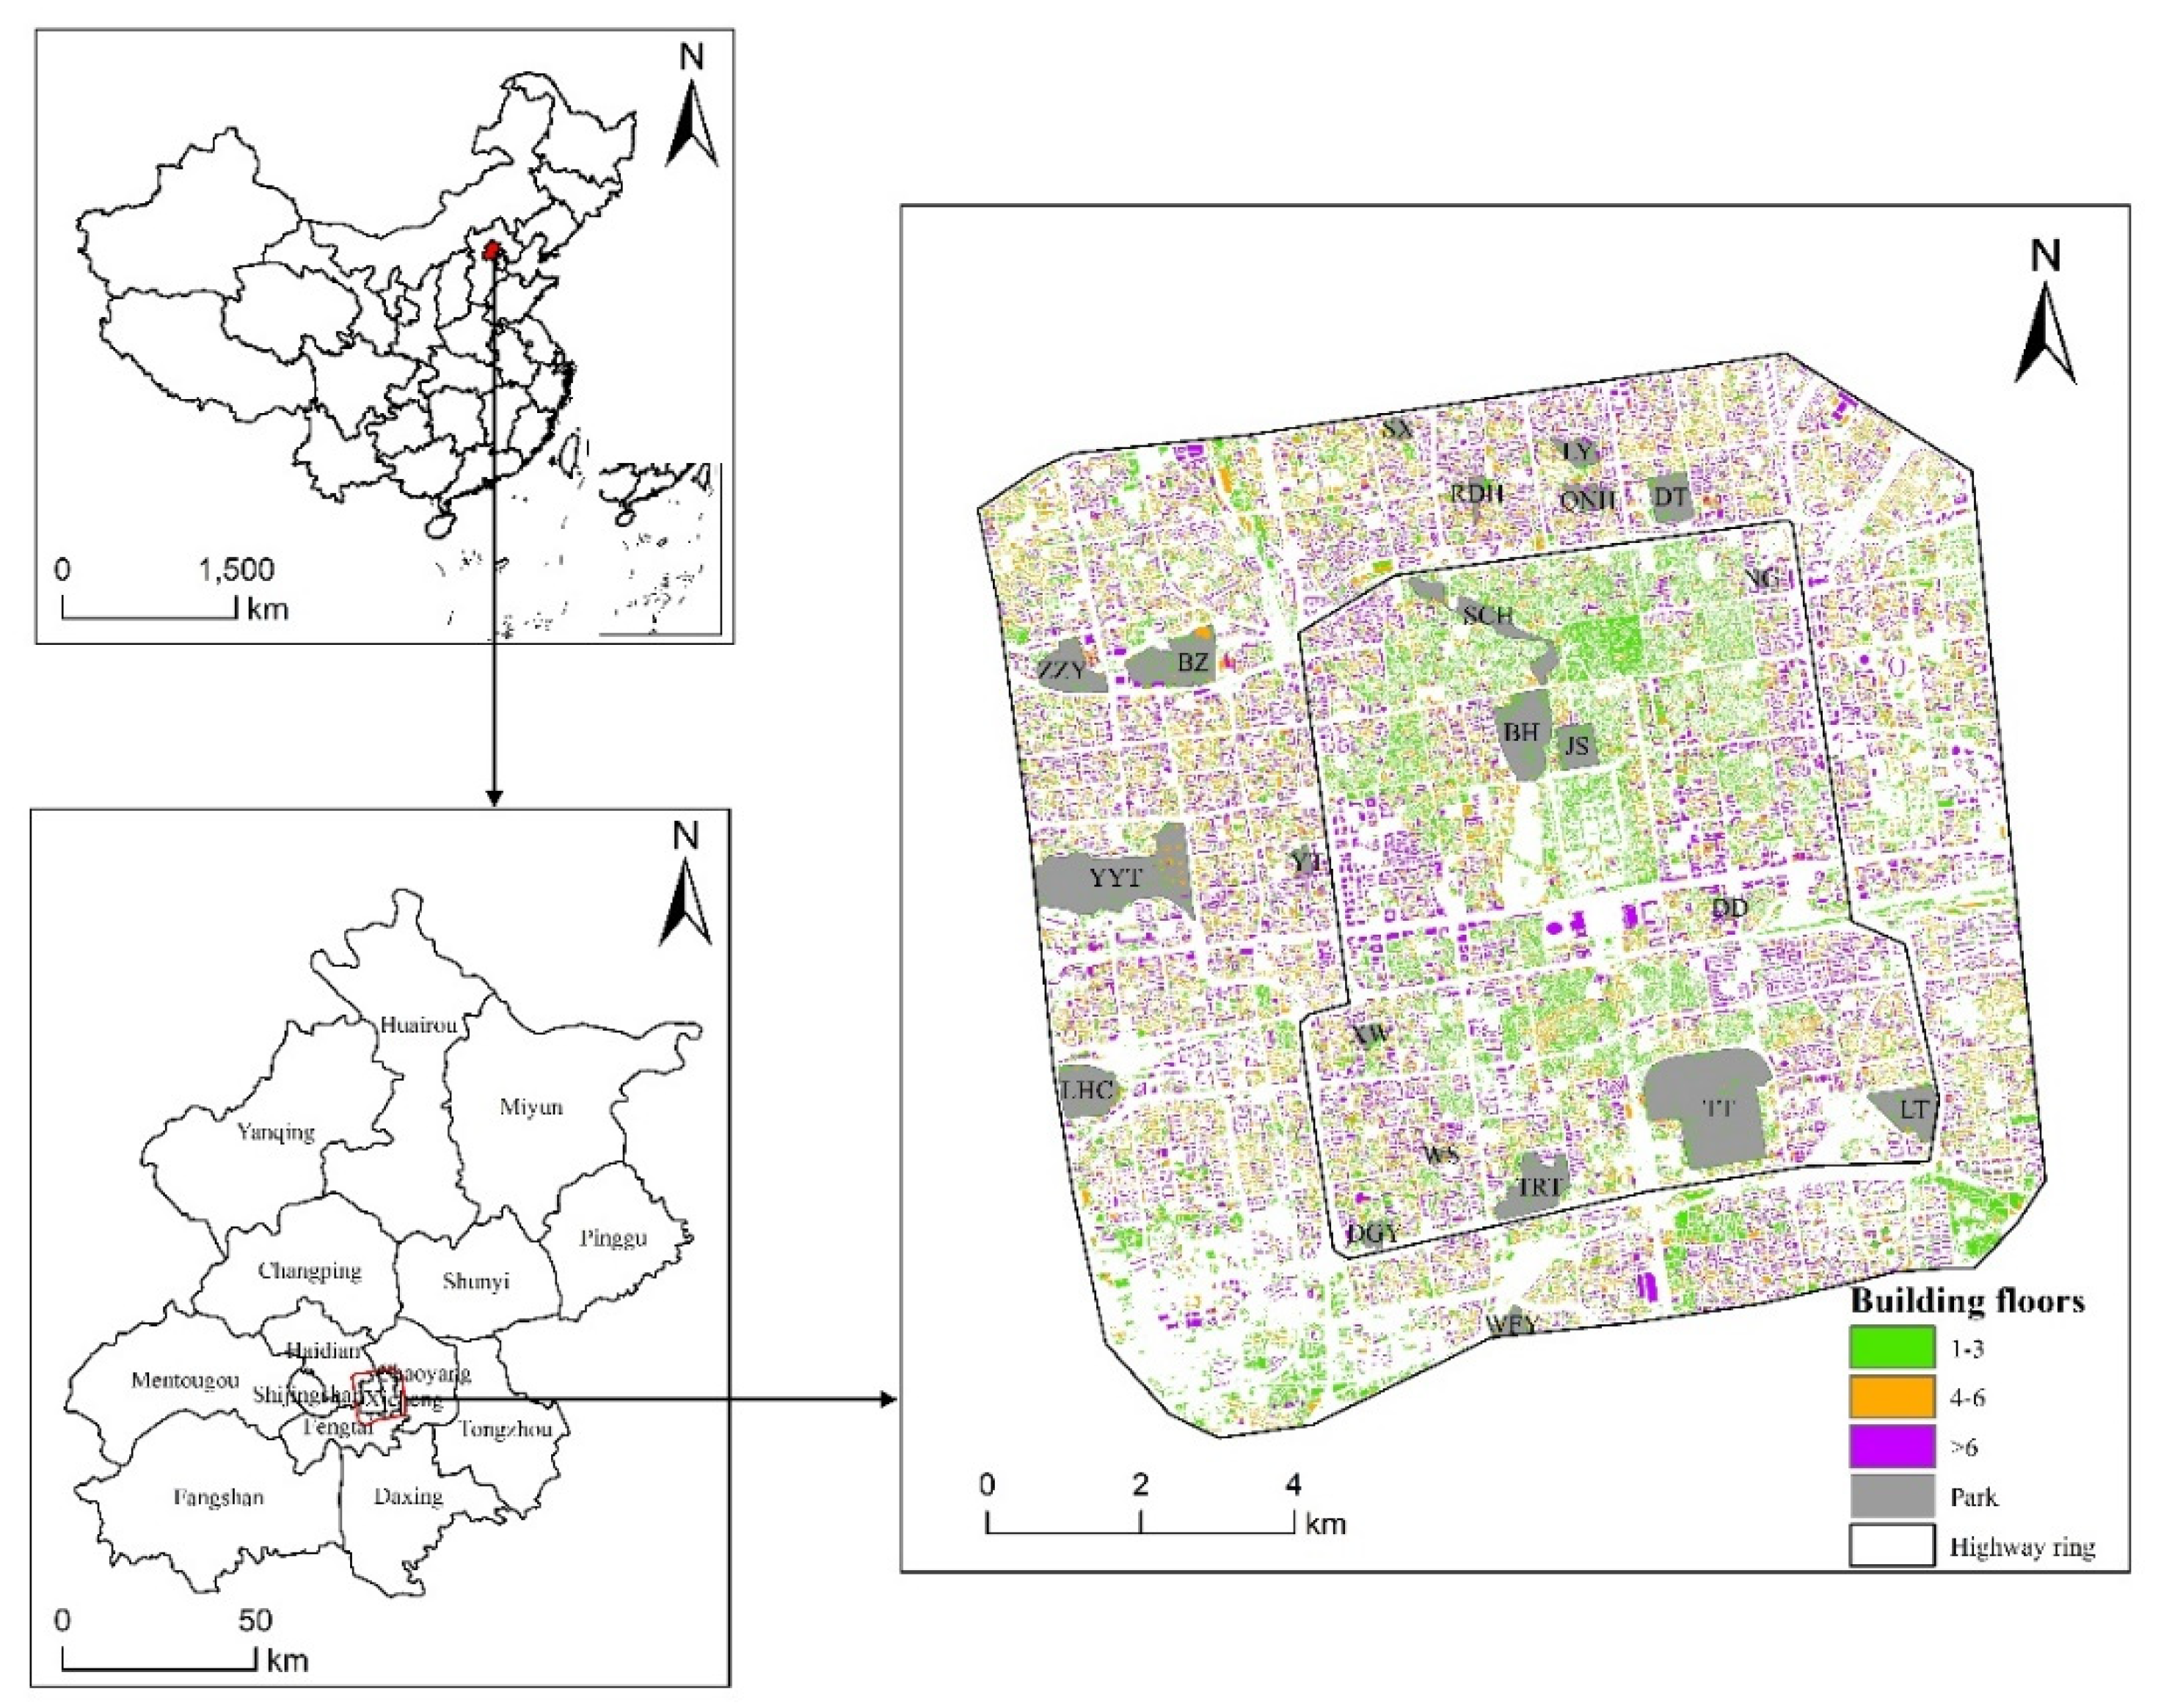
Beijing, the capital of China, is located in the northern of the country (39°26′–41°03′ N, 115°25′–117°30′ E). It covers an area of 164,100 km
2, with a population of 21.71 million as of 2015 (
Figure 1). This region has a typical warm-temperate, semi-humid continental monsoon climate, with hot and rainy weather in summer and a cold and dry winter. The annual mean temperature and precipitation are 12.3 °C, and 300 to 800 mm, respectively. Beijing has experienced rapid urbanization since the 1978 economic reform and opening up policy. It is also one of the cities with serious UHI effects in China. The study area is located within the 3rd ring road of Beijing metropolitan area, which covers an area of approximately 80,000 km
2 (
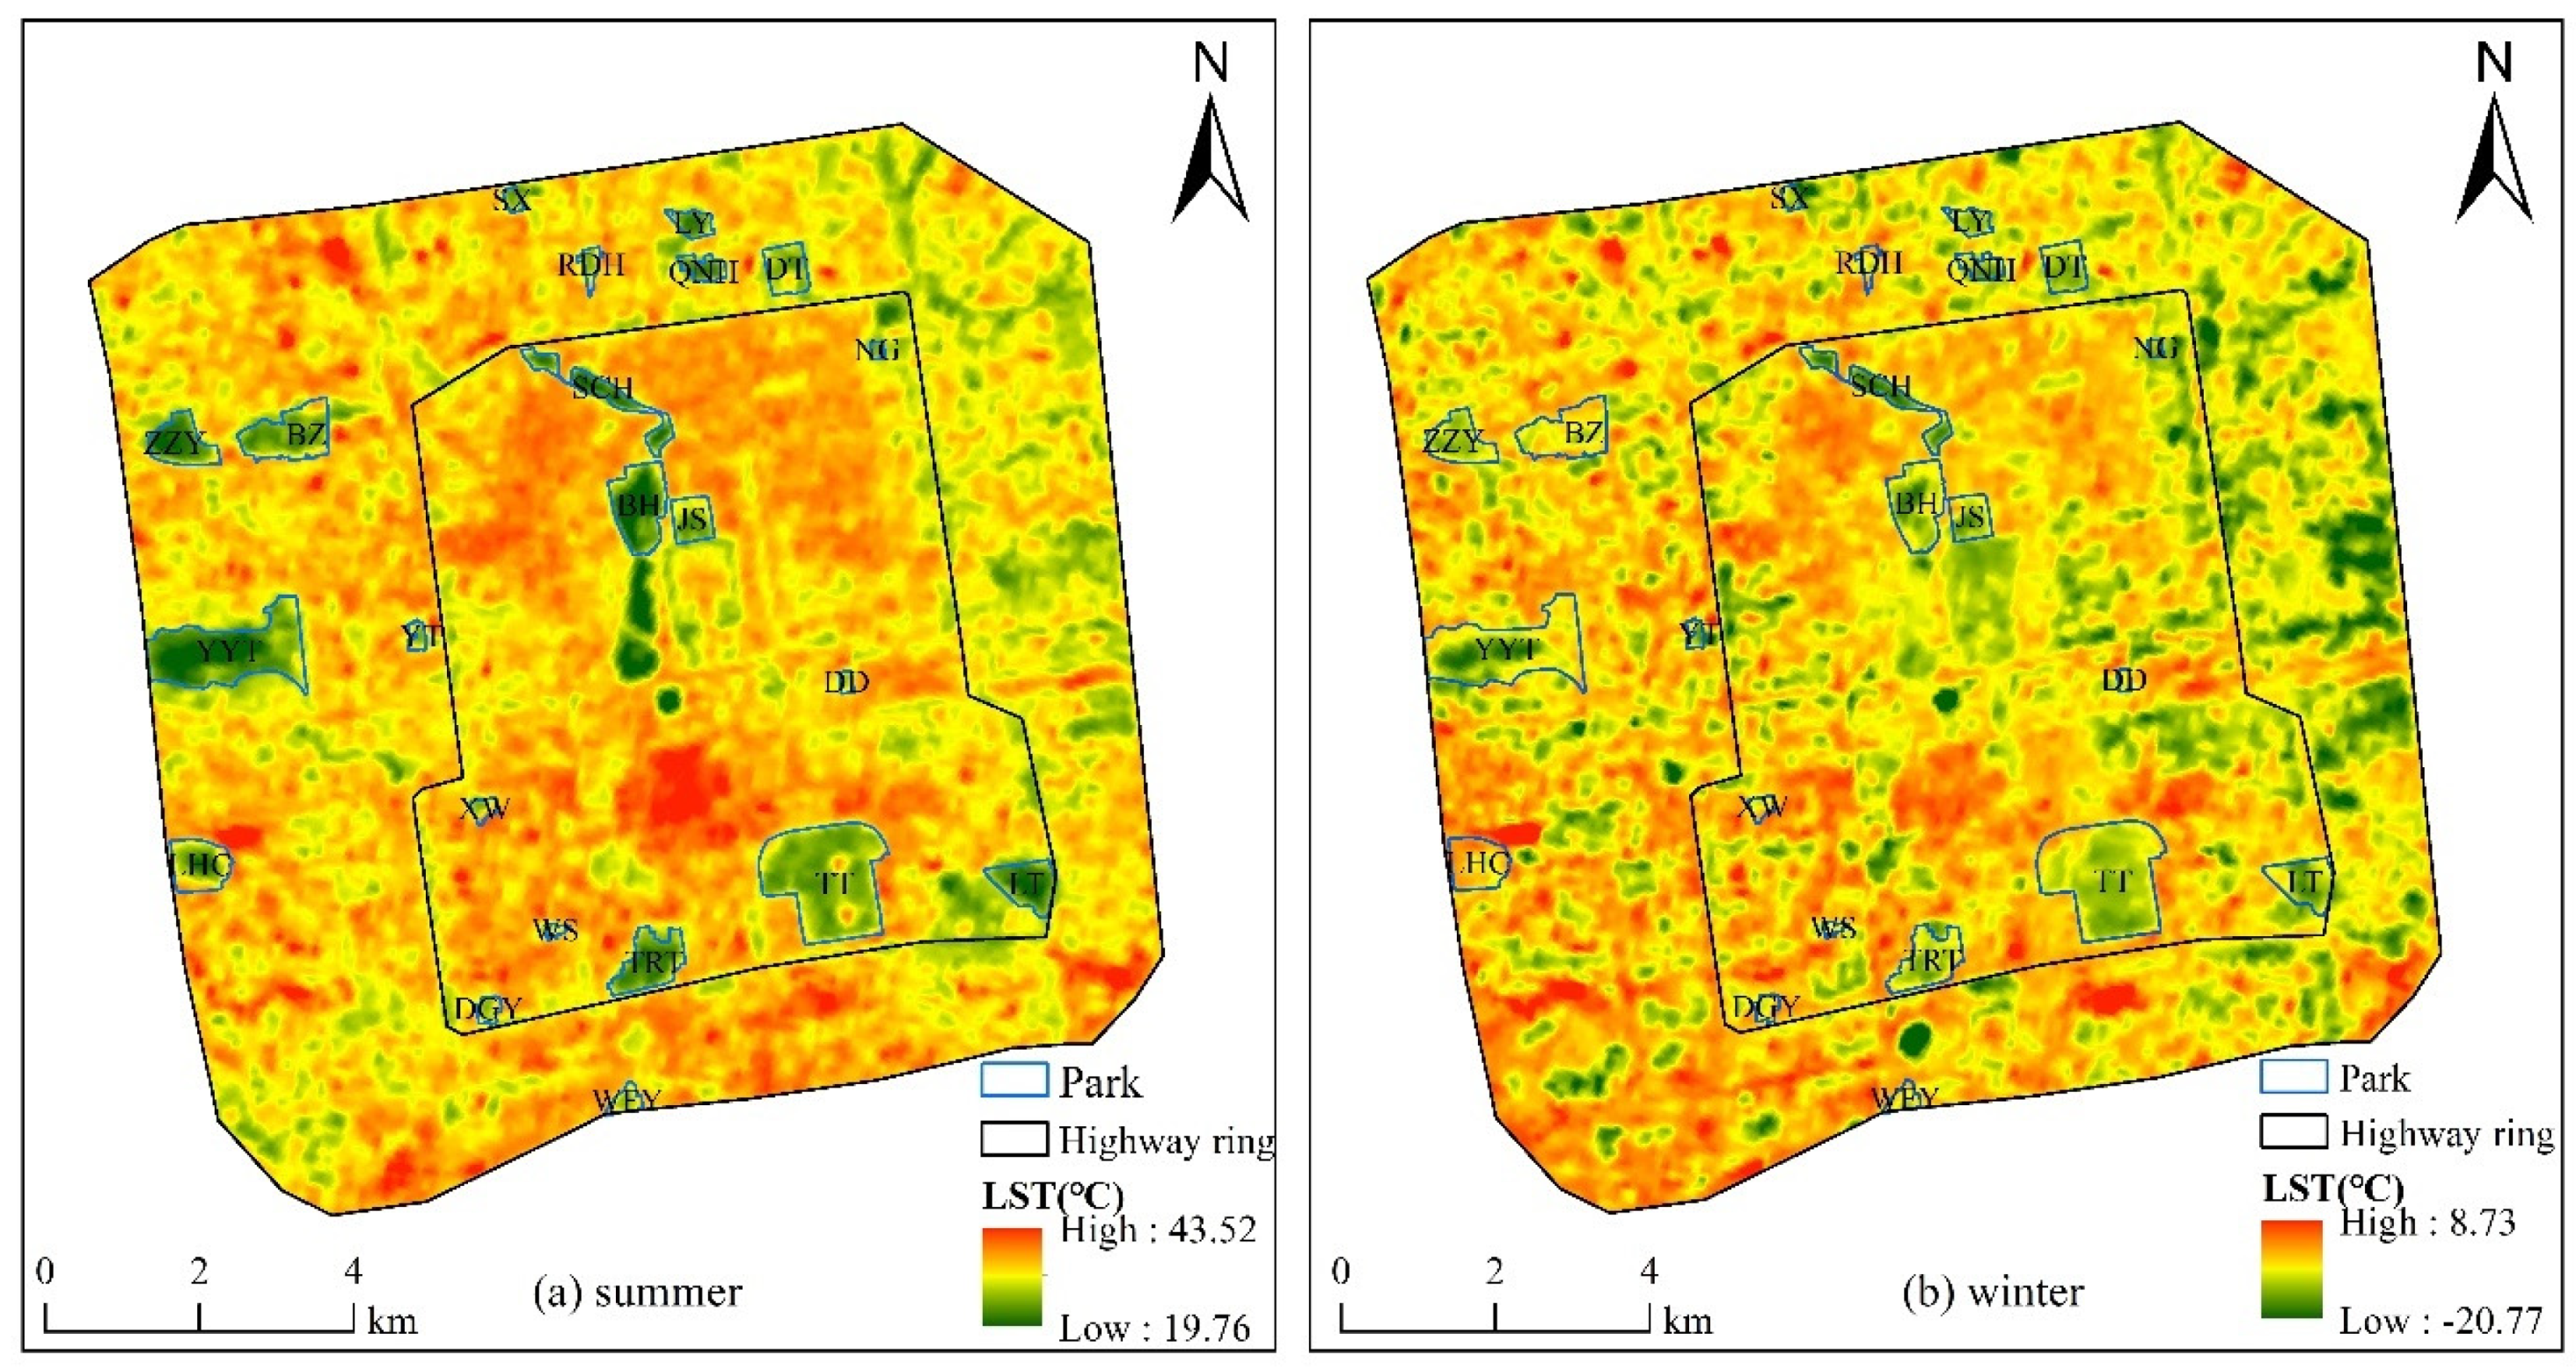
Figure 1). There are also many parks inside this region. Twenty-two parks were chosen to investigate the impacts of neighboring buildings on the CIE of central parks.
The spatial distribution and details of parks can see in
Figure 1 and
Table 1, respectively. Eleven parks are distributed in the 2nd ring, and the others are distributed in the 3rd ring. The area of parks ranged from 0.04 km
2 (WS) to 1.95 km
2 (TT), with an average area of 0.39 km
2.
2.2. Data Sources
Building dataset, Gaofen2 images, and Landsat 8 image were used in this study, as shown in
Table 2.
Building dataset was derived from Resources and Environmental Scientific Data Center (RESDC), Chinese Academy of Sciences (CAS). It provides building datasets in Chinese major cities, such as Beijing, Tianjin and Jinan. Some parameters, such as building outline and floors, are included in this dataset. It can reflect the two- and three-dimensional characteristics of the building. Taking Baidu Street View map as criteria, 500 samples were randomly selected to verify the accuracy of this dataset. The result shows that the overall accuracy of this dataset was approximately 97%, which can guarantee the accuracy of building classification and subsequent analysis.
The outline of the park was mapped using GF2 images, which were derived from RESDC. To cover the study area, two GF2 images taken on 2 September 2015, and 12 September 2015, respectively, were used in this study, with a panchromatic (spatial resolution of 1 m) and four multi-spectral (blue, green, red, and near infrared, spatial resolutions of 4 m) bands.
To retrieve the LST, two Landsat 8 OLI images were derived from the United States Geological Survey (USGS) on 22 August 2015, and 14 February 2016, respectively. The thermal infrared band (band 10, spatial resolution of 120 m), was used to retrieve the LST. The images were selected to be as cloud-free as possible. Although the cloud cover of this image was 33.33% in summer, the study area was cloud-free.
2.3. Methods
The flowchart of this study is as follows (
Figure 2). First of all, the LST was retrieved from two Landast 8 OLI images (summer and winter), and the outline of parks were required by GF2 images. Buildings were classified based on the building dataset. Secondly, the LSTs of parks were calculated, and the LST differences among different parks were analyzed. Thirdly, the CIF of parks were estimated, and CIF of parks were analyzed. Fourthly, average LST of CIFs were calculated, and LST difference between park and CIF were analyzed. Fifthly, the composition of the building neighboring the park was analyzed. Finally, the impacts of neighboring buildings on the CIE of parks was investigated.
2.3.1. Retrieval of LST
The image-based method (IBM) is used for retrieval of LST [
15]. The equation is as follows
where
is the LST,
represents the at-satellite brightness temperature,
and
are the wavelengths at the center of emitted radiance and spectral emissivity, respectively.
is a constant value derived from the headed files of the Landsat 8 OLI image. In this case,
equals 1.438 × 10
−2 mK.
The estimation of
can divide into two steps. First, the digital number (DN) of thermal band (band 10) is converted to radiation. The equation is as follows
where
is the spectral radiance (W·m
−2·sr
−1·μm
−1),
and
are rescaled gain (value = 3.342 × 10
−4) and rescaled bias (value = 0.1).
After calculating
, the
can calculate as follows
where
= 480.89 W·m
−2·sr
−1·μm
−1 and
= 1201.14 K.
The estimation of
can also divide into two steps. First, the land surface is classified into three groups, water, urban, and natural surface. Then, the
of water is set as 0.995, while for urban and natural surface, the
can calculate by fractional vegetation cover (FVC) (Equations (4) and (5)). The FVC is calculated by NDVI (Equation (6))
where
and
are the emissivity values for urban and natural surface, respectively.
and
are the fractional vegetation cover and Normalized Difference Vegetation Index.
and
are the NDVI for the vegetation and soil, respectively.
2.3.2. Extraction of Park and Classification of Buildings
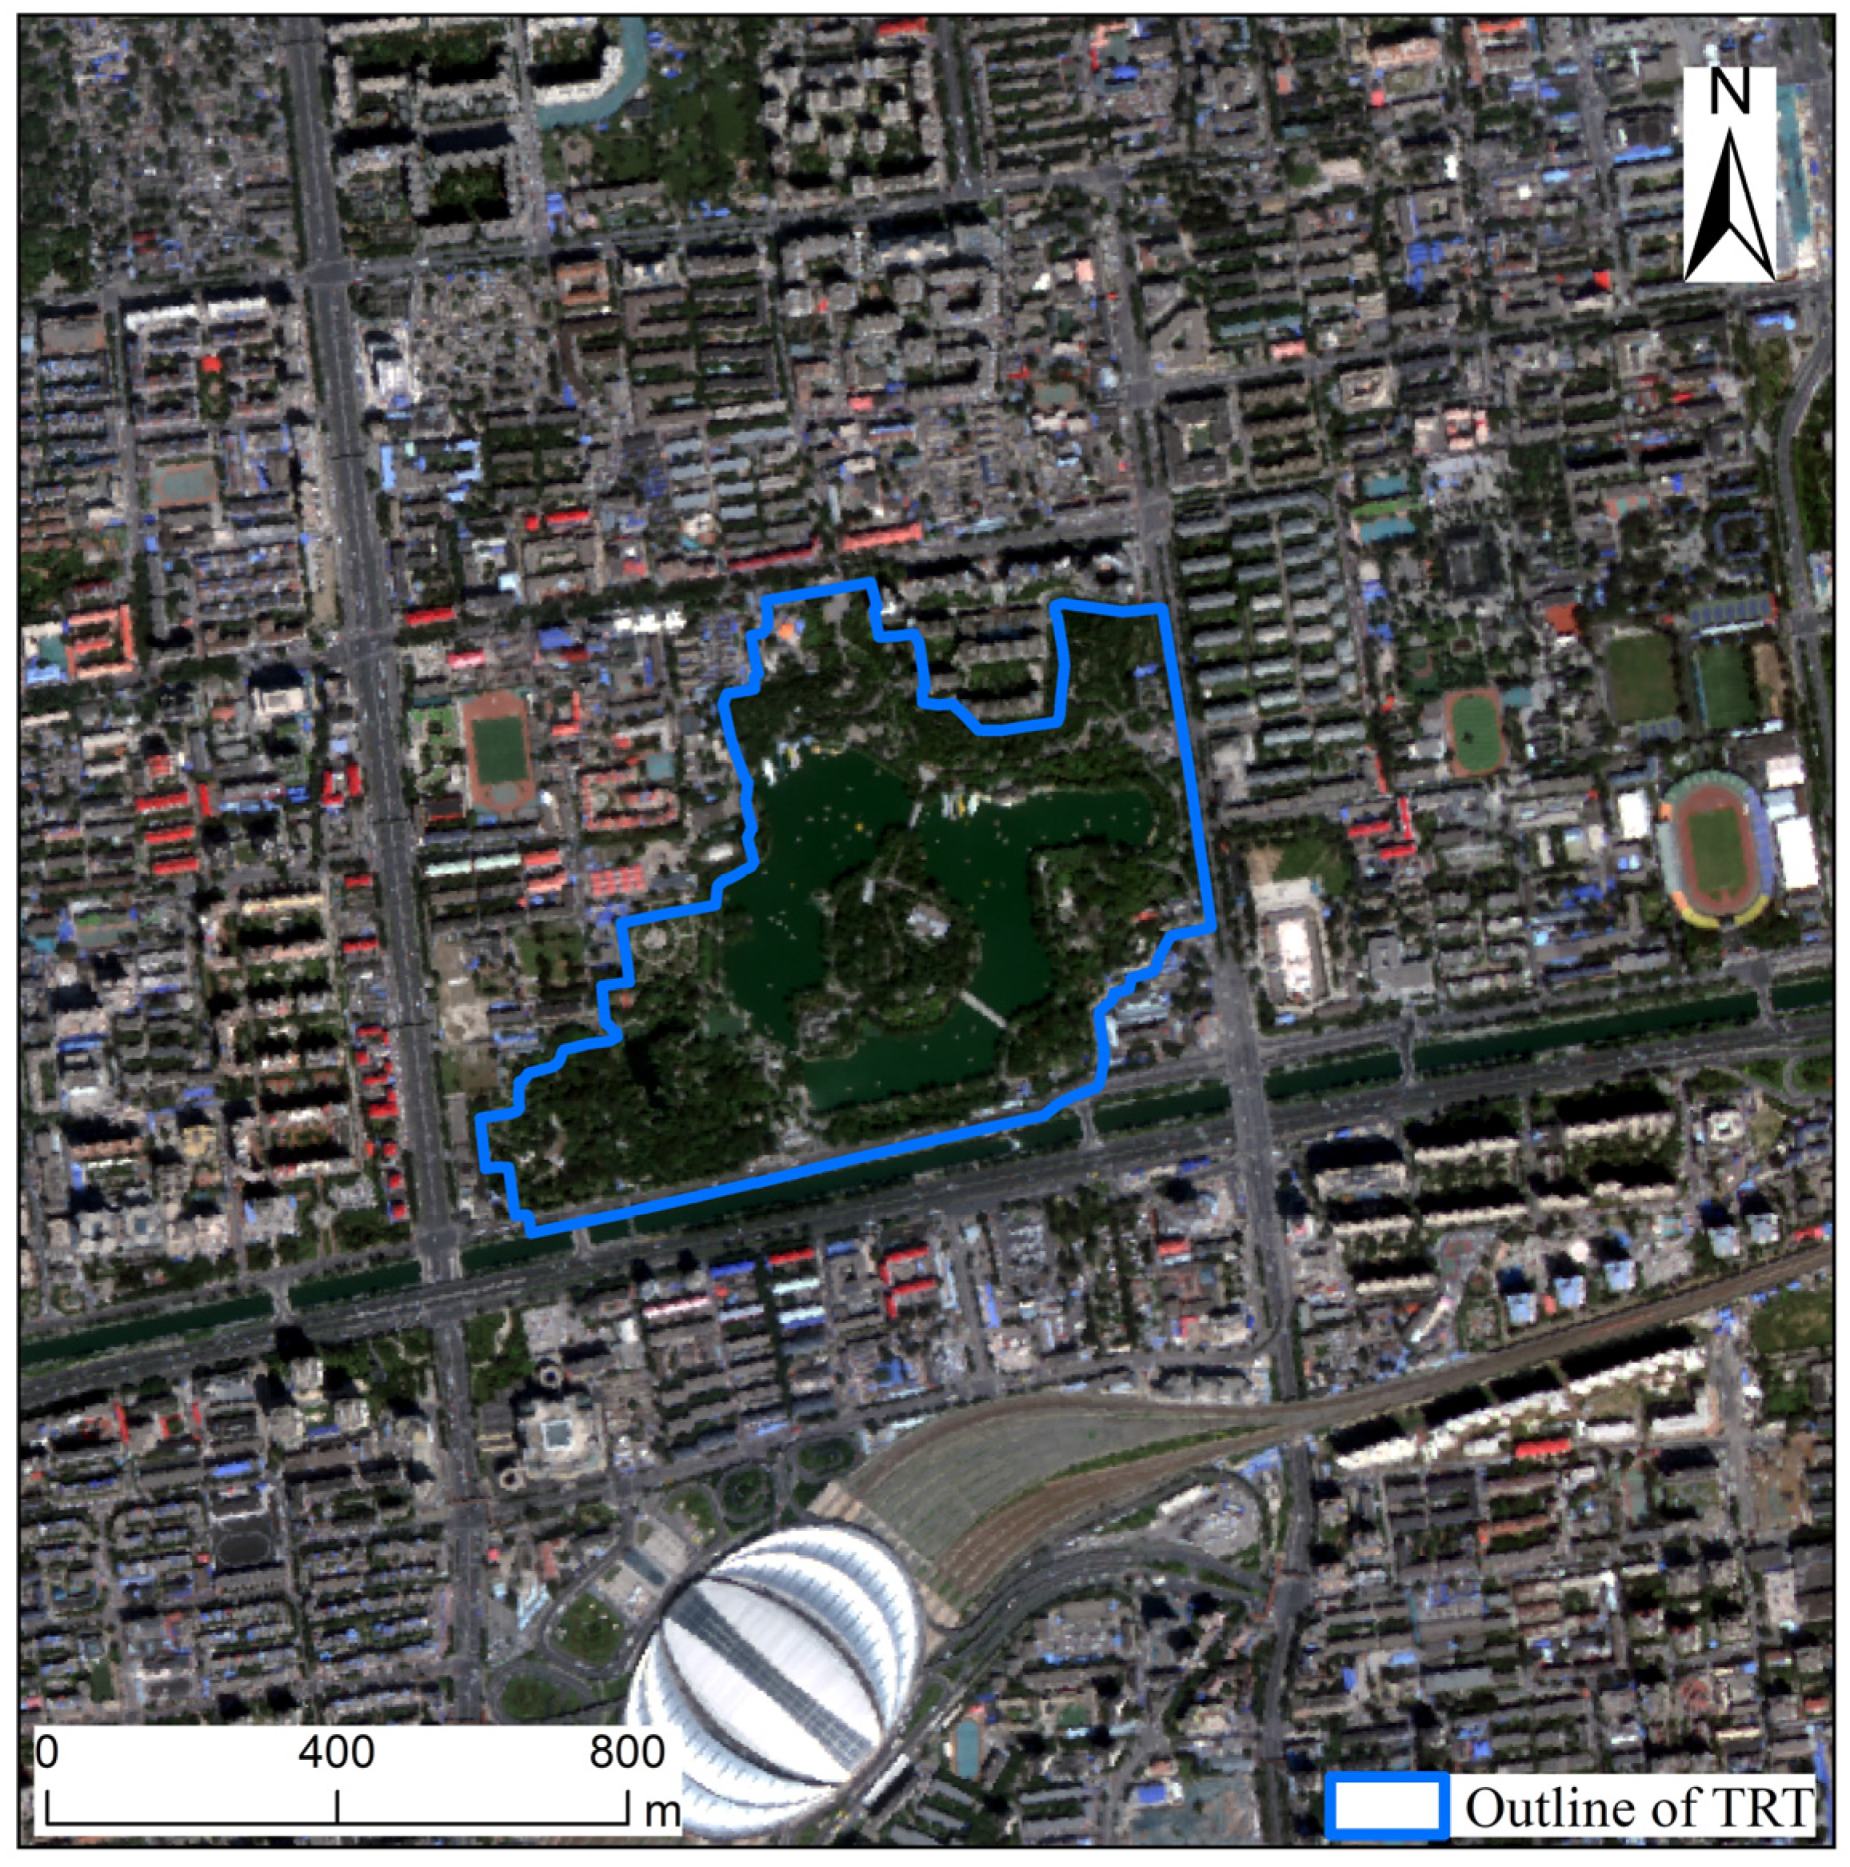
The outline of parks was mapped using GF2 images based on the visual interpretation method. Taking TRT as an example, the outline of TRT was extracted based on GF2 images (
Figure 3). In this study, twenty-two parks were extracted, and the spatial distribution of parks can be seen in
Figure 1.
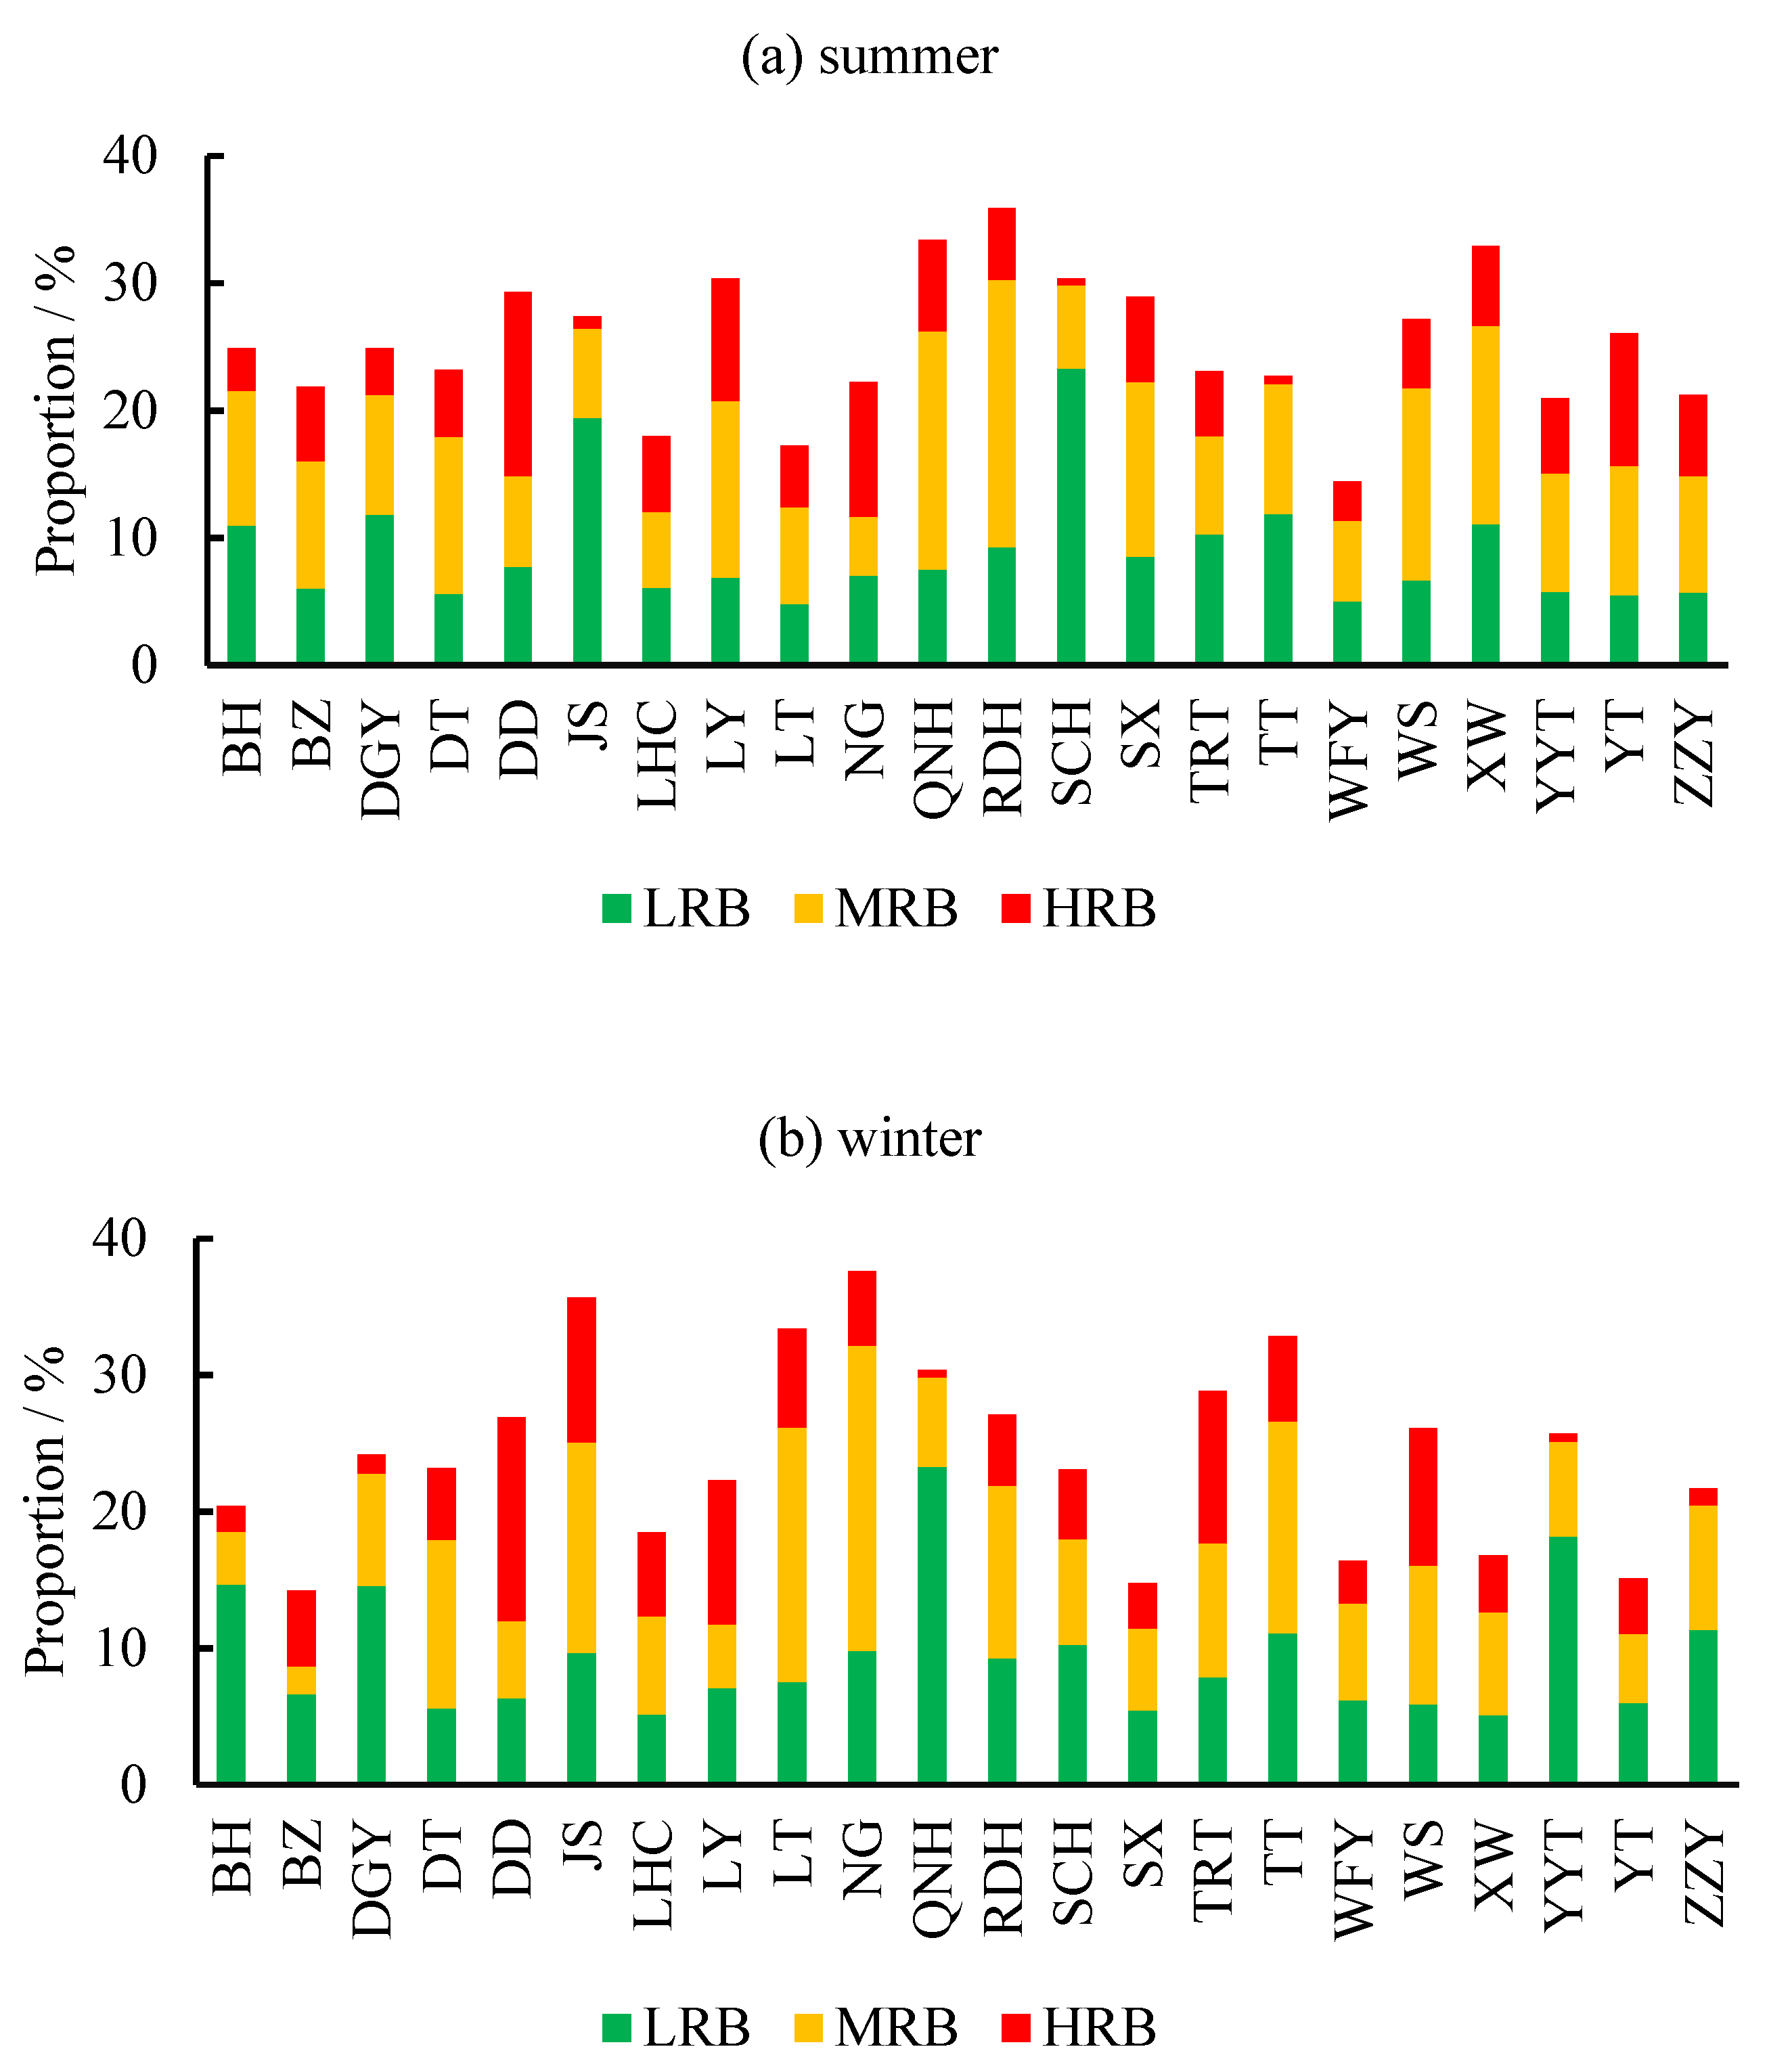
To evaluate the impact of different building types on the CIE of parks, building dataset was used in this study. This dataset includes the outline of the buildings, and the number of building floors. Furthermore, according to Chinese Residential Building Code, buildings were classified into three types based on building floors, including low-rise building (LRB), middle-rise building (MRB), and high-rise building (HRB), respectively. The classification standard can be seen in
Table 3.
2.3.3. Estimation of CIF
The area where the CIE of parks occurs is defined as the CIF. The greater the CIF, the stronger the park CIE. According to the urban heat island footprint, the buffer method was used to quantitatively measure the CIF of parks [
43,
44,
45].
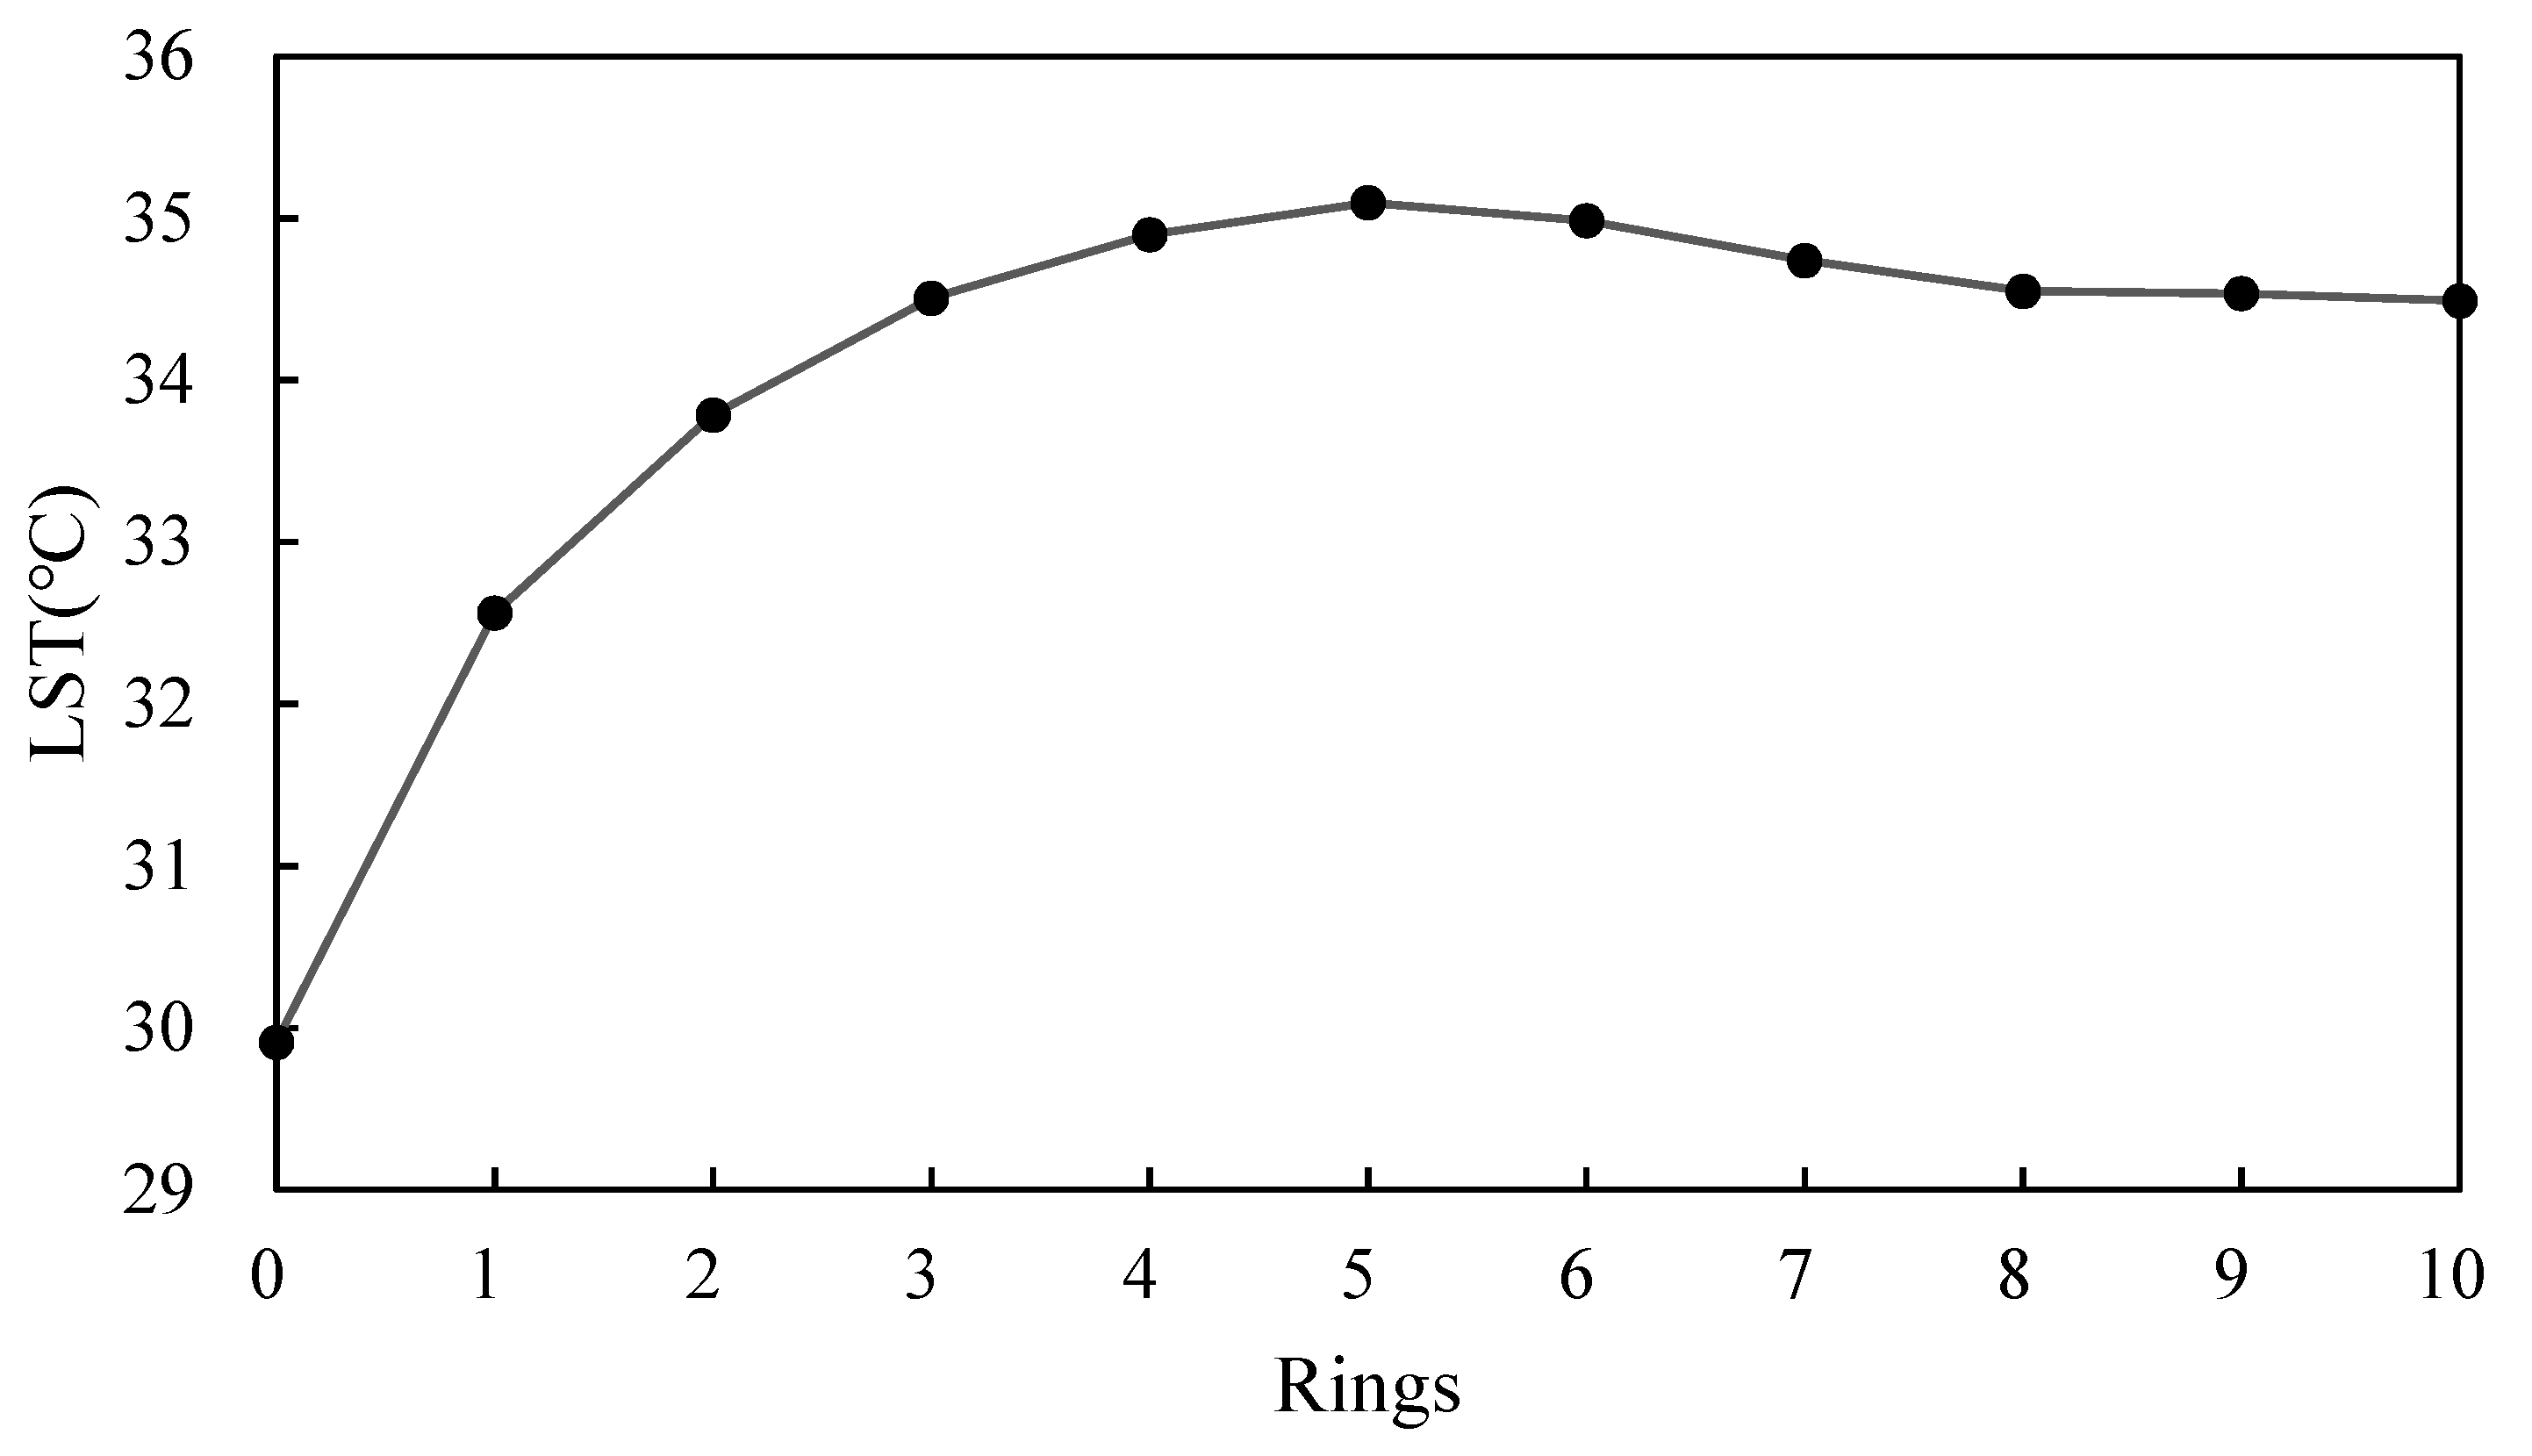
Firstly, we constructed buffers of the outline of each park with a distance of 50 m. Then, the mean LST in each buffer were calculated. A scatter plot of the relationship between the buffer number and average LST was drawn. Finally, the CIF of the park was determined by identifying the breakpoint.
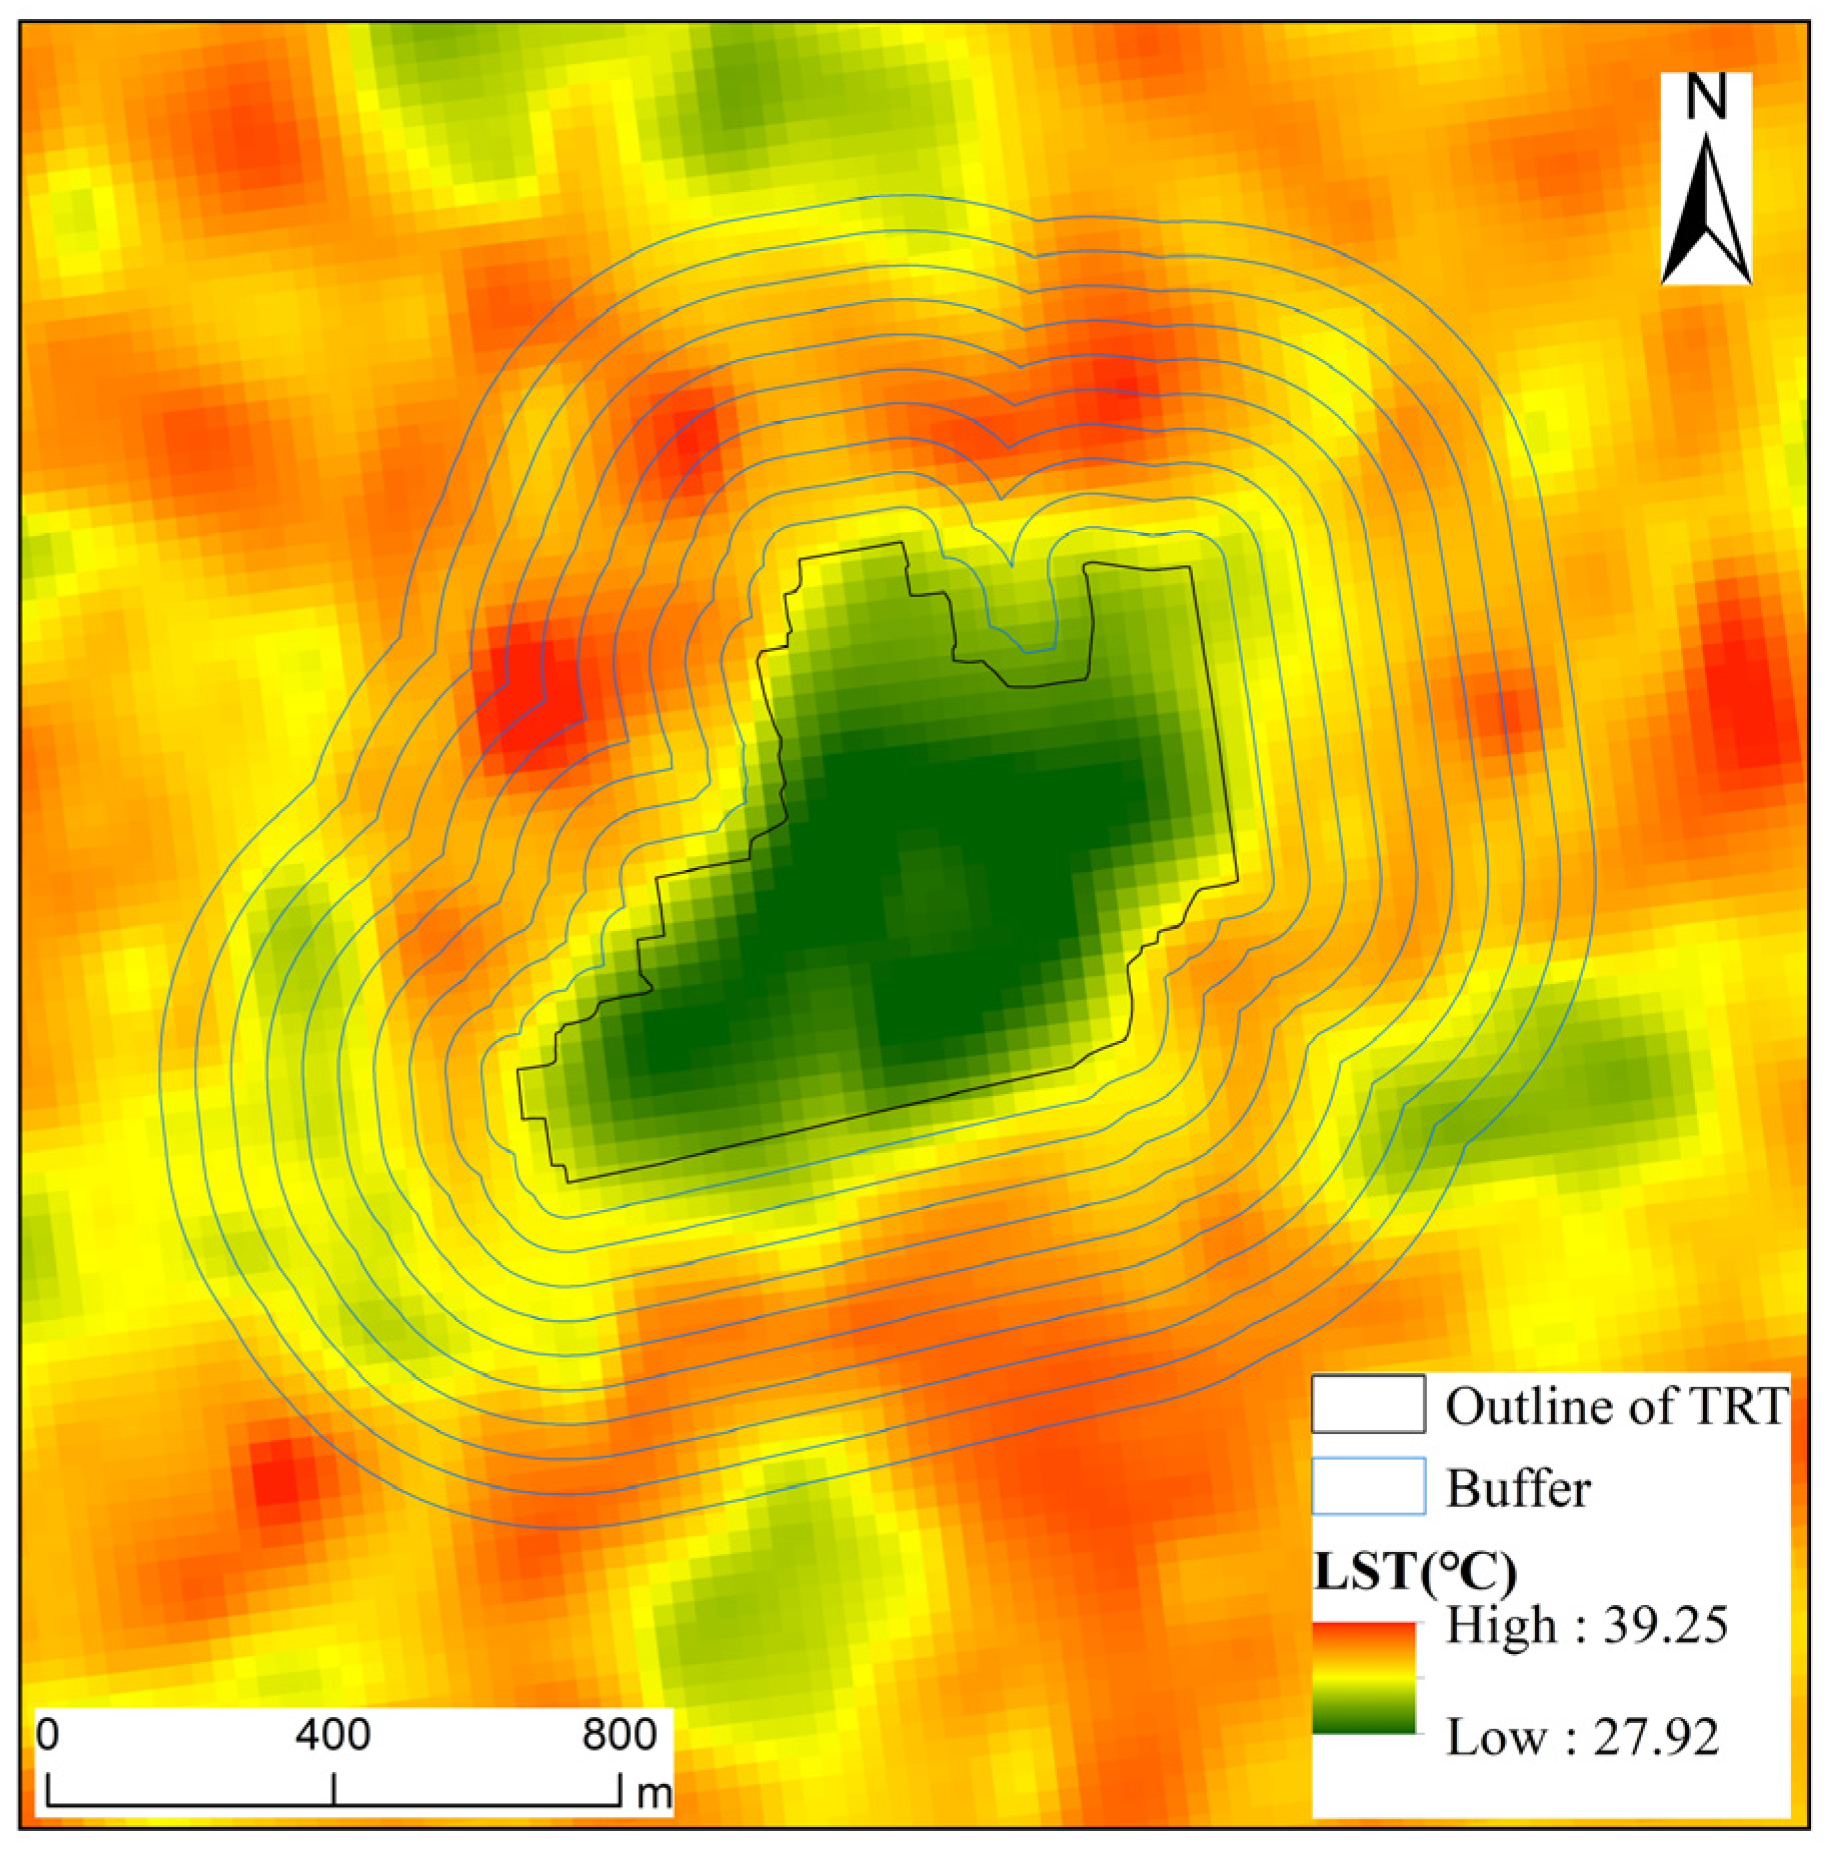
Taking TRT as an example, we first constructed buffers of the outline of this park with a distance of 50 m, the buffer diagram is shown in
Figure 4. Then, the average LST in each buffer were calculated, and the relationship between the buffer number and average LST was drawn in
Figure 5. The result showed that the average LST of TRT is 29.91 °C. As the rings extended outward, the average LST gradually increases, and reached the highest at the fifth rings (35.10 °C). Then, the average LST begins to decrease. Thus, the fifth ring represents the boundary of change in the LST, the area of the five inner rings is determined as the CIF of TRT.
2.3.4. Analytical Methods
Multiple linear regression model was used to explore the effects of neighboring buildings on CIF of central parks. Three building types, including LRB, MRB and HRB, were also considered in this study. To illustrate the composition and configuration characteristics of buildings, some metrics, including percentage of landscape (PLAND), landscape shape index (LSI), perimeter area fractal dimension (PAFRAC), interspersion juxtaposition index (IJI), and aggregation index (AI), which were quantified by Fragstats 4.2, has been used in this study. Particular, PLAND is used to quantify the composition characteristics of buildings, and LSI, PAFRAC, IJI, and AI are used to quantify the configuration characteristics of buildings.
5. Conclusions
This study investigated the impacts of neighboring building on the CIE of central parks based on Landsat 8 OLI images, GF2 images, and building dataset. The key characteristics of buildings which influence parks’ CIE were identified in summer and winter. Thus, this study could extend scientific understanding of degree to which CIE of central parks are affected by neighboring buildings (especially different types of buildings), and could provide guidance to urban planners on how to mitigate the UHI effects through the rational allocation of buildings.
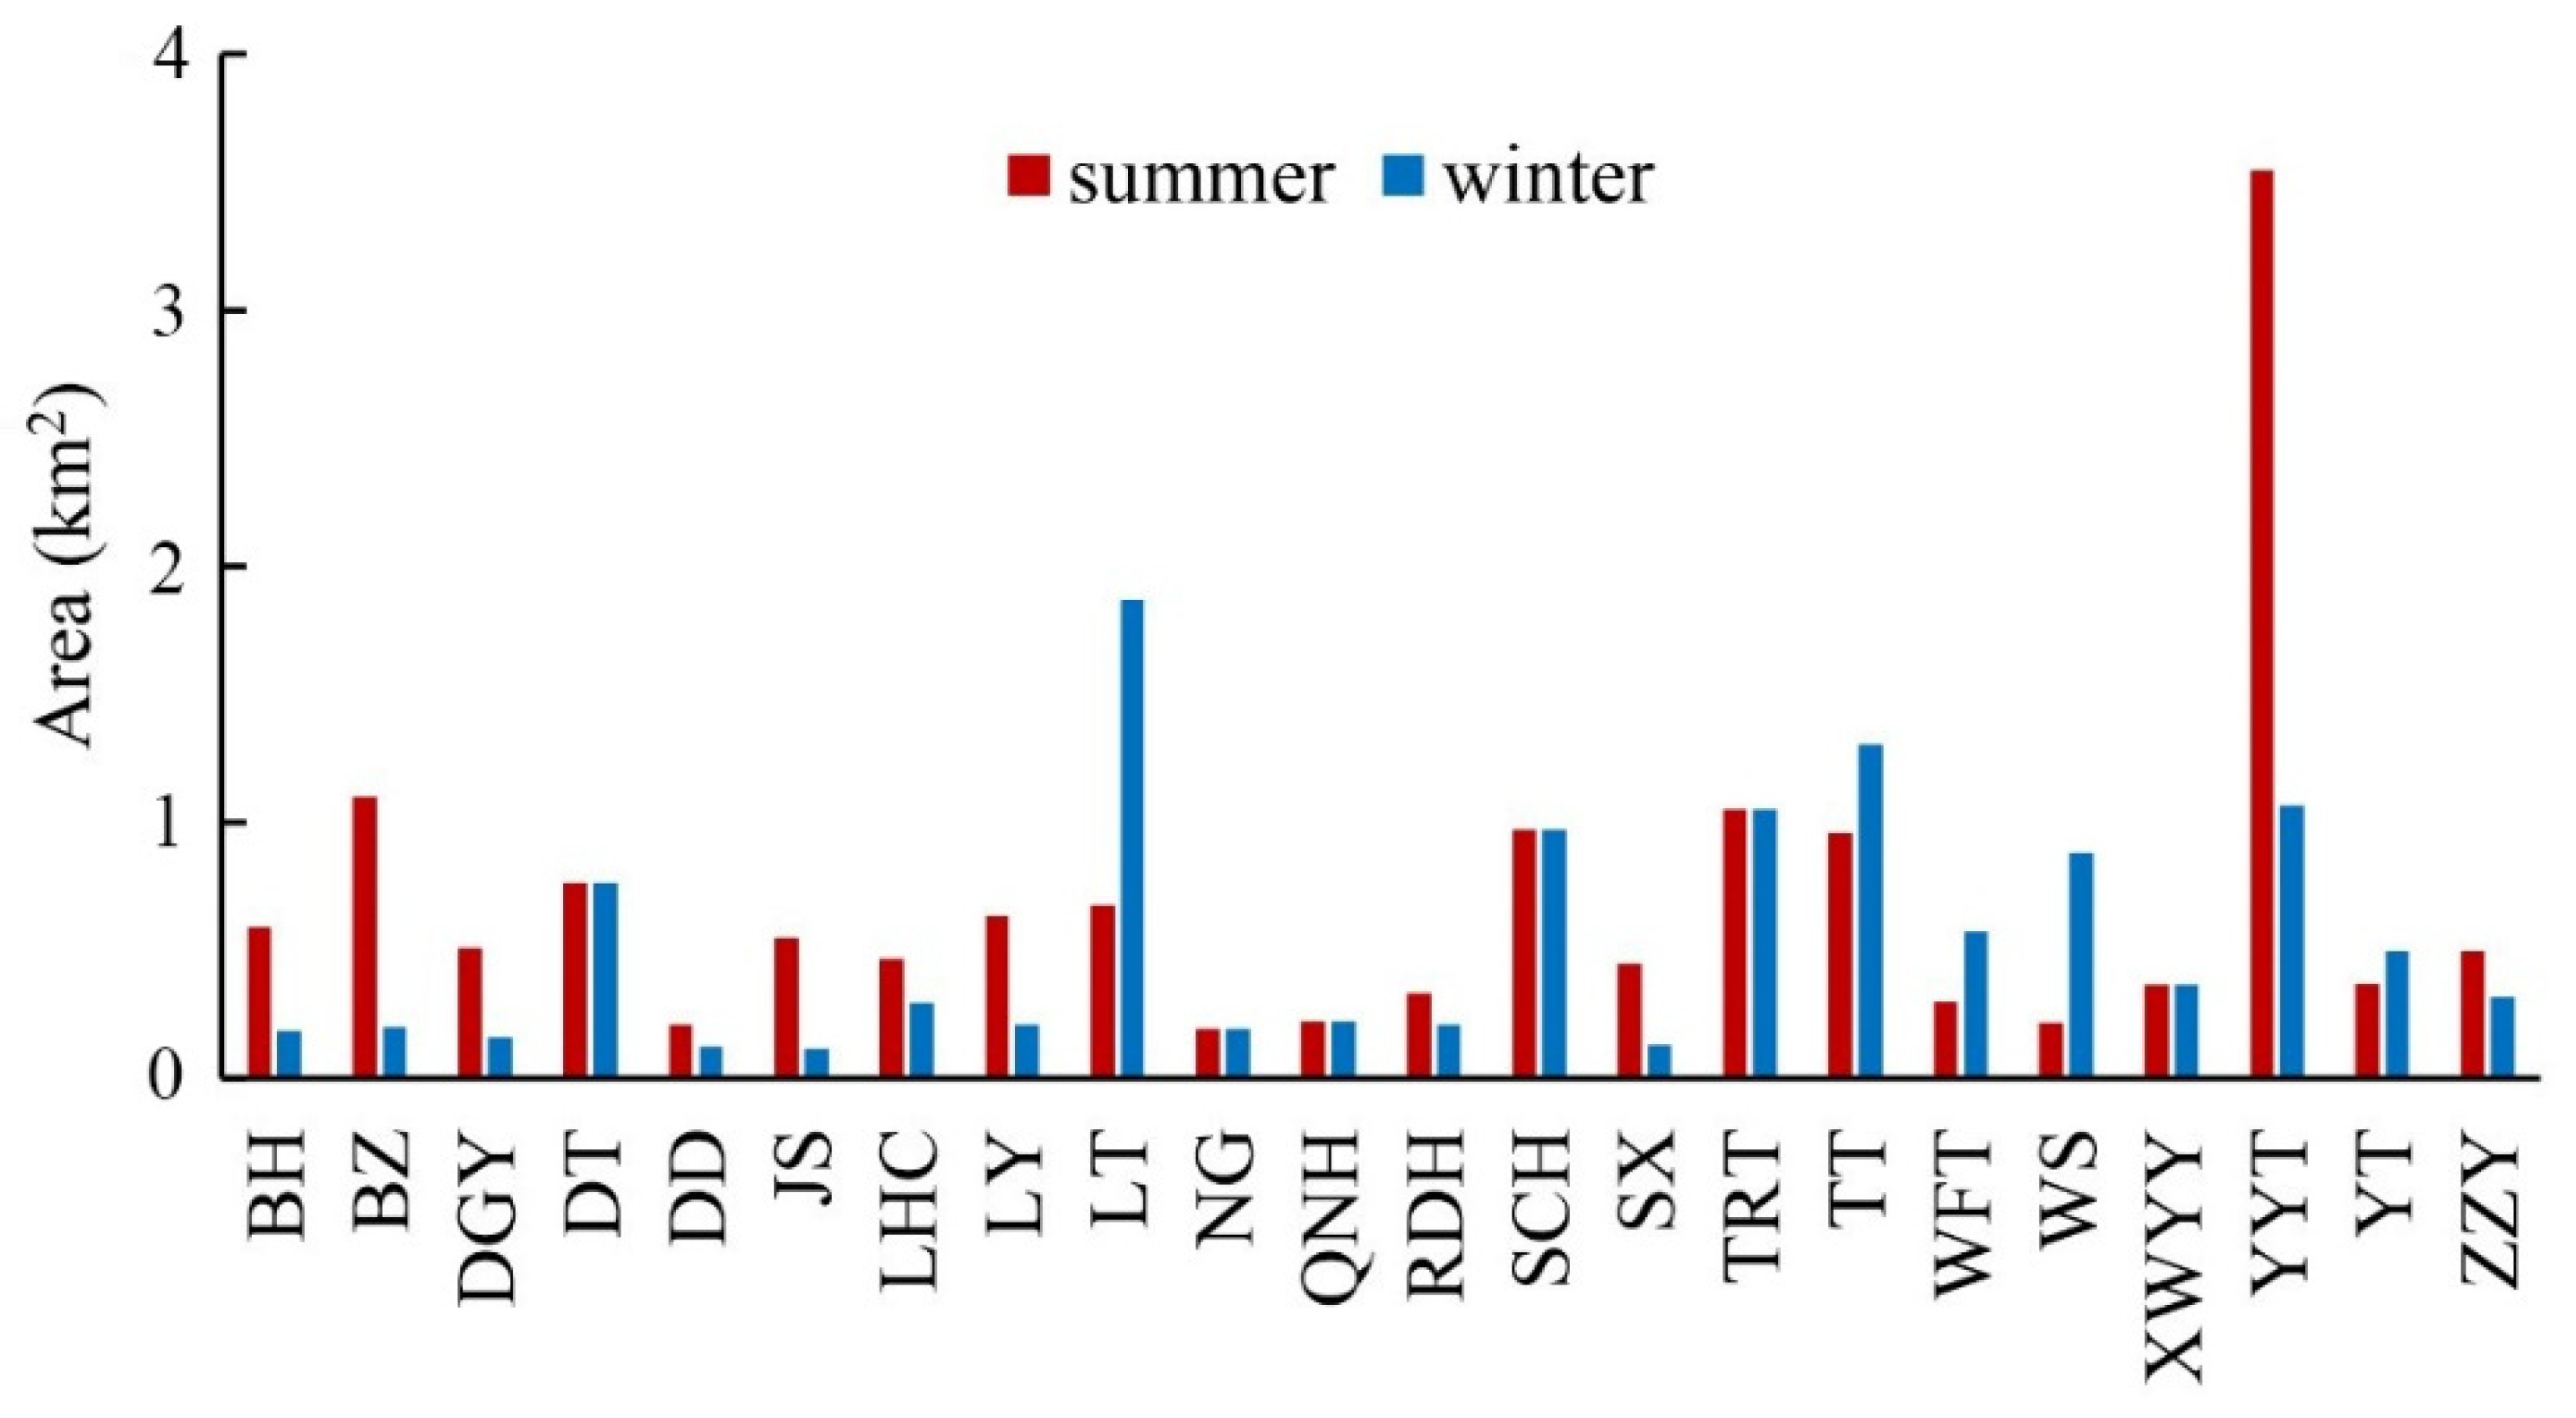
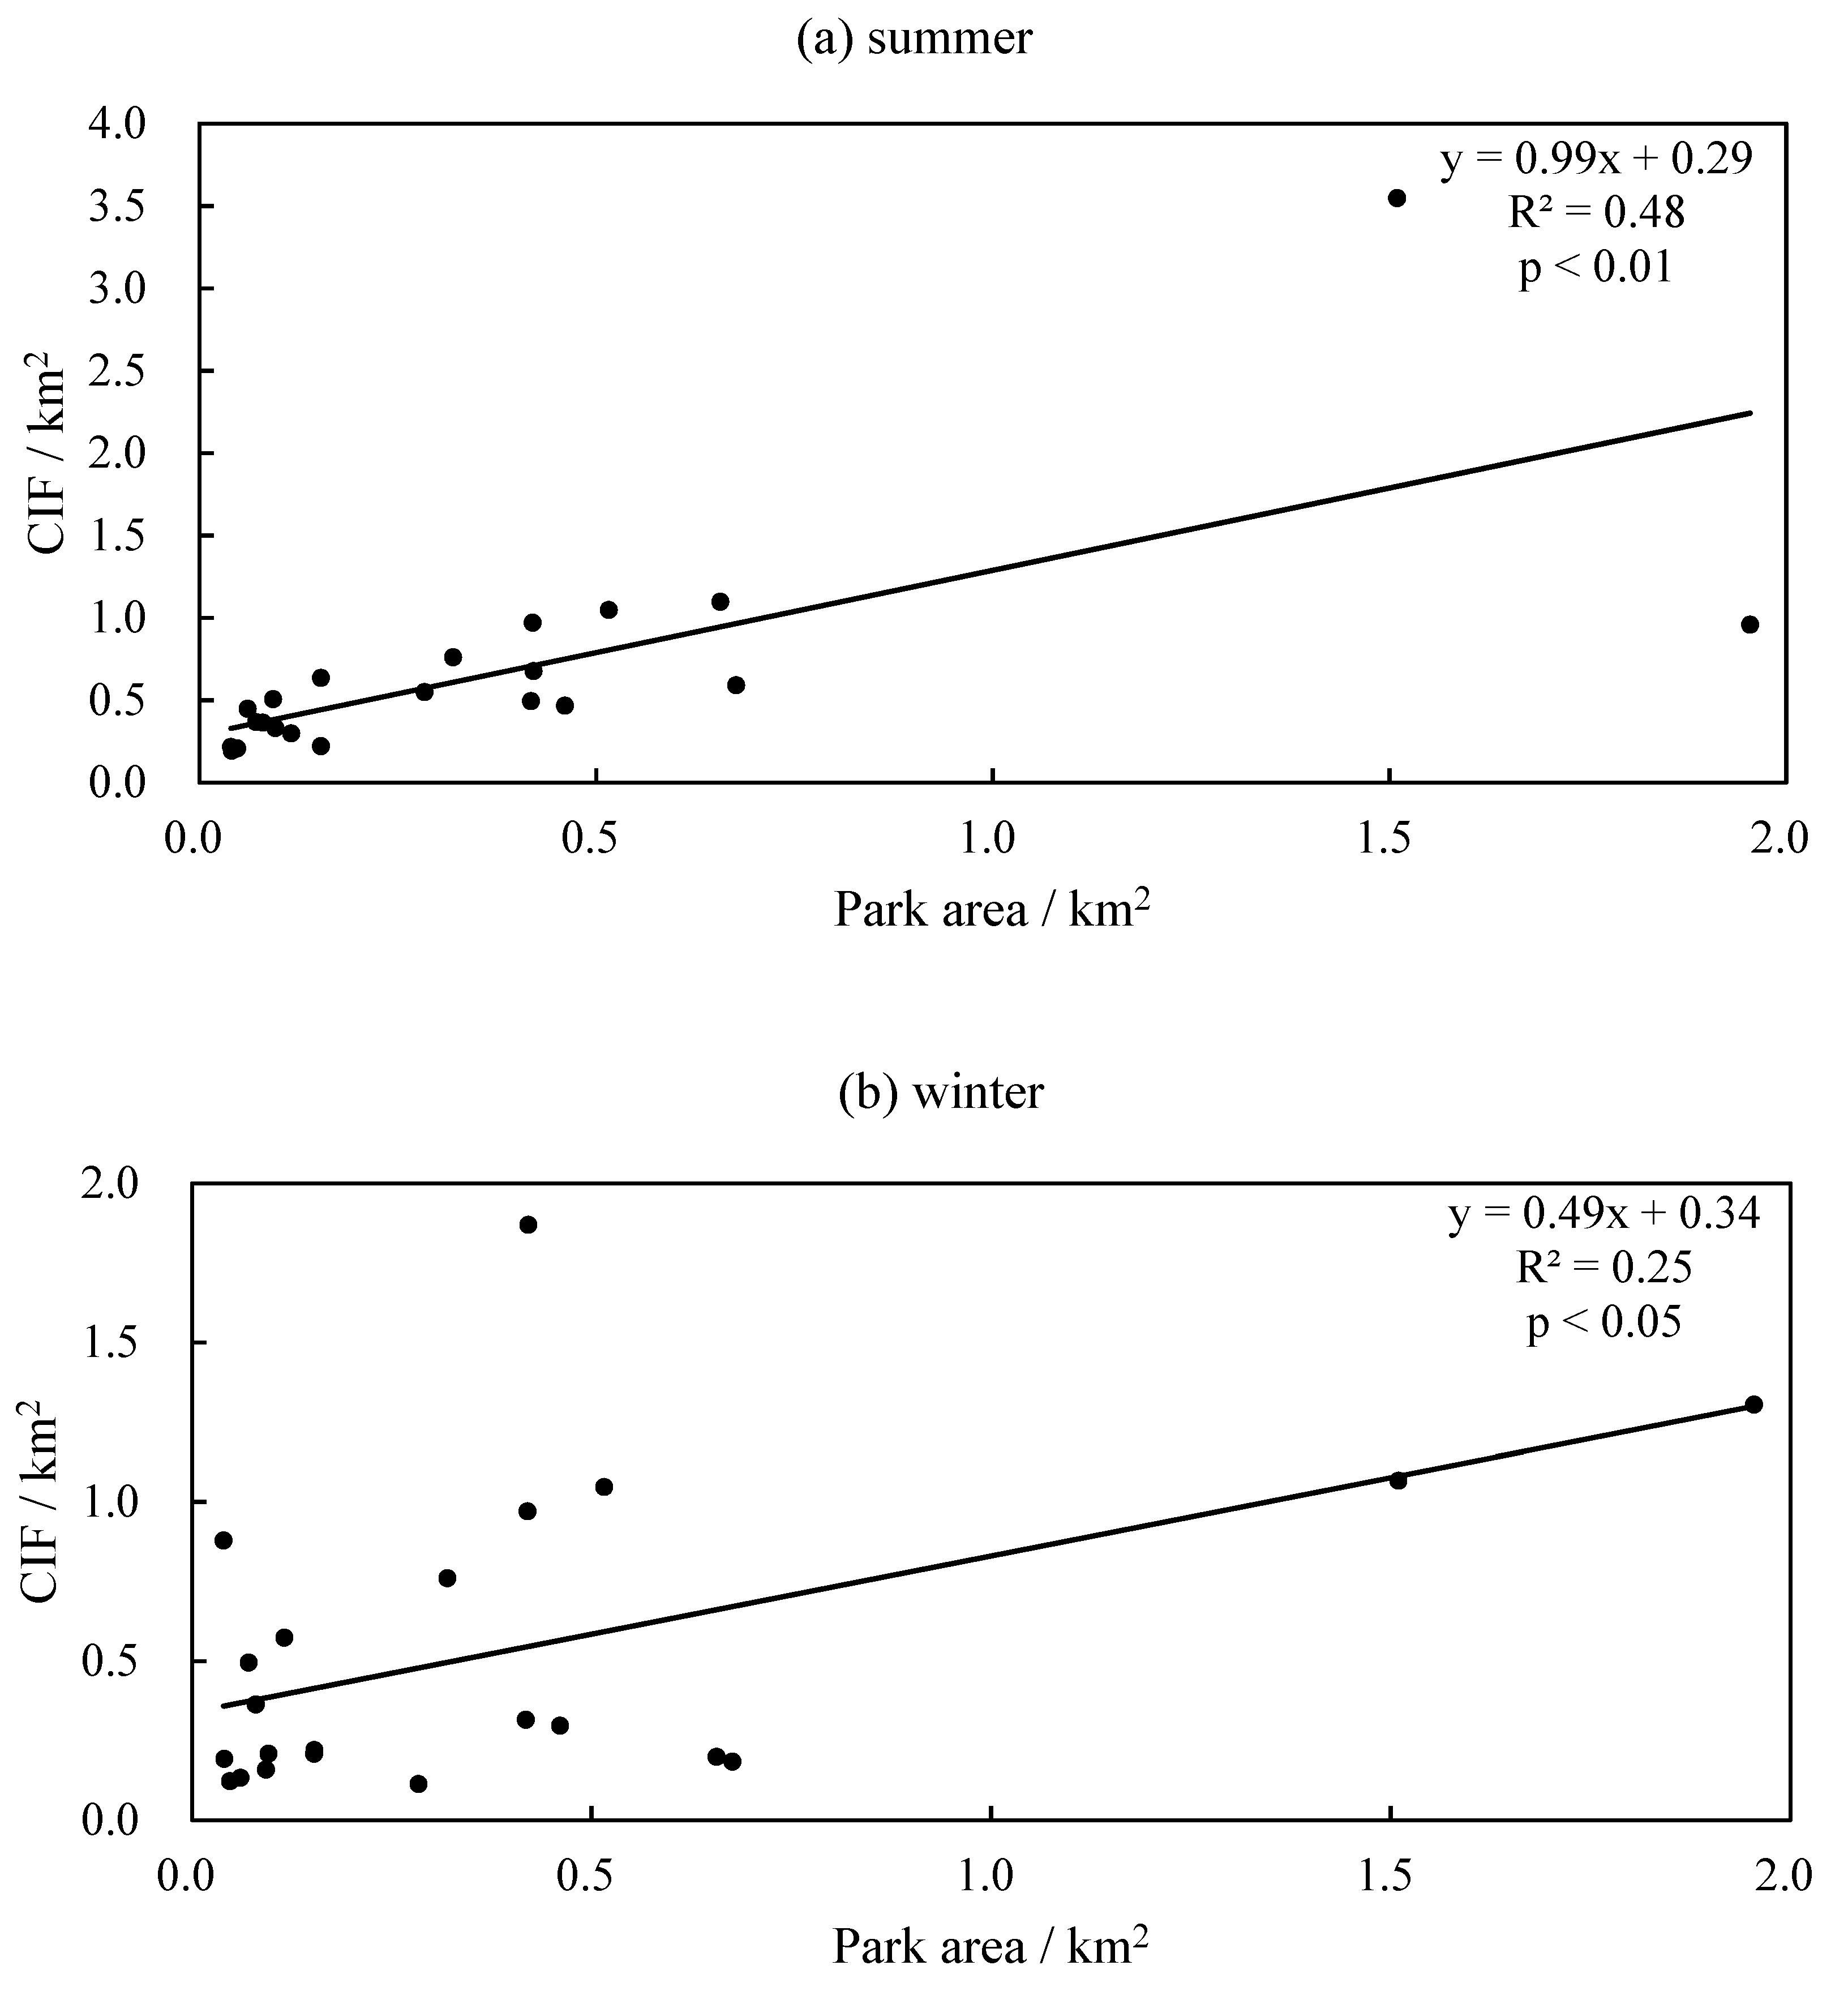
The average LSTs of parks are 30.98 °C in summer and −1.10 °C in winter, respectively. LSTs of parks in summer are significantly lower than neighboring areas. CIF of parks in summer is higher than that in winter, with an average area of 0.15 km2 larger than that in winter. Average LST differences between park and CIF are 2.87 °C in summer and 0.86 °C in winter, indicating that parks have a strong CIE in summer. The components of the building in CIF of parks are dominated by MRB, followed by LRB, and HRB is the least dominant. Furthermore, the PLAND and LSI of MRB, and PAFRAC of LRB are significantly related to CIF in summer and winter. This study demonstrated that parks have a stronger CIE in summer than that in winter, which can effectively mitigate the UHI effects. This study also demonstrated that the CIE of parks can vary in different types of neighboring buildings, especially MRB. It is emphasized that reasonable planning of different types of neighboring buildings (spatial composition and configuration) should be designed based on the characteristics of parks in the future. Our findings are a good theoretical contribution to the urban thermal environment research, providing useful guidance on optimizing buildings for urban planners and administrators. The findings can provide new insights into further exploration of how to improve the CIE of parks.


