Mechanism of the Rapid Shrinkage of Limboto Lake in Gorontalo, Indonesia

 ,
,  ,
,
Abstract
1. Introduction
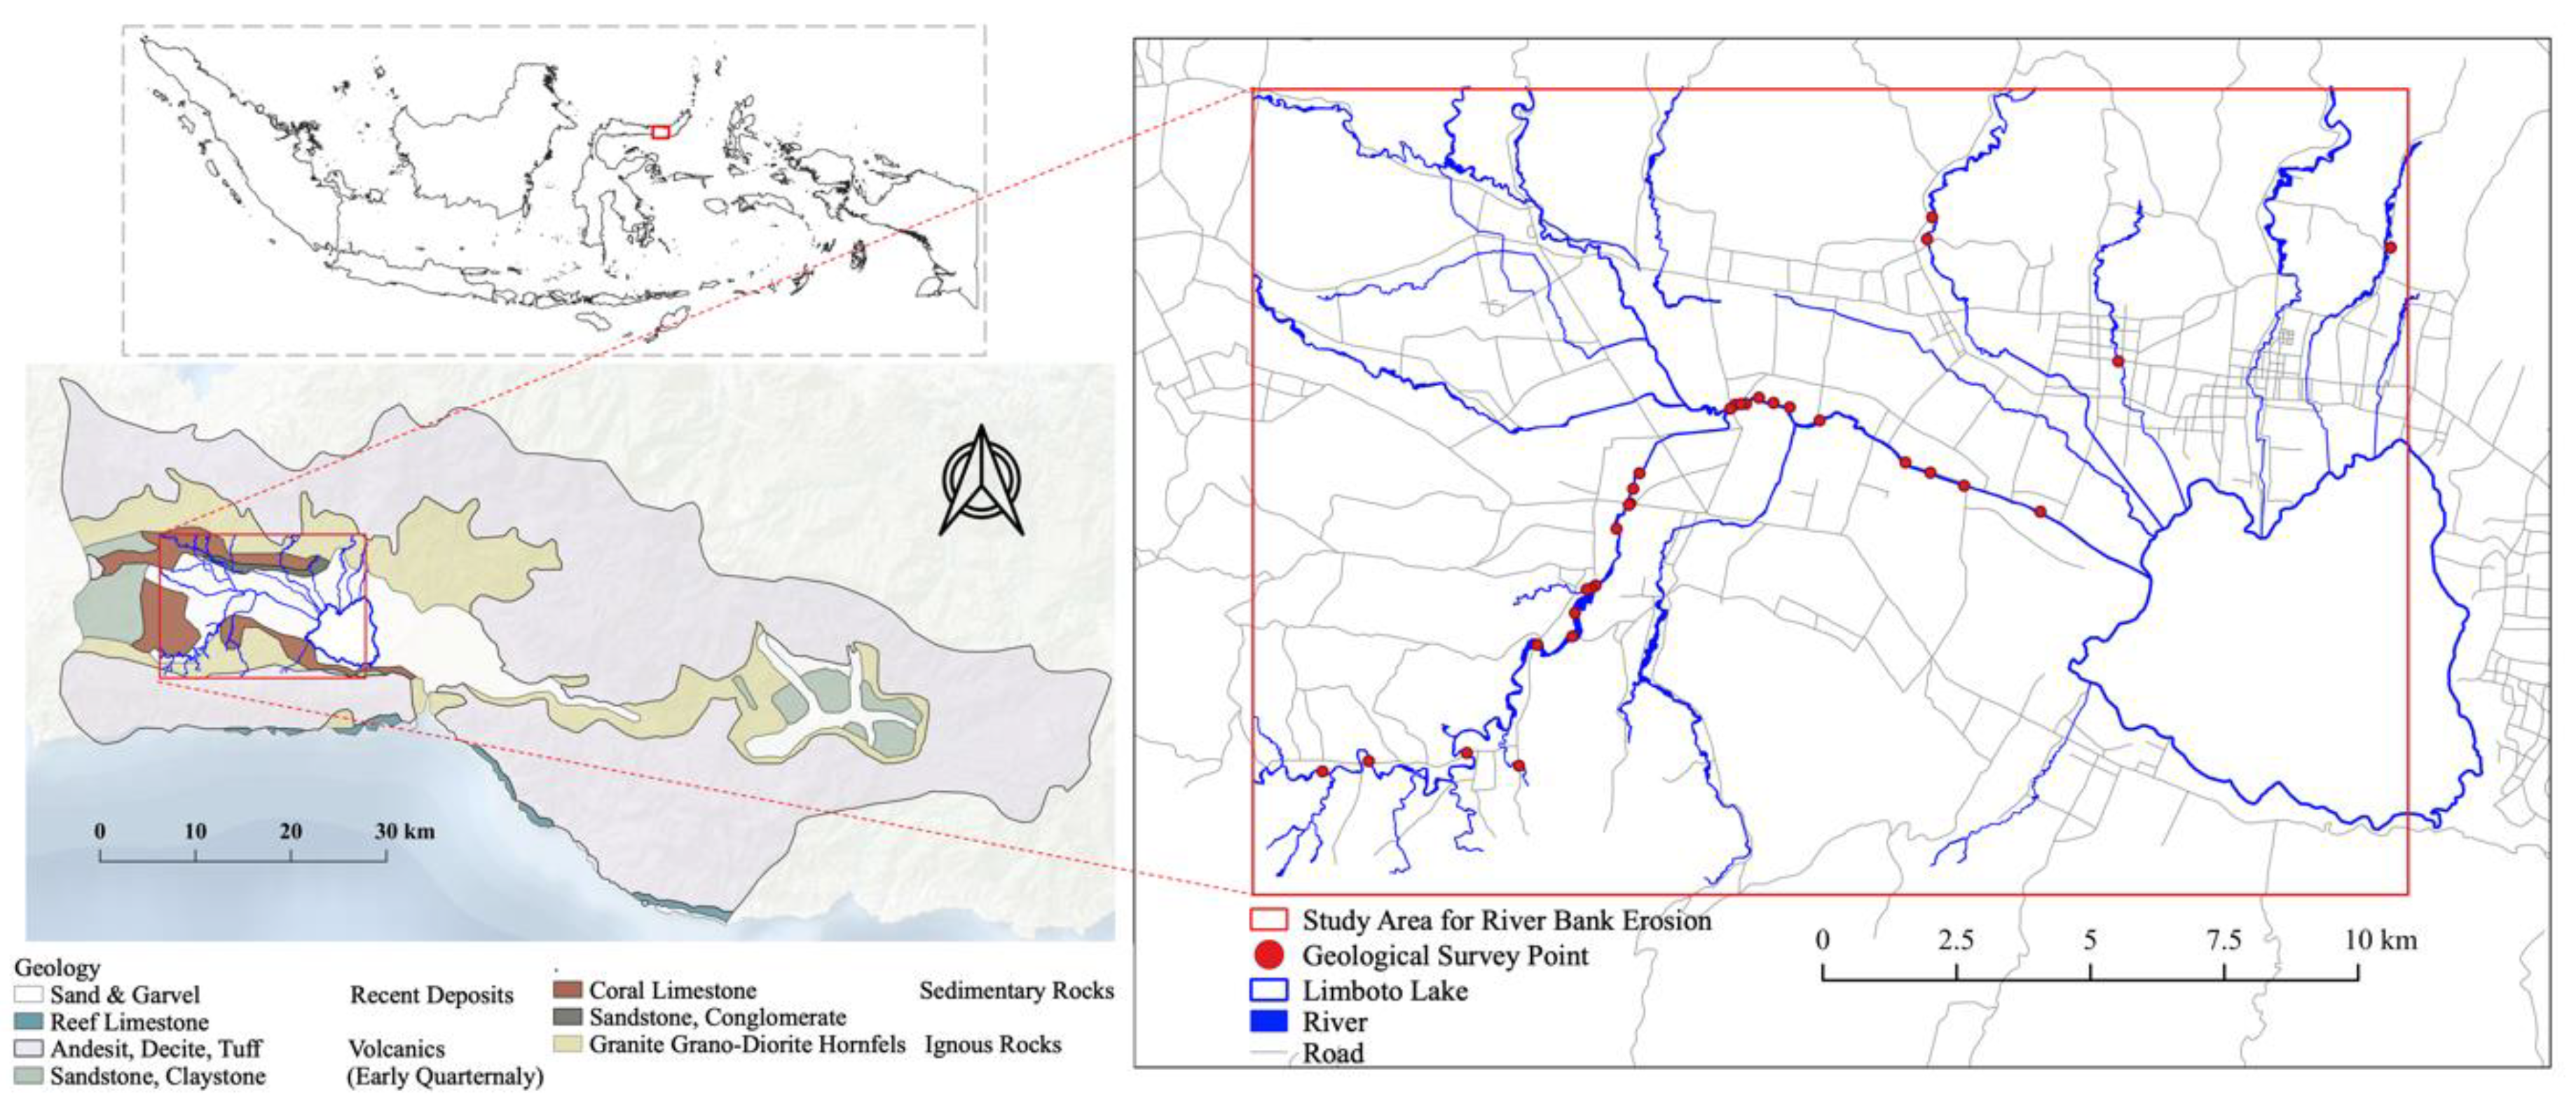
2. Study Area
3. Methods
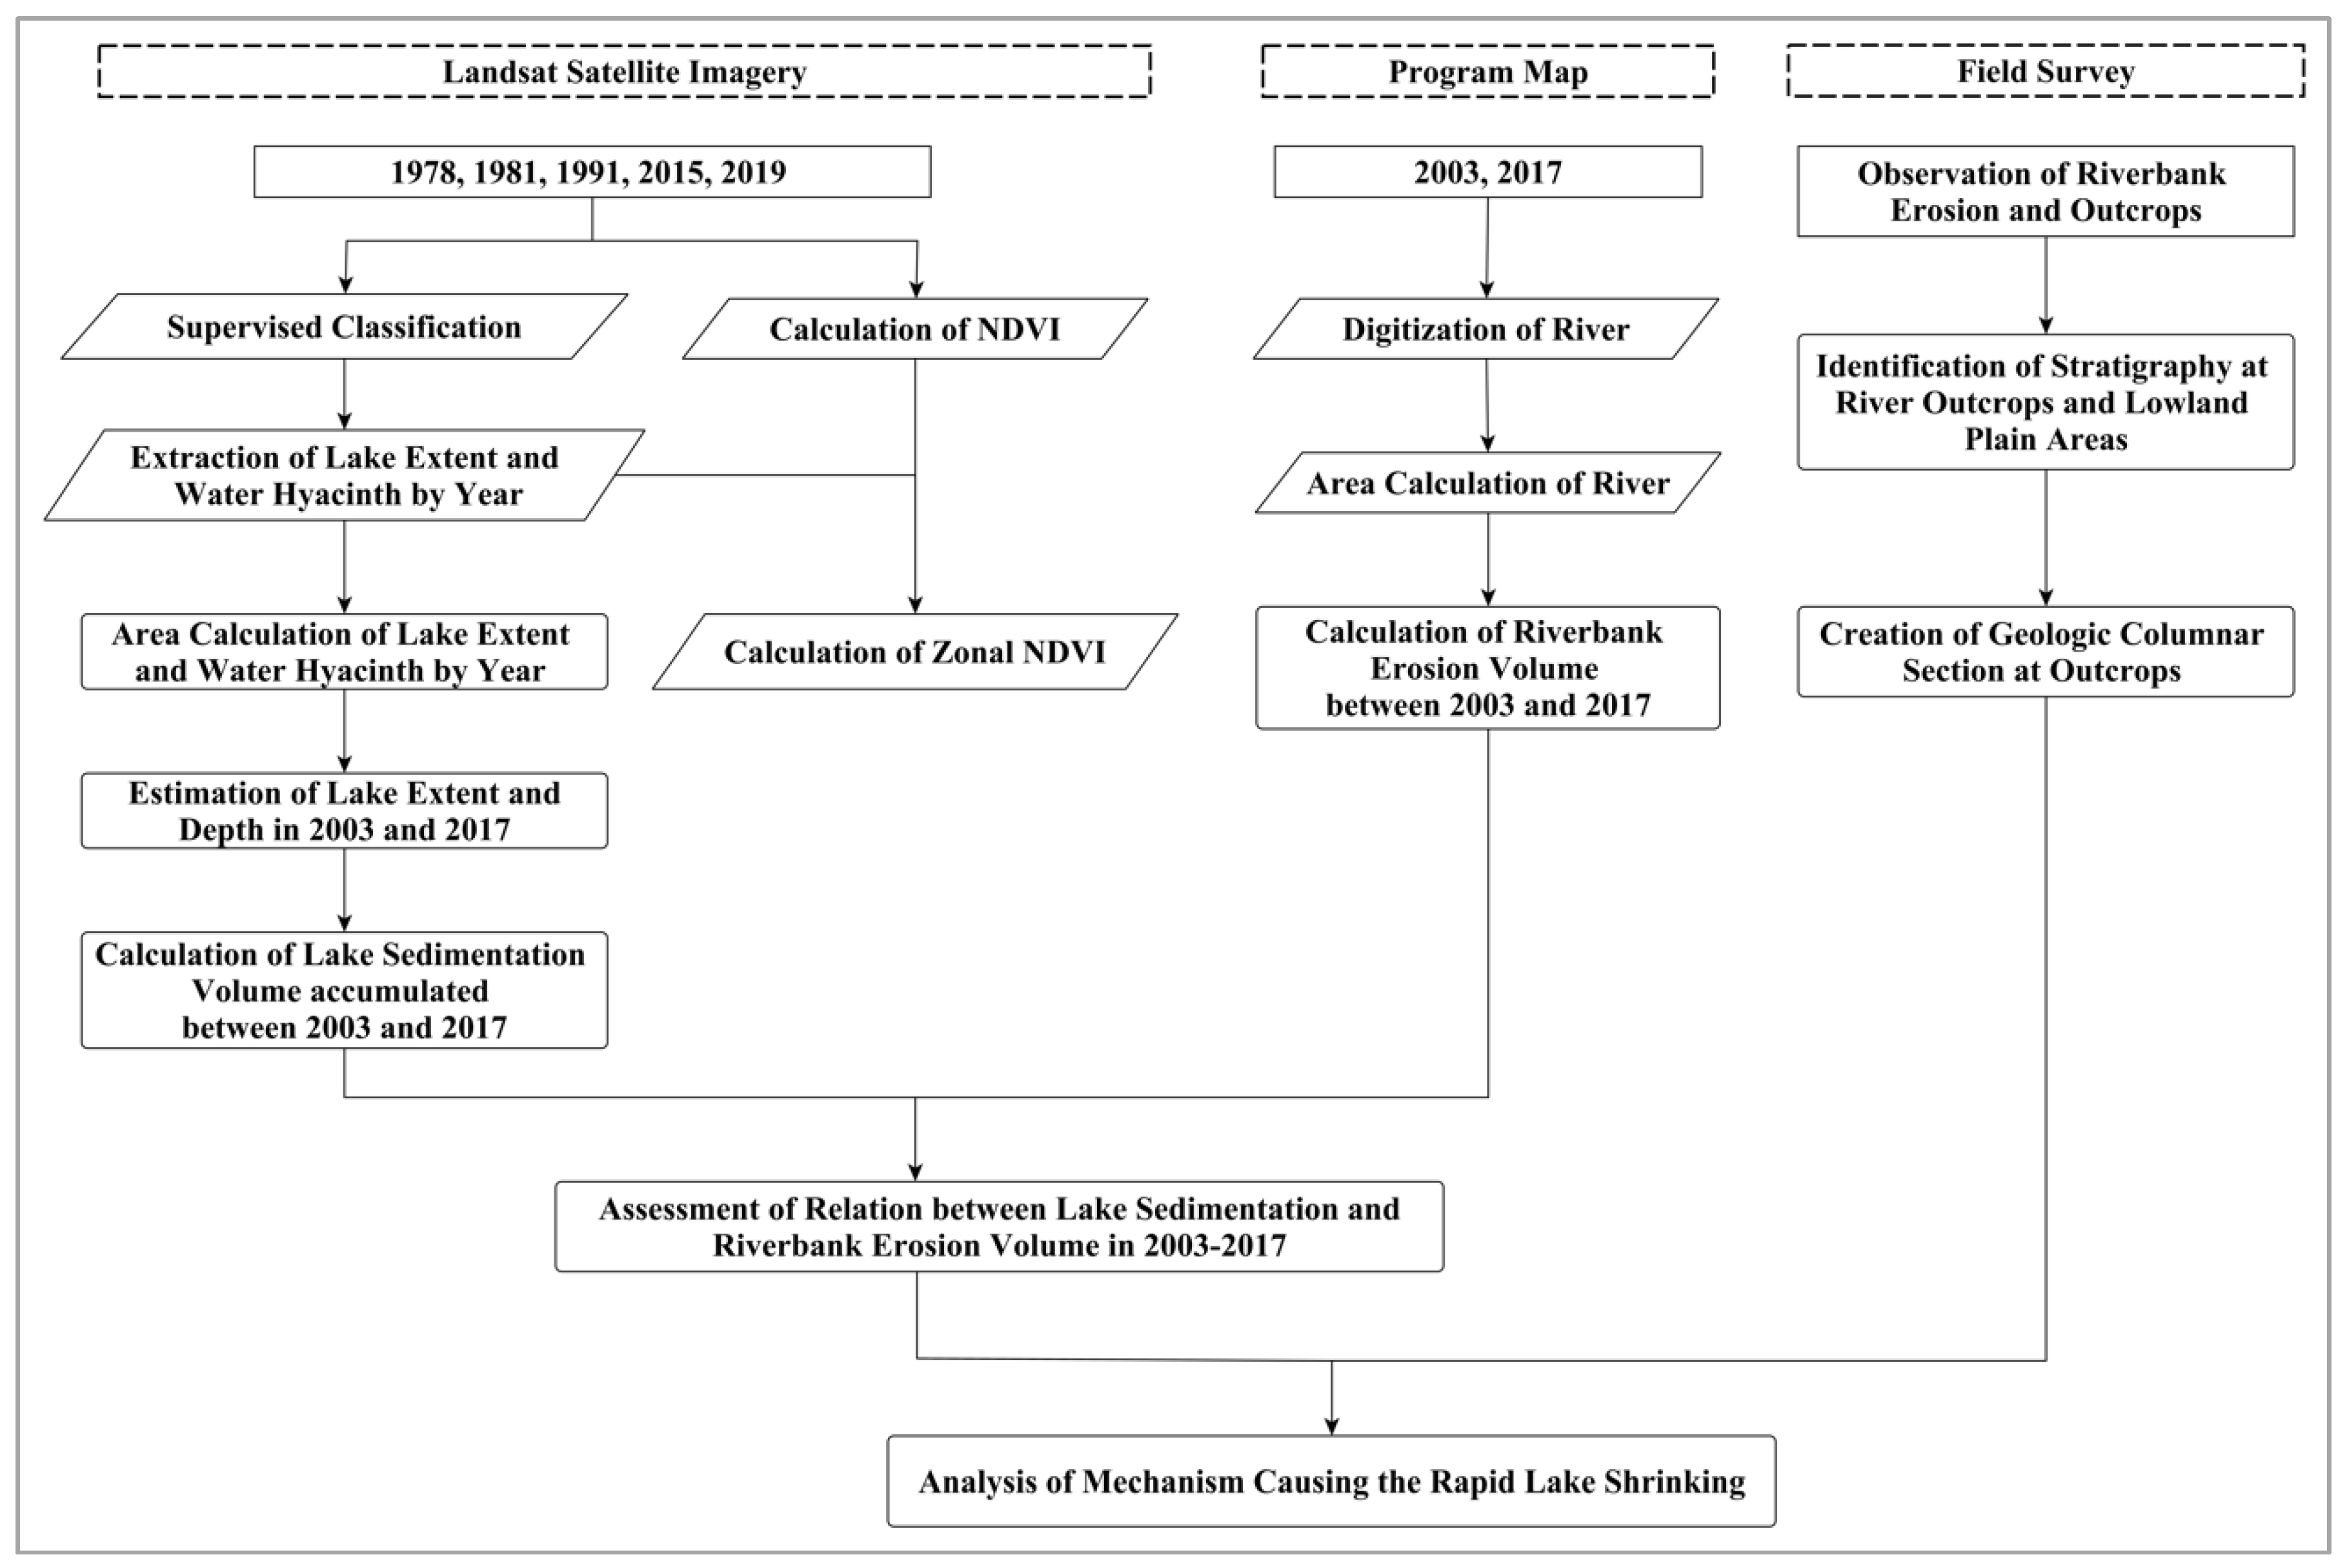
3.1. Overall Methodological Workflow
3.2. Satellite Imagery
3.3. Extraction of Lake Extent and Water Hyacinth on the Lake Surface and Calculation of Zonal NDVI
3.4. Calculation of Sedimentation Volume Accumulated in the Lake
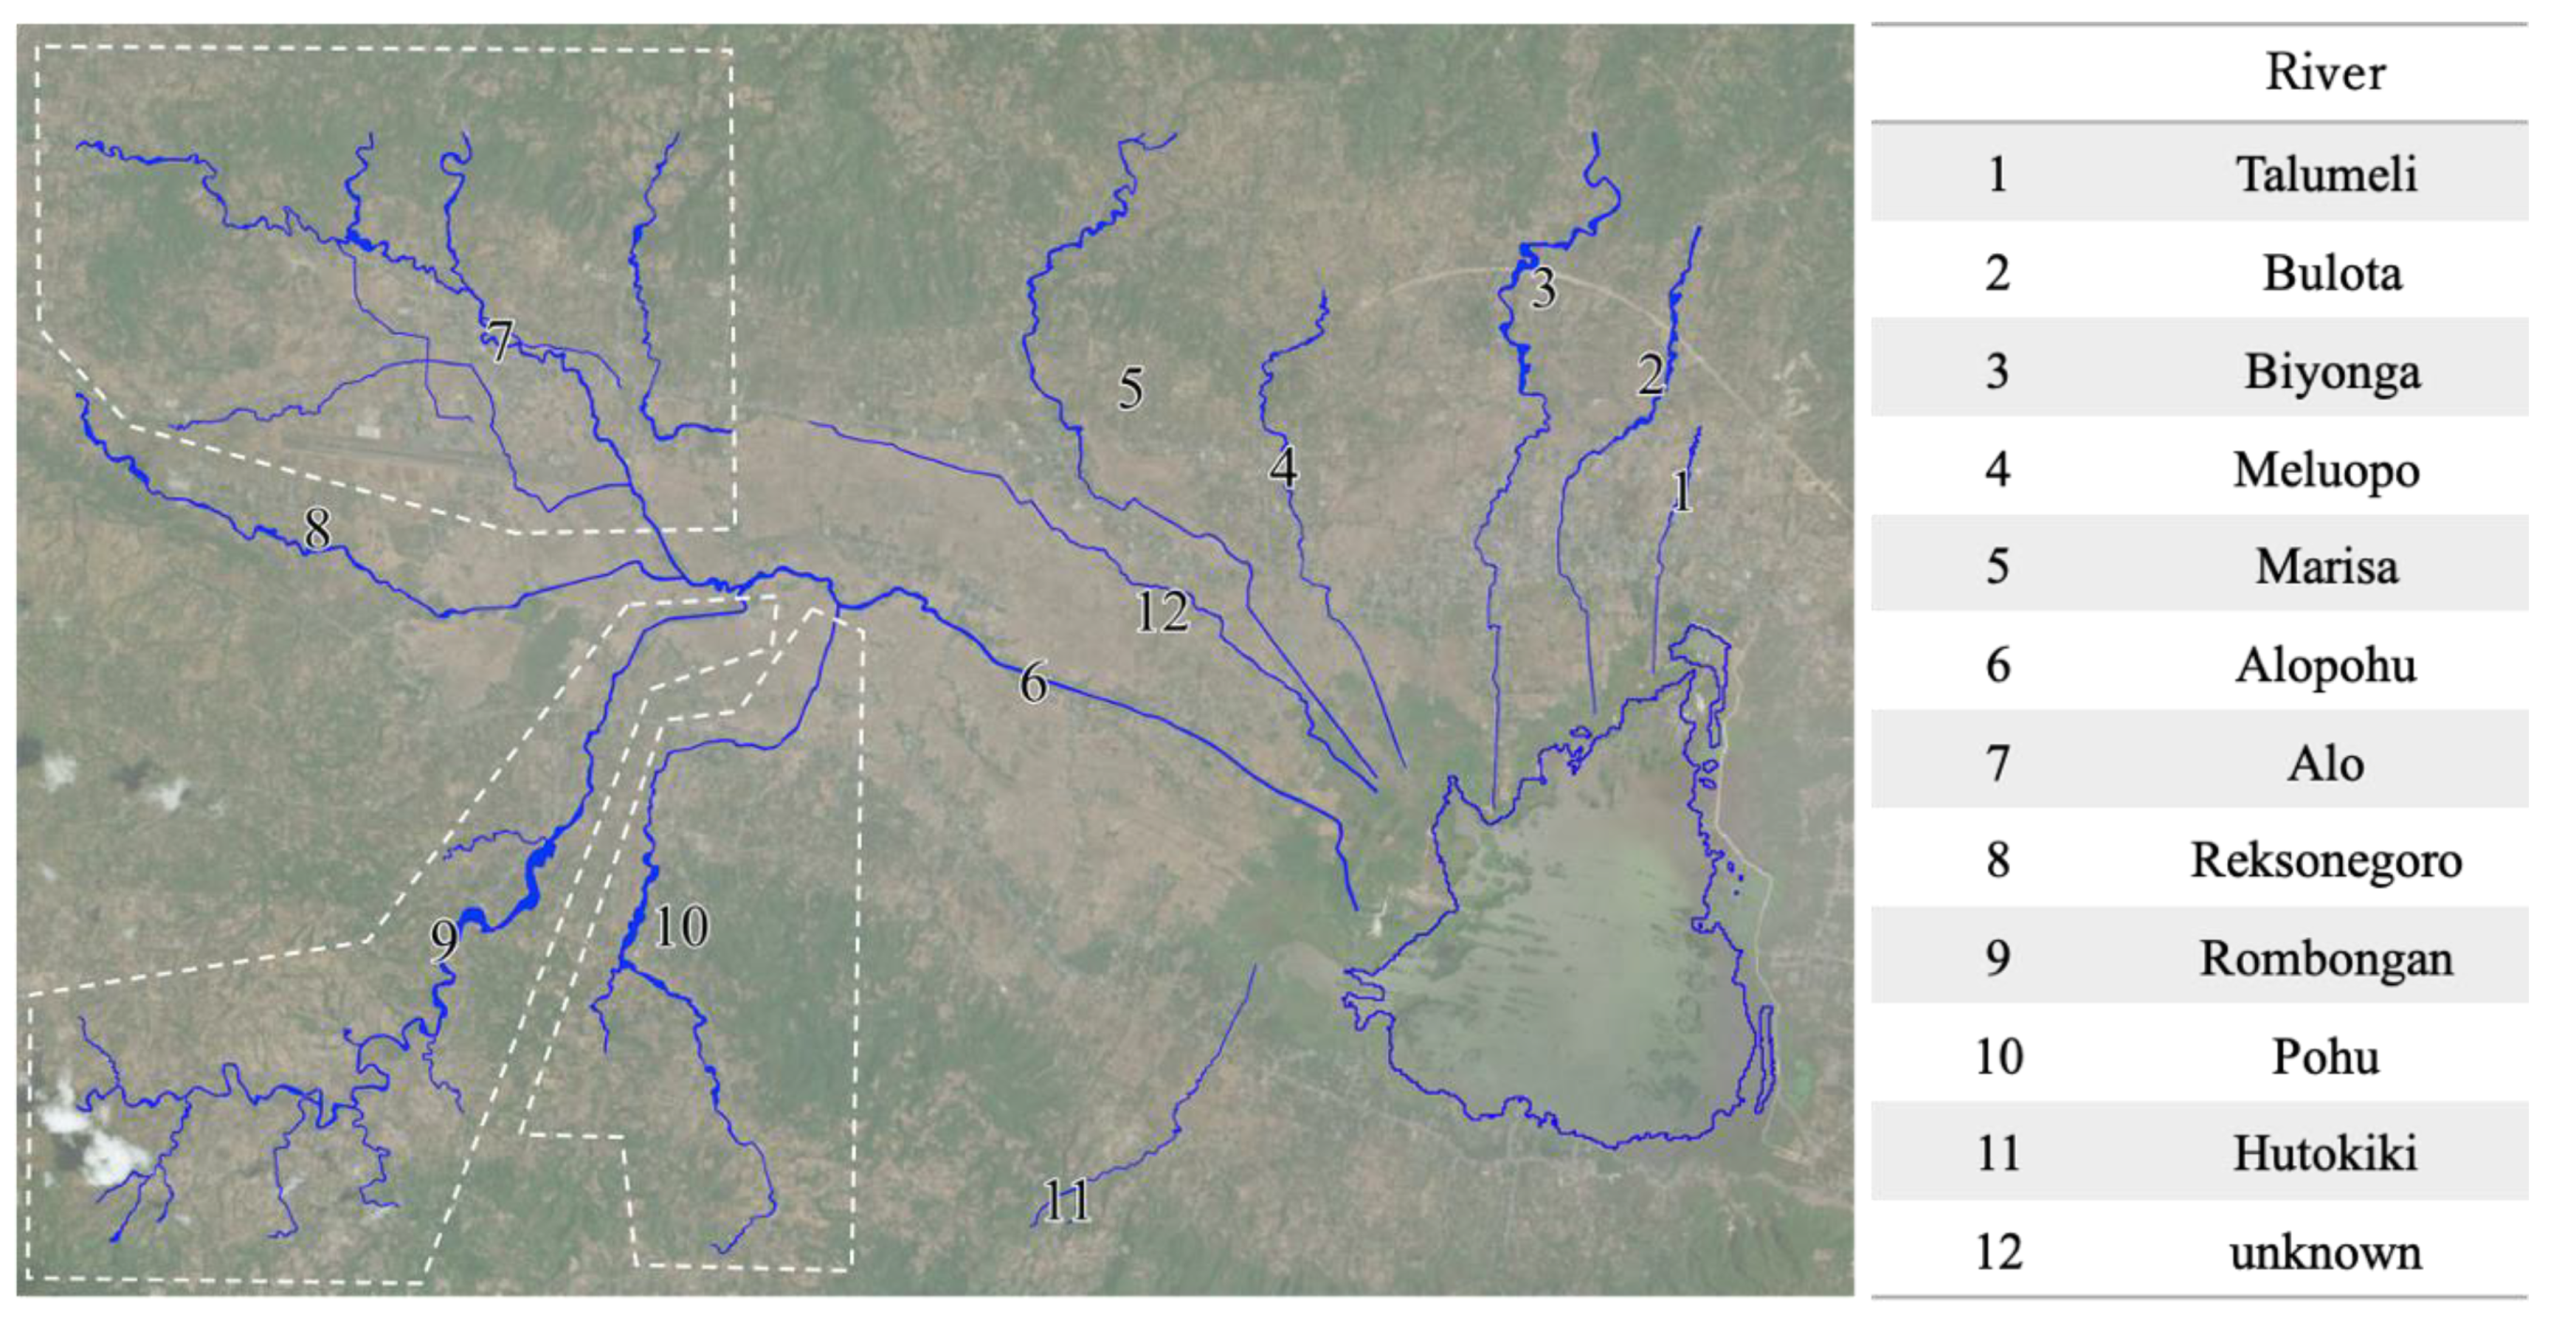
3.5. Extraction of Riverbank Erosion and Estimation of its Volume
3.6. Field Survey of Outcrops
3.7. Investigation of the Sedimentary Component of River Outcrops and Lowland Plain Areas
4. Result and Discussion
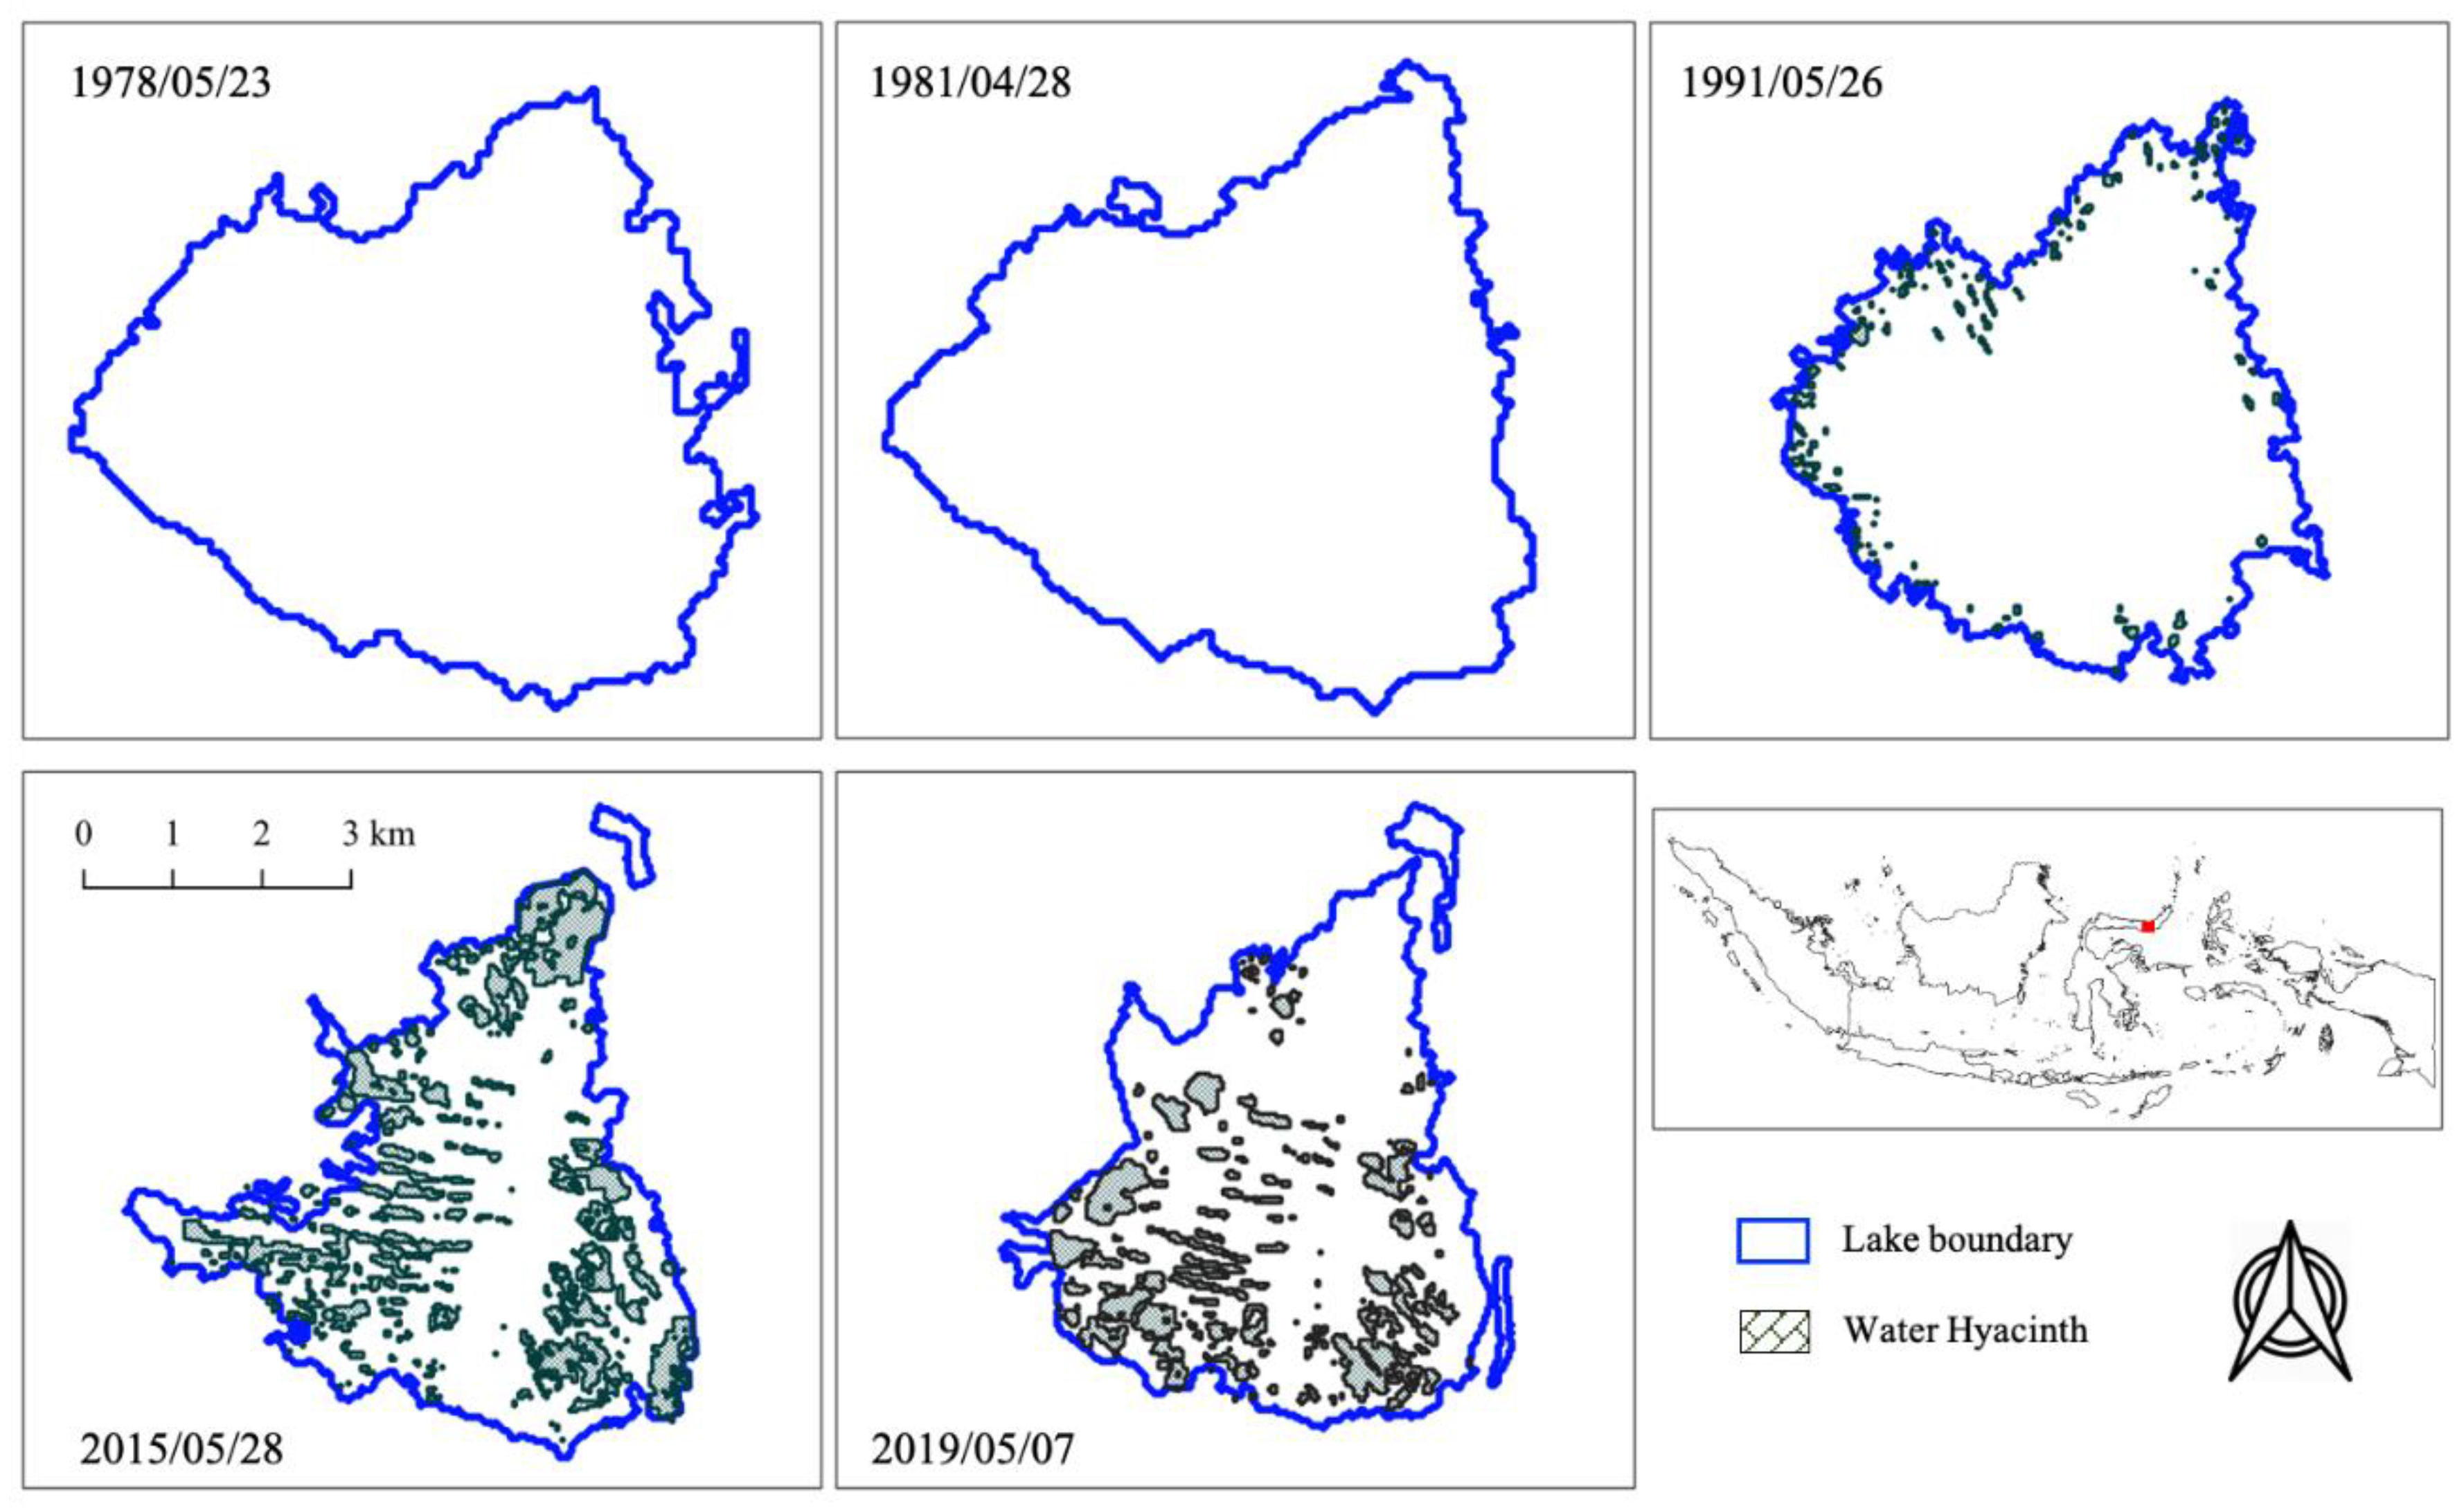
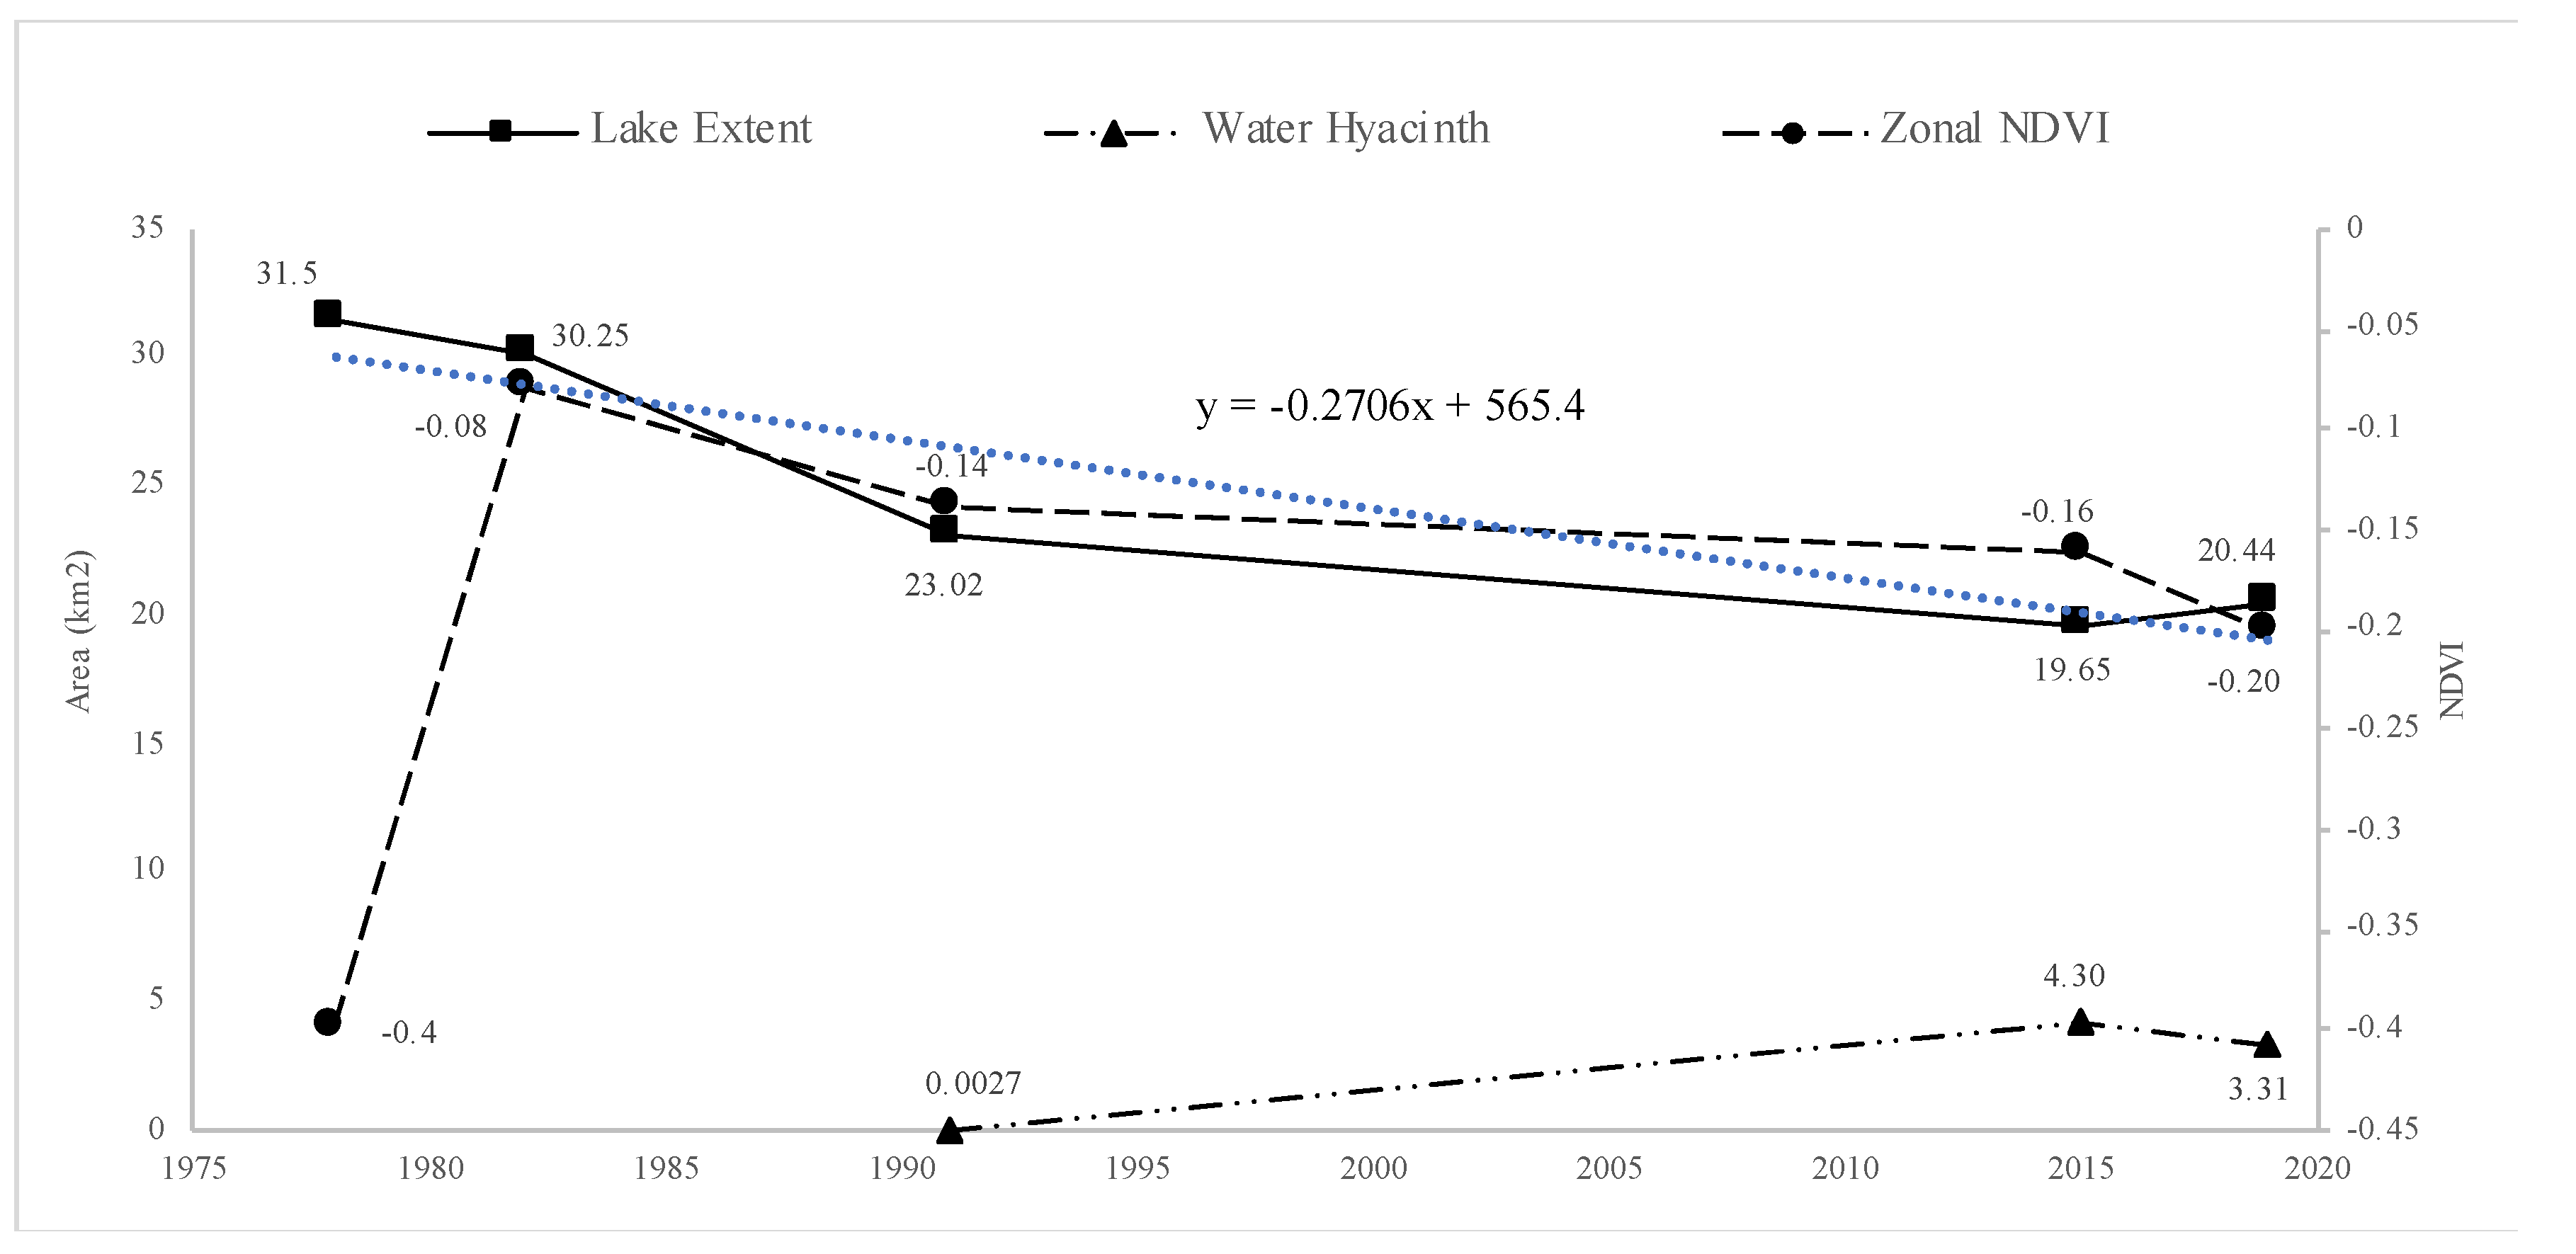
4.1. Changes in Lake Extent in Time-Series and Estimation of Lake Sedimentation Volume
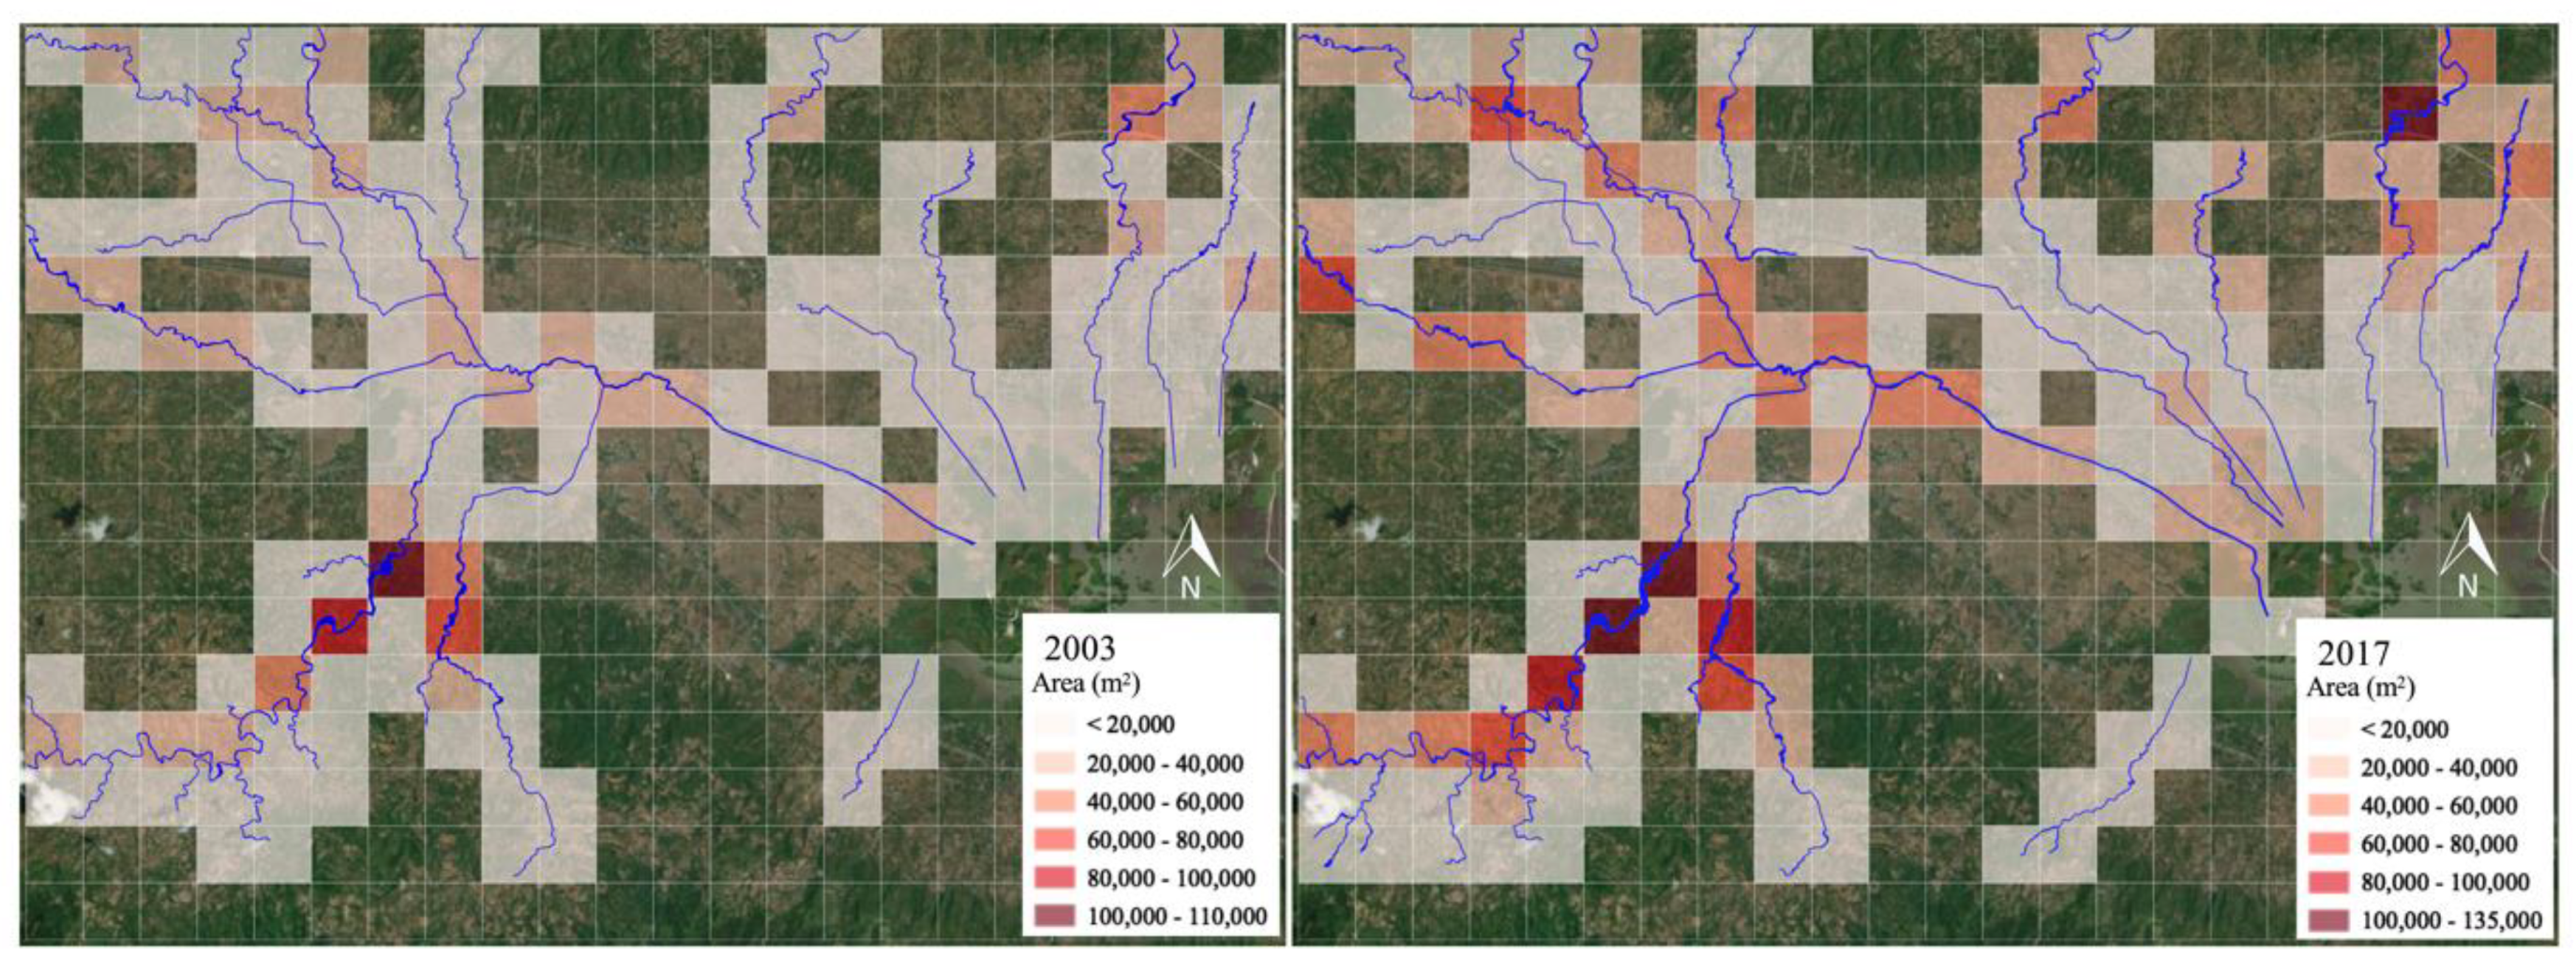
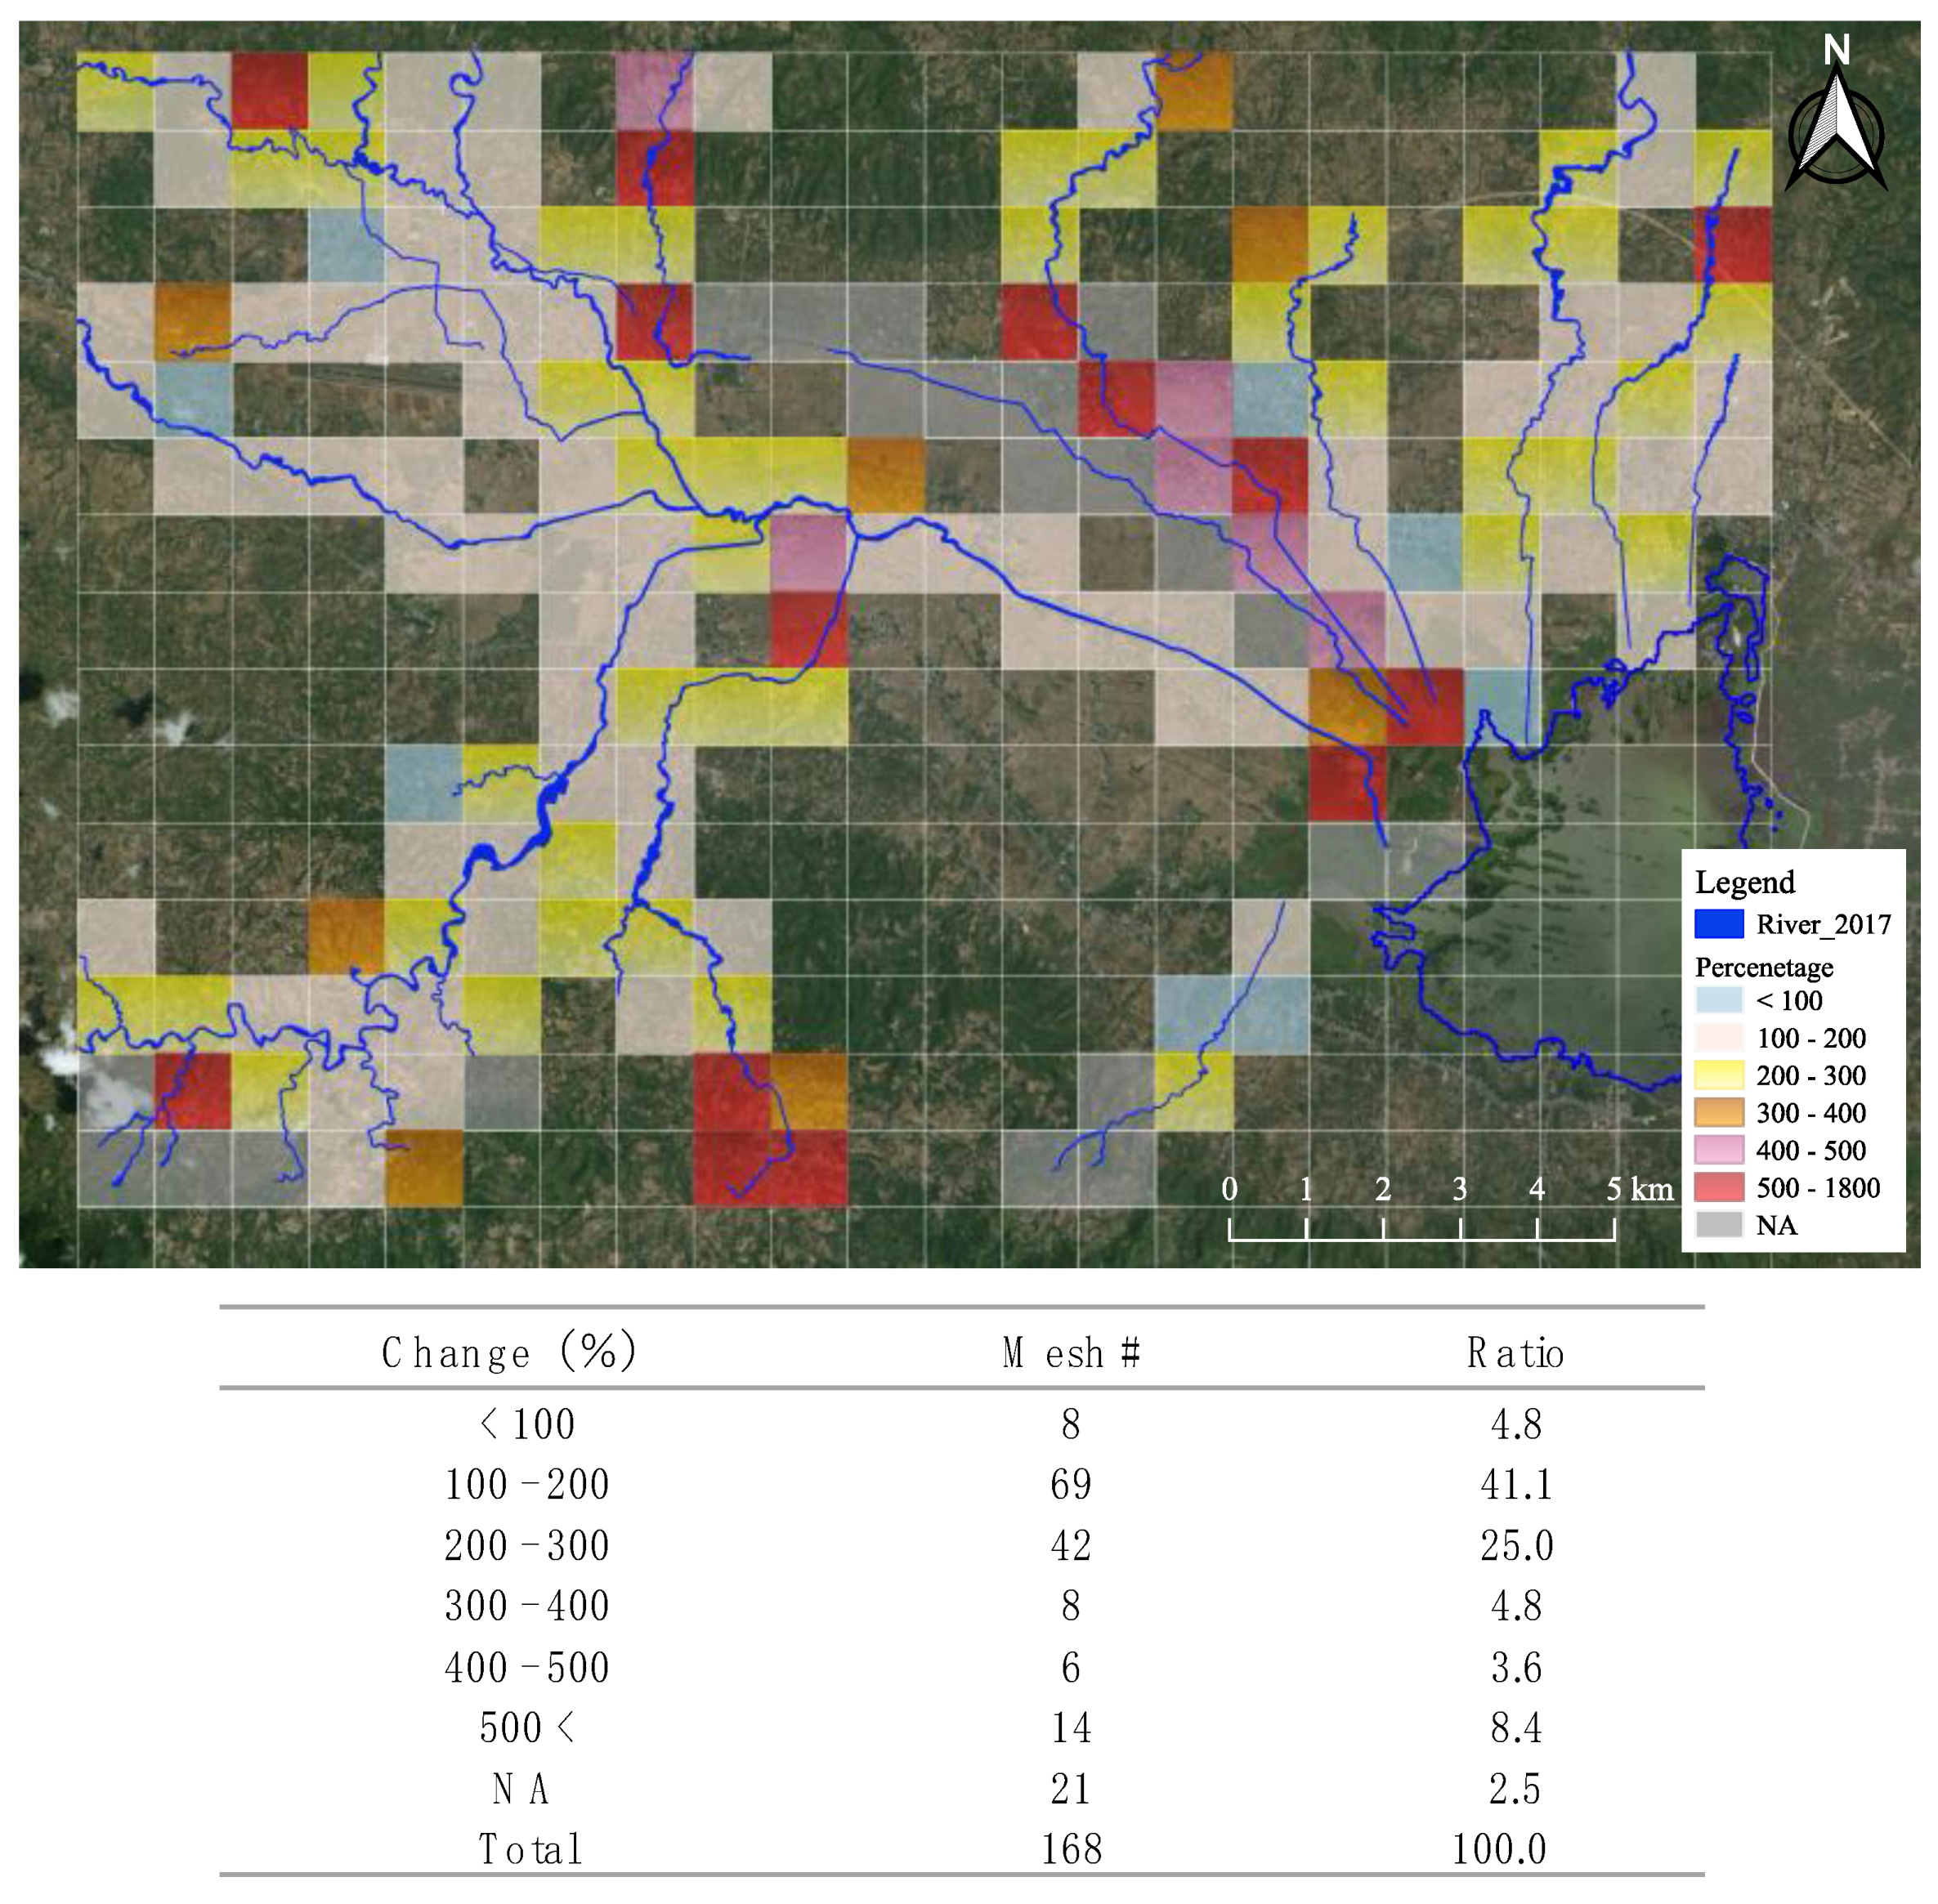
4.2. Estimation of Riverbank Erosion Volume and Its Geographical Characteristics
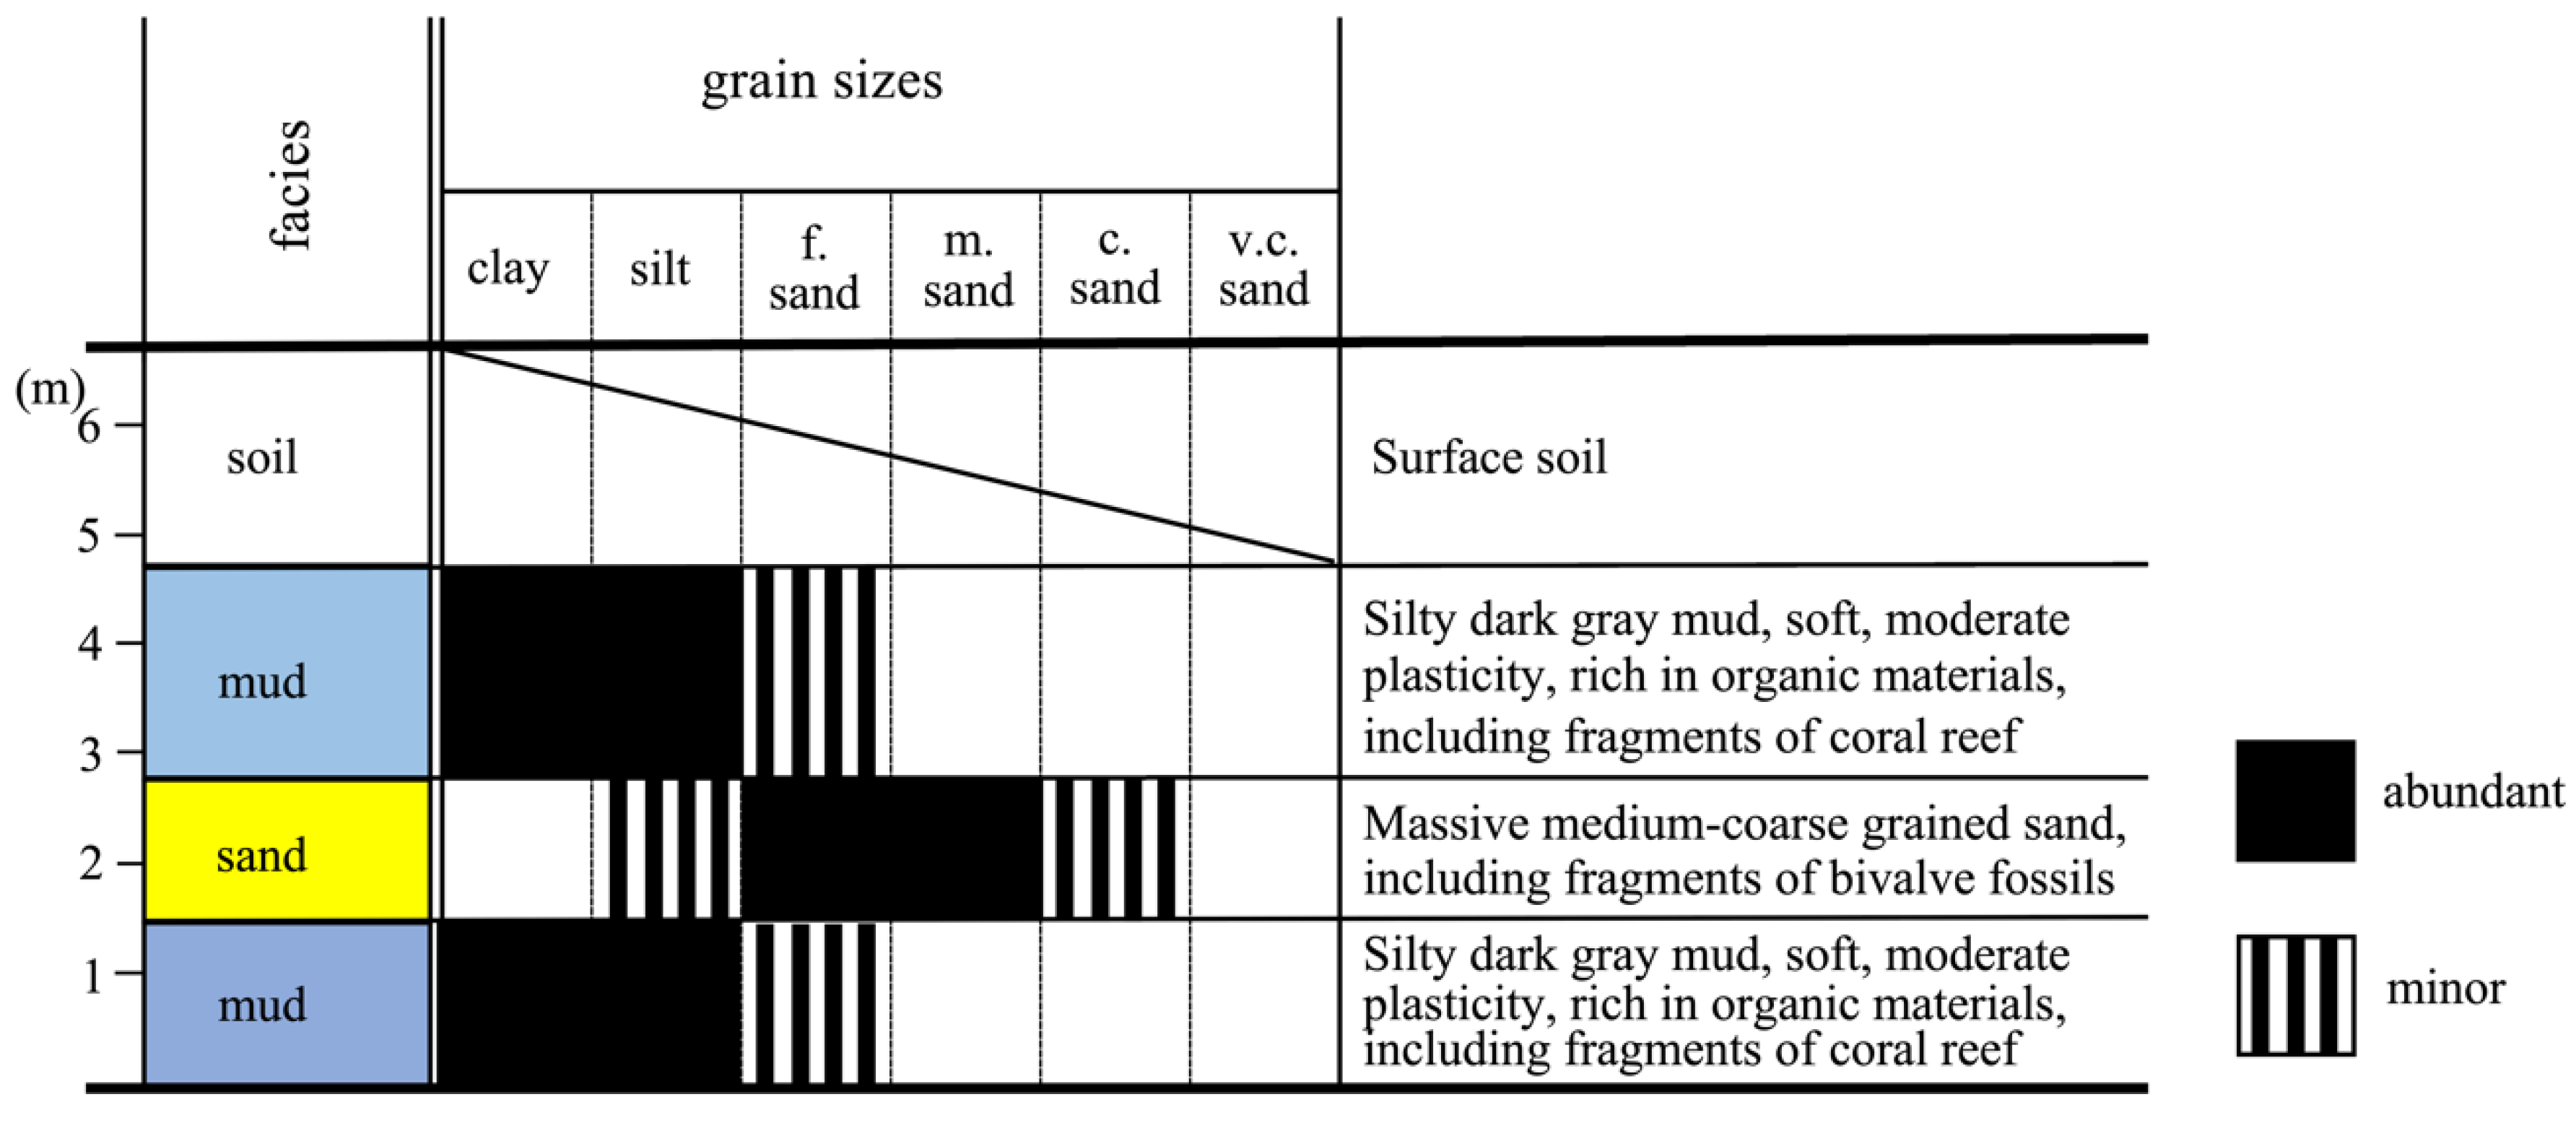
4.3. Stratigraphy and Paleoenvironment of the Grontalo Plain Area
4.4. The Mechanisms of Rapid Shrinkage of Limboto Lake
5. Conclusions
Author Contributions
Funding
Acknowledgments
Conflicts of Interest
References
- Du, Y.; Xue, H.; Wu, S.; Ling, F.; Xiao, F.; Wei, X. Lake area changes in the middle Yangtze region of China over the 20th century. J. Environ. Manag. 2011, 92, 1248–1255. [Google Scholar] [CrossRef]
- Bakoariniaina, L.N.; Kusky, T.; Raharimahefa, T. Disappearing Lake Alaotra: Monitoring catastrophic erosion, waterway silting, and land degradation hazards in Madagascar using Landsat imagery. J. Afr. Earth Sci. 2006, 44, 241–252. [Google Scholar] [CrossRef]
- Page, M.J.; Trustrum, N.A.; DeRose, R.C. A high resolution record of storm-induced erosion from lake sediments, New Zealand. J. Paleolimnol. 1994, 11, 333–348. [Google Scholar] [CrossRef]
- Ariztegui, D.; Anselmetti, F.S.; Robbiani, J.M.; Bernasconi, S.M.; Brati, E.; Gilli, A.; Lehmann, M.F. Natural and human-induced environmental change in southern Albania for the last 300 years—Constraints from the Lake Butrint sedimentary record. Glob. Planet. Chang. 2010, 71, 183–192. [Google Scholar] [CrossRef]
- United Nation Drying Lake Chad Basin Gives Rise to Crisis. Available online: https://www.un.org/africarenewal/magazine/december-2019-march-2020/drying-lake-chad-basin-gives-rise-crisis (accessed on 3 September 2020).
- Kiprutto, N.; Munyao, C.; Ngoriarita, J.; Kangogo, M.; Kiage, E. Tracing the possible root causes for fleeing flamingos in Kenya’ s Lake Nakuru National Park. J. Nat. Sci. Res. 2012, 2, 23–31. [Google Scholar]
- Japan International Cooperation Agency. The Study on Flood Control and Water Management Limboto-Bolango-Bone Basin in the Republic of Indonesia Volume-III Supporting Report: Part-A Existing Conditions; Japan International Cooperation Agency: Tokyo, Japan, 2002. [Google Scholar]
- Druce, S.C. The Lands West of the Lakes; KITLV Press: Leiden, The Netherlands, 2009; ISBN 9789004253827. [Google Scholar]
- Katili, J.A. Past Anr Present Getectonic Indonesia Position of Sulawesi, Indonesia. Tectonophysics. 1978, 45, 289–322. [Google Scholar] [CrossRef]
- Fulazzaky, M.A.; Abdul Gany, A.H. Challenges of soil erosion and sludge management for sustainable development in Indonesia. J. Environ. Manag. 2009, 90, 2387–2392. [Google Scholar] [CrossRef]
- Rostitawati, T.; Wahyuddin, N.I.; Obie, M. The poverty puddles of the cage fishing community at Limboto Lake Coast, Indonesia. J. Sustain. Dev. 2019, 12, 82. [Google Scholar] [CrossRef][Green Version]
- Walling, D.E. The impact of global change on erosion and sediment transport by rivers: Side publications series The United Nations World Water Development Report 3. U. N. World Water Assess. Program. 2009, 81, 26. [Google Scholar]
- Sharifikia, M. Environmental challenges and drought hazard assessment of Hamoun Desert Lake in Sistan region, Iran, based on the time series of satellite imagery. Nat. Hazards 2013, 65, 201–217. [Google Scholar] [CrossRef]
- Putra, S.S.; Hassan, C.; Suryatmojo, H. Reservoir saboworks solutions in Limboto Lake Sedimentations, Northern Sulawesi, Indonesia. Procedia Environ. Sci. 2013, 17, 230–239. [Google Scholar] [CrossRef]
- Aliaj, S.; Baldassarre, G.; Shkupi, D. Quaternary subsidence zones in Albania: Some case studies. Bull. Eng. Geol. Environ. 2001, 59, 313–318. [Google Scholar] [CrossRef]
- Amin, A.K.M.; Arifin, Y.I.; Akase, N. Studi fasies formasi endapan danau untuk menentukan lingkungan pengendapan danau limboto. Jambura Geosci. Rev. 2019, 1, 50–67. [Google Scholar] [CrossRef]
- Subehi, L.; Wibowo, H.; Jung, K. Characteristics of rainfall-discharge and water quality at Limboto Lake, Gorontalo, Indonesia. J. Eng. Technol. Sci. 2016, 48, 288–300. [Google Scholar] [CrossRef]
- Yunginger, R.; Bijaksana, S.; Dahrin, D.; Zulaikah, S.; Hafidz, A.; Kirana, K.H.; Sudarningsih, S.; Mariyanto, M.; Fajar, S.J. Lithogenic and anthropogenic components in surface sediments from lake limboto as shown by magnetic mineral characteristics, trace metals, and REE geochemistry. Geoscience 2018, 8, 116. [Google Scholar] [CrossRef]
- Siti Aisyah Physical and Chemical Characteristics of Sediment in Lake Tempe Using Multivariate Analysis Approach. In Proceedings of the 16th World Lake Conference, Bali, Indonesia, 7–11 November 2016; pp. 586–592.
- BPDAS-BB. Technical Planning for Land Rehabilitation and Soil Conservation for Limboto Watershed (Book 1); BPDAS-BB Gorontalo: Gorontalo, Indonesia, 2004. [Google Scholar]
- Sulawesi II River Basin Authority Sediment Management Planning of Limboto Lake Watershed, Final Report; Indonesian Ministry of Public Works: Gorontalo, Indonesia, 2009.
- Kimijima, S.; Nagai, M. Study of urbanization corresponding to socio-economic activities in Savannaket, Laos using satellite remote sensing. Malays. J. Remote Sens. GIS 2014, 3, 71–75. [Google Scholar] [CrossRef]
- Alam, A.; Bhat, M.S.; Maheen, M. Using Landsat satellite data for assessing the land use and land cover change in Kashmir valley. Geo. J. 2019. [Google Scholar] [CrossRef]
- Eraku, S.; Akase, N.; Koem, S. Analyzing Limboto lake inundation area using landsat 8 OLI imagery and rainfall data. J. Phys. Conf. Ser. 2019, 1317. [Google Scholar] [CrossRef]
- Zhu, W.; Jia, S.; Lv, A. Monitoring the fluctuation of lake Qinghai using multi-source remote sensing data. Remote Sens. 2014, 6, 10457–10482. [Google Scholar] [CrossRef]
- Dörnhöfer, K.; Oppelt, N. Remote sensing for lake research and monitoring—Recent advances. Ecol. Indic. 2016, 64, 105–122. [Google Scholar] [CrossRef]
- Villa, P.; Mousivand, A.; Bresciani, M. Aquatic vegetation indices assessment through radiative transfer modeling and linear mixture simulation. Int. J. Appl. Earth Obs. Geoinf. 2014, 30, 113–127. [Google Scholar] [CrossRef]
- Zhou, G.; Ma, Z.; Sathyendranath, S.; Platt, T.; Jiang, C.; Sun, K. Canopy reflectance modeling of aquatic vegetation for algorithm development: Global sensitivity analysis. Remote Sens. 2018, 10, 837. [Google Scholar] [CrossRef]
- Jaskuła, J.; Sojka, M. Assessing spectral indices for detecting vegetative overgrowth of reservoirs. Pol. J. Environ. Stud. 2019, 28, 4199–4211. [Google Scholar] [CrossRef]
- Szabó, L.; Deák, B.; Bíró, T.; Dyke, G.J.; Szabó, S. NDVI as a proxy for estimating sedimentation and vegetation spread in artificial lakes-monitoring of spatial and temporal changes by using satellite images overarching three decades. Remote Sens. 2020, 12, 1468. [Google Scholar] [CrossRef]
- Villa, P.; Bresciani, M.; Braga, F.; Bolpagni, R. Comparative assessment of broadband vegetation indices over aquatic vegetation. IEEE J. Sel. Top. Appl. Earth Obs. Remote Sens. 2014, 7. [Google Scholar] [CrossRef]
- Noor, S.Y. Trophic status of Limboto lake in Gorontalo Province. IOP Conf. Ser. Mater. Sci. Eng. 2019, 567. [Google Scholar] [CrossRef]
- Lamangida, T.; Akib, H.; Malago, J. Management of public assets study management of Lake Limboto Gorontalo District. IOSR J. Humanit. Soc. Sci. 2018, 23, 92–99. [Google Scholar] [CrossRef]
- Trisakti, B.; Suwargana, N.; Cahyono, J.S. Monitoring of lake ecosystem parameter using landsat data (a case study: Lake Rawa Pening). Int. J. Remote Sens. Earth Sci. 2017, 12, 71. [Google Scholar] [CrossRef][Green Version]
- BPS—Statistics Indonesia STATISTIC INDONESIA. Available online: https://www.bps.go.id/ (accessed on 3 September 2020).
- Chrismadha, T.; Haryani, M.G.S.; Fakhrudin, P.E.H. Ecohydrological application in lake management. In Proceedings of the National Symposium on Ecohydrolog, Jakarta, Indonesia, 24 March 2011; pp. 23–42. [Google Scholar]
- Hidayat, G.G.; Kakizawa, H. Development process of watershed partnership: A case study of Limboto Watershed—Gorontalo, Indonesia. Indones. J. For. Res. 2014, 1, 9–20. [Google Scholar] [CrossRef][Green Version]
- Soeprobowati, T.R. Integrated lake basin management for save Indonesian Lake movement. Procedia Environ. Sci. 2015, 23, 368–374. [Google Scholar] [CrossRef]
- Rahim, A.; Soeprobowati, T.R. Water pollution index of Batujai reservoir, Central Lombok Regency-Indonesia. J. Ecol. Eng. 2019, 20, 219–225. [Google Scholar] [CrossRef]
- Rossi Hamzah, B.M.; Fukushima, T. Long-term monitoring of lake surface area change in Indonesia from global surface water data. In Proceedings of the 17th World Lake Conference, Ibaraki, Japan, 15–19 October 2018; pp. 600–602. [Google Scholar]
- Japan Association on Remote Sensing. Remote Sensing Note; Japan Association on Remote Sensing: Tokyo, Japan, 1993. [Google Scholar]
- Kaufman, Y.J.; Tanre, D. Atmospherically resistant vegetation index (ARVI) for EOS-MODIS. IEEE Trans. Geosci. Remote Sens. 1992, 30, 261–270. [Google Scholar] [CrossRef]
- Huete, A.; Didan, K.; Miura, T.; Rodriguez, E.P.; Gao, X.; Ferreira, L.G. Overview of the radiometric and biophysical performance of the MODIS vegetation indices. Remote Sens. Environ. 2002, 83, 195–213. [Google Scholar] [CrossRef]
- Rouse, J.W.; Hass, R.H.; Schell, J.A.; Deering, D.W. Monitoring vegetation systems in the great plains with ERTS. NASA Spec. Publ. 1974, 351, 309. [Google Scholar]
- Villa, P.; Laini, A.; Bresciani, M.; Bolpagni, R. A remote sensing approach to monitor the conservation status of lacustrine Phragmites australis beds. Wetl. Ecol. Manag. 2013, 21, 399–416. [Google Scholar] [CrossRef]
- Taylor, M.P.; Stokes, R. When is a River not a River? Consideration of the legal definition of a river for geomorphologists practising in New South Wales, Australia. Aust. Geogr. 2005, 36, 183–200. [Google Scholar] [CrossRef]
- Vidal-Abarca, M.R.; Gómez, R.; Sánchez-Montoya, M.M.; Arce, M.I.; Nicolás, N.; Suárez, M.L. Defining dry rivers as the most extreme type of non-perennial fluvial ecosystems. Sustainability 2020, 12, 7202. [Google Scholar] [CrossRef]
- Badan Pusat Statistik BERITA RESMI STATISTIK. Available online: https://bps.go.id/pressrelease.html (accessed on 3 September 2020).
- Wardis, G. Food security systems in Indonesia: Challenges and implications to food security in Maluku. Occas. Pap. 2014, 12, 35–45. [Google Scholar] [CrossRef]
- Statistics Indonesia Population Growth by Province (Indonesia). Available online: https://www.neliti.com/publications/51226/population-growth-by-province (accessed on 7 September 2020).
- Statistics Indonesia Percentage of Urban Population by Province, 2010–2035 (Indonesia). Available online: https://www.neliti.com/publications/51230/percentage-of-urban-population-by-province-2010-2035 (accessed on 7 September 2020).
- Hall, R. Australia-SE Asia collision: Plate tectonics and crustal flow. Geol. Soc. Spec. Publ. 2011, 355, 75–109. [Google Scholar] [CrossRef]
- Japan International Cooperation Agency. The Study on Flood Control and Water Management in Limboto-Bolango-Bone Basin in The Republic of Indonesia Final Report Volume-1 Summary; Japan International Cooperation Agency: Tokyo, Japan, 2002. [Google Scholar]
- Pelras, C. The Bugis; Blackwell: Oxford, UK, 1996. [Google Scholar]


| Year | Landsat | Acquisition Date | Resolution | NIR (μm) | Red (μm) | Green (μm) |
|---|---|---|---|---|---|---|
| 1978 | MMS | 05/23 | 60 m | 0.70–0.80 | 0.60–0.70 | 0.50–0.60 |
| 1981 | 04/28 | |||||
| 1991 | TM | 05/26 | 30 m | 0.76–0.90 | 0.63–0.69 | 0.52–0.60 |
| 2015 | OLI | 05/28 | 30 m | 0.85–0.88 | 0.64–0.67 | 0.53–0.59 |
| 2019 | 05/07 |
| Rivers | Eroded Area (m2) | Expansion (%) | Erosion Volume (m3) | Ratio (%) |
|---|---|---|---|---|
| Talumeli | 14,144.46 | 144.8 | 24,045.58 | 0.7 |
| Bulota | 118,816.33 | 296.3 | 201,987.76 | 6.2 |
| Biyonga | 142,259.69 | 172.9 | 241,841.47 | 7.4 |
| Meluopo | 62,242.39 | 187.1 | 105,812.06 | 3.2 |
| Marisa | 173,053.06 | 287.5 | 294,190.20 | 9.0 |
| Alopohu | 160,649.31 | 187.6 | 273,103.83 | 8.3 |
| Alo | 405,719.99 | 217.4 | 689,723.98 | 21.0 |
| Reksonegoro | 109,339.43 | 157.4 | 185,877.03 | 5.7 |
| Rombongan | 385,198.07 | 178.9 | 654,836.72 | 20.0 |
| Pohu | 192,595.93 | 192.0 | 327,413.08 | 10.0 |
| Hutokiki | 22,824.39 | 254.3 | 38,801.46 | 1.2 |
| unknown | - | - | 242,820.55 | 7.4 |
| Total | 1,929,678.67 | 202.5 | 3,280,453.74 | 100.0 |
Publisher’s Note: MDPI stays neutral with regard to jurisdictional claims in published maps and institutional affiliations. |
© 2020 by the authors. Licensee MDPI, Basel, Switzerland. This article is an open access article distributed under the terms and conditions of the Creative Commons Attribution (CC BY) license (http://creativecommons.org/licenses/by/4.0/).
Share and Cite
Kimijima, S.; Sakakibara, M.; Amin, A.K.M.A.; Nagai, M.; Indriati Arifin, Y. Mechanism of the Rapid Shrinkage of Limboto Lake in Gorontalo, Indonesia. Sustainability 2020, 12, 9598. https://doi.org/10.3390/su12229598
Kimijima S, Sakakibara M, Amin AKMA, Nagai M, Indriati Arifin Y. Mechanism of the Rapid Shrinkage of Limboto Lake in Gorontalo, Indonesia. Sustainability. 2020; 12(22):9598. https://doi.org/10.3390/su12229598
Chicago/Turabian StyleKimijima, Satomi, Masayuki Sakakibara, Abd. Kadir Mubarak A Amin, Masahiko Nagai, and Yayu Indriati Arifin. 2020. "Mechanism of the Rapid Shrinkage of Limboto Lake in Gorontalo, Indonesia" Sustainability 12, no. 22: 9598. https://doi.org/10.3390/su12229598
APA StyleKimijima, S., Sakakibara, M., Amin, A. K. M. A., Nagai, M., & Indriati Arifin, Y. (2020). Mechanism of the Rapid Shrinkage of Limboto Lake in Gorontalo, Indonesia. Sustainability, 12(22), 9598. https://doi.org/10.3390/su12229598