Abstract
This paper studies a closed-loop supply chain that covers three key members: Manufacturer, new components supplier, and recycled-components supplier. Considering the power of each member in the chain, we use game theory to analyze the optimal decision and coordination, particularly investigating the economic value of components reuse strategy. The results show that, in a decentralized setting, the value of components reuse highly depends on the attributes of the products. For the products with low price elasticity, reuse strategy is only beneficial to the recycled-components suppliers. Further investigation shows the manufacturer can use wholesale price contracts to coordinate and improve the supply chain’s performance.
1. Introduction
In recent years, due to the shortening of the life-cycle of a product and the acceleration of upgrading, the consumption of products in the world has increased exponentially. With an increasingly serious resources crisis and environmental pollution, the recycling of wasted products has been widely considered. In heavy equipment, auto parts, electronic and electrical products industries, some enterprises are in the process of ‘transformation and upgrading’ the supply chain. Through the construction of reverse logistics systems, the forward supply chain will be further extended to form a closed-loop supply chain system of ‘resources—production—consumption—renewable resources’, so as to realize the recycling, reuse, and remanufacturing of products after consumption.
In general, the traditional forward supply chain combines all processes that meet customer demands and involves all possible entities, including suppliers, manufacturers, transporters, warehouses, retailers, and the customers themselves []. Compared with traditional supply chains, a closed-loop supply chain collects used-products from customers, transports returned-products using reverse logistics, and recovers added value by reusing the entire product or some of its modules, components, and parts []. It can significantly reduce the consumption of resources and the amount of final waste, which has good environmental benefits [,].
Generally, the closed-loop supply chain has opened up the circular industrial chain of products, which has a positive effect on the sustainable development of manufacturing industries. However, can the closed-loop supply chain system bring economic benefits for enterprises? Can supply chain members benefit from it? The driving force at the economic level is always the key issue concerned by enterprises, and it is also discussed in depth by academics in recent years [].
In this context, this paper uses game theory to design and analyze the closed-loop supply chain system composed of a new components supplier, a recycled-components supplier, and a manufacturer. In this study, we aim to explore the following questions: (1) How will the reuse strategy affect the decision-making behaviors of new components suppliers, recycled-components suppliers, and manufacturers? (2) Does the reuse of components have a positive economic value to the overall operation of the supply chain system? (3) If the supply chain member enterprises suffer losses due to the reuse of components, can we find a coordination mechanism to avoid the conflicts, so as to realize the economic value of the closed-loop supply chain system?
The remainder of this paper is organized as follows. Section 2 provides a literature review. Section 3 presents notations, basic assumptions, and the description of the closed-loop supply chain system. Section 4 develops the three-stage models under decentralized decision. Section 5 formulates the model under centralized decision as the benchmark. Section 6 establishes a contract coordination mechanism between member enterprises. The effect of wholesale price coordination contracts is analyzed in Section 7. Finally, Section 8 concludes this paper and proposes some research directions in the future.
2. Literature Review
This section reviews the literature under two categories: The development of closed-loop supply chain network design (CLSCND), and the game theory models used in closed-loop supply chain. We summarize the current research work and point out the research gaps and our contributions in the end.
2.1. The Development of Closed-Loop Supply Chain Network Design
Currently, there are a large number of survey and review studies focusing on closed-loop supply chains, such as Fleischmann et al. [], Rubio et al. [], Guide and Van Wassenhove [], Govindan et al. [], and Peng et al. []. In general, research on closed-loop supply chain management has involved various issues such as inventory and production planning, networks design problem, multi-objective optimization, coordination of closed-loop supply chain, and so on.
In recent years, the network design and multi-objective optimization in closed-loop supply chains have attracted more and more attention in academia []. Jayaraman et al. [] presented a mixed-integer linear programming (MILP) model to optimize the reverse flow quantities in a reverse supply chain network, which is one of the early studies in reverse logistics. As one of the pioneers in studying and defining closed-loop supply chain characteristics, Fleischmann et al. [] extended the forward logistics model into reverse logistics and incorporated the differences using the mixed-integer linear programming model (MILPM).
In the research of closed-loop supply chain network design, many scholars discussed the greenness and environmental issues. Pati et al. [] proposed a mixed-integer goal programming (MIGP) model to design a multi-objectives paper recycling network, so as to assist in proper management of the paper recycling logistics system. The model considered the objectives of reducing the reverse logistics cost; improving product quality and achieving environmental benefits. Amin and Zhang [] proposed an integrated model which has two phases and developed a multi objective mixed-integer mathematical model to design a closed-loop supply chain network configuration in the second phrase. Chen et al. [] studied the design problem of an integrated closed-loop supply chain network by considering chain costs and environmental concerns in the solar industry from the sustainability perspective. Ma et al. [] studied the network design of the closed-loop supply chain for hazardous products, and proposed a two-stage stochastic programming model (scenario-based) considering the HP-CLSCND problem with uncertain demands and returns. Govindan et al. [] developed a hybrid approach for circular supplier selection and order allocation in a multi-product circular closed-loop supply chain (C-CLSC), including fuzzy analysis network process (FANP), fuzzy decision-making trial and evaluation laboratory (FDEMATEL), and multi-objective mixed-integer linear programming (MOMILP) models. He et al. [] studied a supply chain supernetwork constrained by a stringent carbon policy of mandatory cap, and found that appropriately tuning the cap tightness and the combination of decision mode and cap-sharing scheme may Paretoly elevate the firms’ profits and particularly attain a win–win result for system profit and emission abatement. Sameul et al. [] proposed a deterministic mathematical model and its robust variant to study the effects of the quality of returns on the CLSC network under the carbon cap (CC) and carbon cap-and-trade (CCT) policies. Yu et al. [] developed a new fuzzy-stochastic multi-objective mathematical model for sustainable CLSCND to balance the trade-off between cost effectiveness and environmental performance under different types of uncertainty, and incorporated the network flexibility in the decision-making to fulfill customer demands by different means.
To date, many studies have been done on closed-loop supply chain network design. However, few have investigated the power structure of member enterprises in a closed-loop supply chain. Therefore, it’s necessary to analyze the benefits of closed-loop supply chain considering the power structure inequality.
2.2. The Game Theory Models in Closed-Loop Supply Chain
In the field of closed-loop supply chain, lots of scholars has adopted game theory to investigate the optimal pricing decisions [,,,]; cooperation and coordination of member enterprises [,,,,,]; reverse channel design [,,,,], etc. These studies focus on the downstream and reverse logistics of supply chain, and provide positive guidance for the decision optimization of ‘manufacturer—retailer’, ‘manufacturer—remanufacturer’, and ‘manufacturer-retailer-recycler/remanufacturer’ under product remanufacturing strategy.
However, for the closed-loop supply chain that takes components reuse as the main strategy, the role of upstream suppliers needs to be considered. Especially, the dual sourcing supply relationship between new components suppliers and recycled-components suppliers will cause changes in cooperation mode and power structure. Therefore, the game between supply chain enterprises needs further study. Some existing research shows that, due to the competitive pressures from products remanufacturing and components reuse, upstream suppliers are faced with the decline in components sales. The weaker supplier will inevitably suffer losses due to a lack of voice. Additionally, the dominant supplier will recoup the losses of sales decline by considerably raising the price of components, which, however, is at the expense of total system profit []. In further research, Xiong et al. [] indicate that, in the game between manufacturer and supplier, in order to cope with the impact of the decline in components sales, the supplier’s strategic response is either to be forced to lower component price to deal with the threat, or to raise the price to compensate for the loss of sales. However, no matter what kind of strategy is at the cost of the supplier’s benefit, especially the latter will lead to a lose–lose situation between the manufacturer and the supplier.
In the implementation of components reuse strategy, product manufacturers rely on the original components suppliers while posing a threat to them due to using recycled-components at the same time. The inherent conflict and contradiction require enterprises to carefully examine the role of upstream components suppliers when managing and operating the closed-loop supply chain system.
2.3. Research Gaps and Contributions
In summary, several studies have investigated the network design problem of closed-loop supply chains and analyzed the effect of suppliers, but they only consider the game between new components suppliers and manufacturers, and do not include recycled-components suppliers in the decision [,]. Additionally, some other research only analyzes the decision behaviors of recycled-components suppliers and product manufacturers while placing new components suppliers in a subordinate position, which ignores the influence of new components suppliers []. However, from a practical point of view, the components reuse strategy usually involves product manufacturers, new components suppliers, and recycled-components suppliers. It is necessary to carry out further research on the game among the three parties. When product manufacturers are highly dependent on key components suppliers, upstream suppliers tend to have a stronger power. In addition, remanufacturing is still at the initial stage, which results in the weakest power of recycled-components suppliers in the whole supply chain. Therefore, from the perspective of the three parties, the strength of channel power will inevitably influence their decision behaviors.
Our contributions lie in two points: (1) We consider the dual sourcing supply relationship between the new-components supplier and the recycled-components supplier and build a three-stage game model based on the power structure of the three decision-makers. (2) We design a coordination mechanism between supply chain enterprises under a decentralized decision. The results show that the manufacturer can use wholesale price contracts to coordinate and improve the supply chain’s performance.
3. Description of the Close-Loop Supply Chain System and Assumptions
3.1. Notations
: The unit sales price of products;
: The market demand of products;
: The reuse rate of components;
The price elasticity of products;
: The maximum market demand for new products;
: The unit production cost of products;
: The unit production cost of new components;
: The unit production cost of recycled-components;
: The unit wholesale price of new components;
: The unit wholesale price of recycled-components;
: The profit of supply chain member enterprise ;
refers to the manufacturer, represents the new components supplier, and indicates the recycled-components supplier.
3.2. Description and Assumptions
This paper focuses on the optimal decisions of a closed-loop supply chain with components reuse. The system consists of a new components supplier, a recycled-components supplier, and a manufacturer. As shown in Figure 1, the components needed by the manufacturer can be purchased from a new components supplier or recycled-components supplier. That is, there exists a dual sourcing supply relationship between the new components supplier and the recycled-components supplier. The structure of the closed-loop supply chain and the game orders of decision-makers are presented in Figure 1. Other main assumptions are as follows.
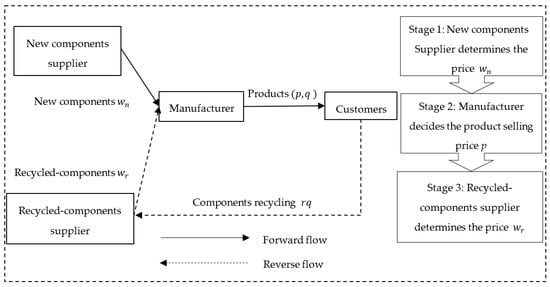
Figure 1.
The closed-loop supply chain with components reuse and the game orders of decision-makers.
Assumption 1:
The recycled-components supplier recycles used products from the market, and then restores the used-components to ‘like-new’ condition through the process of disassembling, testing, and reprocessing, which provides the same quality and function as the new ones. The unit production cost of recycled-components is denoted as. Based on the economic premise of components reuse, we assume the unit production cost of recycled-components is lower than that of new components, which is. Hereinafter, we useto describe the cost saving of recycled-components compared with the new ones, which is.
Assumption 2:
The power of member enterprises in the supply chain is not equal. The new components supplier gains high dependence of the manufacturer for its unique technology, so it has a relatively strong power. The recycled-components supplier is in the early age of business and lacks strength to obtain voice, which leads to its lowest power in the supply chain. According to the different powers of decision-makers, the decision order is divided into three stages: (1) The new components supplier determines the wholesale price of new components; (2) the manufacturer determines the products price; and (3) the recycled-components supplier determines the wholesale price of recycled-components.
Assumption 3:
The market demand function is. We assume that each product contains one key component. The reuse rate of components is. Therefore, among the products produced by the manufacturer,of components come from the recycled-components supplier, andof components are provided by the new components supplier.
4. Three-Stage Game Models Under Decentralized Decision
4.1. Decision Model
The profit function of the manufacturer is:
The profit function of the new components supplier is:
The profit function of the recycled-components supplier is:
According to Assumption 2, due to the unequal power status of member enterprises, the decision consists of three stages: (1) The new components supplier determines the wholesale price of new components ; (2) the manufacturer sets the products sales price ; and (3) the recycled-components supplier determines the wholesale price of recycled-components . According to game theory, the solving process is as follows. First, taking the derivative of Equation (3) to , we can get the first-order condition of the recycled-components supplier’s profit function. Here, referring to the method of Yi. [], we assume the manufacturer’s profit of unit product using recycled-components is . Then, substitute and the demand function into Equation (3). Let = 0, and we get:
Substitute Equation (4) and the demand function into Equation (1). Let = 0, and then the first-order condition of the manufacturer’s profit function can be derived:
Take Equation (5) into Equation (2) and let = 0. We can obtain the optimal wholesale price of new-components as follows.
Proposition 1:
In the closed-loop supply chain with components reuse, with the increase of components reuse rate, the new components supplier will adopt the pricing strategy of raising the wholesale price of new components.
Proof:
According to assumption 3, the demand function is . The sales price of products is greater than the cost in production process, which is . Therefore, is valid and is proved. □
Substitute into Equation (5), we get the optimal sales price of the manufacturer:
Next, take into the demand function , the optimal sales volume of products can be acquired.
Proposition 2:
When the cost saving from recycled-components, with the increase of components reuse rate, the product price increases, while the sales volume decreases; otherwise the opposite.
Proof.
When , and . According to the cost saving of recycled-components , we can get the following conditions: When , and ; when , and . Proposition 2 is proved. □
Proposition 2 indicates that when the cost saving of recycled-components is less than the threshold, components reuse will cause the rising of product price, which further leads to the decline of sales volume. Only when the cost saving is greater than the threshold, components reuse is beneficial to reduce the price of products and promote the increase of sales volume.
Substitute into Equation (4), we can obtain the optimal wholesale price of recycled-components.
Proposition 3:
When the cost saving, with the increase of components reuse rate, the wholesale price of recycled-components decreases. Otherwise, the wholesale price will increase as components reuse rate increases.
Proof.
When , that is , is valid; when , is valid. □
Take , , , and into Equations (1)–(3), the profits of manufacturer, new components supplier, and recycled-components supplier are as follows.
The total profit of the supply chain system can be obtained.
Proposition 4:
In the closed-loop supply chain with components reuse, the profit of the recycled-components supplier always increases with the increase of components reuse rate, and the profits of the new components supplier and the manufacturer display monotonicity under certain conditions. Specifically, when the cost saving, the profits of the new components supplier and manufacturer increase with the increase of components reuse rate; otherwise, the profits decrease as the components reuse rate increases.
Proof.
Let , we can get , and . Take the derivative of the recycled-components supplier’s profit function to , we can obtain . Based on assumption 1 and assumption 3, , the reuse rate of components satisfy , the market demand and , thus is valid. Therefore, is true, and is proved. □
For the profits of the manufacturer and new components supplier, take the derivative with respect to , and we can get and . Take into and , the monotonicity condition is obtained. That is, when , and are valid; otherwise, , .
Conclusion 1:
In the closed-loop supply chain with components reuse, the new components supplier will adopt the strategy of raising wholesale price to deal with the competitive impact of the recycled-components supplier. When the cost saving from recycled-components is lower than a threshold, the manufacturer will be forced to raise the sale price of products due to the increase of wholesale price of new components, which leads to the decline in sales volume. However, when the cost saving is greater than the threshold, the components reuse strategy is beneficial to the member enterprises in the supply chain, which can create a multi-win situation.
4.2. Numerical Analysis
In this section, numerical examples are used to further analyze the influence of product price elasticity and the cost saving of recycled-components on the profitability of the closed-loop supply chain. The basic parameters are fixed as follows: The market size ; the unit production cost of new components ; the unit production cost of products ; the reuse rate of components ; the product price elasticity . The profits of member enterprises and the supply chain system are shown in Figure 2.
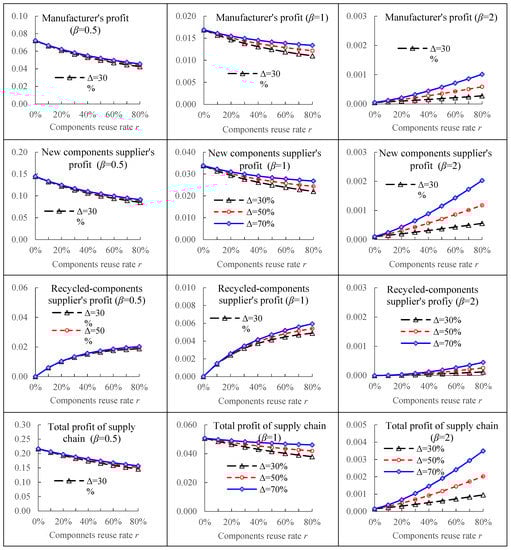
Figure 2.
Profits of member enterprises and the total system in the closed-loop supply chain with components reuse.
In numerical analysis, we find the attributes of products have a significant influence on the implementation of components reuse strategy. For the products with low price elasticity (cases β = 0.5 and β = 1, as shown in Figure 2), only the recycled-components supplier can benefit from components reuse, while the manufacturer and the new components supplier suffer losses in profits. It can be predicted that for such products, the reuse of components will be resisted by both manufacturers and new components suppliers. However, for the products with high price elasticity (case β = 2, as shown in Figure 2), components reuse has an obvious economic value, which is reflected as follows: The total profit of the supply chain is improved, and the profit of each member enterprise also increases with the increase of components reuse rate. Apparently, for such products, the reuse of components can create extra benefit for the whole supply chain and individual member enterprises, which is helpful to form a multi-win situation. The reason is that the demand of products with high price elasticity is greatly affected by the price, and the cost saving advantage of components reuse enables the manufacturer to decrease the product sales price and then stimulate the growth of sales volume. The member enterprises and the whole supply chain can benefit from the expanded market sales.
In addition, as for the influence of the cost saving of recycled-components , for the products with high price elasticity (case β = 2, as shown in Figure 2), the more the cost saving is, the greater the profits of member enterprises and total supply chain will be. Additionally, with the increase of components reuse rate, the economic benefit of cost saving becomes more obvious. In general, if the price elasticity of products is high, then the components reuse strategy is valuable, which can not only achieve the goal of environmental protection, but also promote the profit growth of all parties in the supply chain.
Conclusion 2:
Under decentralized decision, the strategic value of components reuse is highly influenced by the attributes of products. For the products with low price elasticity, components reuse will lead to the decline in the profits of manufacturers and new components suppliers. Even if there exists significant cost saving in components reuse, it is still difficult to reverse the adverse situation that the performance of the whole supply chain becomes worse. However, for the products with high price elasticity, the whole supply chain and member enterprises can benefit from components reuse, and the way of multi-win value creation can be embodied in such products.
5. The Model under Centralized Decision
Under decentralized decision, for the products with low price elasticity, components reuse strategy will cause the decline of supply chain profit. Given this situation, we further investigate the value of components reuse strategy under centralized decision.
Under centralized decision, the member enterprises are regarded as a whole, and the profit function of the supply chain is:
Substitute into Equation (14) and let . We can obtain the optimal price.
With , we get the optimal sales volume of products.
Take Equations (15) and (16) into Equation (14), and the maximum profit under centralized decision can be obtained.
Proposition 5:
The profit of the supply chain system under centralized decision is always higher than that under decentralized decision. Under centralized decision, the overall profit of the supply chain will increase with the increase of components reuse rate, which indicates that the components reuse strategy can give full play to the economic potential of value creation under centralized decision.
Proof.
The difference value of the supply chain profit under two kinds of decision is . Take the derivative of the system’s profit under centralized decision with respect to , we can get . According to assumptions, , the reuse rate of components , the demand and , thus is valid. Therefore, is true and Proposition 5 is proven. □
Proposition 6:
Letrepresent the efficiency of the supply chain system under decentralized decision, thenandare valid. It indicates that under decentralized decision, the system efficiency decreases with the increase of components reuse rate. That is, the higher the components rate, the more serious the efficiency loss caused by decentralized decision.
Compared with the centralized decision, decentralized decision leads to the efficiency loss of the supply chain system, and with the increase of components reuse rate, the efficiency loss is more significant.
6. Contract Coordination Mechanism
In this section, we take the centralized decision as a benchmark, and design a coordination mechanism between supply chain enterprises under decentralized decision. There are three principles to be followed in the coordination: After coordination, (1) the performance of the whole supply chain system under decentralized decision is improved, which is closer to or reaches the overall profit of the supply chain under centralized decision; (2) the profits of member enterprises are not lower than the profits before the coordination; (3) the profits of member enterprises are not lower than their individual profits of ‘no consideration for components reuse’. Principles (1) and (2) aim to solve the efficiency loss under decentralized decision, and Principle (3) emphasizes that the designed coordination mechanism can not only overcome the disadvantages under decentralized decision, but also make the components reuse strategy beneficial to all parties, at least without damaging their previous benefits.
We assume the manufacturer is responsible for the supply chain coordination, as he can decide whether to adopt components reuse strategy or not. The essence of coordination is to achieve the maximum profit of the system and meanwhile benefit all members in the chain [,]. Here, we let , and denote the profit of the manufacturer, the new components supplier, and the recycled-components supplier, respectively. Then the following conditions should be satisfied:
In Equations (18)–(20), , represent the product price and sales volume after the coordination; , denote the wholesale price of new components and recycled-components. Equation (18) indicates that the manufacturer’s profit after coordination should satisfy , where and are the manufacturer’s profits under decentralized decision (expressed by Equation (10)). represents the profit when the manufacturer adopts components reuse strategy, while is the profit when the reuse strategy is not considered. The study in Section 3 shows that, for the products with high price elasticity, the higher the components reuse rate is, the greater the manufacturer’s profit will be. However, for the products with low price elasticity, the profit of the manufacturer is maximum when (i.e., no consideration for components reuse). Therefore, the condition is to ensure that after coordination, the manufacturer’s profit is not lower than the profit under decentralized decision or the profit when the reuse strategy is not adopted.
Equation (19) represents that with coordination, the profit of the new components supplier should meet , where and are the new components supplier’s profits under decentralized decision (expressed by Equation (11)). Similar to Equation (18), is to ensure that after coordination, the new components supplier’s profit is not lower than the profit under decentralized decision or the profit when the reuse strategy is not adopted.
Equation (20) indicates that with coordination, the profit of the recycled-components supplier should meet . is the maximum profit of the recycled-components supplier under decentralized decision, which is described by Equation (12). Compared with the manufacturer and the new components supplier, the reuse strategy is always beneficial to the recycled--components supplier. Specifically, the higher the components reuse rate is, the greater the recycled-components supplier’s profit will be. Thus, as long as is satisfied, the purpose of the coordination for the recycled-components supplier can be achieved.
Construction of the coordination mechanism is as follows. the manufacturer sells products at the optimal price under centralized decision (i.e., ), and the sales volume is . The overall profit of the supply chain reaches the profit (i.e., the profit under centralized decision). Here we assume that after the coordination, the proportion of the manufacturer, the new components supplier, and the recycled-components supplier sharing in the profit of the whole supply chain is , , and (, respectively. Then we have:
Substitute , and in Equations (15)–(17) into the above equations, we can derive the wholesale price of new components and recycled-components under the coordination mechanism:
For the new components supplier, in order to obtain the profit , the optimal wholesale price after coordination is , which is described in Equation (21). For the recycled-components supplier, to obtain the profit , the optimal wholesale price after coordination is , which is expressed in Equation (21).
After determining the pricing strategy in the coordination mechanism, the next question is how to determine the coefficient of profit sharing , and . As the coordinator of components reuse, the manufacturer needs to determine and on the basis of ensuring his own profit. The principles are described in Equations (18)–(20), which can be described as follows:
Take , , and in Equations (10)–(12) and in Equation (17) into the above equations, we can acquire the conditions of coefficient, which are shown in Table 1.

Table 1.
Profit sharing conditions for products with different attributes.
According to Table 1, we have the following findings: (1) Let the lower limit of the profit sharing coefficient of recycled-components supplier be , then is valid. It indicates that the higher the components reuse rate, the greater the profit-sharing coefficient of recycled-components supplier. (2) For the new components supplier, the profit-sharing coefficient should be set according to the attributes of the products. For the products with low price elasticity, the manufacturer has to provide more than 50% of the profit proportion to the new components supplier to compensate for the loss caused by components reuse. For the products with high price elasticity, the manufacturer can lower the sharing coefficient of the new components supplier according to the components reuse condition. When , the sharing coefficient . (3) As the coordinator, the manufacturer determines the profit-sharing proportion of the new components supplier and the recycled-components supplier, which can not exceed a specific value. For the products with low price elasticity, the proportion cannot be greater than 75%; for the products with high price elasticity, the proportion cannot exceed . Otherwise, the manufacturer will suffer losses in his own profit.
Next, we still need to determine the idiographic form of the contracts. According to Equations (21) and (22), the wholesale price contracts can be adopted. Specifically, as the coordinator, the manufacturer needs to sign a contract with the new components supplier with the wholesale price , and a contract with the recycled-components supplier with the wholesale price . Due to the unequal power status of member enterprises, the bargaining power of the new components supplier and the recycled-components supplier is different. According to Assumption 2, the new components supplier gains high dependence on the manufacturer for its unique technology while the recycled-components supplier is in the early age of business and lacks strength to obtain voice. Therefore, in the coordination contracts provided by the manufacturer, more space should be reserved for the negotiation with the new components supplier on the basis of not eroding the profit of the recycled-components supplier. In other words, in the coordination contracts, the profit-sharing coefficient for the recycled-components supplier is . The profit sharing coefficient for the new components supplier is (for the products with high price elasticity); (for the products with low price elasticity). Take the profit-sharing coefficient into Equations (21) and (22), and we can obtain the wholesale price contracts, which is shown in Table 2.
Table 2.
The wholesale price contracts of products with different attributes.
As shown in Table 2, for the products with high price elasticity, coordination between manufacturer and new components supplier can be achieved if the wholesale price is within the range of . For the products with low price elasticity, coordination between the manufacturer and new components supplier can be achieved if the wholesale price is within the range of . As for the recycled-components supplier, the manufacturer has more power in the price. The agreed wholesale price is reasonable.
Proposition 7:
When adopting components reuse strategy, the manufacturer can achieve coordinate benefits by wholesale price contracts. For the recycled-components supplier, the wholesale price should be agreed as. For the new components supplier, the attributes of the products need to be considered., the wholesale price range isfor the products with high price elasticity; and the wholesale price range isfor the products with low price elasticity.
7. Analysis on the Effect of Wholesale Price Coordination Contracts
In order to illustrate the effectiveness and feasibility of the coordination contracts, numerical examples are performed to compare the optimal pricing, the profits of members, and the supply chain system under centralized decision, decentralized decision, as well as coordination mechanism. We also take the supply chain decision without considering components reuse as a benchmark and demonstrate the significance of the coordination contracts.
Here, is the system profit under decentralized decision; is the system profit under centralized decision. The parameters are the same as Section 3.2. As for the price elasticity of products, and represent the products with high and low price elasticity, respectively. Here we proposed three kinds of contracts. As shown in Table 2, for the products with high price elasticity, the coordination contracts are , , and . For the products with low price elasticity, the coordination contracts are , , and . The results are shown in Table 3 and Table 4.
Table 3.
The effect of the coordination contracts when .
Table 4.
The effect of the coordination contracts when
From Table 3 and Table 4, we can see that the supply chain profit under decentralized decision is always lower than the profit under centralized decision, which is reflected as high product sales price, low sales volume, and serious efficiency loss. Moreover, we also have the following findings.
Firstly, three kinds of wholesale price contracts can realize the improvement of decentralized decision, enable the supply chain profit to reach the level of centralized decision, and guarantee the profit of each member enterprise. Specifically, the coordination mechanism enables the new components supplier and the recycled-components supplier to reduce wholesale price, so that the manufacturer can sell products at a relatively lower price. Thus, the sales volume increases significantly and all members of the supply chain benefit from the expanded market share.
Secondly, the coordination mechanism can not only solve the efficiency loss of decentralized decision, but also enhance the feasibility of components reuse strategy. As shown in Table 3 and Table 4, the coordination mechanism enables the new components supplier, the recycled-components supplier, and the manufacturers to obtain higher profits than ‘without components reuse’. That is to say, the coordination contracts enable all members of the supply chain to share the economic value of components reuse strategy.
Thirdly, as the coordinator, the manufacturer may obtain multiple growths of profit through coordination. Take Table 4 as an example, if the manufacturer can make a contract with the new components supplier at the price , then when , the manufacturer’s profit is 0.134, which increases by 135.09% than the profit before coordination 0.057 (the profit under decentralized decision), and increases by 86.11% compared with the profit without components reuse 0.072. Obviously, the coordination enables that the manufacturer has a strong motivation to coordinate each member to implement components reuse strategy.
Conclusion 3:
The wholesale price contracts can realize the improvement of the supply chain system, guarantee the profit of each member enterprise, as well as enable the whole system’s performance to reach the optimal level of centralized decision. In addition, the coordination mechanism can also give full play to the economic value of components reuse, ensure it is a green strategy good for all members, and create significant profit space for the coordinator.
8. Conclusions
Components reuse is of great significance to the resource strategy. This paper studies a closed-loop supply chain that covers three key members: A manufacturer, a new components supplier, and a recycled-components supplier. We consider the power difference among parties and explore the economic value of components reuse strategy.
The results show that, under decentralized decision, the value of components reuse is highly dependent on the attributes of products. For the products with low price elasticity, components reuse will lead to the decline of the profits of manufacturers and new components suppliers. Thus, the strategy will be resisted by both manufacturers and new components suppliers. However, for the products with high price elasticity, reuse strategy is helpful to each member. The manufacturers, new components suppliers, and recycled-components suppliers can get extra benefits from components reuse. The reason is that the lower price of recycled-components enables the manufacturers to reduce the sales price of products, which stimulate the significant growth of sales volume, and the expanded market sales can compensate for the negative impact of competition conflicts. Thus, the implementation of components reuse strategy is easier to succeed for such products. (i.e., auto parts, large mechanism equipment, medical equipment). For example, due to the cost advantage, in the United States, where the remanufacturing industry is relatively advanced, the sales volume of remanufactured components exceeds 50% [].
However, compared with the centralized decision, the decentralized decision will cause the efficiency loss of the supply chain system. In order to avoid the efficiency loss, it is necessary to coordinate the profits of member enterprises in the supply chain to improve the whole system’s performance and create more profit space for the participants. This study shows that, when the manufacturer is responsible for the coordination, he can use wholesale price contracts to improve the whole system’s performance. In the process, the manufacturer needs to solve the profit sharing. Considering that the recycled-components suppliers are in a weak position at the current stage, the manufacturers only need to ensure that the coordination contracts will not damage the profit of recycled-components suppliers. More profit space lies in the distribution between manufacturers and new components suppliers.
On the whole, the coordination mechanism plays an important role on the economic value of components reuse, which ensures the strategy is good to all members in the supply chain and creates significant profit space for the coordinator.
In the current research, we only focused on the closed-loop supply chain system consisting of a manufacturer, a new components supplier, and a recycled-components supplier. We assume the products demand and the quantity of recycled products are deterministic, without considering the influence of uncertainty. However, the proper treatment of uncertainties is extremely important for a reverse logistics system that features significant uncertainties on both quantity and quality of the returned components, and this will affect the power change among different players under a highly dynamic environment and may require a cooperative contract and inventory buffer. Therefore, we can consider the uncertainty of product demand and quantity of recycled products and add the uncertain factors to the model to do further research. In addition, the different forms and effects of recycling channels are not considered in this paper while the participants may involve retailers and third-party recyclers, which leads to certain limitations in the conclusion. Further, we can take other participants in the closed-loop supply chain into account and construct a game model with multiple participants to analyze the decision-making of different members.
Author Contributions
Conceptualization, X.Z.; methodology, X.Z.; validation, T.L.; writing—original draft preparation, X.B.; writing—review and editing, Z.F. and T.L. All authors have read and agreed to the published version of the manuscript.
Funding
The research is supported by MOE (Ministry of Education in China) Project of Humanities and Social Sciences (14YJCZH221).
Conflicts of Interest
The authors declare no conflict of interest.
References
- Govindan, K.; Mina, H.; Esmaeili, A.; Gholami-Zanjani, S.M. An integrated hybrid approach for circular supplier selection and closed loop supply chain network design under uncertainty. J. Clean. Prod. 2020, 242, 118317. [Google Scholar] [CrossRef]
- Guide, V.D.R.; Van Wassenhove, L.N. OR FORUM-The evolution of closed-loop supply chain research. Oper. Res. 2009, 57, 10–18. [Google Scholar] [CrossRef]
- Gupta, S.; Palsule-Desai, O.D. Sustainable supply chain management: Review and research opportunities. IIMB Manag. Rev. 2011, 23, 234–245. [Google Scholar] [CrossRef]
- Peng, H.; Shen, N.; Liao, H.; Xue, H.; Wang, Q. Uncertainty factors, methods, and solutions of closed-loop supply chain—A review for current situation and future prospects. J. Clean. Prod. 2020, 254. [Google Scholar] [CrossRef]
- Schenkel, M.; Caniëls, M.C.J.; Krikke, H.; Van Der Laan, E. Understanding value creation in closed loop supply chains-Past findings and future directions. J. Manuf. Syst. 2015, 37, 729–745. [Google Scholar] [CrossRef]
- Fleischmann, M.; Bloemhof-Ruwaard, J.M.; Dekker, R.; Van der Laan, E.; Van, J.A.; Van Wassenhove, L.N. Quantitative models for reverse logistics: A review. Eur. J. Oper. Res. 1997, 103, 1–17. [Google Scholar] [CrossRef]
- Rubio, S.; Chamorro, A.; Miranda, F.J. Characteristics of the research on reverse logistics (1995–2005). Int. J. Prod. Res. 2008, 46, 1099–1120. [Google Scholar] [CrossRef]
- Govindan, K.; Soleimani, H.; Kannan, D. Reverse logistics and closed-loop supply chain: A comprehensive review to explore the future. Eur. J. Oper. Res. 2015, 240, 603–626. [Google Scholar] [CrossRef]
- Jayaraman, V.; Guide, V.D.R., Jr.; Srivastava, R. A closed-loop logistics model for remanufacturing. J. Oper. Res. Soc. 1999, 50, 497–508. [Google Scholar] [CrossRef]
- Fleischmann, M.; Beullens, P.; Bloemhof-Ruwaard, J.M.; Wassenhove, L.N. The impact of product recovery on logistics network design. Prod. Oper. Manag. 2001, 10, 156–173. [Google Scholar] [CrossRef]
- Pati, R.K.; Vrat, P.; Kumar, P. A goal programming model for paper recycling system. Omega 2008, 36, 405–417. [Google Scholar] [CrossRef]
- Amin, S.H.; Zhang, G. An integrated model for closed-loop supply chain configuration and supplier selection: Multi-objective approach. Expert Syst. Appl. 2012, 39, 6782–6791. [Google Scholar] [CrossRef]
- Chen, Y.W.; Wang, L.C.; Wang, A.; Chen, T.L. A particle swarm approach for optimizing a multi-stage closed loop supply chain for the solar cell industry. Robot. Comput. Integr. Manuf. 2017, 43, 111–123. [Google Scholar] [CrossRef]
- Ma, H.; Li, X. Closed-loop supply chain network design for hazardous products with uncertain demands and returns. Appl. Soft. Comput. 2018, 68, 889–899. [Google Scholar] [CrossRef]
- He, L.; Mao, J.; Hu, C.; Xiao, Z. Carbon emission regulation and operations in the supply chain supernetwork under stringent carbon policy. J. Clean. Prod. 2019, 238, 117652. [Google Scholar] [CrossRef]
- Samuel, C.N.; Venkatadri, U.; Diallo, C.; Khatab, A. Robust closed-loop supply chain design with presorting, return quality and carbon emission considerations. J. Clean. Prod. 2020, 247, 119086. [Google Scholar] [CrossRef]
- Yu, H.; Solvang, W.D. A fuzzy-stochastic multi-objective model for sustainable planning of a closed-loop supply chain considering mixed uncertainty and network flexibility. J. Clean. Prod. 2020, 266, 121702. [Google Scholar] [CrossRef]
- Huang, M.; Song, M.; Lee, L.H.; Ching, W.K. Analysis for strategy of close-loop supply chain with dual recycling channel. Int. J. Prod. Econ. 2013, 144, 510–520. [Google Scholar] [CrossRef]
- Wei, J.; Zhao, J. Pricing and remanufacturing decisions in two competing supply chains. Int. J. Prod. Res. 2015, 53, 258–278. [Google Scholar] [CrossRef]
- Zhao, J.; Wang, C.; Xu, L. Decision for pricing, service, and recycling of closed-loop supply chains considering different remanufacturing roles and technology authorizations. Comput. Ind. Eng. 2019, 132, 59–73. [Google Scholar] [CrossRef]
- Gao, J.; Teng, J.; Hou, L.; Liu, X. Pricing strategy of closed-loop supply chain considering competition under uncertain demand. J. Syst. Eng. 2017, 32, 78–88. (In Chinese) [Google Scholar]
- Chen, J.M.; Chang, C.I. The co-opetitive strategy of a closed-loop supply chain with remanufacturing. Transp. Res. Part E 2012, 48, 387–400. [Google Scholar] [CrossRef]
- Zhang, H.; Gan, X.; Lai, M. Coordination of closed-loop supply chain with the optimal price and recycle effort incentive contract. J. Syst. Eng. 2015, 30, 201–209. (In Chinese) [Google Scholar]
- Panda, S.; Modak, N.M.; Cardenas-Barron, L.E. Coordinating a socially responsible closed-loop supply chain with product recycling. Int. J. Prod. Econ. 2017, 188, 11–21. [Google Scholar] [CrossRef]
- Yang, R.; Tang, W.; Dai, R.; Zhang, J. Contract design in reverse recycling supply chain with waste cooking oil under asymmetric cost information. J. Clean. Prod. 2018, 201, 61–77. [Google Scholar] [CrossRef]
- Hosseini-Motlagh, S.M.; Ebrahimi, S.; Zirakpourdehkordi, R. Coordination of dual-function acquisition price and corporate social responsibility in a sustainable closed-loop supply chain. J. Clean. Prod. 2020, 251, 119629. [Google Scholar] [CrossRef]
- Li, X.; Zhu, Q. Contract Design for Enhancing Green Food Material Production Effort with Asymmetric Supply Cost Information. Sustainability 2020, 12, 2119. [Google Scholar] [CrossRef]
- Hong, I.-H.; Yeh, J.-S. Modeling closed-loop supply chains in the electronics industry: A retailer collection application. Transp. Res. Part E 2012, 48, 817–829. [Google Scholar] [CrossRef]
- Atasu, A.; Toktay, L.B.; Van Wassenhove, L.N. How Collection Cost Structure Drives Manufacturer’s Reverse Channel Choice. Prod. Oper. Manag. 2013, 22, 1089–1102. [Google Scholar] [CrossRef]
- Feng, L.; Govindan, K.; Li, C. Strategic planning: Design and coordination for dual-recycling channel reverse supply chain considering consumer behavior. Eur. J. Oper. Res. 2017, 260, 601–612. [Google Scholar] [CrossRef]
- Gong, Y.; Chen, M.; Zhuang, Y. Decision-Making and Performance Analysis of Closed-Loop Supply Chain under Different Recycling Modes and Channel Power Structures. Sustainability 2019, 11, 6413. [Google Scholar] [CrossRef]
- Yi, Y.; Liang, J. Hybrid recycling modes for closed-loop supply chain under premium and penalty mechanism. Comput. Integr. Manuf. Syst. 2014, 20, 215–223. (In Chinese) [Google Scholar]
- Zhao, X.; Lin, Y.; Su, C. Performance analysis of S-M closed-loop supply chain under different channel power structures. Chin. J. Manag. Sci. 2012, 20, 78–86. (In Chinese) [Google Scholar]
- Xiong, Y.; Zhou, Y.; Li, G.; Chan, H.-K.; Xiong, Z. Don’t forget your supplier when remanufacturing. Eur. J. Oper. Res. 2013, 230, 15–25. [Google Scholar] [CrossRef]
- He, Y. Acquisition pricing and remanufacturing decisions in a closed-loop supply chain. Int. J. Prod. Econ. 2015, 163, 48–60. [Google Scholar] [CrossRef]
- Yi, Y. Closed-loop supply chain game models with product remanufacturing in a duopoly retailer channel. J. Manag. Sci. China 2009, 12, 45–54. (In Chinese) [Google Scholar]
- Cachon, G.P.; Lariviere, M.A. Supply chain coordination with revenue-sharing contracts: Strengths and limitations. Manag. Sci. 2005, 51, 30–44. [Google Scholar] [CrossRef]
- Govindan, K.; Popiuc, M.N.; Diabat, A. Overview of coordination contracts within forward and reverse supply chains. J. Clean. Prod. 2013, 47, 319–334. [Google Scholar] [CrossRef]
- Institute of Internet Industry. 2018 White Paper on Intelligent Remanufacturing Industry; Tsinghua University: Beijing, China, 2018. [Google Scholar]
Publisher’s Note: MDPI stays neutral with regard to jurisdictional claims in published maps and institutional affiliations. |
© 2020 by the authors. Licensee MDPI, Basel, Switzerland. This article is an open access article distributed under the terms and conditions of the Creative Commons Attribution (CC BY) license (http://creativecommons.org/licenses/by/4.0/).