Abstract
This research analyses the relation between building and housing attributes and energy consumption and CO2 emissions, considering the spatial dependence present on the Spanish residential market and the different climatic areas. The paper uses a hedonic model with spatial correlation. To measure the spatial dependence, we have combined the Lag Model and the Error Model. The data has been obtained from three different sources and merged in a complex geolocated database, for the provinces of Castellón and Valencia. The results of both regressions indicate that there is a spatial dependence in the sample and a relation between some building attributes and energy consumption and CO2 emissions. The regressions show the existence of low consumption and low emission clusters in the metropolitan area of Valencia and Castellón. Moreover, the endogenous variables indicate that characteristics such as the age, the size, the typology of the house building or dwelling, the use of the surface, or the climatic area have an effect in the energy consumption and the CO2 emissions of the houses in Castellón and Valencia.
1. Introduction
Household energy consumption has grown in recent decades due to changes in society. Currently, the buildings and construction sector consumed around 36% of the final energy produced in 2018, and accounted for 39% of the CO2 emissions [1].
There are several reasons why the energy consumption of homes is relevant. Firstly, because it is an expense for families, materialized through electricity and gas bills. This fact is related to the problem of energy poverty [2]. In addition to this, it is a factor that contributes to global warming since the use of polluting energy sources based on coal or other fossil fuels increases emissions [3]. Finally, it affects house prices. Energy consumption can be considered an additional characteristic of the house to be considered in purchasing or renting decisions [4,5,6,7]. For these reasons, it is necessary to know the energy consumption of homes and the factors that have an impact on it.
Energy consumption is a complex variable that depends on multiple factors. While it is possible to have a real measurement of energy consumption using meters, monitors, and appropriate software, establishing what causes this consumption is complex. In some cases, there is no real measurement of energy consumption, so it is necessary to estimate it with the factors from which it derives. The consumption of energy depends largely on the physical characteristics of the property and variables such as climate and location [5,8]. Although these variables have the greatest influence on energy consumption levels, there are other types that could contribute to a more precise estimation, such as those related to the household and their lifestyle [5,8]. This information is difficult to obtain, so most estimations of energy consumption are made from known physical variables. This is the case of the Energy Certification applied in Spain. The energy certificates make an estimation, measuring the CO2 emissions and energy consumption for each use (heating, cooling, DHW production, and lighting). In addition to this, it considers whether the consumption comes from renewable or non-renewable sources and values the insulation of the thermal envelope, the type of building, the climate zone, and space use.
Some authors, such as [5] or [9] among others, affirm that energy certificates are valid instruments to know the energy consumption of a house since the data approximate the real consumption obtained from direct measurement. Thus, most studies and research about energy savings in housing use energy certificates or eco-labels as a source of information [10].
The purpose of this study is to find out how the physical attributes of the dwelling and the building influence the energy consumption and the emissions of them. For this purpose, a semilogarithmic hedonic regression controlled by spatial autocorrelation is applied. In the analysis, the characteristics of the building are used as independent variables, which explain the environment of the dwelling and their attributes, and the contextual characteristics, which identify the location, the climate, etc. The article is divided into five parts: part I is dedicated to the Introduction; part II to the review of the bibliography on housing characteristics, energy consumption, and emissions; part III to an explanation of the methodology and data; part IV to the presentation of the results of the model; and, finally, part V to the conclusion and reflection of the results.
2. Literature: Characteristics of the Dwelling, Energy Consumption, and Emissions
Energy consumption is a variable that depends on multiple factors, so it is complex to establish which characteristics cause it, and which of them are more relevant [11]. However, it can be approximated by using the characteristics that make up the dwelling (or building) and the household. These characteristics can be divided into four groups: supply, demand, contextual, and behavior [8].
Supply characteristics are those related to housing attributes and construction quality [9,10,12]. The literature usually classifies these characteristics into two sub-groups: those referring to the quality of construction, which would include energy insulation, efficiency system, and construction materials, and those regarding the physical attributes of the building, which includes the type of dwelling and size, among others [8].
In the group of physical attributes, size, age, equipment, and type of dwelling stand out. Size is one of the most representative variables in energy consumption, observing that when it increases, energy consumption does too [8,13,14]. This factor can be measured by area (m2 and ft2), height, or number of rooms [14] (p. 914). However, the use of the number of rooms as an approximation of the size of the dwelling can be confusing, since some authors also consider it a socio-economic factor that measures or approximates the size of the household [13,15] (p. 111). These authors consider that larger households require more space and, therefore, choose larger dwellings [15] (p. 111). Another relevant feature is the age. Antiquity is a factor with a confusing effect. Although older buildings have higher energy consumption, authors such as [14] (p. 926) noted that a new building has higher consumption due to their greater equipment. However, articles such as [16] (p. 113) concluded that new buildings are more efficient than older ones. In addition to these factors, the type of dwelling is also a relevant variable in the measurement of the level of energy spending [8,9]. Houses can be classified as mobile, single-family, semi-detached, apartments in buildings with two or four units, and apartments in buildings with five or more units, although the most common classification is between single-family and multi-family houses, with single-family houses consuming the most energy [13,17]. This is because this type of housing is often associated with larger sizes [17] and has higher energy needs for heating and air conditioning [13].
The sub-group of quality of construction characteristics includes variables capturing quality (construction materials and methods), thermal insulation, and community facilities. Construction quality includes construction materials, since they have a high potential for reducing emissions and energy consumption because of technological advances [18]. Improvements in construction processes, along with an increase in the quality of the products used, would help reduce energy consumption, as well as improve the value of the building and homes on the market [4,5,19]. In addition to this characteristic, the literature also considers in its analysis the number and type of installations, and whether these are centralized for the building or whether each dwelling presents an individual system. Installations can be added at the time of construction or once the construction is complete. Among the systems that are added at the end of the construction are: hot water systems or boilers, lighting, and sometimes heating and air conditioning. From this list, boilers and heating are the systems that consume the most energy [8]. In both cases, the most recommended measures to reduce energy consumption are to replace the boiler with a more efficient one and opt for photovoltaic solar energy as a source [10,20]. Another feature of special relevance to energy consumption is thermal insulation, which has great energy-saving potential [10,21,22,23]. Thermal insulation can be improved with changes in the air chambers of the walls or insulating the attic in the houses that have it. Studies show that poor thermal insulation is often associated with higher energy consumption and lower comfort in the home [24].
The contextual characteristics concern those factors that are given by the environment and location of the dwelling [8], such as climate and temperature [14] and the energy market [25]. In the case of global temperature, its increase has caused homes, especially new homes, to boost their energy consumption because of a greater thermal response [14]. The local climate is also a determining attribute for accurately measuring energy consumption, since the energy consumption of the dwelling will vary depending on whether the dwelling is located in a temperate, tropical, arid, cold, or continental zone [7,8,17]. Thus, homes located in areas with the coldest days have higher consumption because heating is energy intensive [8,17]. Another relevant factor in the literature is location, which is analyzed using variables related to neighborhood, the housing market, region, and proximity to work, distance from the city center, or distance from a public transport stop [15]. The effect on the energy consumption of the location is confusing. Studies show that homes located on the outskirts of cities have higher energy consumption, while those located in the center of cities have lower energy consumption [15]. This may be because the location variable is linked to other characteristics of the dwelling, such as size. In this way, single-family houses tend to be larger. Meanwhile, in the center of cities, dwellings are usually apartments in small multi-family buildings [15].
The international evidence also includes socioeconomic characteristics that describe the household, its members and their behavior [8,26,27]. Socio-economic variables include household size and composition [9,28,29,30], age [31], income level [32,33,34,35], type of tenure [10,15], level of education [36], length of stay [15], race, and gender [8,15].
From the methodological perspective, the evidence in the real estate sector relative to the contribution of the exogenous variables to the endogenous variables suggest that there are other factors to be considered. This is the case of the spatial dependence between houses. Several studies indicate that there is a relationship between spatial effects and the emergence of real estate sub-markets within the housing market [37,38,39]. Real estate is a substitute for each other, so an increase in the price of one of the houses causes an increase in the demand for others. In this way, [37] indicated that those goods that present similar characteristics can be substitutes and, in equilibrium, their prices are equal. If this assumption is transferred to the real estate market, it is observed that, within different real estate sub-markets, household prices are similar because each of these clusters contains close substitutes. Following this argument, the characteristics of the dwellings are similar in each cluster for the same reasons.
Autocorrelation or spatial dependence refers to the existence of covariances in errors in hedonic price estimation for residential markets. Given the price similarities of the characteristics of dwellings in a sub-market, errors are more likely to be correlated within the same sub-market than between different sub-markets [38]. For this reason, controlling for clusters in the analysis of hedonic equations can reduce the estimation of errors [38].
When hedonic equations are controlled by clusters, it is assumed that either you have a set of predefined sub-markets or they are going to be defined by some method. An option for predefined clusters is the use of already defined geographical areas, either by real estate agents or by valuers. In the case that they must be determined, the sub-markets can be defined by the characteristics of the dwellings, the neighborhoods, or by the census units, by means of the analysis of clusters or the main components, among others [38].
There is not much empirical evidence on the determination of submarkets using energy consumption or emissions as a homogeneous characteristic. Previous publications include the study of Blázquez et al. [40], who indicated that residential energy consumption in Spain is spatially correlated, and the study of Bottero et al. [41], which analyzed the effect of energy efficiency on residential prices in Turin (Italy), considering spatial effects.
3. Materials and Methods
Considering previous literature, CO2 emissions are a function of energy consumption and the technology used [42]. Thus, energy efficiency would help to lower the level of emissions, reducing energy consumption [33,43]. Hence, the function can be represented as follows:
where Ec is the energy consumption and tE is the type of energy used.
CO2 = Ec − tE
Energy consumption (Eq) depends on the multiple physical, socioeconomic, and contextual characteristics that make up the dwelling and the household, as well as the behavioral factor. This being a non-linear relationship, it is represented by the following function:
where ө is the estimated parameter of the explanatory capacity of each characteristic, Hphys is the vector of physical characteristics, So represents the socioeconomic characteristics, Ci represents the contextual characteristics, and Be represents the behavioral factor.
Ec = ө0 + ө 1 − [Hphys] + ө 2-[So] + ө 3 − [Ci] + ө 4 − [Be] + ε
The analysis tool used is a non-linear semilogarithmic hedonic regression for both emissions and energy consumption. This tool is used since the literature has shown that the regression of equations allows for the analysis of which factors influence energy consumption in relation to the use of the dwelling [44]. For the regression, the physical characteristics of the dwelling, the building, its elements, and contextual characteristics that appear in Table 1 are used.

Table 1.
Summary variables and sources.
Thus, the model to be applied in the analysis would be the following:
• For emissions:
Log_CO2 it = α + βit [Xit] + ε
• For energy consumption:
where Xit is a matrix of the characteristics of the dwelling, the building, and the elements.
Log_Ec it = α + βit [Xit] + ε
To introduce the spatial autocorrelation in a hedonic regression, the model applied is a combination of the Lag Model and the Error Model. In this case, the model analyses if the regression presents both substantive (Lag) and residual (Error) dependence. The equation will be as follows:
where y is a vector Nx1; ρwy is the autoregressive structure in the endogenous variable to explain the spatial lag; wy is the matrix of lags of the dependent variable; X is the matrix of the exogenous variables; ρ is the autoregressive spatial parameter; wε is the matrix of spatial lags in the error term; and λ is the autoregressive coefficient and μ is the normal distribution N(0, σ2I).
y = ρw_y + Xβ + ε
ε = λw_ε + μ
The model adopted in this paper was a spatially weighted model of Least Squares in 2 Stages (2SWLS). This is a hedonic based model which uses the physical and contextual variables of buildings and dwellings. The model interpretates the effect of the building attributes in the energy consumption and the CO2 emissions, considering the different climatic areas and the presence of spatial dependence in the housing markets (Equation (8) and (9)).
where ρWlnConsum and ρWlnEmisio is the autoregressive structure in the endogenous variable to explain the spatial lag; and are the matrix of lags of the dependent variable; is the autoregressive spatial parameter; is the matrix of the exogenous variables (Table 2 and Table 3 show the independent variables used in the analysis); refers to the regressive parameters; is the matrix of spatial lags in the error term; λ is the autoregressive coefficient; and is the normal distribution N(0, σ2I).

Table 2.
Descriptive statistics of Castellón.

Table 3.
Descriptive statistics of Valencia.
Data
The data used have been extracted from the Valencian Community Energy Certification database, managed by the Institut Valencià de Competitivitat Empresarial (the energy certificates are the source of data used in this paper; they are compiled and published by the Institut Valencià de Competitivitat Empresarial (IVACE, https://gcee.ave.es), which is a public regional institution of the Valencian Community that is in charge of the databases and information of the regional industry), and from the Cadaster database (a public national institution that is in charge of all the cadastral information, with the exception of the Basque Country and Navarra). Information related to energy consumption and emissions has been extracted from the first database, in addition to some characteristics of the dwelling, such as age. From the Cadaster database, one can obtain the physical characteristics of the dwelling, the building, and the elements, as well as information of the climatic zones (Table 1).
Heterogeneity is a key issue related to building and their construction features, which is why we have obtained a detailed definition of each building from the Cadaster database in order to identify the type of building (to control for surface exposure), size, number of units in the building, as well as the type of house. We are conscious that construction features are critical for energy consumption and emissions, but there is no more detailed information on, for instance, the walls’ energy transfer or any other technical detail. However, the homogeneity of the construction technique in the analyzed cities and the controls used in the econometric models give us the confidence that the results can be trusted.
To build the database for this analysis, the technique followed is the one proposed by [45]. It is a database that merges two micro-databases. Firstly, the municipal data have been merged to create the cadastral database. Cadaster provides information about all buildings and properties, organized by municipalities. Thus, the data for all populations have been downloaded, distinguishing between rustic and urban properties. During this process, two documents were obtained with all the cadastral information of the provinces of Valencia and Castellón, identifying each observation through its cadastral reference.
The second step was to merge the cadastral database with the available information on energy certification. The energy certificates do not identify the property of the house, since the Organic Law of Protection of Personal Data and Guarantee of Digital Rights prevents it. However, each registry is linked to a cadastral reference, so both databases can be merged by matching the cadastral references. During this step, the size of the sample has been reduced, since the majority of dwellings or buildings do not have an energy certificate due to the fact that, in Spain, energy certificates only become obligatory when: (a) it is a new construction, (b) the existing building/dwelling is going to be sold or rented, or (c) it is a public building with a space frequently visited greater than 250 m2.
Although the initial sample had 715,020 observations for Castellón and 2,279,161 for Valencia, after referring the energy certification database, the final sample was reduced to 7291 observations for the province of Castellón and 27,542 for Valencia, with a total of 34,833 observations.
The final database was cleaned up using four steps. First, those variables that could not be analyzed or had no relevance in the analysis (such as province and town codes, direction, etc.), were deleted. Second, variables with no missing values were selected to have the most complete information available in the sample. Third, it was observed whether there was a correlation between the selected variables. In cases where there was a correlation between some of the characteristics, one of them was selected to avoid distorting the effect on the dependent variables. In addition to this, we have eliminated those observations in which the surface area of the house was less than 25 m2, and those that were land. In these cases, the associated energy consumption is a work consumption, so it can distort the result. Thus, the database analyzed has 27 variables, including energy consumption, CO2 emissions, and a set of variables for the building and the dwelling.
4. Results
The descriptive statistics of the province of Castellón (Table 2) show that the average emission level is 43.31 kg CO2/m2 per year, and the average energy consumption is 172.77 kWh/m2 per year. Regarding the variables that describe the building and the environment of the dwelling, it was observed that the average age of the dwellings was 26.31 years, the average number of dwellings that make up a building was 64.16 units, and that, on average, 73% of the surface area of the buildings was destined for residential use, 2% was destined for commercial use, and 1.7% for other.
In addition to this, statistics show that 64.9% of the sample are closed-block multi-family dwellings (CLOSE BLOCK) and 22.4% are open-block multi-family dwellings (OPEN BLOCK), compared to 12.5% for single-family dwellings (SINGLE FAMILY). On the other hand, the characteristics of the dwelling indicate that the average surface area of the dwellings is 89.77 m2 and that the number of elements making up the dwelling is on average 1.18 units, disregarding annexes and garages. Regarding climatic zones, 96.1% of the observations can be said to be found in climatic zone B3, located on the Mediterranean coast. The remaining observations are distributed as follows: 0.6% in climate zone C1, 2.9% in C2, 0.3% in D1, and 0.1% in E1.
In the case of Valencia (Table 3), descriptive statistics show that the average emission level is 40.35 kg CO2/m2 per year, and the average energy consumption is 162.17 kWh/m2 per year. Regarding the variables that describe the building and the environment of the dwelling, it is observed that the average age of the dwellings is 34.14 years, the average number of dwellings that make up a building is 48.6 units and that, on average, 76.2% of the surface area of the buildings is destined for residential use, 3.2% is destined for commercial use, and less than 1% of the surface area is destined for other uses.
In addition to this, statistics show that 68.7% of the sample are closed-block multi-family dwellings (CLOSE BLOCK), 19.3% are open-block multi-family dwellings (OPEN BLOCK), and 11.8% are single-family dwellings (SINGLE FAMILY). On the other hand, the characteristics of the dwelling indicate that the average surface area of the dwellings is 95.5 m2 and that the number of elements making up the dwelling is on average 1.16 units. As far as climatic zones are concerned, 97% of the observations are found in climatic zone B3, while the rest are distributed in indoor climatic zones as follows: 0.2% in climatic zone C1, 2.3% in C2, 0.3%, and 0.5% in D1. In the province of Valencia, there is no climatic zone E1.
In this way, the results of both provinces would indicate that on average the buildings in Castellón are newer (by approximately eight years) and with a greater number of dwellings per building (approximately 18 units more) than those in Valencia. As far as the uses of the surface of the buildings are concerned, they are similar in both provinces, with most of the surface destined for residential use and, to a lesser extent, for commercial use. The same occurs with the number of elements that make up the dwelling, being close to 1 in both provinces; that is, in most cases, the dwelling is only element of each analysed property (without storage rooms, garages, and other annexes). In both provinces, closed-block multi-family dwellings predominate, followed by open-block multi-family dwellings, as opposed to single-family dwellings. Regarding the average size of the dwelling, in Valencia it is slightly larger than Castellón (by approximately 6 m2). This contradicts the results of the 2011 Census, elaborated by the Instituto Nacional de Estadística (INE). This may be due to several reasons: (a) because the INE does not take into account secondary-use dwellings (as the certificates are fromsales or rentals, it is very likely that these observations are, in many cases, secondary-use dwellings); (b) because in the case of Castellón they are dwellings located on the coast, whereas in Valencia they are located mainly in the metropolis and its surroundings; (c) because of the difference in the number of observations between the two provinces (27,542 in Valencia, as opposed to 7291 in Castellón). Besides, if the climatic zones are observed, in both provinces, most of the samples are from climatic zone B3. In addition to these data, descriptive statistics show that the levels of energy consumption and average emissions are higher in Castellón.
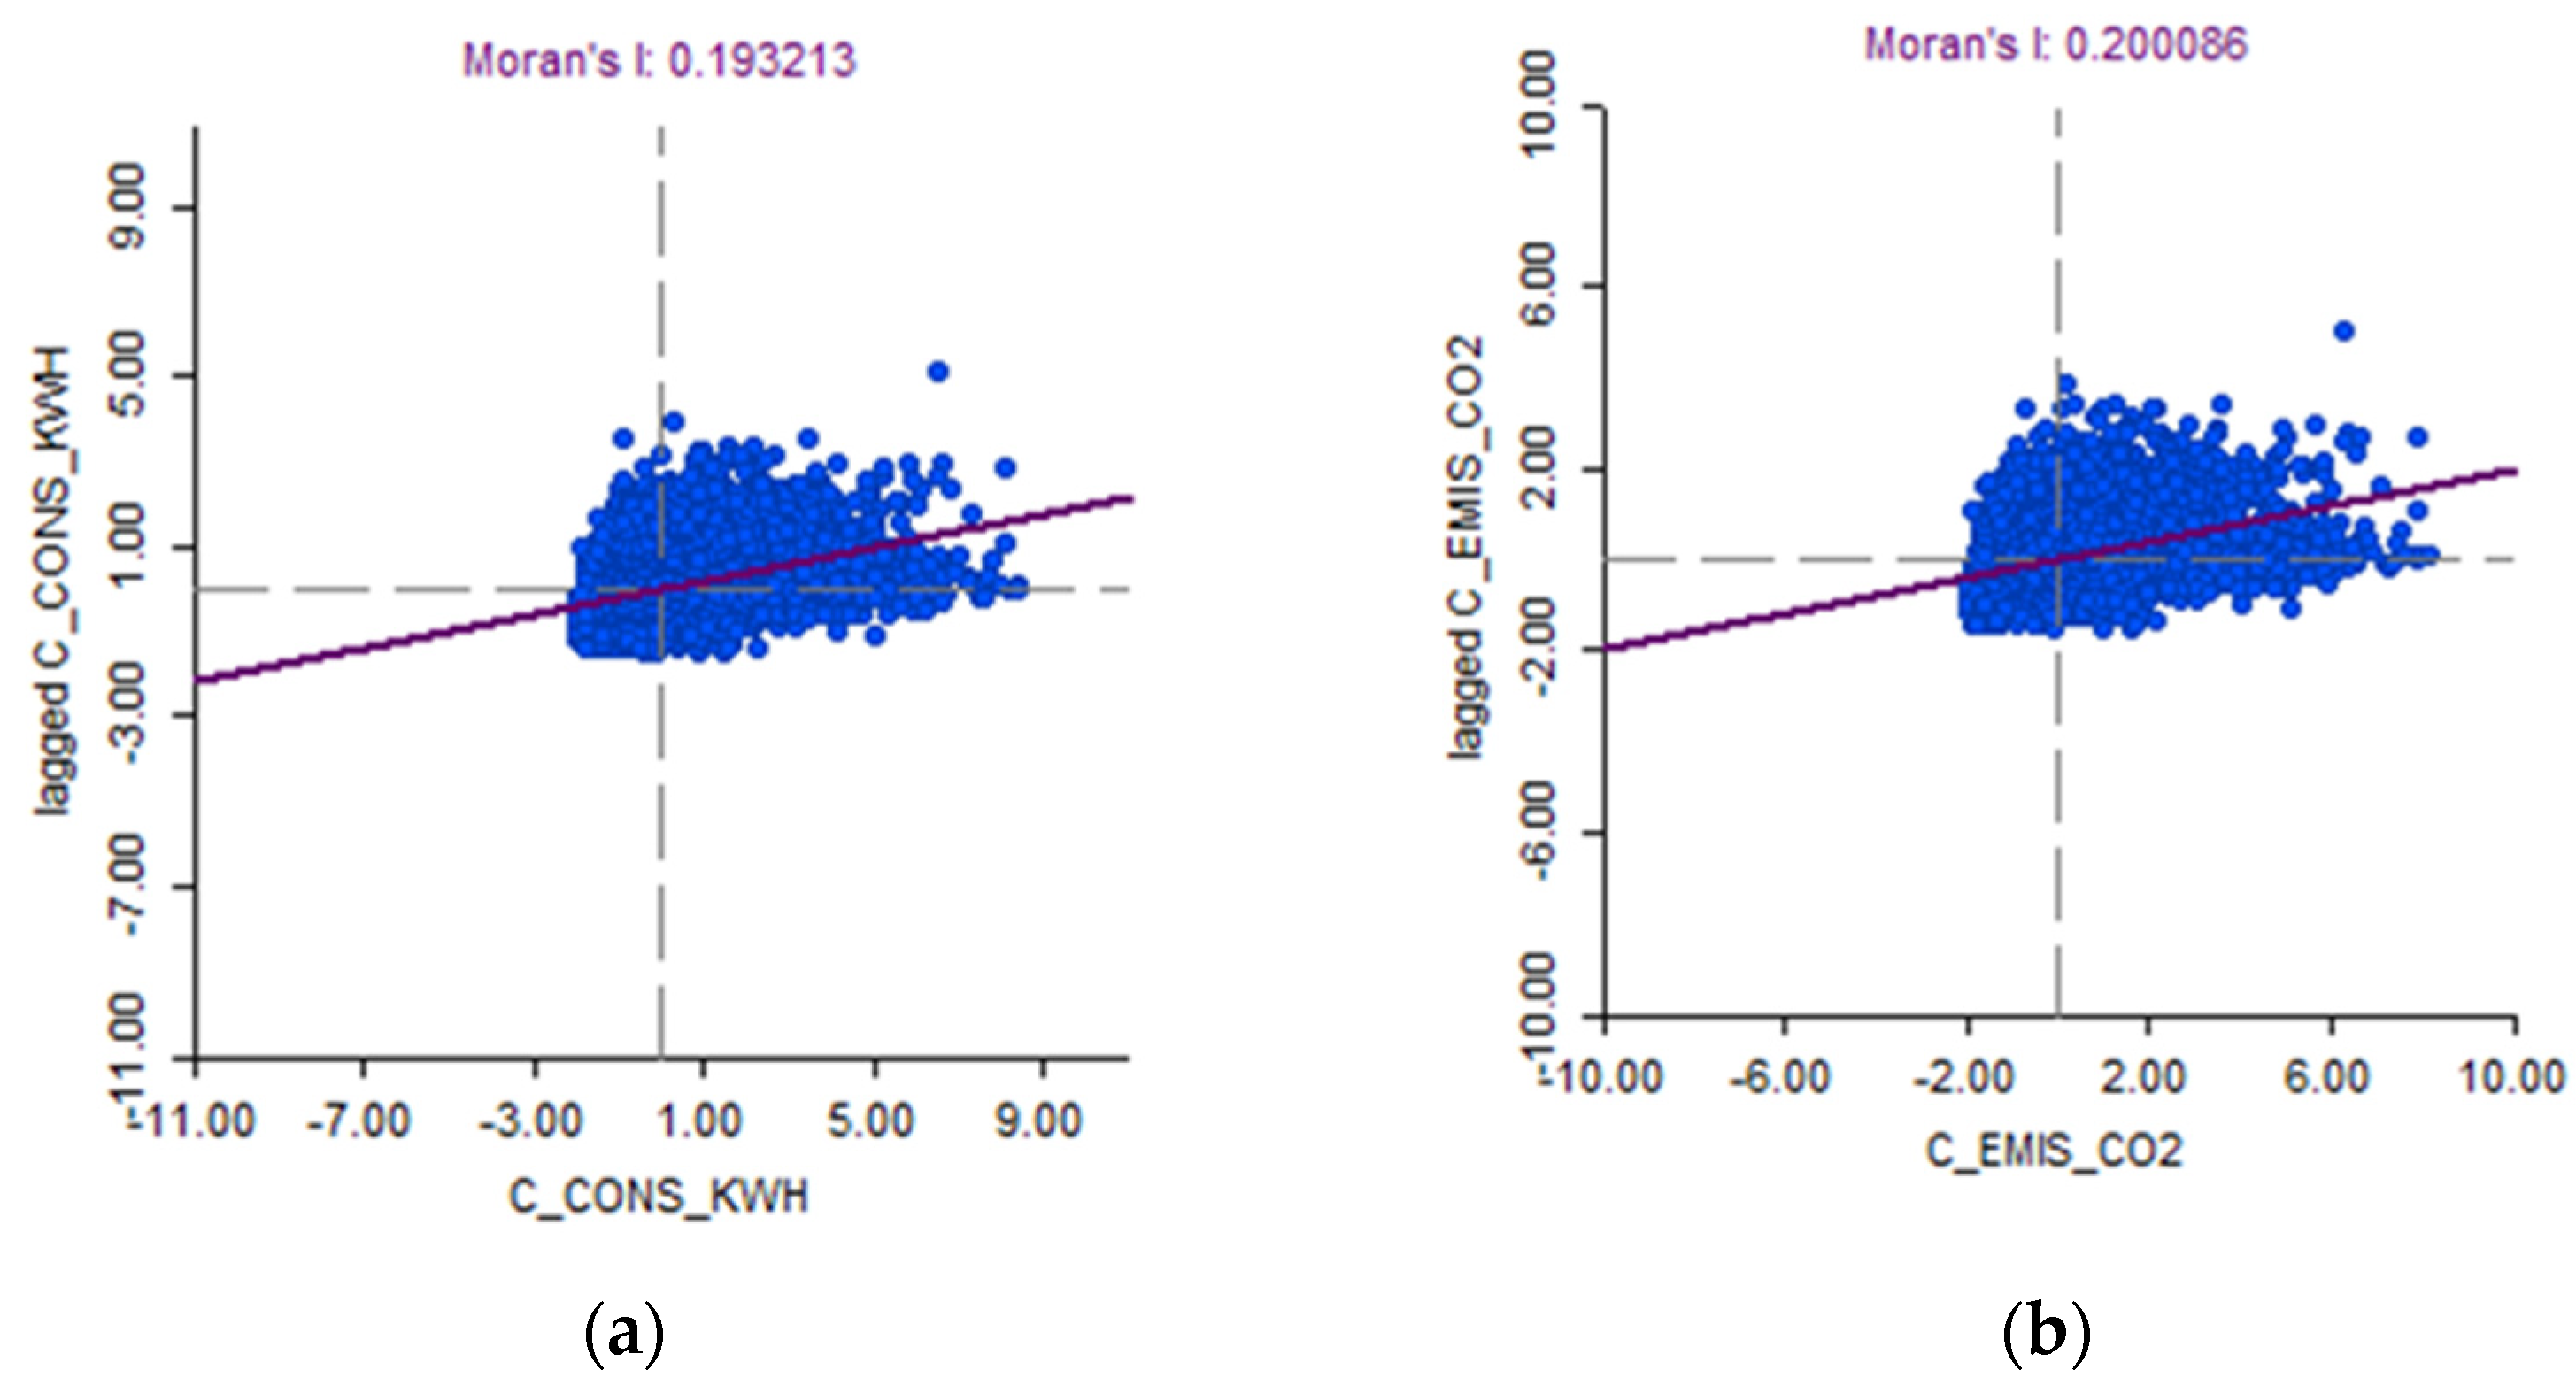
The spatial analysis has been applied using the model proposed by [46]. The analysis, carried out jointly for both provinces, indicates that there is spatial autocorrelation in the sample (Figure 1).
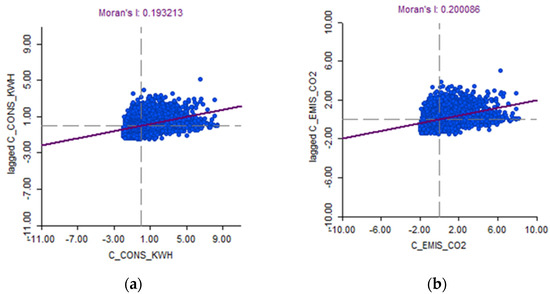
Figure 1.
(a) Moran’s I for energy consumption. (b) Moran’s I for CO2 emissions.
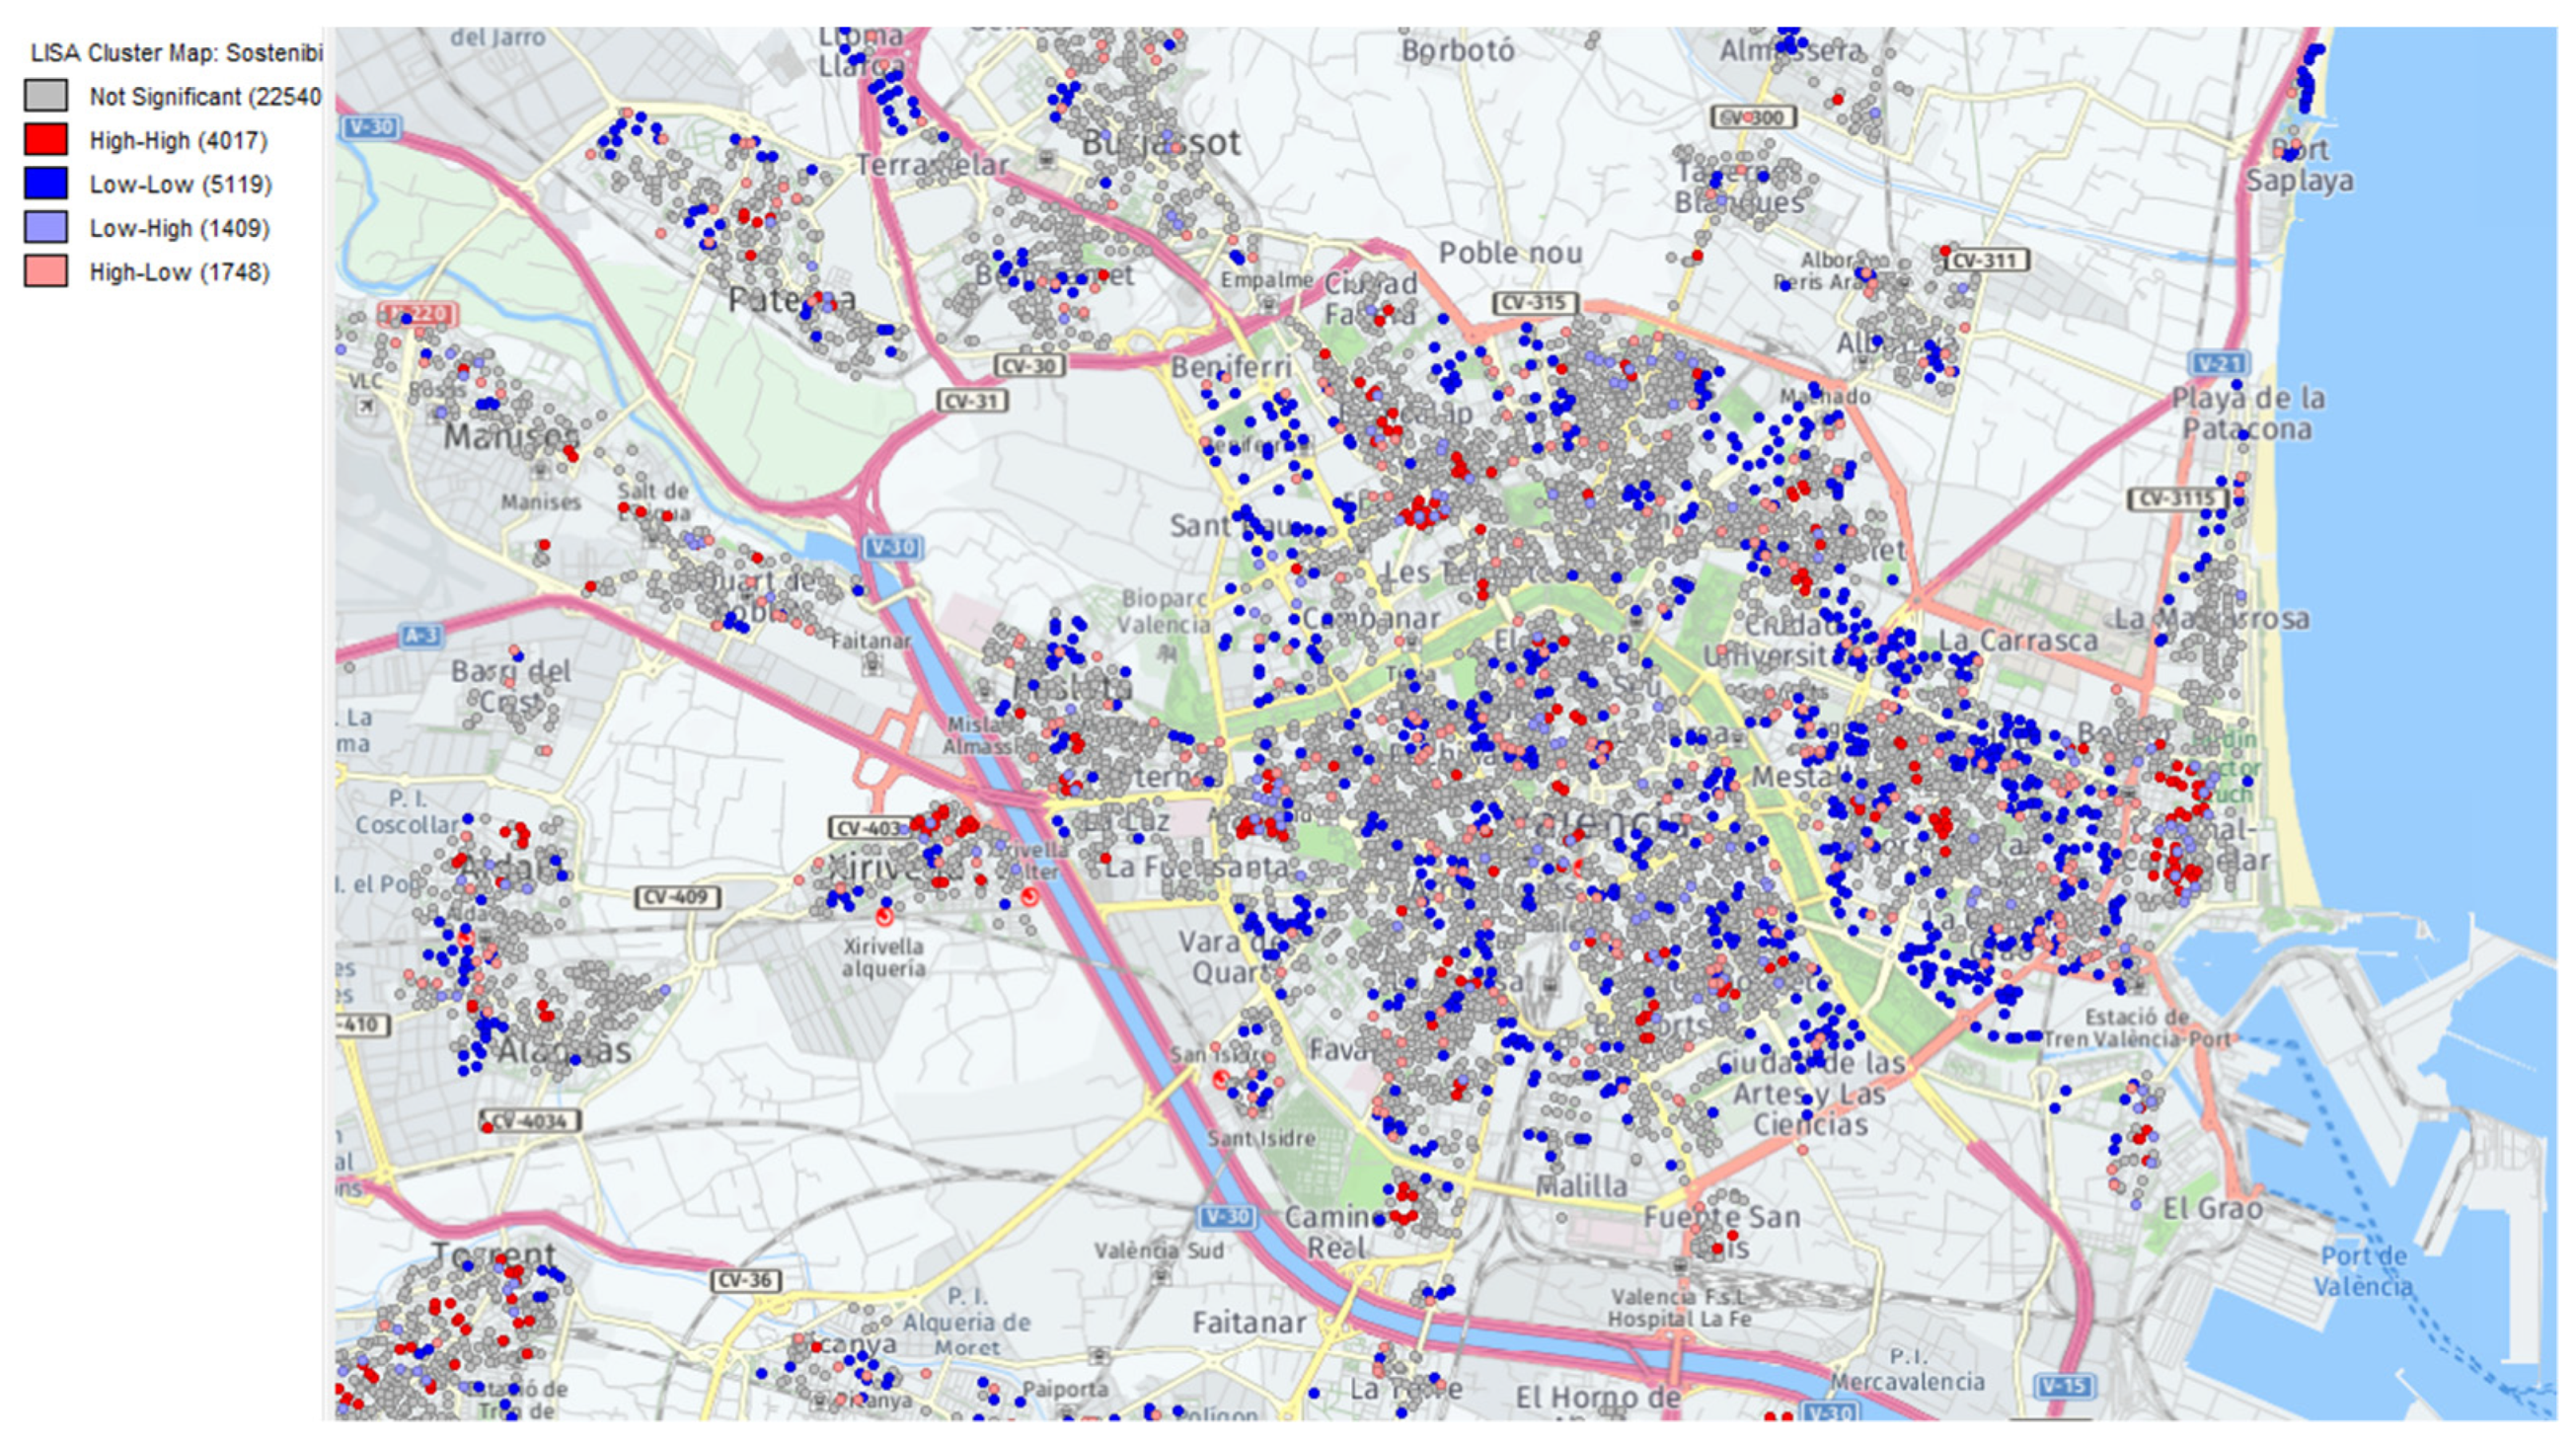
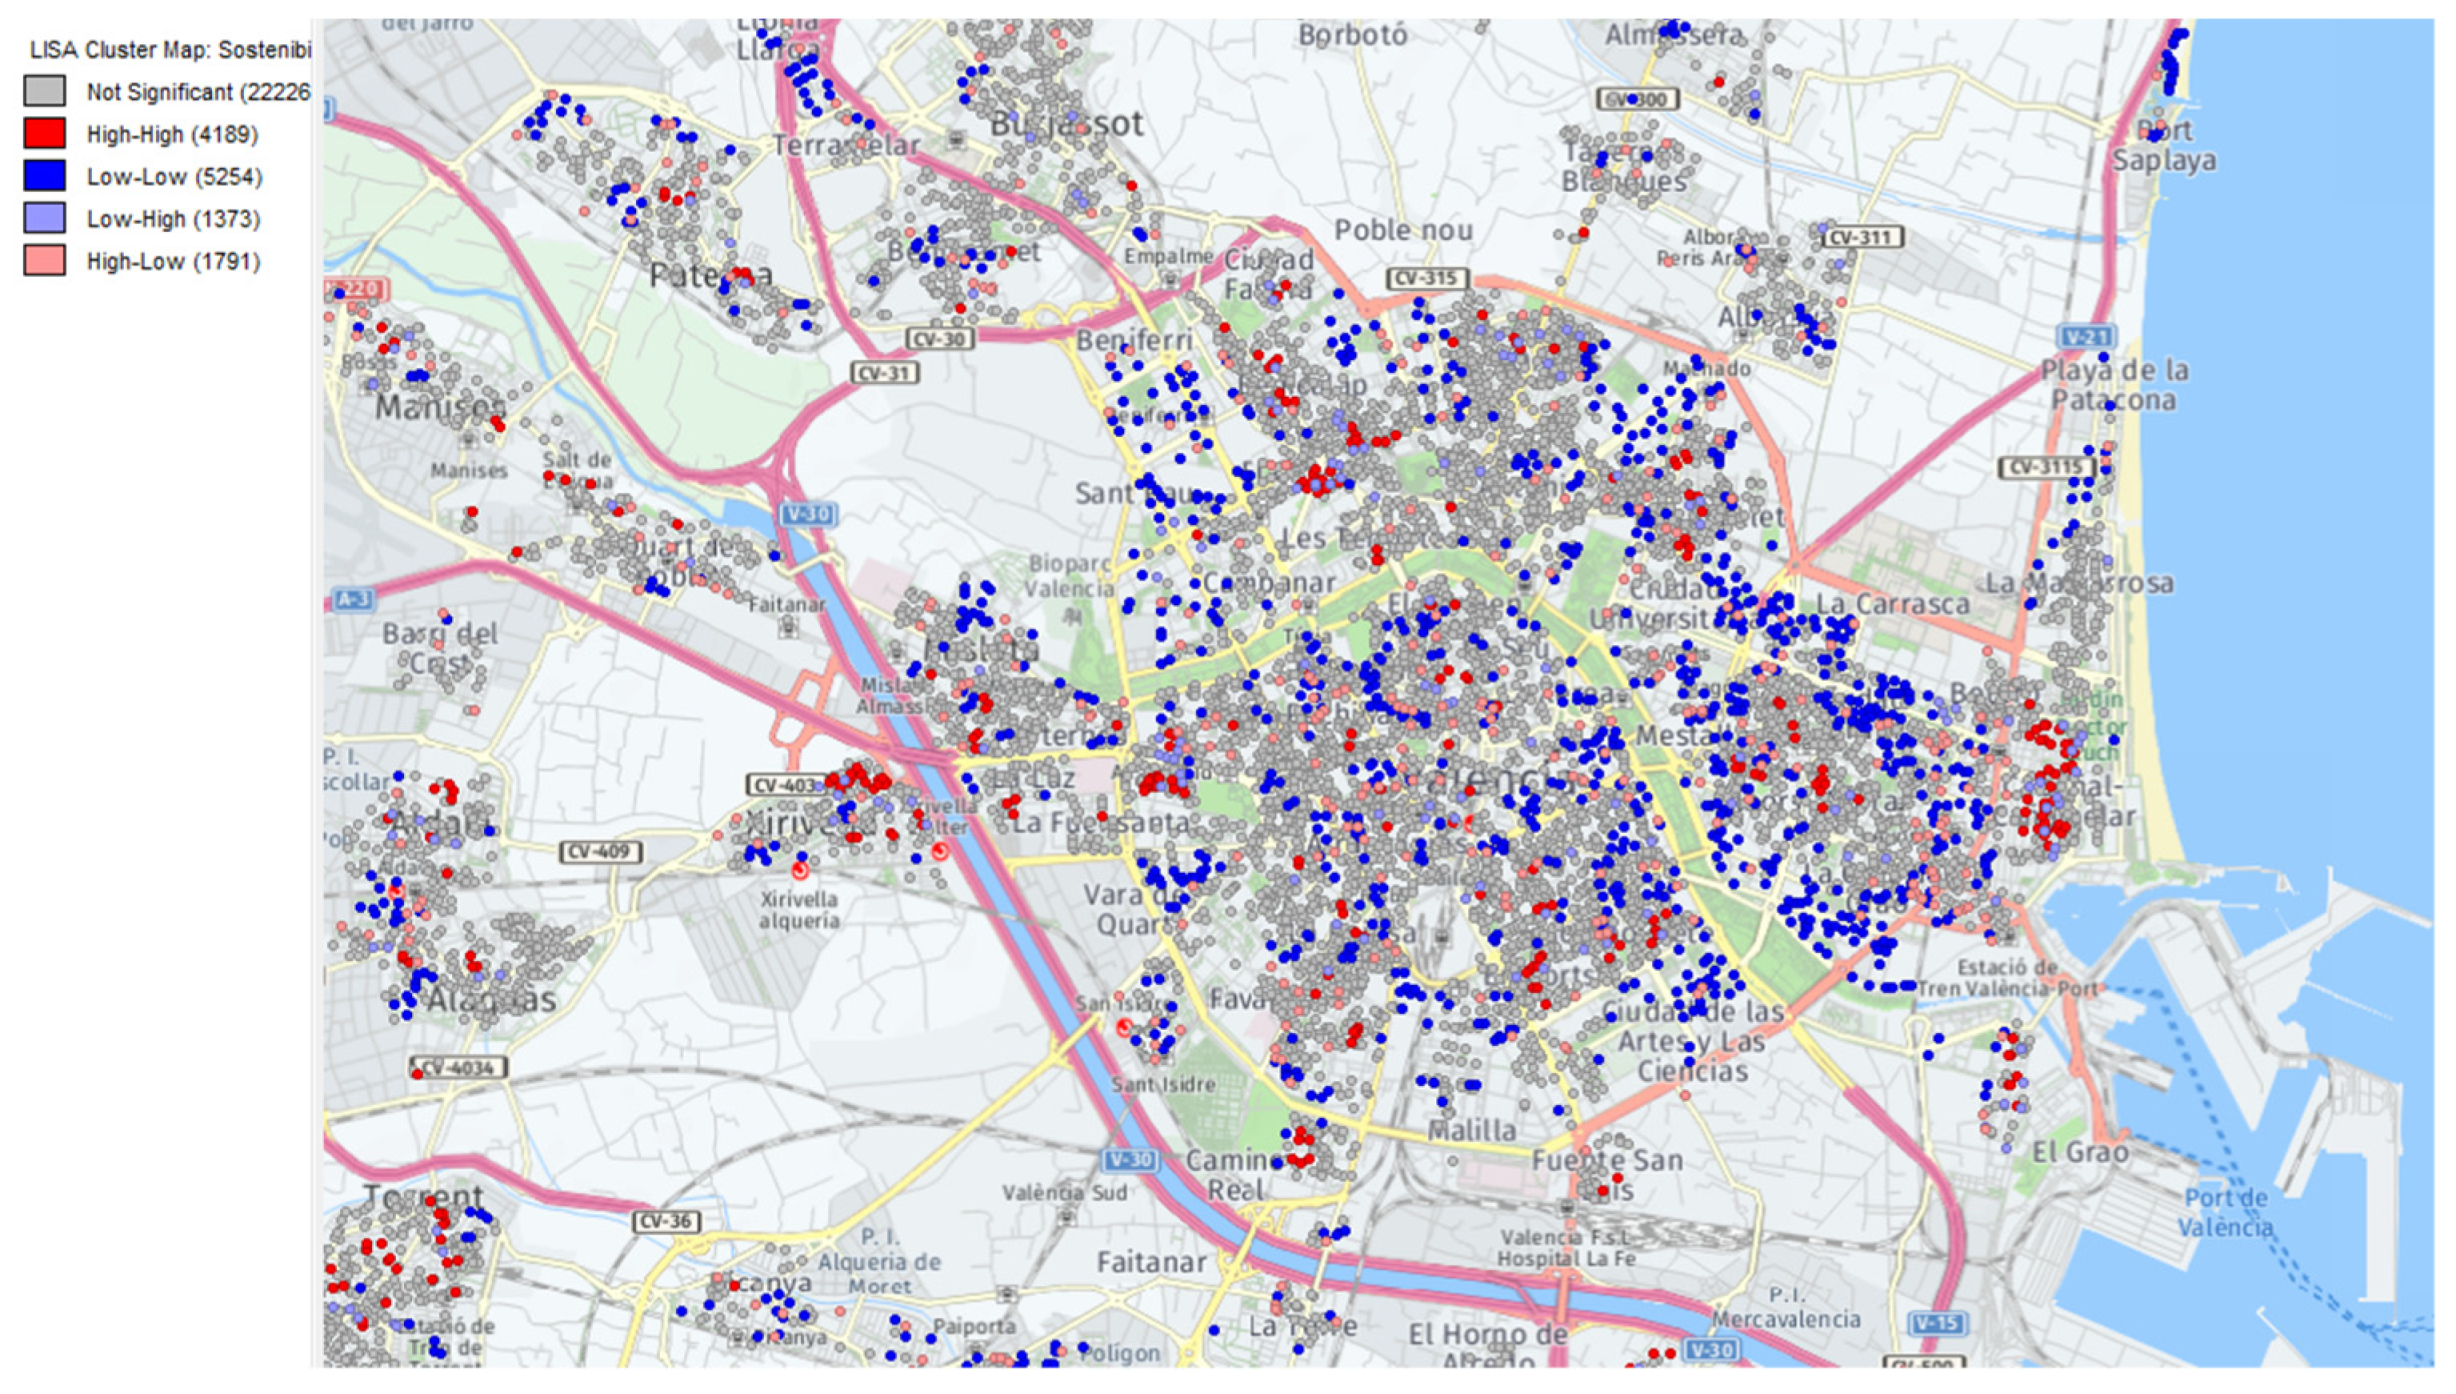
In the energy consumption case, Moran’s I (Figure 1a) shows that the autocorrelation is 0.22. Moreover, in the case of the emissions, Moran’s I (Figure 1b) indicates that this autocorrelation is slightly higher, around 0.23. This is because the analysis is done at province level driving the global Moran’s I to be small. However, the values are around 0.2 (or 20%, positive), suggesting that the spatial association is not at a global level but at a local level. This is why the Local Indicators of Spatial Association (LISA) test was performed, to find clusters of common energy consumption and emissions which could give evidence of similar pattern associated to the space. LISA confirmed that the clusters are located only in some points of the provinces, as for example the main cities (Figure 2 and Figure 3).
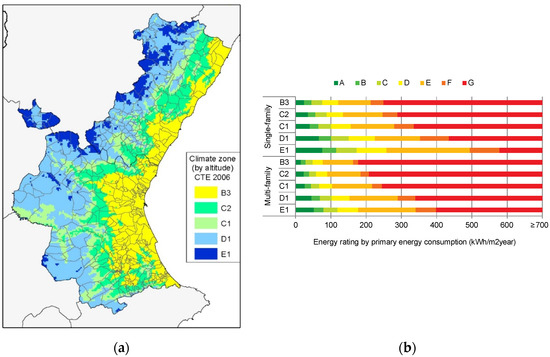
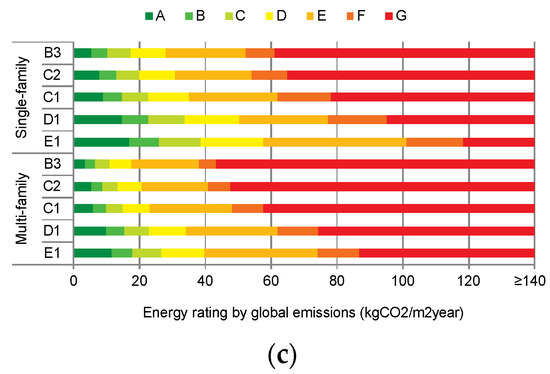
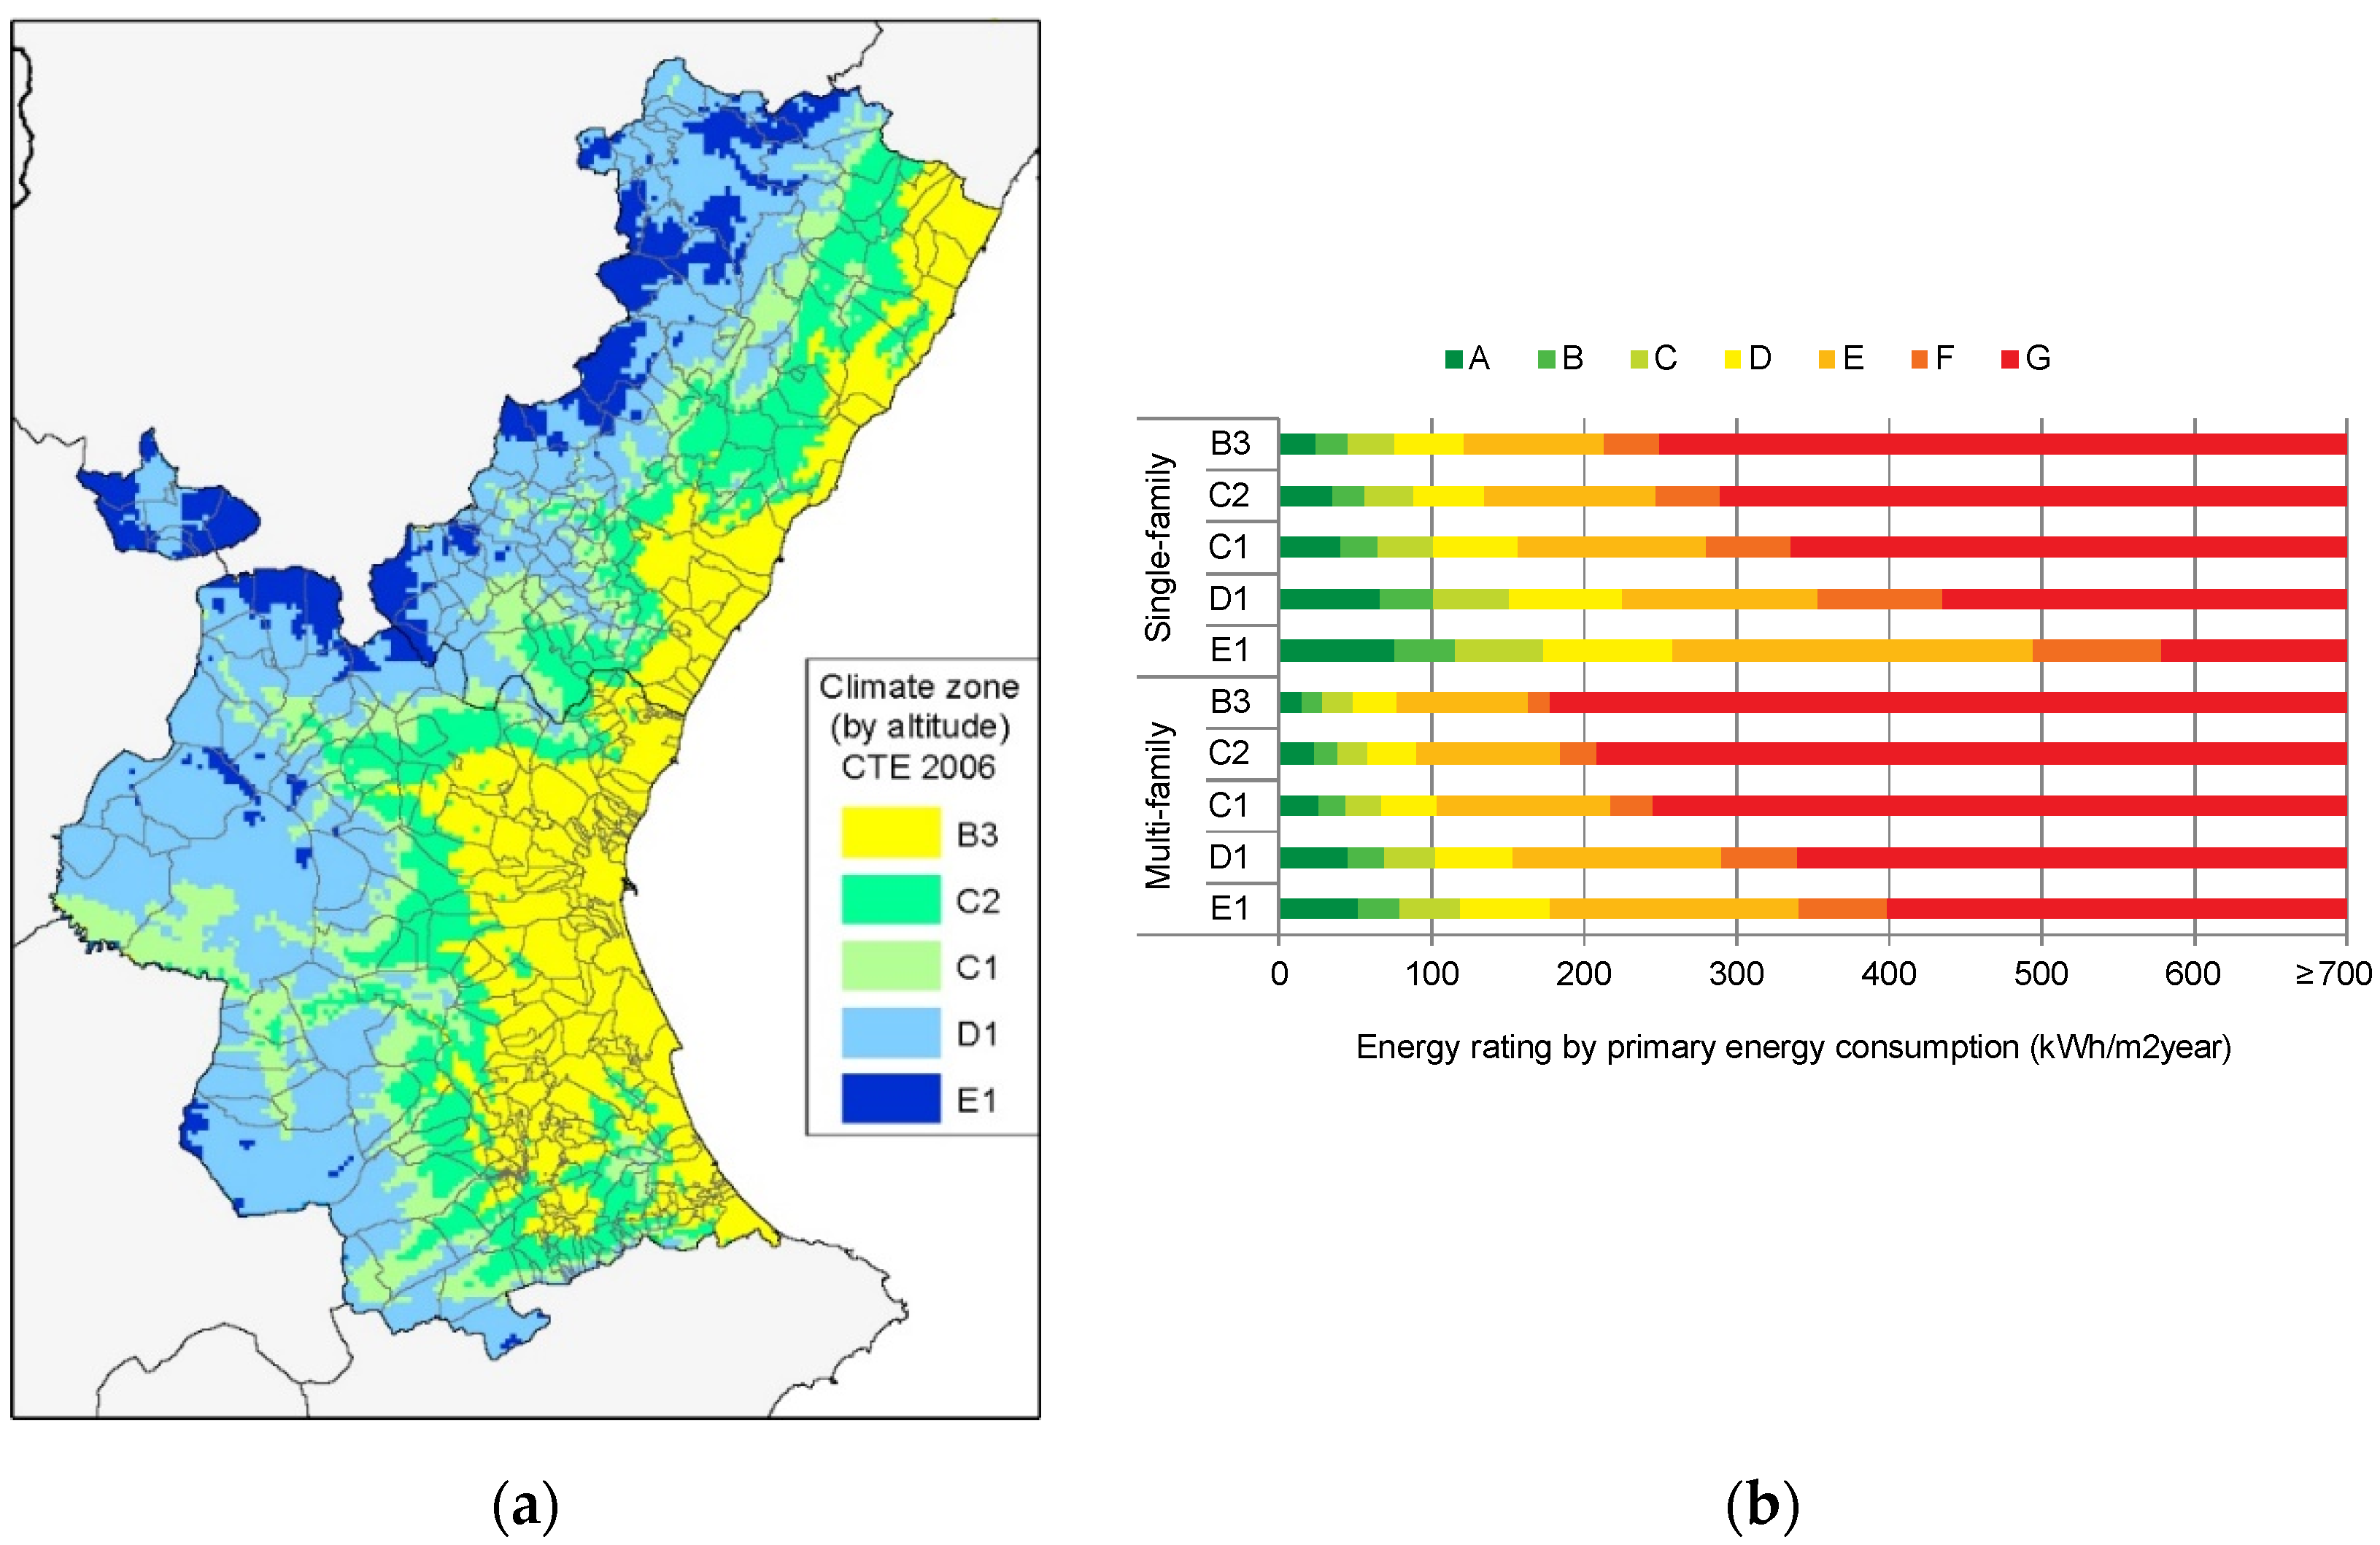
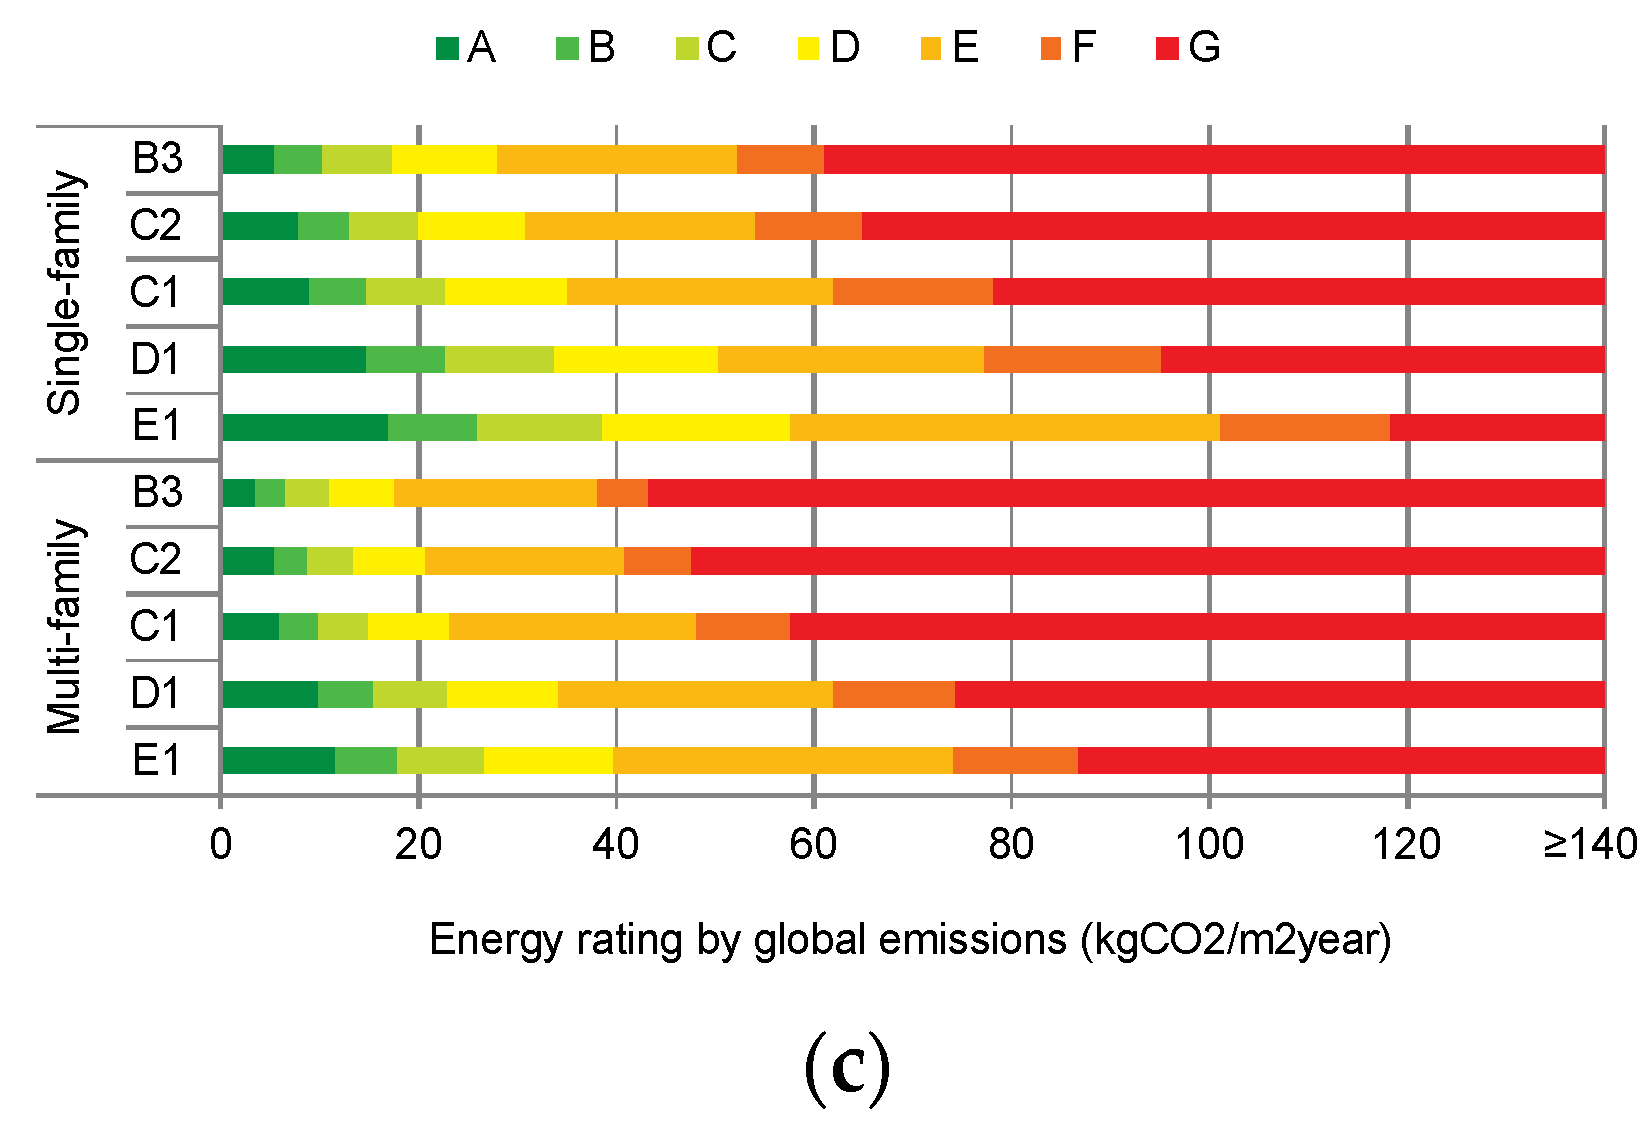
Figure 2.
(a) Climatic zones in the Valencia and Castellón provinces; (b) energy rating by primary energy consumption (kWh/m2 year); (c) energy rating by global emissions (kgCO2/m2year). For (b) and (c), the energy rating is, obtained from the CE3X program and the CTE 2006 regulations.
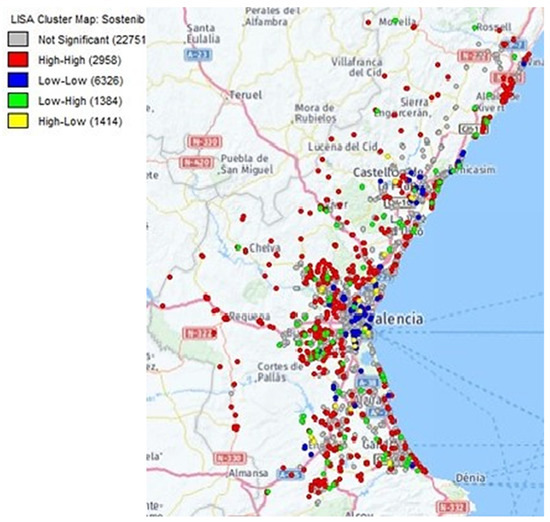
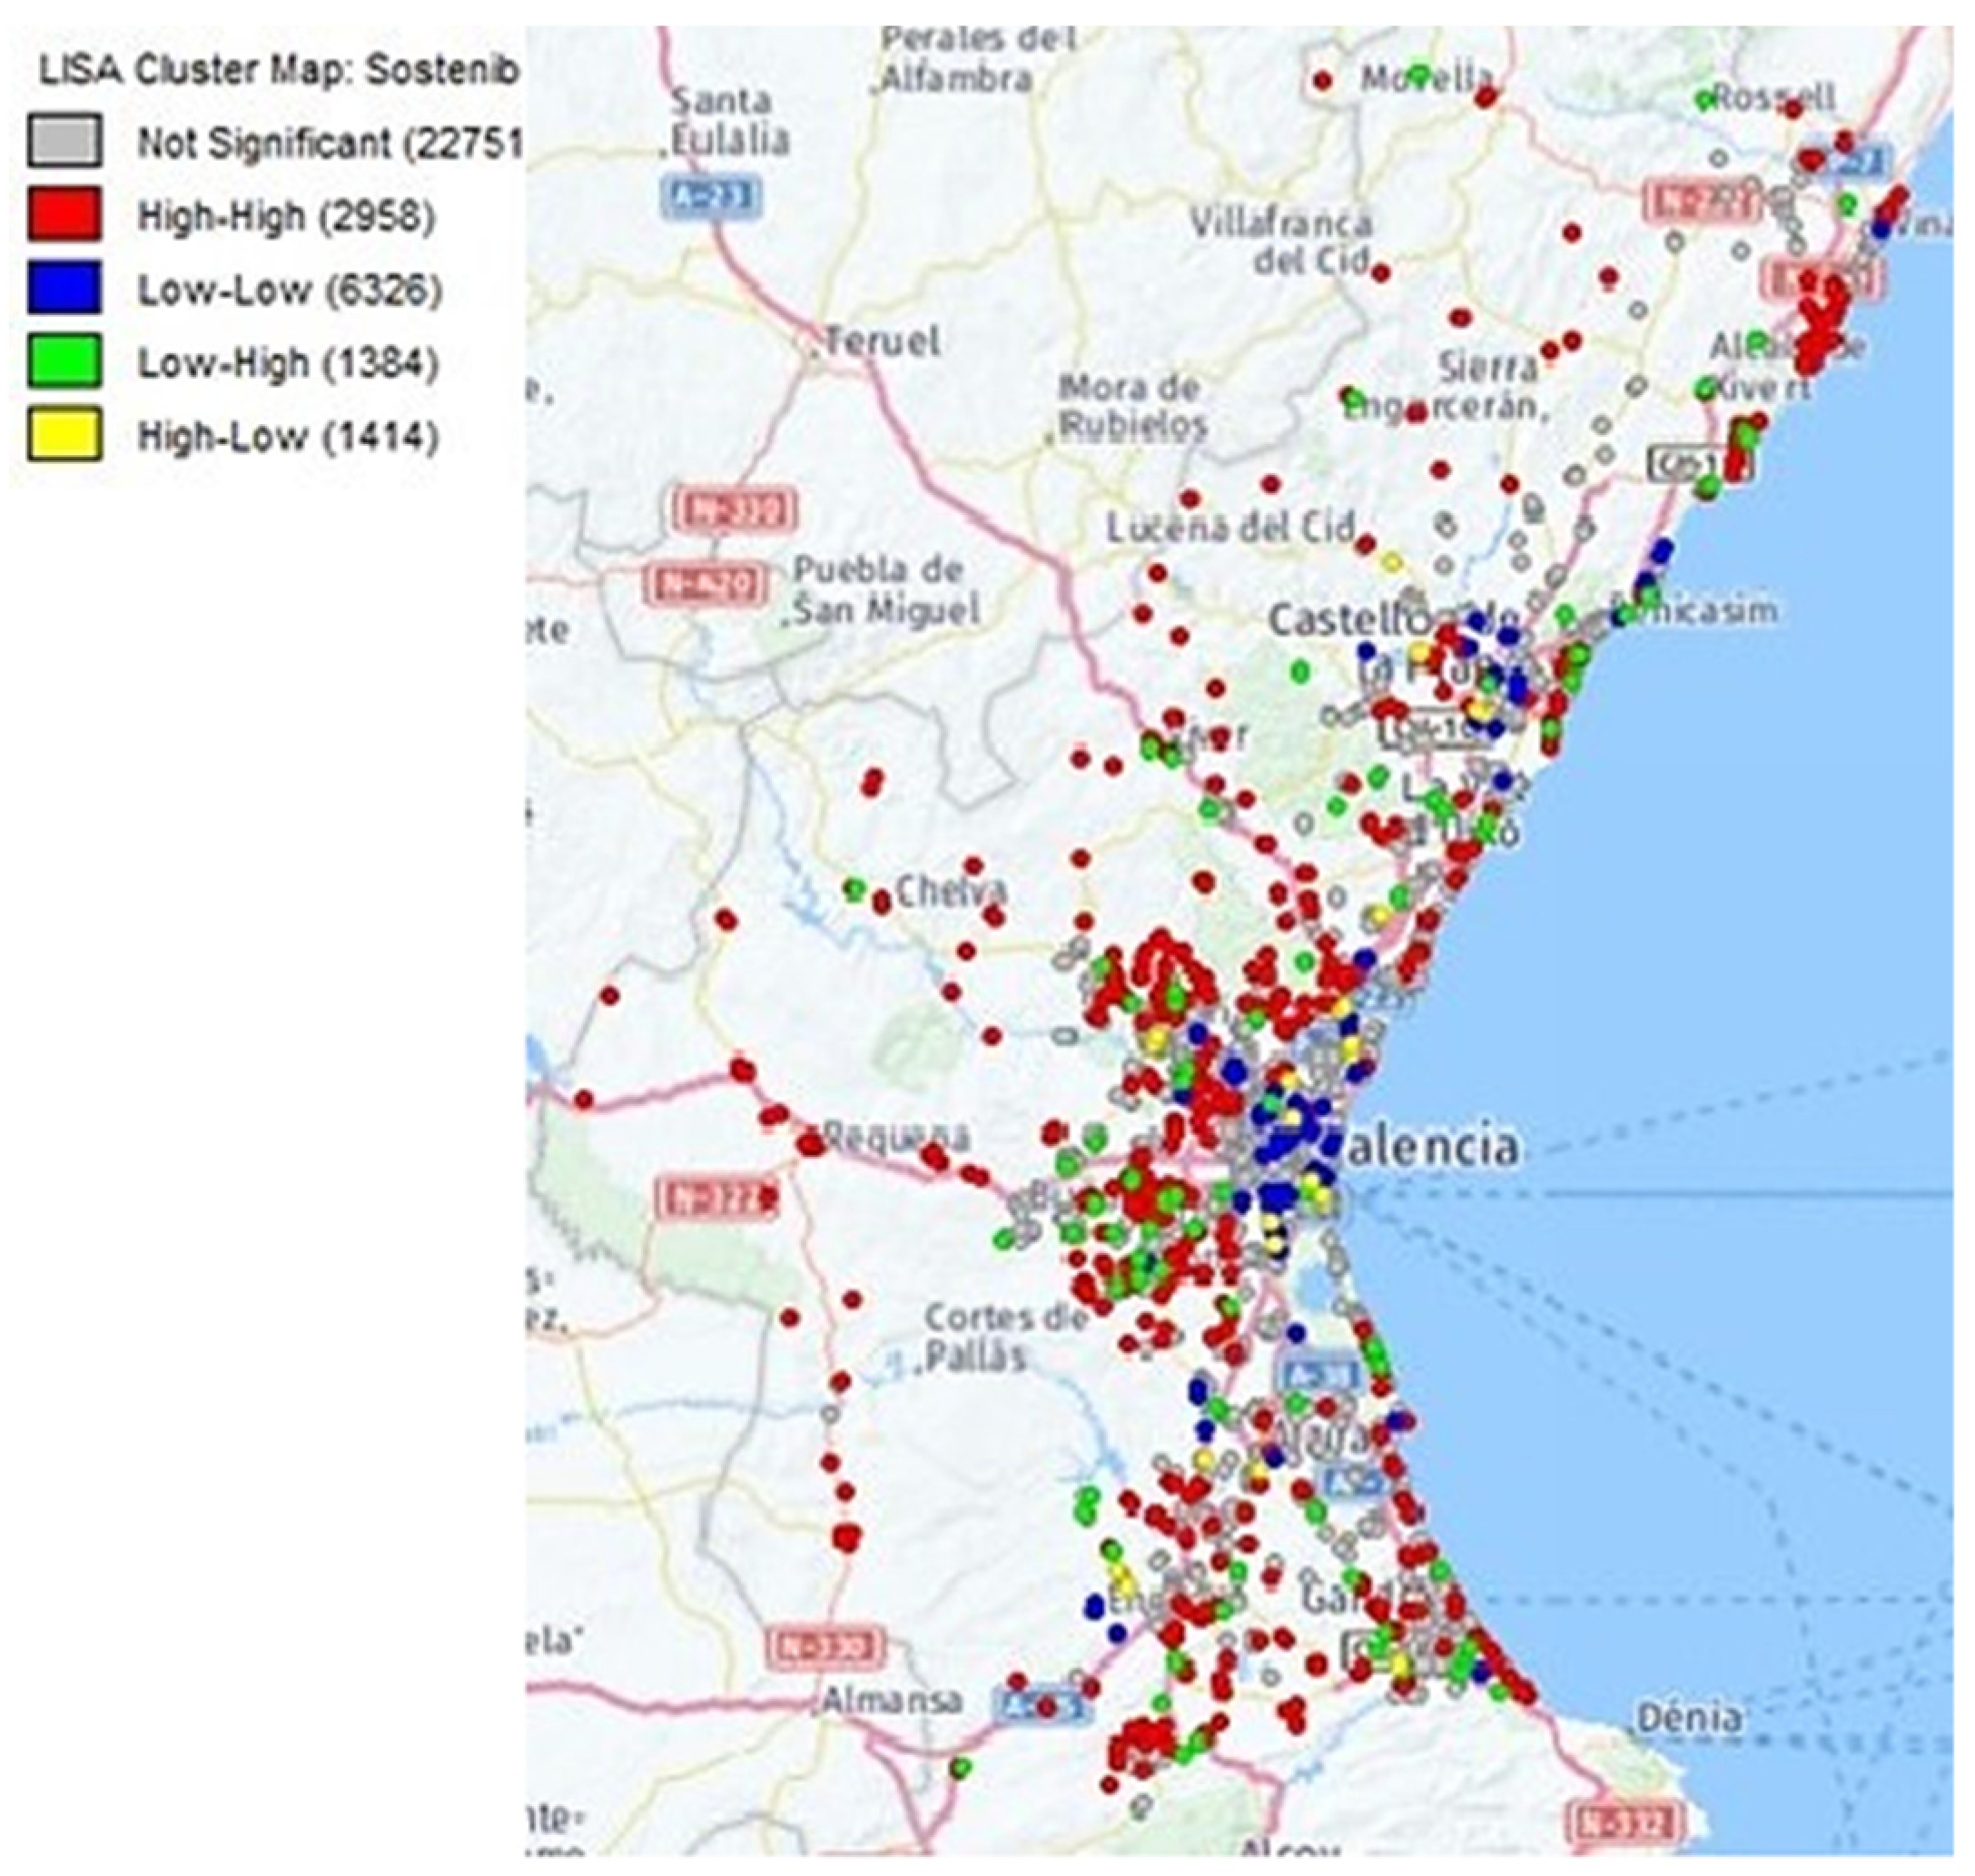
Figure 3.
Housing clusters by emission levels.
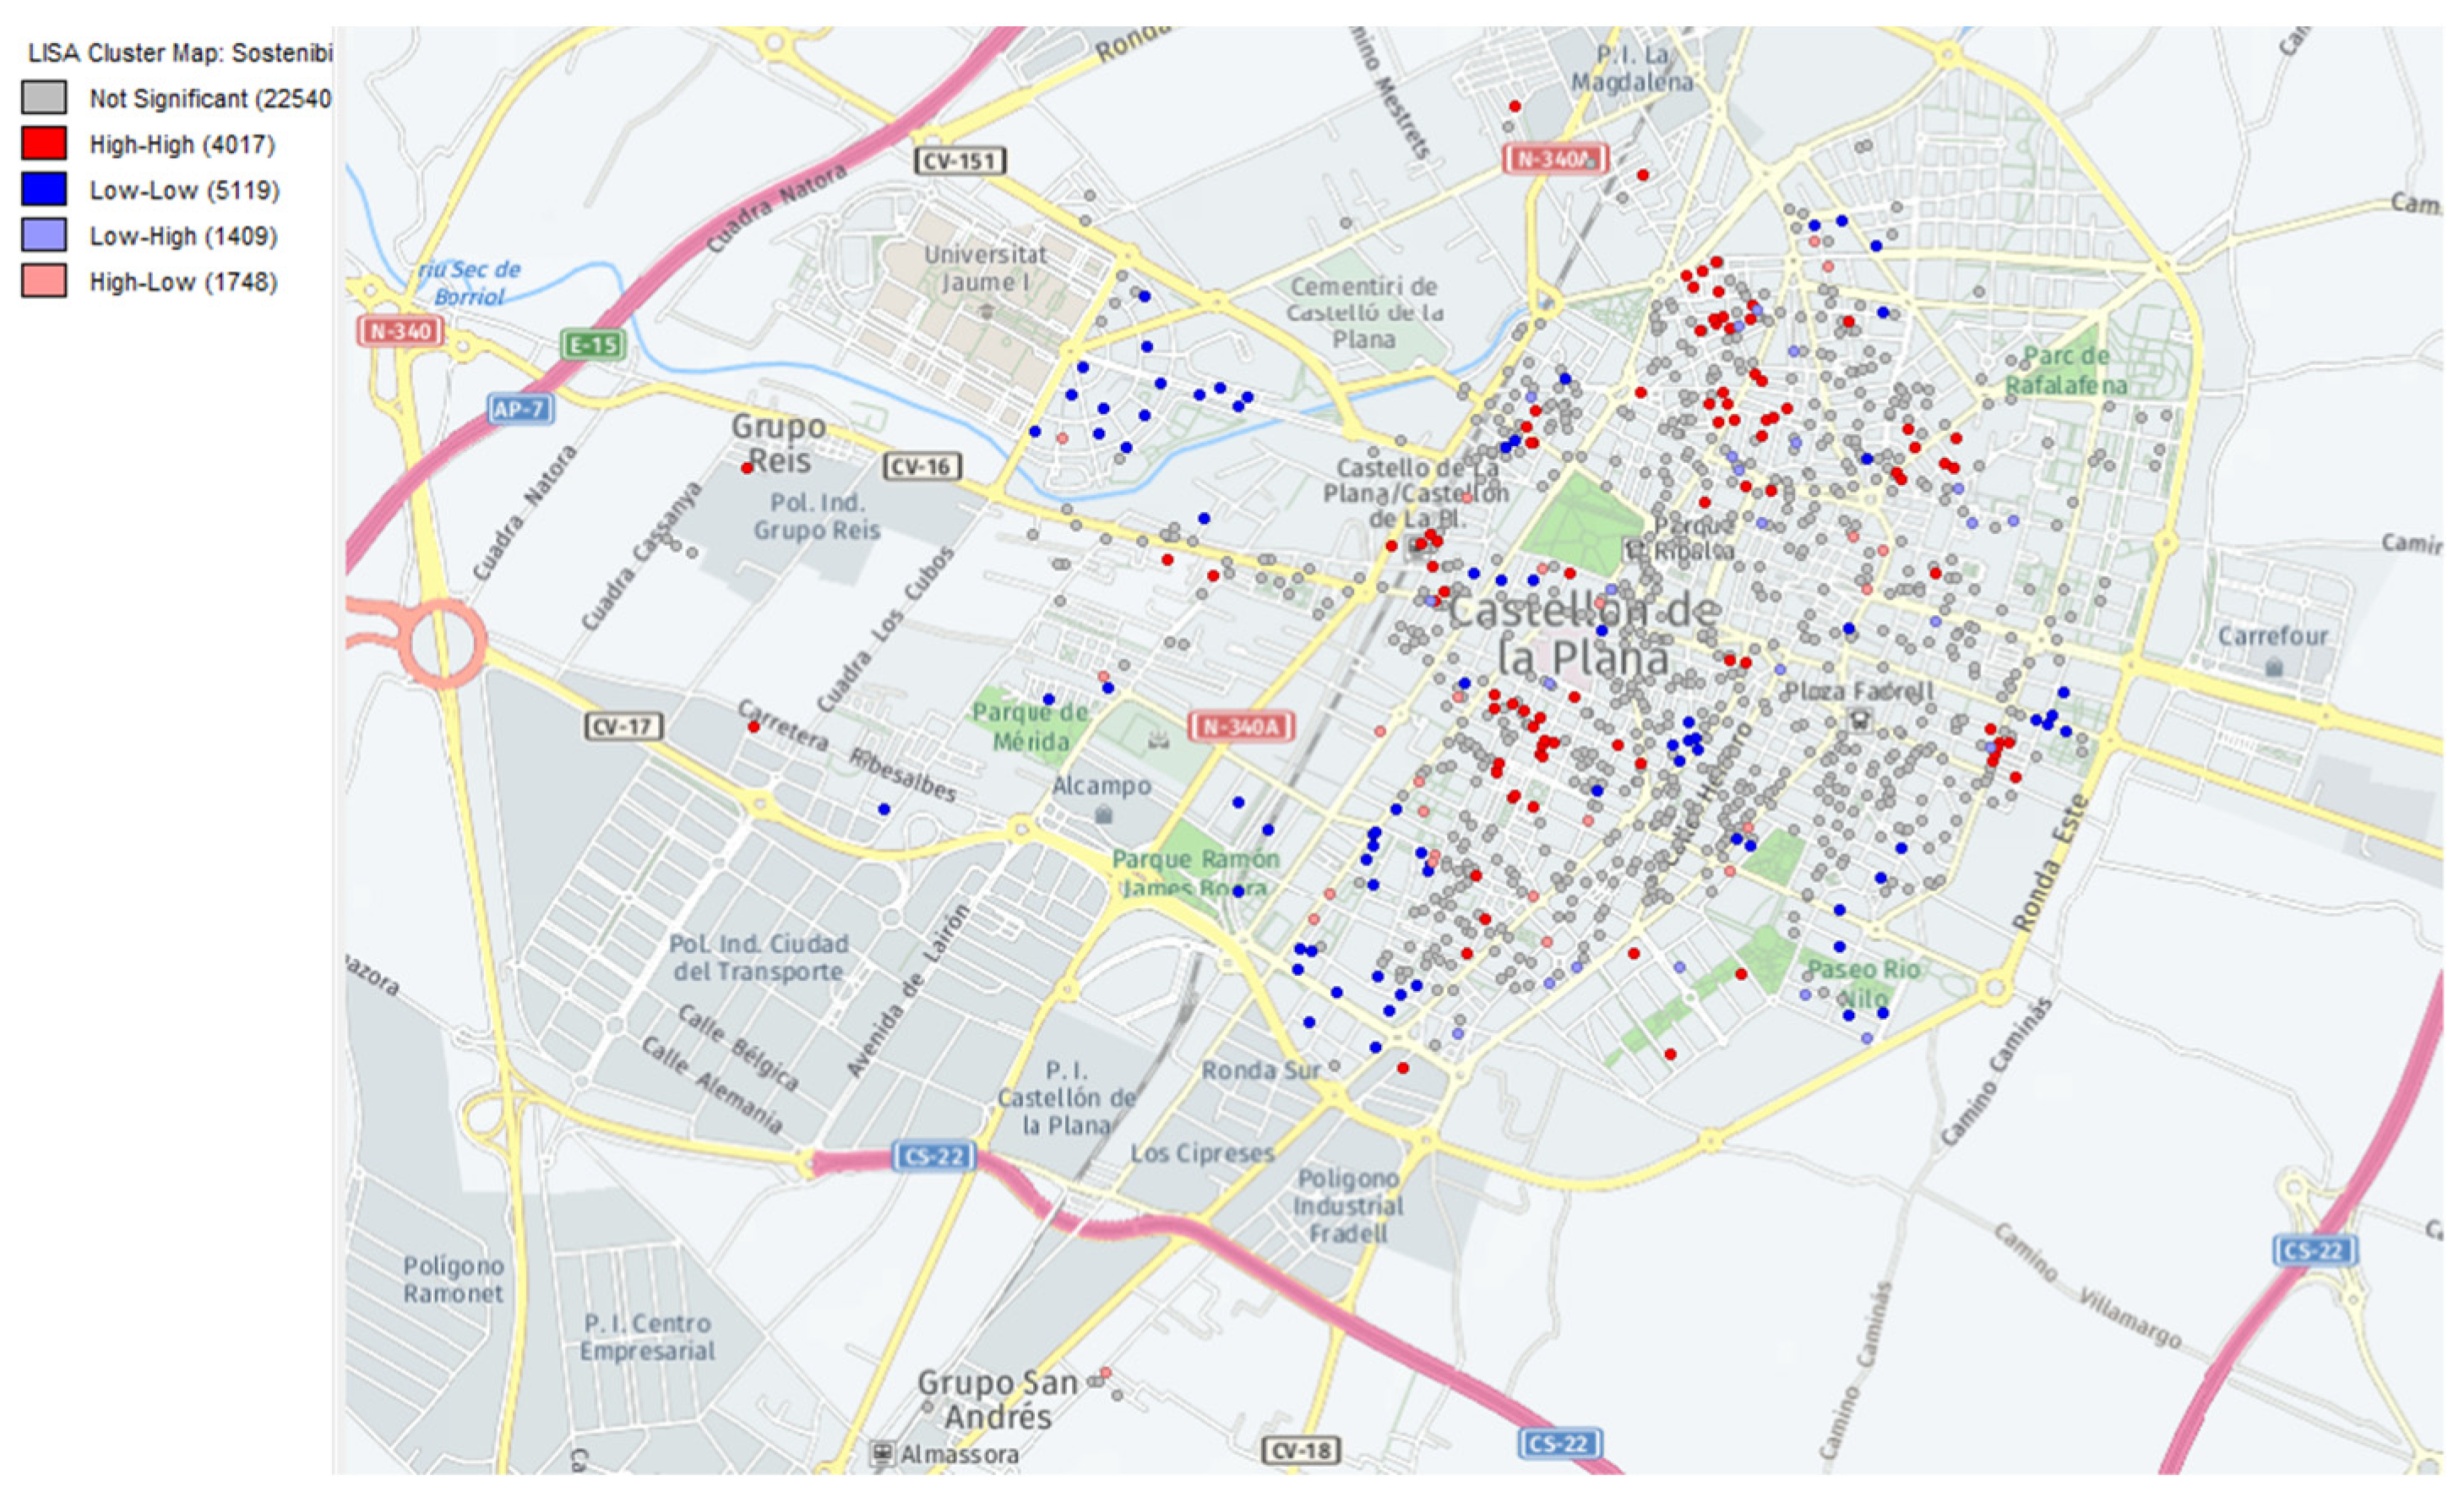
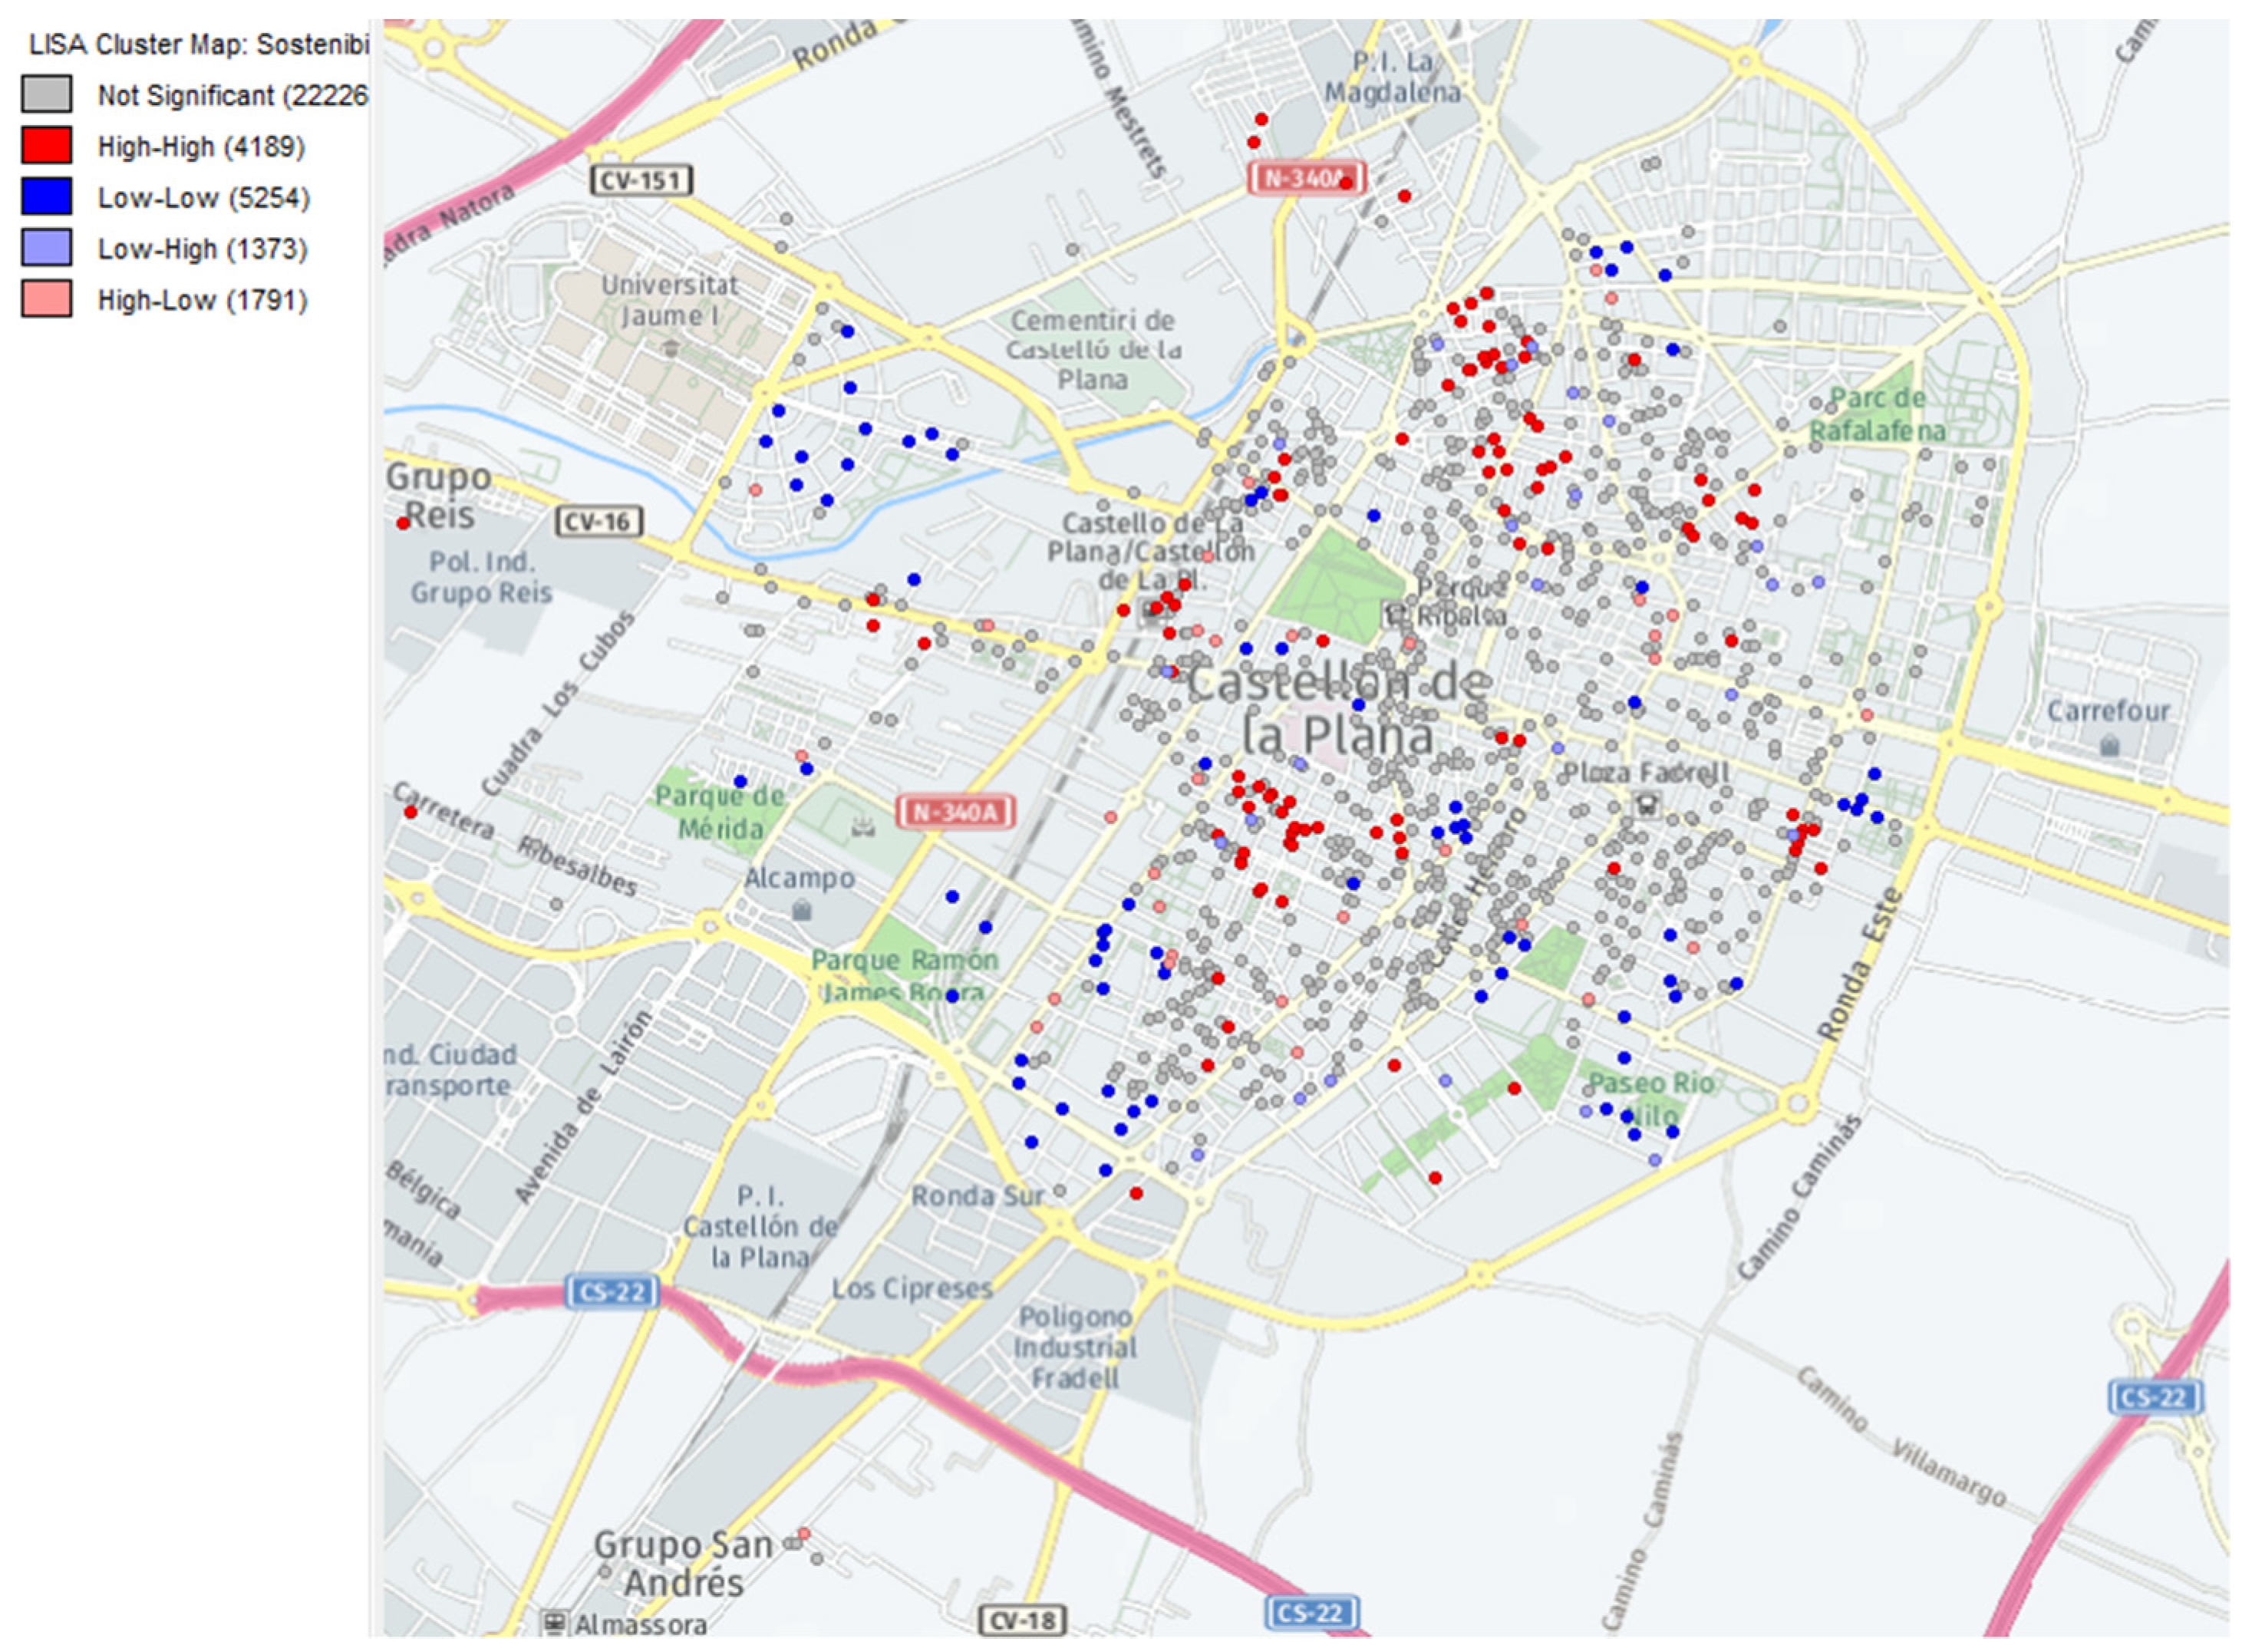
The maps represented in Figure 2, Figure 3, Figure 4, Figure 5, Figure 6 and Figure 7, show the definition of sub-markets or clusters using the energy consumption and the CO2 emissions as a characteristic. In the first maps, Figure 2 represents the boundaries of the climatic areas; Figure 3 shows the cluster in energy emissions, a low-low cluster is in the cities of Valencia (Figure 4 and Figure 5) and Castellón (Figure 6 and Figure 7). That means that when my neighbor’s consumption is low, mine is too. In addition to these, several high-high clusters are in the coastal towns of both provinces and in the inland towns of Valencia. The rest of the clusters (low-high and high-low) are transition positions located around the other cases. This fact would corroborate the theory that efficient ecosystems are created in cities. In this case, sustainability efficiency, bi-variate LISA clusters for energy consumption and emissions were also estimated for the robustness test, since the similarity of their cluster maps suggests a dependence between both.
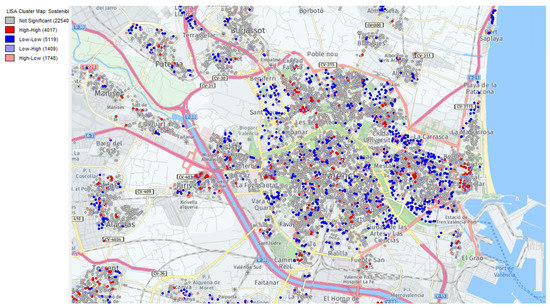
Figure 4.
Housing clusters by energy consumption in Valencia city.
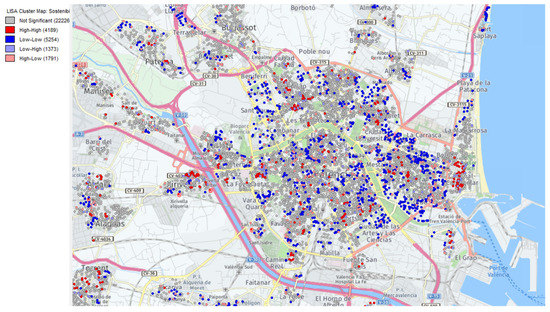
Figure 5.
Housing clusters by emissions in Valencia city.
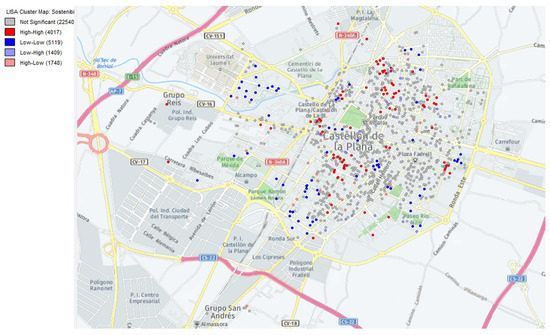
Figure 6.
Housing clusters by energy consumption in Castellón de la Plana city.
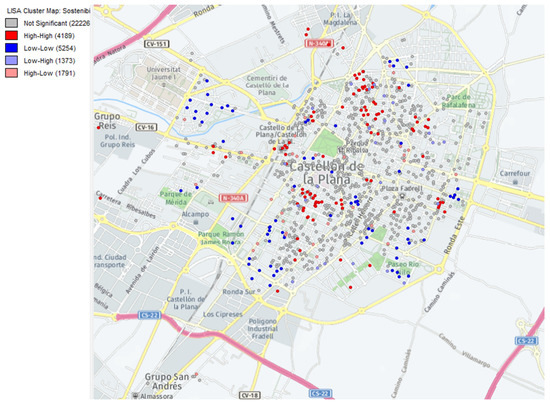
Figure 7.
Housing clusters by emissions in Castellón de la Plana city.
The results of the parameters of the semilogarithmic model are similar for energy consumption (Table 4) and emissions (Table 5), whether spatial autocorrelation (2SWLS) is considered or not (OLS Model). The OLS model captures the presence of spatial effects in the observed sample, so it is necessary to include spatial autocorrelation in the model; for this reason, the results will be explained with the two-stage spatially weighted Least Square Model (Lag + Error). This semi-logarithmic model has an explanatory capacity of 20.32% for energy consumption and 20.95% for emissions once spatial effects have been considered. In this type of modeling, low adjusted R2s are common. Such values are not the result of misspecification, but because of the complexity of the models explaining the energy consumption. The model results are quite precise, and the multicollinearity captured is controlled by the spatial correlation included in the model.

Table 4.
Results of the semilogarithmic analysis of energy consumption.

Table 5.
Results of semilogarithmic analysis of CO2 Emissions.
The tests Log-likelihood and F-statistics (Table 6) support the significance of the model results (with large values) and Breusch-Pagan and Koenker-Bassett confirms the presence of heteroskedasticity, which is a sign of the existence of a spatial association among observations.

Table 6.
Test comparison.
Since the Moran and Lagrange’s tests also confirm the presence of spatial autocorrelation, the OLS parameters are biased when explaining the relation between the independent variables and energy consumption and CO2 emissions. If we compare the three spatially weighed models applied to the hedonic regression of energy consumption, we see that some of the variables do not present robust results (with different degree of statistical significance). This is the case of the commercial ratio (percentage of commercial space in the building) and when the house is located in a building with areas for offices and public use. By introducing spatial dependence into the model, both variables lose explanatory power. The climate zone C1 also loses its significance when the spatial effect is considered in both the Spatial Lag and Spatial Error models (the Anselin-Kelejian test estimate after the model is controlled by spatial lag still suggests the existence of remaining and unobservable spatial association, so that the spatial error should be included). In the climatic zone E1, the significance varies only in the Spatial Lag model.
If the same comparison is made for the hedonic regression of emissions, the result is similar. The commercial and hospitality ratios also lose significance when the spatial dependence on errors is considered, going from being significant to 1% to 5%. In climatic zones, there are also changes in significance when spatial dependence is introduced with both the Spatial Lag model and the Spatial Error model. In the case of zone C1, the significance disappears, while zone E1 goes from being significant to 0.1% to 1%.
Regarding the coefficients obtained, the results indicate that the variables of the building, such as age or typology, are relevant for explaining the level of energy consumption and emissions of a dwelling [7,47] (p. 27). In the case of age, an increase of 1% in the age of the building would increase energy consumption by 5% and emissions by 5.4%. Moreover, the type of building indicates that an increase in one unit in multi-family buildings (both open and close blocks) contributes to reduce energy consumption by 7.4% each. In the case of emissions, the results are similar: an increase in a dwelling in open block buildings reduces emissions by 7.2%, and in an isolated-close block by 6.9%. If the effect that the number of dwellings forming the building has on the dependent variables is observed, the model determines that a 1% increase in dwellings will reduce energy consumption by 1.5% and emissions by 1.7%.
With regard to the relationship between the different types of use of the surface of buildings and energy consumption and emissions, the results indicate that when the surface of the building is increased for several uses like residential, sports, hotel, religious and other unspecified uses, the energy consumption of the dwelling increases by 4.1%, 29.4%, 10.5%, and 16.4%, respectively. Meanwhile, if the surface has greater commercial use, energy consumption decreases by 4.9%. When the effect on emissions is analyzed, a greater proportion of the surface area destined for residential, sports, hotel, and other unspecified uses cause an increase in the level of emissions of 5%, 29.2%, 11.7%, and 16.7%, respectively. Meanwhile, a higher ratio of surface area for commercial and office use implies a decrease in emissions of 5.9% and 8.1%. These results are consistent with those studies that indicate that characteristics of the housing environment, such as those corresponding to the building, affect the energy consumption and emissions of the dwellings or elements that form part of it [8,10,14,15,34,48].
On the other hand, among the variables that make up the block of characteristics of the dwelling or residential units, it is observed that the size of the dwelling and the number of elements that make up the dwelling have a significant effect on energy consumption and emissions. In the case of the size of the dwelling, measured as the number of m2 of a residential unit, an increase of 1% in the residential area would produce a reduction in energy consumption of 11%. The same is true when emissions are analyzed. In this case, when the size of the dwelling increases by 1%, the level of emissions is reduced by 12.3%. These data do not coincide with the conclusions obtained in previous studies, in which the larger the size of the dwelling, the greater the energy consumption—and, therefore, the higher the emissions [8,14]. One possible explanation is the fact that most of the sample is in a low-low cluster in the metropolitan area of Valencia, as can be seen in Figure 2. On the contrary, when observing the variable that collects the number of elements that make up the dwelling—which can be used as an approximation of the size or distribution of a dwelling—the result is similar to previous studies. The analysis indicates that when a dwelling element increases, both energy consumption and emissions increase by 2.6%.
When the variables referring to the location of the dwellings are observed, it is observed that the dwellings located in the province of Valencia consume 3% less energy than those in the province of Castellón. This figure is slightly more significant (−3.4%) when analyzing the effect of localization on emissions. Regarding the effect that climatic zones have on energy consumption and emissions levels, the model determines that dwellings located in zone B3 (coast) consume 3.1% less than those located in zone C2 (interior reference zone) and emit 3.7% less. Meanwhile, dwellings located in zones D1 and E1 consume 17.2% and 19.6% more than zone C2 and emit 16.9% and 19.6% more than zone C2, respectively. Zone C1 does not present a significant result when spatial dependence is introduced into the sample. This result coincides with the conclusions on location, climate, and radiation of [14,17].
Finally, the variables collected by spatial autocorrelation indicate that 20.2% of the energy consumption of an observation depends on the spatial effects of the energy consumption of the surrounding observations and 26.4% depends on the structural spatial dependence not explained by these variables. In terms of emissions, 19% is explained by the emissions from the rest of the observations, while structural spatial dependence has an effect of 31.4%.
5. Discussion
If these results are analyzed in the light of their political context, several conclusions can be drawn, which constitute the contribution of this analysis to the literature. EU policies to reduce the impact of climate change have focused on reducing energy consumption and emissions, setting general and sometimes specific targets for each economic sector. Among these measures, the Energy Performance of Buildings Directive (EPBD) stands out, whose framework of action focuses on the reduction of emissions in the real estate and construction sector. The 2018EPBD review, concluded that the rate of rehabilitation and energy reforms in existing buildings had been very low. This demonstrated the need to focus on housing energy policies on the existing housing stock [49].
Studies such as [49] show that current EU efforts are not achieving results in line with the objectives set by the Conference of the Parties 21 (COP21) and the Paris Agreement. For this reason, new, more stringent and precise regulations will be necessary.
Continuing with these premises, in this research it can be observed that, in some countries and regions where there are large differences between climatic zones and between cities of different sizes, the behavior of the housing market is not the same. In the case of Valencia and Castellón, the most notable differences are between dwellings located in coastal and inland climatic zones and between those located in metropolitan cities and in other types of towns.
In the case of coastal areas, despite having a lower energy consumption in the total sample, high-high clusters appear in certain areas (with a strong tourist presence), i.e., submarkets with high energy consumption. This could be due to two reasons: either there could be a rebound effect (newer and better-equipped dwellings, with higher consumption) or it could be due to the fact that the property stock is old and is not being improved or rehabilitated (this case is closely related to the profile of a secondary dwelling intended for tourist rental or use by the owner for short stays). In both cases, mechanisms to promote energy rehabilitation through market incentives (greater energy efficiency, a greater value of housing on the market) would not have the expected results. However, in indoor areas where energy consumption is also high (this may be due to the type of dwelling—more single-family and rural dwellings—and more old dwellings), this mechanism could have a greater impact. The internal housing market tends to focus on rentals or purchases for long-term stays, so market incentives for investment in energy rehabilitation could work.
On the other hand, it is observed that in both metropolitan cities (Valencia and Castellón), low-low clusters appear, which could demonstrate some theories that indicate that in cities and urban centers, ‘ecosystems’ of efficiency are produced in different aspects such as transport, energy consumption, etc. In these cases, incentives to invest in rehabilitation would also be effective, since inefficient housing would lose value in a market where most homes have better sustainability standards.
In addition to this, it is worth noting the fact that there are differences between energy consumption and emissions in terms of significance, spatial dependence, and the relationship between the characteristics. In the hedonic analysis of emissions, spatial dependence and coefficients are slightly higher, this may be because, as [37] indicates, the level of emissions depends directly on energy consumption and the type of energy source, and therefore, the model is indirectly capturing this factor.
The empirical evidence here is analyzing the role of the physical components of the house to explain energy consumption/CO2 emissions. The literature is clear in the former as the consumption mainly depends on other non-technical variables, such as the use of the house, family features, and other non-physical or technical variables. The goodness of fit of the models explains 20% of the variability on consumption due to housing physical features. The explanatory capacity is not small when the task is to explain energy consumption and emissions. The results obtained and the significance of the indicators, according to other previous analysis, allow to quantify how much energy can be saved in buildings, if the physical features of a house are improved.
6. Conclusions
This study analyzes the effect that the physical attributes of a building and a dwelling have, as well as some contextual characteristics, such as location or climate, on energy consumption and the level of emissions of a dwelling. The study has been carried out for the Spanish provinces of Valencia and Castellón, and includes as control variables: climatic zones, following the studies of [14,17], who indicated that climate is a relevant variable for energy consumption, and the presence of spatial autocorrelation in real estate sub-markets depending on some characteristics, as indicated by [38,41].
To resolve the analysis, two semilogarithmic regressions have been proposed (one for energy consumption and the other for emissions), which have been resolved by applying a spatially weighted model of Least Squares in 2 Stages (2SWLS). The results of both regressions indicate that the results for energy consumption and emissions are similar. There is a relationship of spatial dependence in the sample that delimits real estate clusters for energy sustainability.
On the one hand, low consumption and low emission clusters are observed in the metropolitan area of Valencia and Castellón and, on the other hand, high consumption and emission clusters are delimited both in coastal tourist towns and in inland areas. Taking this spatial dependence into account, endogenous variables indicate that older dwellings have higher energy consumption and emissions. In addition to this, when part of the surface of a building is used for sports, catering or other uses, energy consumption, and emissions increase. On the contrary, when this area is destined for commercial or office use (this value is only significant for emissions), energy consumption and emissions decrease, so that the home would be more sustainable. The analysis also indicates that when dwellings belong to multi-family buildings, energy consumption and emissions are lower. This is also the case if the number of dwellings that make up the buildings is observed. The higher the number of dwellings in a building, the lower the energy consumption and emissions of the individual dwellings. This is probably because the multi-family typology variable is related to the number of dwellings in the building. On the other hand, the results also indicate that the more elements that form part of the dwelling, the higher the levels of energy consumption and emissions it will have. However, if we look at the size measured per m2, the results show that an increase in size has a less than proportional increase in energy consumption and emissions. Finally, if the contextual and location variables are analyzed, it is observed that energy consumption and emissions are lower in Valencia and that dwellings on the coast (zone B3) are more energy sustainable than dwellings in inland areas (zones C1, C2, D1, and E1). The fact that, on the coast, by climatic zone, consumption is lower, but high-high clusters appear, could indicate that the existence of rebound effects or the presence of a short-stay tourist housing market. Similarly, the presence of low-low clusters in the metropolitan areas of the two main cities (Castellón and València) could corroborate the theory that cities create an ecosystem of efficiency in different aspects, including energy efficiency and sustainability.
Author Contributions
All authors contributed equally to this work. All authors wrote, reviewed, and commented on the manuscript. All authors have read and agreed to the published version of the manuscript.
Funding
This research received no external funding.
Acknowledgments
We acknowledge the EEC register of the Generalitat Valenciana (IVACE-Energía) for data provision.
Conflicts of Interest
The authors declare no conflict of interest.
References
- IEA. Global Status Report for Buildings and Construction 2019; International Energy Agency: Paris, France, 2019. [Google Scholar]
- Taltavull, P.; Juárez, F.; Monllor, P. Fuel Poverty: Evidence from Housing Perspective. Ssrn Electron. J. 2016. [Google Scholar] [CrossRef]
- IPPC. Climate Change 2014: Mitigation of Climate Change. Contribution of Working Group III to the Fifth Assessment Report of the Intergovernmental Panel on Climate Change; Cambridge University Press: Cambridge, UK; New York, NY, USA, 2014. [Google Scholar]
- Brounen, D.; Kok, N. On the economics of energy labelling in the housing market. J. Environ. Econ. Manag. 2011, 62, 166–179. [Google Scholar] [CrossRef]
- Fuerst, F.; McAllister, P.; Nanda, A.; Wyatt, P. Does energy efficiency matter to home-buyers? An investigation of EPC ratings and transaction prices in England. Energy Econ. 2015, 48, 145–156. [Google Scholar] [CrossRef]
- Cajias, M.; Fuerst, F.; Bienert, S. Are energy efficiency ratings ignored in the german housing market? Evidence from a large-sample hedonic study. Working Paper, July 2016. [Google Scholar] [CrossRef]
- Taltavull, P.; Pérez-Sánchez, V.R.; Mora-García, R.T.; Pé rez-Sánchez, J.C. Green Premium Evidence from Climatic Areas: A Case in Southern Europe, Alicante (Spain). Sustainability 2019, 11, 686. [Google Scholar] [CrossRef]
- Estiri, H. Building and household X-factor and energy consumption at the residential sector. A structural equation analysis of the effects of household and building characteristics on the annual energy consumption of US residential buildings. Energy Econ. 2014, 43, 178–184. [Google Scholar] [CrossRef]
- Brounen, D.; Kok, N.; Quigley, J.M. Residential energy use and conservation: Economics and demographics. Eur. Econ. Rev. 2012, 56, 931–945. [Google Scholar] [CrossRef]
- Adan, H.; Fuerst, F. Do energy efficiency measures really reduce household energy consumption? A difference-in-difference analysis. Energy Effic. 2015. [Google Scholar] [CrossRef]
- Banfi, S.; Farsi, M.; Filippini, M.; Jakob, M. Willingness to pay for energy-saving measures in residential buildings. Energy Econ. 2008, 30, 503–516. [Google Scholar] [CrossRef]
- Ma, Z.; Cooper, P.; Daly, D.; Ledo, L. Existing building retrofits: Methodology and state-of-the-art. Energy Build. 2012, 55, 889–902. [Google Scholar] [CrossRef]
- Ewing, R.; Rong, F. The impact of urban form on US residential energy use. Hous. Policy Debate 2008, 19, 1–30. [Google Scholar] [CrossRef]
- Chong, H. Building vintage and electricity use: Old homes use less electricity in hot weather. Eur. Econ. Rev. 2012, 56, 906–930. [Google Scholar] [CrossRef]
- Estiri, H. A structural equation model of energy consumption in the United States: Untangling the complexity of per-capita residential energy use. Energy Res. Soc. Sci. 2015, 6, 109–120. [Google Scholar] [CrossRef]
- Karatasou, S.; Laskari, M.; Santamouris, M. Determinants of high electricity use and high energy consumption for space and water heating in European social housing: Socio-demographic and building characteristics. Energy Build. 2018, 170, 107–114. [Google Scholar] [CrossRef]
- Hojjati, B.; Wade, S.H. U.S. household energy consumption and intensity trends: A decomposition approach. Energy Policy 2012, 48, 304–314. [Google Scholar] [CrossRef]
- Global Alliance for Buildings and Construction; International Energy Agency; United Nations Environment Programme. 2019 Global Status Report for Buildings and Construction: Towards a Zero-Emission, Efficient and Resilient Buildings, and Construction Sector; GlobalABC: Berlin, Germany, 2019. [Google Scholar]
- Hyland, M.; Lyons, R.; Lyons, S. The value of domestic building energy efficiency: Evidence from Ireland. Energy Econ. 2013, 40, 943–952. [Google Scholar] [CrossRef]
- Tadeau, S.F.; Alexandre, R.; Tadeu, A.; Antunes, C.H. A comparison between cost optimality and return on investment for energy retrofit in buildings—A real options perspective. Sustain. Cities Soc. 2016, 21, 12–25. [Google Scholar] [CrossRef]
- Hong, S.H.; Oreszczyn, T.; Ridley, I. The impact of energy efficient refurbishment on the space heating fuel consumption in English dwellings. Energy Build. 2006, 38, 1171–1181. [Google Scholar] [CrossRef]
- Scheer, J.; Clancy, M.; Hógáin, S.N. Quantification ofenergy savings from Ireland’s home energy saving scheme: An ex post billing analysis. Energy Effic. 2013, 6, 35–48. [Google Scholar] [CrossRef]
- Wyatt, P. A dwelling-level investigation into the physical and socio-economic drivers of domestic energy consumption in England. Energy Policy 2013, 60, 540–549. [Google Scholar] [CrossRef]
- Dovjak, M.; Shukuya, M.; Olesen, B.W.; Krainer, A. Analysis on exergy consumption patterns for space heating in Slovenian buildings. Energy Policy 2010, 38, 2998–3007. [Google Scholar] [CrossRef]
- Wilson, C.; Dowlatabadd, H. Model of decision-making and residential energy use. Annu. Rev. Environ. Resour. 2007, 169–203. [Google Scholar] [CrossRef]
- Chan, S. Spatial lock-in: Do falling house prices constrain residential mobility? J. Urban Econ. 2001, 49, 567–586. [Google Scholar] [CrossRef]
- Druckman, A.; Jackson, T. Household energy consumption in the UK: A highly geographically and socio-economically disaggregated model. Energy Policy 2008, 36, 3177–3192. [Google Scholar] [CrossRef]
- Chevan, A. Family growth, household density, and moving. Demography 1971, 451–458. [Google Scholar] [CrossRef]
- O’Neill, B.C.; Chen, B.S. Demographic determinants of household energy use in the United States. Popul. Dev. Rev. 2002, 28, 53–88. [Google Scholar]
- Kelly, S. Do homes that are more energy efficient consume less energy? A structural equation model of the English residential sector. Energy 2011, 5610–5620. [Google Scholar] [CrossRef]
- Tonn, B.; Eisenberg, J. The aging US population and residential energy demand. Communication. Energy Policy 2007, 35, 743–745. [Google Scholar] [CrossRef]
- Brandon, G.; Lewis, A. Reducing household energy consumption: A qualitative and quantitative field study. J. Environ. Psychol. 1999, 19, 75–85. [Google Scholar] [CrossRef]
- Kahn, M.E. The environmental impact of suburbanization. J. Policy Anal. Manag. 2000, 19, 569–586. [Google Scholar] [CrossRef]
- Santamouris, M.; Kapsis, K.; Korres, D.; Livada, I.; Pavlou, C.; Assimakopoulos, M.N. On the relation between the energy and social characteristics of the residential sector. Energy Build 2007, 39, 893–905. [Google Scholar] [CrossRef]
- Santin, O.G. Behavioural patterns and user profiles related to energy consumption for heating. Energy Build. 2011, 43, 2662–2672. [Google Scholar] [CrossRef]
- Lutzenhiser, L. A cultural model of household energy consumption. Energy 1992, 47–60. [Google Scholar] [CrossRef]
- Bourassa, S.; Hoesli, M.; Peng, V. Do housing submarkets really matter? J. Hous. Econ. 2003, 12, 12–28. [Google Scholar] [CrossRef]
- Bourassa, S.; Cantoni, E.; Hoesli, M. Spatial Dependence, Housing Submarkets, and House Prices Prediction. J. Real Estate Financ. Econ. 2007, 35, 143–160. [Google Scholar] [CrossRef]
- Bourassa, S.; Cantoni, E.; Hoesli, M. Predicting House Prices with Spatial Dependence: A Comparison of Alternative Methods. J. Real Estate Res. 2010, 32, 139–160. [Google Scholar]
- Blázquez, L.; Heimsch, F.; Filippini, M. The Economic Crisis and Residential Electricity Consumption in Spanish Provinces: A Spatial Econometric Analysis. SSRN Electron. J. 2013. [Google Scholar] [CrossRef]
- Bottero, M.; Bravi, M.; Dell’Anna, F.; Mondini, G. Valuing buildings energy efficiency through Hedonic Prices Method: Are spatial effects relevant? J. Valori E Valutazioni 2018, 21, 27–39. [Google Scholar]
- Rosenow, J. Energy savings obligations in the UK—A history of change. Energy Policy 2012, 49, 373–382. [Google Scholar] [CrossRef]
- Eichholtz, P.; Kok, N.; Quigley, J. The economics of green building. Rev. Econ. Stat. 2013, 95, 50–63. [Google Scholar] [CrossRef]
- Schuler, A.; Weber, C.; Fahl, U. Energy consumption for space heating of West-German households: Empirical evidence, scenario projections and policy implications. Energy Policy 2000, 28, 877–894. [Google Scholar] [CrossRef]
- Mora García, R.T. Explanatory Model of the Variables Involved in the Quality of the Built Environment of Cities. Ph.D.Thesis, University of Alicante, San Vicente del Las Spec, Spain, 2016. [Google Scholar]
- Anselin, L. Spatial econometrics in practice: A review of software options. Reg. Sci. Urban Econ. 1992, 22, 509–536. [Google Scholar] [CrossRef]
- Fregonara, E.; Rolando, D.; Semeraro, P. Energy Performance Certificates in the Turin real estate market. J. Eur. Real Estate Res. 2017, 10, 149–169. [Google Scholar] [CrossRef]
- Fuerst, F.; Shimizu, C. Green Luxury Goods? The Economics of Eco- Labels in the Japanese Housing Market. J. Jpn. Int. Econ. 2016. [Google Scholar] [CrossRef]
- Hirsch, J.; Lafuente, J.J.; Recourt, R.; Spanner, M.; Geiger, P.; Haran, M.; McGreal, S.; Davis, P.; Taltavull, P.; Perez, R.; et al. Stranding Risk & Carbon. Science-Based Decarbonising of the EU Commercial Real Estate Sector; CRREM Report No.1; CRREM: Wörgl, Austria, 2019. [Google Scholar]
Publisher’s Note: MDPI stays neutral with regard to jurisdictional claims in published maps and institutional affiliations. |
© 2020 by the authors. Licensee MDPI, Basel, Switzerland. This article is an open access article distributed under the terms and conditions of the Creative Commons Attribution (CC BY) license (http://creativecommons.org/licenses/by/4.0/).

