Article

The Impact of Online Computer Assisted Learning at Home for Disadvantaged Children in Taiwan: Evidence from a Randomized Experiment

1
Center for Experimental Economics in Education, Shaanxi Normal University, Xi’an 710119, China
2
School of Big Data Management, Soochow University, Taipei 111002, Taiwan
3
Institute of Sociology, Academia Sinica, Taipei 11529, Taiwan
4
Rural Education Action Program, Freeman Spogli Institute for International Studies, Stanford University, Palo Alto, CA 94305, USA
5
LinkedIn Corporation, 222 2nd Street, San Francisco, CA 94105, USA
*
Authors to whom correspondence should be addressed.
Sustainability 2020, 12(23), 10092; https://doi.org/10.3390/su122310092
Submission received: 22 September 2020 / Revised: 29 November 2020 / Accepted: 1 December 2020 / Published: 3 December 2020

Abstract

:
In Taiwan, thousands of students from Yuanzhumin (aboriginal) families lag far behind their Han counterparts in academic achievement. When they fall behind, they often have no way to catch up. There is increased interest among both educators and policymakers in helping underperforming students catch up using computer-assisted learning (CAL). The objective of this paper is to examine the impact of an intervention aimed at raising the academic performance of students using an in-home CAL program. According to intention-to-treat estimates, in-home CAL improved the overall math scores of students in the treatment group relative to the control group by 0.08 to 0.20 standard deviations (depending on whether the treatment was for one or two semesters). Furthermore, Average Treatment Effect on the Treated analysis was used for solving the compliance problem in our experiment, showing that in-home CAL raised academic performance by 0.36 standard deviations among compliers. This study thus presents preliminary evidence that an in-home CAL program has the potential to boost the learning outcomes of disadvantaged students.

1. Introduction

The education of the poor and disadvantaged populations has been a long-standing challenge for education systems in both developed and developing countries [1,2,3,4]. From the national level, when the proportion of the labor force with a relatively high level of education is low, economic growth is slowed down [5,6], which is not conducive to the country’s long-term and stable development [7]. In addition, international literature suggests that the education gap among vulnerable and better-off groups will lead to long-term differences in human capital accumulation [8,9,10] and income level among the population [11,12], with implications for growth and social stability.
Despite high levels of educational attainment and economic development in Taiwan, China, there is a “development gap” between aboriginal Taiwanese (primarily living in rural areas; henceforth Yuanzhumin) students and Han students (primarily living in urban areas). According to the economics literature, Yuanzhumin families are more likely than Han families to be under the official poverty line [13,14,15,16]. In terms of academic achievement, Yuanzhumin students score significantly lower than Han students, and evidence indicates that the gap in educational achievement is growing wider [17,18,19].
The existing literature offers various explanations for the Yuanzhumin–Han achievement gap. First, rural Yuanzhumin students tend to have low-quality facilities and teachers. Recent economic growth and investments have improved Yuanzhumin’s living and educational standards to narrow the gap in the quality of facilities and teachers, but there remains a clear disparity [20]. Additionally, Yuanzhumin students are more likely to have less-educated primary caregivers: 60.8% of Yuanzhumin students are left-behind children raised by their grandparents or relatives, many of whom have low levels of education [21]. Even among children whose parents remain at home, their education levels are often too low to help with their children’s classes and assignments. Third, worse health outcomes, higher rates of alcohol addiction, and domestic violence continue to beset Yuanzhumin areas, issues that are likely related to the persistent poverty in those communities [22].
While there may be many reasons why Yuanzhumin students disproportionately struggle in school, two major reasons might be that they lack the motivation to learn and that they lack access to remedial resources that normally help struggling students get back on track [23]. For example, when Han students fall behind academically, their families and schools tend to employ at least one of several strategies to improve their grades such as teacher-provided tutoring sessions, guidance from highly-educated parents [24,25], and private cram schools [26,27]. Unfortunately, these opportunities for remedial education are not readily available to Yuanzhumin students. First, both Yuanzhumin students and their teachers often live far away from school and leave immediately after the school day ends, thus precluding the possibility of after-school tutoring. Next, a combination of high levels of parental out-migration and low levels of parental educational attainment leave Yuanzhumin students unable to rely on parental tutoring. Finally, persistent poverty in Yuanzhumin families renders private remedial cram schools or commercial tutoring services unaffordable.
In light of these challenges, researchers around the world have explored other ways to deliver remedial tutoring to at-risk populations. In-school computer-assisted learning (CAL) interventions, which use educational software to enhance learning through computerized instruction, drills, and exercises [28,29,30,31] have been used as an alternative to traditional tutoring in both developed and developing countries [32,33,34]. CAL uses computer software as a medium to offer students remedial learning materials in the form of interesting interfaces and games with the aims of improving academic performance as well as raising interest in learning [35,36]. CAL is sometimes regarded as a form of computer-based tutoring (CBT) [37].
Studies of in-school CAL interventions in both developed and developing contexts have shown that CAL can positively impact academic performance. Escueta et al. (2017) have conducted a broad review of the literature on CAL and identified 29 randomized controlled trials (RCTs) of CAL experiments in developed countries, among which 20 experiments resulted in positive impacts on student learning outcomes [37]. CAL programs seem to be particularly effective at improving student math performance [38,39,40,41,42,43]. For example, a study found that a CAL intervention in Chicago schools improved math scores on state-administered standardized tests by 0.17 SD [33]. It also appears that CAL can also be effective in developing countries. A study in India found that the use of CAL had a positive impact on academic performance, with significant impacts shown to persist at least a year after the end of the program [32]. CAL interventions have also been conducted in rural China, and there is rigorous evidence showing that CAL improves not only math performance, but also Chinese language and English performance among students [44,45,46,47,48,49,50]. Further evidence in rural China shows that when CAL is conducted online, it is even more effective than offline CAL in improving student’s English scores [51].
While there is strong evidence for the effectiveness of CAL, most of these programs have been implemented in schools, and it is unclear whether other settings might be similarly effective or more effective. Implementing a CAL program outside of school might be advantageous in poor communities for several reasons. First, in-school CAL generally requires teachers to set aside time for students to use school computers labs. Because of this, in-school CAL may displace other student activities, which could thereby have unintended negative effects on students. While in-school CAL interventions may improve student academic performance, it is unknown whether there are negative spillover effects on other subjects that might ultimately receive less class time. Another disadvantage of in-school CAL is that some schools with low budgets may not have a sufficient number of working computers to carry out the intervention.
In-home CAL may offer solutions to some of the drawbacks of in-school CAL. First, it does not crowd out other school subjects, nor does it require teachers to spend additional time during the school week scheduling and monitoring sessions in the computer lab. Second, assuming that students have access to a computer or tablet at home and are allowed to use it, in-home CAL does not put an extra burden on schools that may lack the technological infrastructure to carry out such interventions. In-home CAL may be particularly relevant in the era of COVID-19, when home-schooling has become the norm [52,53,54]. In the transition to online learning triggered by pandemic, it is of great importance and special significance to study how to effectively carry out distance learning.
To our knowledge, the impact of CAL in an in-home setting has never been empirically evaluated. In addition, there is little empirical evidence on whether CAL programs are effective in improving the quality of academic learning of primary students in the context of Taiwan. Finally, while the effectiveness of CAL has been demonstrated among Han populations, there has been very little research on ways to improve educational outcomes among the Yuanzhumin minority group [55].
Thus, this paper examines whether in-home CAL can improve the educational performance of Yuanzhumin students in Taiwan. To answer this question, we have three objectives. First, we utilize an intention-to-treat analysis (using a randomized controlled trial) to calculate the impact of an in-home CAL intervention on the math performance of Yuanzhumin students. Second, we examine the nature of compliance at home, including how compliance differs across different subgroups of students. Third, we investigate the impacts of CAL among students who comply.
To meet these objectives, we present the results of an RCT on an in-home CAL intervention involving 1539 fourth and fifth grade students across 84 Yuanzhumin schools in Taiwan. Despite relatively low compliance, our results show that the intervention still improved the standardized math scores of the overall sample by 0.08 SD after one semester and 0.20 SD after two semesters. When examining the intervention’s effects on compliers, we found that impacts were even larger (0.15 to 0.36 SD).
The rest of the paper is organized as follows. The next section briefly lays out the context of the study, including the study’s research design, sampling, intervention, data collection, and statistical approach. The subsequent sections then present the results and discuss the findings.

2. Materials and Methods
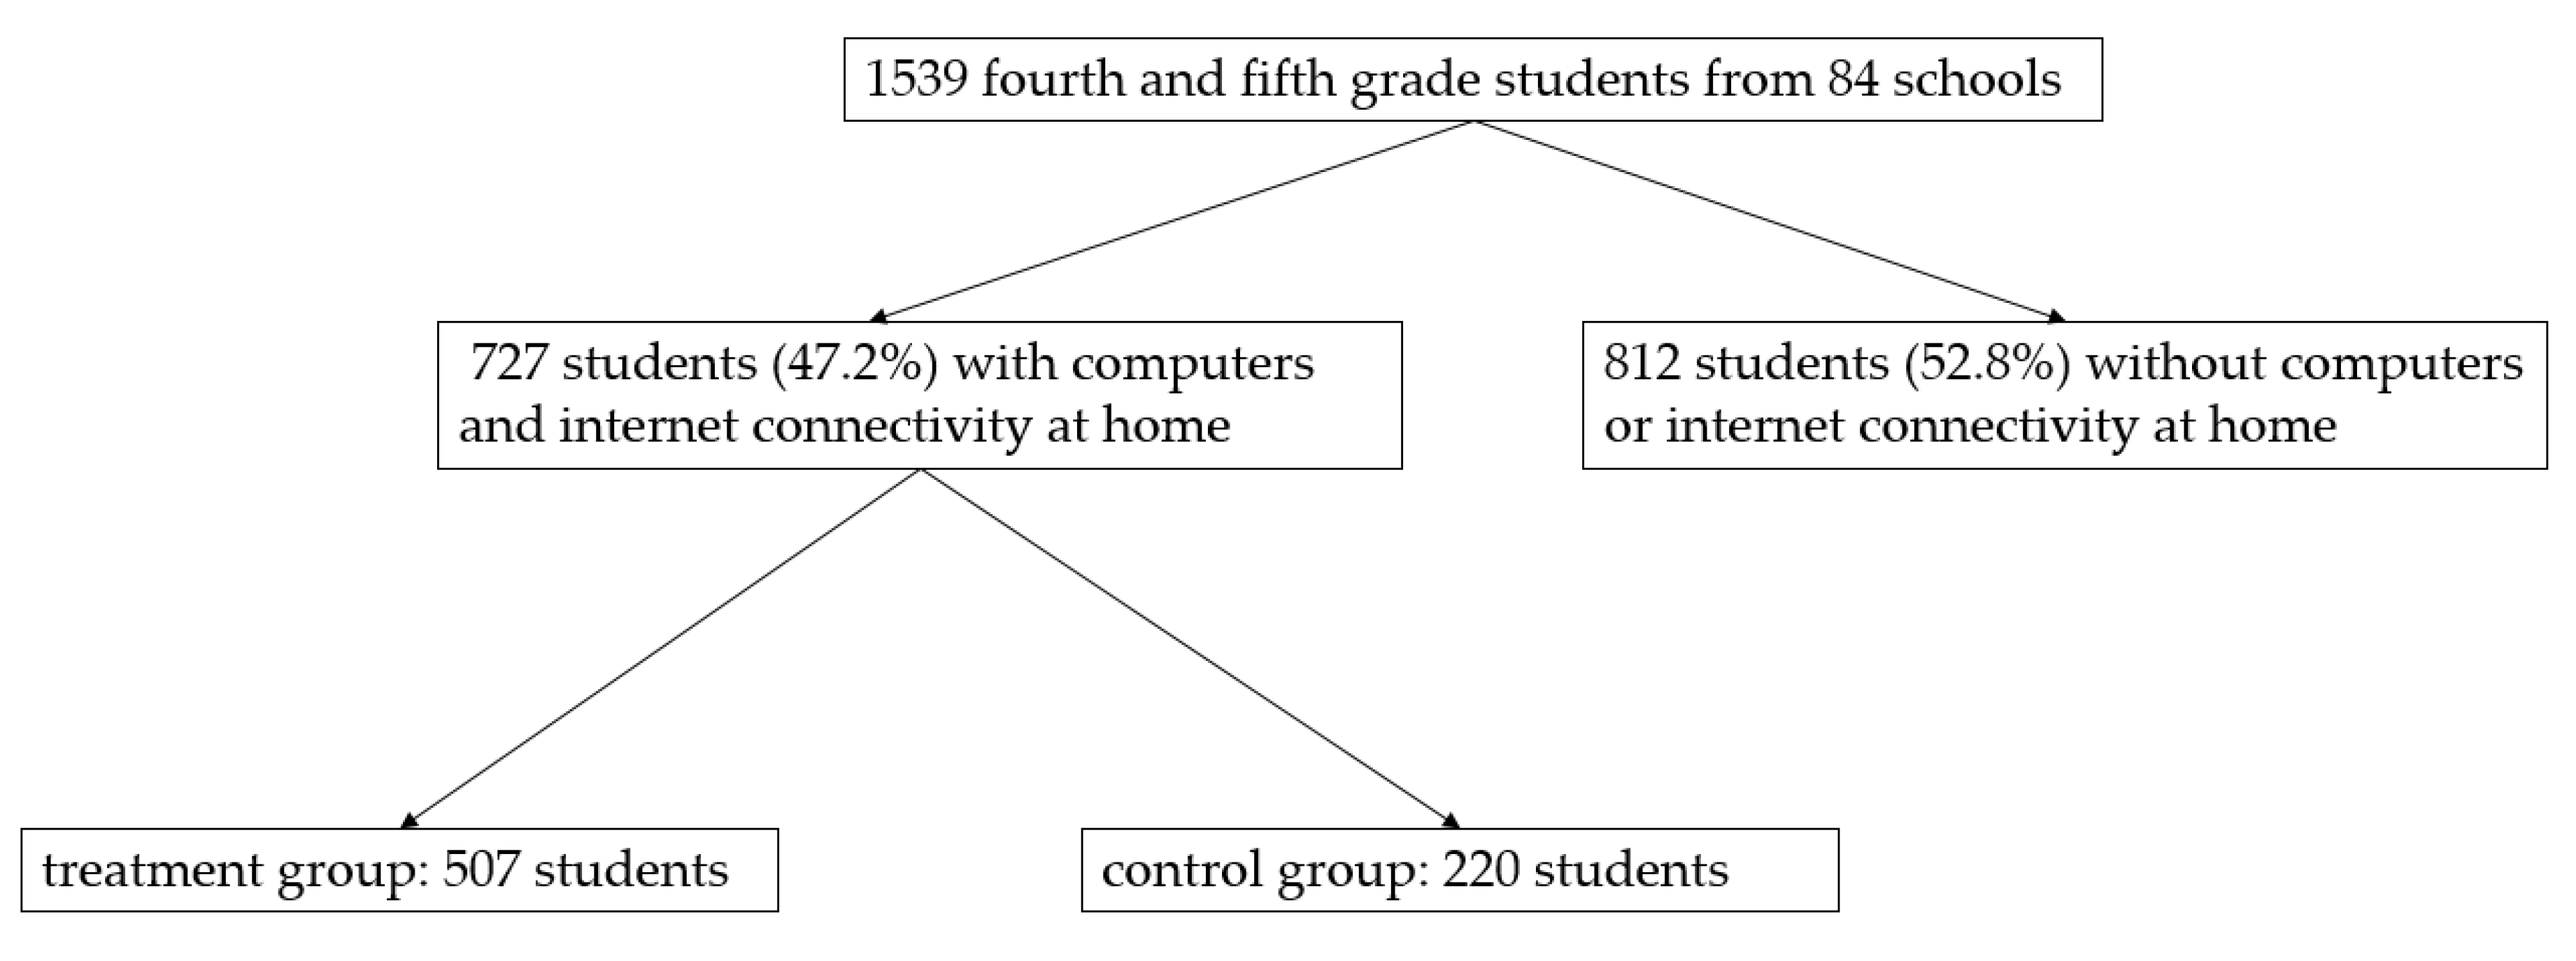
2.1. Sampling

Our sample was restricted to Yuanzhumin students. Yuanzhumin predominately live in the mountainous regions of Taiwan, especially in the central part of the territory. According to official statistics, their population was 504,531 (2.1% of Taiwan’s total population) in 2009 and rose to over 550,000 in 2019 (2.37% of Taiwan’s total population) [56,57].
We followed four steps to choose our sample. First, we selected the sample counties. Four counties that have large numbers of Yuanzhumin residents—Hualien, Taitung, Pingtung, and Kaohsiung—were randomly selected to be included in our sampling frame.
Second, after choosing the counties, we chose the sample schools. In order to know the appropriate sample size to identify program effects, we performed power calculations, assuming a standardized effect size of 0.20 SD for the outcome variable, 0.80 power, a 5% significance level, an intra-cluster correlation (ICC) of 0.1, and a pre- and post-intervention correlation of 0.5. We also assumed that there were 20 observations in each cluster, on average. Based on these assumptions, we calculated that we needed a total of 84 schools. From comprehensive school lists obtained from each county’s local education bureau, we narrowed down to a shortlist of schools that met the following criteria: (1) A majority of students were Yuanzhumin; and (2) the school was located in a rural area. We then selected 84 schools at random from the remaining pool of eligible schools to be a part of the program sample.
Third, we selected the fourth and fifth grade classes in each sample school to participate in the experiment. We chose fourth and fifth graders because research suggests that standardized math tests become a reliable way to assess student academic performance once they are in the middle stage of elementary school [58,59]. Moreover, when conducting previous studies, we found that students in grades four and five are old enough to reliably understand and answer the questions asked in demographic questionnaires, which allows for easier data collection. This resulted in an initial sample of 1539 fourth and fifth grade students from 84 schools.
Finally, to select our final sample, we conducted a preliminary survey in two counties in February of 2016 and then in the remaining two counties in March of 2016 to understand the extent of computer ownership among selected student households. Based on the results of this survey, as showed in Figure 1, we determined that 727 students in our sample (47.2%) had computers and internet connectivity at home, and 812 students (52.8%) did not. Those 727 students with computers and Internet at home made up our final sample.

2.2. Randomization and Attrition

Of the final sample frame of 727 students, we randomly assigned 507 students to the treatment group and 220 students to the control group as showed in Figure 1. Our randomization process successfully created a balanced sample across the treatment and control groups. To show this, we use a set of student and school characteristics to look for significant differences between the groups. In doing so, we display the mean and standard deviation of each variable of baseline characteristics in Table 1. Table 1 demonstrates the mean of students’ characteristics in the treatment group and the control group. The results show that none of the variables are significantly different between the groups except for father’s education level, which allows us to assume that the sample is reasonably balanced (Table 1).
Although the core sample at the baseline survey included a total of 727 students, there was some attrition by the end of the study. For various reasons (including school transfers, extended absences due to illness or injuries, and unwillingness to participate in the endline survey due to rejection from parents and teachers), by the time of the evaluation survey, we followed up with 452 students: 342 students in the treatment group and 110 students in the control group (Table 2, column 3). This resulted in a relatively large attrition rate of 37%.
In order to check the balance between treatment group and control group in the endline, we conducted three kinds of Ordinary Least Squares (OLS) regression on differences between attrited students and non-attrited students (Table 2, column 1), between treatment students and control students before attrition (Table 2, column 2), and between treatment students and control students after attrition (Table 2, column 3). When comparing the attrited and non-attrited students, there were only two significant differences: Attrited students were more likely to be boys and to have fathers who were not Yuanzhumin. There was no significant difference between the baseline math test scores of attrited and non-attrited students, and it appears that the math scores are unrelated to the assignment of the CAL intervention (Table 2, column 1). There were also no significant imbalances between the treatment and control groups among these variables before attrition and after attrition (Table 2, columns 2 and 3). The OLS regression result has proved that sample lost still did not change the random allocation of our sample, and before the intervention, the treatment group and control group were almost same. Thus, we believe it is unlikely that attrition reduced the validity of our research design or biased our results though the attrition rate was large.

2.3. Experimental Intervention

After executing the baseline survey, we launched the intervention in February and March of 2016. All students in the treatment group participated in the same intervention. The intervention involved computer-assisted math remedial tutoring sessions designed to complement the regular in-class math curriculum for the spring 2016 semester.
There were two general stages of the intervention. First, program teachers (who were trained by the study team) in each school guided treatment group students in how to use the CAL software learning math at home. To do this, program teachers organized hands-on tutorial sessions in the school computer rooms where students could login to the CAL software using private accounts. By following their teacher’s instructions and referring to a standardized training manual, students were taught how to use the CAL software at home. These tutorial sessions were mandatory with the teacher supervisors taking attendance. To avoid influence from teachers that might confound our estimation of the effect of the intervention, teacher-supervisors were neither math teachers nor the homeroom teachers of the students.
Second, students were asked to log onto the CAL software at home and complete one 60-min CAL session per week. During each session at home, treatment students played animation-based math games designed to help students review and practice the basic math material taught in their regular school math classes. The content of each session—practice questions and interactive games—was exactly same for every student in the treatment group and emphasized basic competencies in the CAL math curriculum in Taiwan. In short, the material was remedial in nature, as it was based on the material in student textbooks that was taught in school in that same week. The teachers and families of students had no discretion regarding what material was reviewed in the CAL sessions.
When playing the games, the students first worked out the solutions with pencils/pens on scratch paper and then submitted them on the CAL platform. As students used CAL at home, if a student had a math-related question, he/she was unable to discuss the solutions with his/her classmates. The students were not supposed to consult their families or their teacher-supervisors. After the students had completed a round of exercises, the computer software displayed the correct answers and solutions of each question so that they could study and solve the problem by themselves or with aid of CAL. According to our protocol, the teachers were to remind students to use CAL once per week and to only advise on internet connectivity issues and software operations, but they could not be involved in any other way.
Students that were assigned to the control group did not receive any CAL intervention. Following the protocol, they were not allowed to access the CAL software, and even they didn’t know the CAL program and had no individual account. To our knowledge, no student in the control group used the CAL software during the duration of the experiment.

2.4. Data Collection

Our study included a total of three waves of data collection. The first-wave survey was a baseline survey in March 2016 (at the beginning of the spring semester) for all fourth and fifth graders in the 84 schools before any implementation of an in-home CAL program had begun. The second-round survey was a midline evaluation survey conducted in September 2016 after one semester of the CAL intervention. The third-wave survey was a final evaluation survey conducted at the end of the program in March 2017, coinciding with the end of the two semesters of the CAL intervention.
In each round of data collection, the enumeration team visited each school and conducted a two-block survey. In the first block, students were given a standardized math test. The math test included 29–32 questions (tests in different rounds included slightly different numbers of questions), and test questions were pulled from official examination books and exercise books with the help of local educational experts (including university faculty and school teachers). Students were required to finish the test within 30 min. Our enumeration team proctored the test, strictly enforced the time limits, and patrolled the classroom to ensure there was no cheating. Student scores on these math tests were used in the analysis as measures of student academic performance.
In the second block, enumerators collected data on the characteristics of students and their families. The demographic and socioeconomic data included records of each student’s age, gender, whether their father or mother is Yuanzhumin, their father’s education level, and their mother’s education level. To create indicators of parental care, the students were also asked during the survey whether they lived with either of their parents for most of the time during the semester (living with father and/or living with mother). We also collected data on family asset value (collected via a checklist of high-value common household goods), whether the student is the only child in the family, and whether any family member ever helps tutor the child in doing their homework.

2.5. Statistical Methods

In recent years, randomized evaluations, also called randomized controlled trials (RCTs), have gained increasing prominence as a tool for measuring impact in social science. The 2019 Nobel Memorial Prize in Economics, to J-PAL co-founders Abhijit Banerjee and Esther Duflo, and longtime J-PAL affiliate Michael Kremer, was awarded in recognition of how this research method has transformed the field of social policy and economic development [60]. Our research design imitates the RCT implementation method, including three main steps. First, the baseline survey was carried out to obtain the basic information of the students’ academic performance and control variables. Secondly, the treatment/intervention group and the control group were randomly assigned with a well-balance check to implement in-home CAL in the treatment group and not in the control group. Finally, the follow-up survey was carried out like the baseline survey. If there is a significant increase or difference between the treatment group and the control group in the follow-up survey, the effect can be attributed to the CAL intervention. This is the core of RCT evaluation. This paper imitates the principle to carry on the analysis.
To estimate the change in academic outcomes in the treatment group relative to the control group, we ran an Ordinary Least Squares (OLS) model, regressing the academic outcome variables (i.e., post-program outcome value) on the baseline value of the outcome variable and a dummy variable of the treatment (CAL intervention) status, controlling for a set of control variables. As randomization was conducted within schools, we also controlled for school fixed effects to disentangle the systematic within-school differences between the treatment and control classes in yis and to obtain an unbiased estimate of the genuine treatment effect of the CAL intervention. We included control variables to improve the efficiency of the estimation. In all regressions, we constructed Huber–White standard errors (relaxing the assumption that disturbance terms were independent and identically distributed within schools) to account for the clustered nature of our sample.
To be specific, our model is:
yis = α + β·treatment + ss + θ·y0is + γ·Xis + εis
where yis is the endline (or midline in some cases) outcome variable for student i in school s, treatment is a dummy variable for whether the student was assigned to the treatment group (equal to one for students in the treatment group and zero otherwise), ss is the vector of school fixed effects, y0is is the pre-program (baseline) outcome value for student i in school s, Xis is a vector of additional control variables, and ɛis is a random disturbance term.
The outcome variable of our analysis is student academic outcome, measured by student standardized math test score. The variables in Xis are student and family characteristics (female, age, whether father or mother is Yuanzhumin, father has at least a high school degree, mother has at least a high school degree, living with father and living with mother, family asset value, whether the student is the only child in the family, whether any family member helps tutor homework) and whether the student had access to a computer before the program started (ever used a computer). By construction, β equals the average within-school difference in yis between the treatment and control groups conditional on y0is (i.e., β measures the within-school difference in changes in the outcome variable between the treatment and control groups over the program period). As the CAL intervention was randomly assigned within schools, β is an unbiased estimate of the effect of being assigned to the treatment group (i.e., the effect of the CAL intervention, or the CAL treatment effect). Because of the inclusion of Xis as additional control variables, β is an unbiased, efficient estimate of the CAL treatment effect.

3. Results

In this section we seek to understand how in-home CAL improved the educational performance of children. To do this, we first use intention-to-treat (ITT) analysis to calculate the impact of home-based CAL intervention on students’ mathematics scores of Yuanzhumin students. Second, we examine the nature of student compliance to the interventions and compare the compliance of different subgroups of students. Third, we investigate the impact of CAL among the compliant students.

3.1. Impact of the in-Home CAL Intervention on Student Performance Using Intention-to-Treat Analysis

We first report the intention-to-treat (ITT) results of the effects of the intervention [61,62]. ITT analysis is based on the initial treatment assignment and not on the treatment eventually received and is intended to avoid various misleading artifacts that can arise in intervention research, such as non-random attrition of participants from the study or crossover. ITT is also simpler than other forms of study design and analysis because it does not require observation of compliance status for individuals assigned to different treatments or incorporation of compliance into the analysis.
The OLS regression analyses show that the estimated ITT effects on math test scores after one semester are equal to 0.08 SD (Table 3, row 1, column 3). Although this effect size is not statistically significant, considering that the program running for one semester, it is in line with the findings of other CAL evaluations of similar intervention periods [32,33,48]. Based on Lat et al., (2015), the positive effect of most CAL interventions on math test scores occurs in the first two months of the program [48]. Since in-home CAL started in March, its effect reached 0.08 SD quickly after one semester. The possible reason is that the students became interested in this new and interesting way of learning through computer software, and the students gradually improved their knowledge of math [34,47].
Furthermore, we find that the effect persisted over the two semesters of the intervention, as shown in Table 3, row 1, column 6. The impact over the full intervention period on math scores was 0.20 SD, significant at the 5% level. Both the unadjusted model and adjusted model show that the estimate of the in-home CAL impact was estimated to be 0.22 SD and 0.20 SD, which were significant at the 10% level and 5% level (Table 3, row 1, columns 5 and 6). This effect size is comparable to studies of in-school CAL performed in other contexts [30,32,51]. This result is consistent with an interpretation that computer-assisted learning programs might have the same effect at home as well as in school. As some literature notes, computer-assisted learning requires four elements: hardware (computers), software (CAL package), curriculum (exercises that are consistent with the progress of the textbook), and a good implementation protocol [44,46,49]. All four elements of computer-assisted learning at home are applied as in school, and the results were almost the same with those carried out in schools.
It is possible, however, that the ITT results do not accurately convey the impact for students who complied. If a considerable share of the students did not comply, the ITT results may be understating the effect of the in-home CAL program for compliers. If we want to understand the full potential effects of this treatment, it is necessary to analyze the program compliance and estimate the Average Treatment Effects on the Treated (ATT).

3.2. Compliance Problems

There are a number of issues that may arise during the implementation of even the best-designed RCT. It is important, then, to be prepared and include plans to mitigate or control various risks. Uptake rates can sometimes be lower than expected, and this can have consequences on the effect size (and, following that, on the statistical power). It is worth noting that the relationship between uptake and power is exponential: A 50% drop in effect size will require a four-fold increase in sample size to achieve the same power. Another issue which can compromise an RCT’s estimates is non-compliance by program participants. That is, while individuals may be assigned to treatment or control groups, these assignments cannot always be monitored or controlled. Non-compliance, then, can threaten the integrity of the randomization if individuals are able to self-select into groups. While non-compliance can never be totally eliminated, it can be minimized.
Ensuring compliance may be particularly challenging in the case of in-home programs. In traditional in-school CAL programs, teachers manage student compliance by overseeing attendance and monitoring progress during each CAL session, which may lead to higher compliance rates. However, unlike in-school CAL, in-home CAL is designed to be carried out by the students themselves, without supervision. Although the teachers were instructed to remind students to use CAL every week, neither our program team nor the teachers had an effective way to monitor whether the students actually used CAL or not.
In this experiment, we define compliance as the following: If a particular student had logged onto the CAL platform in any of the 12 months of the program, we regard him/her as compliant; if not, we regard him/her as non-compliant. In order to observe the student compliance rate, we used the administrative system built into the CAL software to monitor student compliance with the program on a monthly basis. We find that the compliance rate started high, but decreased over the course of the program. In the first month after the implementation of CAL, 74% of the students in the treatment group had logged onto the platform. As shown in Table 4, 35.4% of the treatment group students (121 students) were non-compliers, and 64.5% (221 students) were compliers according to our definition.
To examine correlates with compliance, we compare the characteristics of the students who had complied and those who had not. Table 4 reveals the differences between compliant and non-compliant students. First, we find that math test scores (including baseline tests, midline tests, and endline tests) have a positive relationship with compliance, indicating that academically stronger students were more likely to use the CAL program. Second, girls showed a higher compliance rate than boys. Two other correlates of compliance were whether the father is Yuanzhumin and the father’s education level: Children whose fathers were not Yuanzhumin and had a lower education level were more likely to comply. The other student characteristics were not associated with compliance, such as whether their parents were at home, mother’s education level, whether the students have siblings, and whether the students have family members to help with their homework. In summary, then, the compliance correlates suggest that compliers were more likely to be academically strong, female, and to have fathers who were not Yuanzhumin and had lower education levels.

3.3. Impact of the in-Home CAL Intervention on Student Performance Using Average Treatment Effects on the Treated Analysis

To examine the Average Treatment Effects on the Treated (ATT), the method of instrumental variables (IV) is used to estimate the impact, as the treatment was not successfully delivered to every participant in this randomized experiment [63,64]. Two-stage least squares (2SLS) can be used as a computational method to calculate IV estimates. In this experiment, whether the student logged onto CAL is the endogenous variable and the assignment treatment is the IV. The first-stage regression Equation is as follows:
l o g _ y e s o r n o = γ + δ · t r e a t m e n t + u
The fitting value l o g _ y e s o r n o ^ of regression in the first stage is exogenous, so log_yesorno is replaced by l o g _ y e s o r n o ^ , and second stage regression of OLS can be used to get a consistent estimation:
y i = α + β · l o g y e s o r n o + ^ ( ε i + β · u i ^ ) + γ · X _ i s
According to the ATT analysis, we find there are significant impacts (Table 5). Based on the results produced by estimating these two equations, we find that the CAL program is effective in raising test scores after one semester. Specifically, the CAL treatment raised test scores by 0.16 SD (column 1, row 1). After controlling for our set of specified covariates, the impact is similar (0.15 SD—column 2, row 1).
Moreover, the results from estimating the ATT model finds that the CAL program was consistently effective after two semesters. The coefficient on the CAL treatment is positive in the unadjusted equation (0.28 SD—column 3, row 1) and it is both positive and significant when controlling for covariates (0.36 SD, significant at the 5% level—column 4, row 1).
These results convey that compliance increased the impact of the intervention. Indeed, the ATT effects increased the ITT effects by about 100% or more. Compared to one-year evaluations of in-school CAL, these effect sizes are on the upper end in terms of magnitude [25,27,29]. Similar studies have shown that in computer-game based learning, if students can use and immerse themselves in a game-based learning environment, it is beneficial to stimulate students’ learning motivation and thus improve their academic performance [65]. Another study shows that the effect of learning by computer at home is related to the learning environment and self-regulation at home [66]. Those who are compliers in this paper are students with higher scores, and their self-regulation and learning enthusiasm are higher than those with relatively lower scores, which can be one of the explanations for why the impact of in-home CAL using ATT achieved higher than that of using ITT.

4. Conclusions

In this paper we present the results from a randomized field experiment on an in-home CAL program involving 1539 students in fourth and fifth grade. The main intervention was an in-home CAL remedial tutoring program for math. Our results indicate that in-home CAL had significant positive effects on math performance. Weekly in-home CAL math sessions increased student standardized test scores by 0.08 to 0.20 SD. Because overall compliance was low, we conducted an ATE (average treatment effect on treated) analysis, which showed that in-home CAL had a larger impact—ranging from 0.15 to 0.36 SD—when limiting the scope of analysis to compliers. The ATT findings are on par with most previous evaluations of in-school CAL performed in developing contexts [25,27,29,44,45,46,47,48].
This paper contributes in several ways to our understanding of CAL’s potential impact in Taiwan, China. First, we are the first to measure the effect of an in-home CAL intervention on learning outcomes among an underserved population in a developing context. While the program appears to be effective, there were still serious compliance issues. Further investigation is required in order to ascertain reasons for the low compliance, which could provide a roadmap for how to increase compliance with similar interventions.
Our results also show that in-home CAL may be a practical option (relative to in-school CAL) for policymakers looking to use educational technology to help narrow educational disparities. Based on our analysis, in-home CAL was able to achieve similar impacts as in-school CAL in spite of low compliance rates. Education policymakers in Taiwan who are considering implementing large-scale CAL programs might consider in-home CAL as a feasible option [67,68,69,70]. This policy implication is particularly timely in the era of COVID-19 and may also apply in other developing countries, as well as in underserved communities in developed countries [71].
In sum, this paper demonstrates that in-home CAL programs could be used as a complementary input to existing educational resources and has the potential to help disadvantaged populations and ultimately narrow education achievement gaps.

Author Contributions

Writing—original draft and visualization, B.T.; data curation, methodology, and investigation, T.-T.T.; Investigation and project administration, C.-I.W.; resources and supervision, Y.M.; formal analysis and supervision, D.M.; project administration and investigation, W.-T.H.; conceptualization, writing—review and editing, and funding acquisition, S.R. All authors have read and agreed to the published version of the manuscript.

Funding

The authors would like to acknowledge the funding support from the Fundamental Research Funds for the Central Universities (Grant No. 2017CBY017), 111 Project (Grant No. B16031) and China Scholarship Council.

Acknowledgments

The authors gratefully thank all participants in collecting the data, show appreciation to reviewers who have given many useful feedbacks on revision, and thank Cody Abbey for helping improve the paper in many aspects.

Conflicts of Interest

The authors declare no conflict of interest. The founding sponsors had no role in the design of the study; in the collection, analyses, or interpretation of data; in the writing of the manuscript, and in the decision to publish the results.

References

  1. Silver, P.; Silver, H. The Education of the Poor: The History of the National School 1824–1974; Routledge: London, UK, 2013. [Google Scholar]
  2. Hanushek, E.A.; Woessmann, L. The Knowledge Capital of Nations: Education and the Economics of Growth; MIT press: Cambridge, MA, USA, 2015. [Google Scholar]
  3. Hanushek, E.A.; Woessmann, L. Education and economic growth. In Economics of Education; Elsevier: Amsterdam, The Netherlands, 2010; pp. 60–67. [Google Scholar]
  4. Glewwe, P.; Muralidharan, K. Improving education outcomes in developing countries: Evidence, knowledge gaps, and policy implications. In Handbook of the Economics of Education; Elsevier: Amsterdam, The Netherlands, 2016; Volume 5, pp. 653–743. [Google Scholar]
  5. Lutz, W.; Cuaresma, J.C.; Sanderson, W. The demography of educational attainment and economic growth. Population 2008, 25, 15–19. [Google Scholar] [CrossRef]
  6. Goetz, S.J.; Hu, D. Economic growth and human capital accumulation: Simultaneity and expanded convergence tests. Econ. Lett. 1996, 51, 355–362. [Google Scholar] [CrossRef]
  7. Khor, N.; Pang, L.; Liu, C.; Chang, F.; Mo, D.; Loyalka, P.; Rozelle, S. China’s looming human capital crisis: Upper secondary educational attainment rates and the middle-income trap. China Q. 2016, 228, 905–926. [Google Scholar] [CrossRef]
  8. Londoño, J.L.; World Bank. Poverty, Inequality, and Human Capital Development in Latin America, 1950–2025; The World Bank: Washington, DC, USA, 1996. [Google Scholar]
  9. Kim, J.Y. The human capital gap: Getting governments to invest in people. Foreign Aff. 2018, 97, 92. [Google Scholar]
  10. Li, H.; Loyalka, P.; Rozelle, S.; Wu, B. Human capital and China’s future growth. J. Econ. Perspect. 2017, 31, 25–48. [Google Scholar] [CrossRef] [Green Version]
  11. Wang, Y.; Li, H. An Empirical Study on the Impact of Educational Gap on Income Gap. In Proceedings of the 2017 International Conference on Education Science and Economic Management (ICESEM 2017), Xiamen, China, 14–15 October 2017; Atlantis Press: Beijing, China, 2017. [Google Scholar]
  12. Coady, D.; Dizioli, A. Income inequality and education revisited: Persistence, endogeneity and heterogeneity. Appl. Econ. 2018, 50, 2747–2761. [Google Scholar] [CrossRef]
  13. Kuan, D.D.D.W. Multiculturalism and Indigenous Peoples. In Multiculturalism in East Asia: A Transnational Exploration of Japan, South Korea and Taiwan; Rowman & Littlefield: Lanham, MD, USA, 2016; p. 203. [Google Scholar]
  14. Cheng, S.Y.; Jacob, W.J. American Indian and Taiwan Aboriginal education: Indigenous identity and career aspirations. Asia Pac. Educ. Rev. 2008, 9, 233–247. [Google Scholar] [CrossRef]
  15. Huang, T.H.; Liu, Y.C. Science education curriculum development principles in Taiwan: Connecting with aboriginal learning and culture. Eurasia J. Math. Sci. Technol. Educ. 2016, 13, 1341–1360. [Google Scholar]
  16. Chen, S. Dawning of hope: Practice of and reflections on indigenous teacher education in Taiwan. Policy Futures Educ. 2016, 14, 943–955. [Google Scholar] [CrossRef]
  17. Chou, C.J.; Chen, K.S.; Wang, Y.Y. Green practices in the restaurant industry from an innovation adoption perspective: Evidence from Taiwan. Int. J. Hosp. Manag. 2012, 31, 703–711. [Google Scholar] [CrossRef]
  18. Liao, C.W.; Cheng, P.W. Longitudinal Study of Economically Disadvantaged Student’s Learning Attitude and Academic Performance. J. Educ. Pract. Res. 2019, 32, 71–105. [Google Scholar]
  19. Chen, H.J. A cumulative family risk index model: Delinquency and academic performance among Han Chinese and Native Taiwanese students. Int. Soc. Work 2019, 62, 1245–1259. [Google Scholar] [CrossRef]
  20. Reid, J.A.; Green, B.; Cooper, M.; Hastings, W.; Lock, G.; White, S. Regenerating rural social space? Teacher education for rural—Regional sustainability. Aust. J. Educ. 2010, 54, 262–276. [Google Scholar] [CrossRef] [Green Version]
  21. Hung, H.C.; Young, S.S.C.; Lin, C.P. No student left behind: A collaborative and competitive game-based learning environment to reduce the achievement gap of EFL students in Taiwan. Technol. Pedagag. Educ. 2015, 24, 35–49. [Google Scholar] [CrossRef]
  22. Chen, J.K.; Wei, H.S. School violence, social support and psychological health among Taiwanese junior high school students. Child Abus. Negl. 2013, 37, 252–262. [Google Scholar] [CrossRef]
  23. Chiu, J. Enhancing indigenous Taiwanese children’s cultural attitudes and cultural knowledge in English by Culturally Responsive Pedagogy. Asian J. Appl. Linguist. 2015, 2, 102–114. [Google Scholar]
  24. Guo, Y.; Chen, Q.; Zhai, S.; Pei, C. Does private tutoring improve student learning in China? Evidence from the China Education Panel Survey. Asia Pac. Policy Stud. 2020, 7, 322–343. [Google Scholar] [CrossRef]
  25. Mo, D.; Bai, Y.; Shi, Y.; Abbey, C.; Zhang, L.; Rozelle, S.; Loyalka, P. Institutions, implementation, and program effectiveness: Evidence from a randomized evaluation of computer-assisted learning in rural China. J. Dev. Econ. 2020, 146, 102487. [Google Scholar] [CrossRef]
  26. Kim, J.H.; Chang, J. Do governmental regulations for cram schools decrease the number of hours students spend on private tutoring? KEDI J. Educ. Policy 2010, 7, 3–21. [Google Scholar]
  27. Liu, J.; Bray, M. Determinants of demand for private supplementary tutoring in China: Findings from a national survey. Educ. Econ. 2017, 25, 205–218. [Google Scholar] [CrossRef]
  28. Rouse, C.E.; Krueger, A.B. Putting computerized instruction to the test: A randomized evaluation of a “scientifically based” reading program. Econ. Educ. Rev. 2004, 23, 323–338. [Google Scholar] [CrossRef] [Green Version]
  29. Fairlie, R.; Loyalka, P. Schooling and Covid-19: Lessons from recent research on EdTech. NPJ Sci. Learn. 2020, 5, 13. [Google Scholar] [CrossRef] [PubMed]
  30. Ma, Y.; Fairlie, R.W.; Loyalka, P.; Rozelle, S. Isolating the “Tech” from EdTech: Experimental Evidence on Computer Assisted Learning in China (No. w26953); National Bureau of Economic Research: Cambridge, MA, USA, 2020.
  31. Bettinger, E.; Fairlie, R.W.; Kapuza, A.; Kardanova, E.; Loyalka, P.; Zakharov, A. Does Edtech Substitute for Traditional Learning? Experimental Estimates of the Educational Production Function (No. w26967); National Bureau of Economic Research: Cambridge, MA, USA, 2020.
  32. Banerjee, A.V.; Cole, S.; Duflo, E.; Linden, L. Remedying education: Evidence from two randomized experiments in India. Q. J. Econ. 2007, 122, 1235–1264. [Google Scholar] [CrossRef]
  33. Barrow, L.; Markman, L.; Rouse, C.E. Technology’s edge: The educational benefits of computer-aided instruction. Am. Econ. J.-Econ. Policy 2009, 1, 52–74. [Google Scholar] [CrossRef]
  34. Muralidharan, K.; Singh, A.; Ganimian, A.J. Disrupting education? Experimental evidence on technology-aided instruction in India. Am. Econ. Rev. 2019, 109, 1426–1460. [Google Scholar] [CrossRef] [Green Version]
  35. Inal, Y.; Cagiltay, K. Flow experiences of children in an interactive social game environment. Br. J. Educ. Technol. 2007, 38, 455–464. [Google Scholar] [CrossRef] [Green Version]
  36. Schaefer, S.; Warren, J. Teaching computer game design and construction. Comput.-Aided Des. 2004, 36, 1501–1510. [Google Scholar] [CrossRef]
  37. Escueta, M.; Quan, V.; Nickow, A.J.; Oreopoulos, P. Education Technology: An Evidence-Based Review (No. w23744); National Bureau of Economic Research: Cambridge, MA, USA, 2017.
  38. Beal, C.; Hauk, S.; Harrison, C.; Li, W.; Schneider, S.A. Randomized Controlled Trial (RCT) Evaluation of a Tutoring System for Algebra Readiness; University of Arizona: Tucson, AZ, USA, 2013. [Google Scholar]
  39. Karam, R.; Pane, J.F.; Griffin, B.A.; Robyn, A.; Phillips, A.; Daugherty, L. Examining the implementation of technology-based blended algebra I curriculum at scalable. Educ. Technol. Res. Dev. 2017, 65, 399–425. [Google Scholar] [CrossRef]
  40. Kelly, K.; Heffernan, N.; Heffernan, C.; Goldman, S.; Pellegrino, J.; Goldstein, D.S. Estimating the Effect of Web-Based Homework. In Proceedings of the International Conference on Artificial Intelligence in Education, Memphis, TN, USA, 9–13 July 2013; pp. 824–827. [Google Scholar]
  41. Singh, R.; Saleem, M.; Pradhan, P.; Heffernan, C.; Heffernan, N.; Razzaq, L.; Dailey, M. Improving K-12 Homework with Computers. In Proceedings of the Artificial Intelligence in Education Conference, Auckland, New Zealand, 28 June–2 July 2011; pp. 328–336. [Google Scholar]
  42. Snipes, J.; Huang, C.W.; Jaquet, K.; Finkelstein, N. The Effects of the Elevate Math Summer Program on Math Achievement and Algebra Readiness; REL 2015-096; U.S. Department of Education, Institute of Education Sciences, National Center for Education Evaluation and Regional Assistance, Regional Educational Laboratory West: Washington, DC, USA, 2015.
  43. Hegedus, S.J.; Dalton, S.; Tapper, J.R. The impact of technology-enhanced curriculum on learning advanced algebra in US high school classrooms. Educ. Technol. Res. Dev. 2015, 63, 203–228. [Google Scholar] [CrossRef]
  44. Mo, D.; Huang, W.; Shi, Y.; Zhang, L.; Boswell, M.; Rozelle, S. Computer technology in education: Evidence from a pooled study of computer assisted learning programs among rural students in China. China Econ. Rev. 2015, 36, 131–145. [Google Scholar] [CrossRef]
  45. Mo, D.; Swinnen, J.; Zhang, L.; Yi, H.; Qu, Q.; Boswell, M.; Rozelle, S. Can one-to-one computing narrow the digital divide and the educational gap in China? The case of Beijing migrant schools. World Dev. 2013, 46, 14–29. [Google Scholar] [CrossRef]
  46. Mo, D.; Zhang, L.; Luo, R.; Qu, Q.; Huang, W.; Wang, J.; Qiao, Y.; Matthew, B.; Rozelle, S. Integrating computer-assisted learning into a regular curriculum: Evidence from a randomised experiment in rural schools in Shaanxi. J. Dev. Eff. 2014, 6, 300–323. [Google Scholar] [CrossRef]
  47. Bai, Y.; Mo, D.; Zhang, L.; Boswell, M.; Rozelle, S. The impact of integrating ICT with teaching: Evidence from a randomized controlled trial in rural schools in China. Comput. Educ. 2016, 96, 1–14. [Google Scholar] [CrossRef]
  48. Lai, F.; Luo, R.; Zhang, L.; Huang, X.; Rozelle, S. Does computer-assisted learning improve learning outcomes? Evidence from a randomized experiment in migrant schools in Beijing. Econ. Educ. Rev. 2015, 47, 34–48. [Google Scholar] [CrossRef]
  49. Lai, F.; Zhang, L.; Bai, Y.; Liu, C.; Shi, Y.; Chang, F.; Rozelle, S. More is not always better: Evidence from a randomised experiment of computer-assisted learning in rural minority schools in Qinghai. J. Dev. Eff. 2016, 8, 449–472. [Google Scholar] [CrossRef]
  50. Lai, F.; Zhang, L.; Hu, X.; Qu, Q.; Shi, Y.; Qiao, Y.; Matthew, B.; Rozelle, S. Computer assisted learning as extracurricular tutor? Evidence from a randomised experiment in rural boarding schools in Shaanxi. J. Dev. Eff. 2013, 5, 208–231. [Google Scholar] [CrossRef]
  51. Bai, Y.; Tang, B.; Wang, B.; Di Mo, L.Z.; Rozelle, S.; Auden, E.; Mandell, B. Impact of Online Computer Assisted Learning on Education: Evidence from a Randomized Controlled Trial in China; REAP Working Paper; Stanford University: Stanford, CA, USA, 2018. [Google Scholar]
  52. Blok, H. Performance in home schooling: An argument against compulsory schooling in the Netherlands. Int. Rev. Educ. 2004, 50, 39–52. [Google Scholar] [CrossRef] [Green Version]
  53. Murphy, J. The social and educational outcomes of homeschooling. Sociol. Spectr. 2014, 34, 244–272. [Google Scholar] [CrossRef]
  54. Ray, B.D. A systematic review of the empirical research on selected aspects of homeschooling as a school choice. J. Sch. Choice 2017, 11, 604–621. [Google Scholar] [CrossRef] [Green Version]
  55. Yang, Y.; Zhang, L.; Zeng, J.; Pang, X.; Lai, F.; Rozelle, S. Computers and the academic performance of elementary school-aged girls in China’s poor communities. Comput. Educ. 2013, 60, 335–346. [Google Scholar] [CrossRef]
  56. China News. Reported on 15 February 2015. Available online: https://www.chinanews.com/m/tw/2015/02–15/7066990.shtml (accessed on 30 November 2020).
  57. Sohu News. Reported on 30 December 2019. Available online: https://www.sohu.com/a/363662831_416382 (accessed on 30 November 2020).
  58. Firdaus, F.M. Improving Primary Students’ Mathematical Literacy through Problem Based Learning and Direct Instruction. Educ. Res. Rev. 2017, 12, 212–219. [Google Scholar]
  59. Heyder, A.; Weidinger, A.F.; Cimpian, A.; Steinmayr, R. Teachers’ belief that math requires innate ability predicts lower intrinsic motivation among low-achieving students. Learn Instr. 2020, 65, 101220. [Google Scholar] [CrossRef]
  60. Gibson, M.; Sautmann, A. Introduction to Randomized Evaluations. Available online: https://www.povertyactionlab.org/resource/introduction-randomized-evaluations (accessed on 30 November 2020).
  61. McCoy, C.E. Understanding the intention-to-treat principle in randomized controlled trials. West. J. Emerg. Med. 2017, 18, 1075. [Google Scholar] [CrossRef]
  62. White, I.R.; Horton, N.J.; Carpenter, J.; Pocock, S.J. Strategy for intention to treat analysis in randomised trials with missing outcome data. BMJ-Br. Med. J. 2011, 342, d40. [Google Scholar] [CrossRef] [PubMed] [Green Version]
  63. Frölich, M.; Melly, B. Identification of treatment effects on the treated with one-sided non-compliance. Econom. Rev. 2013, 32, 384–414. [Google Scholar] [CrossRef] [Green Version]
  64. Hartman, E.; Grieve, R.; Ramsahai, R.; Sekhon, J.S. From sample average treatment effect to population average treatment effect on the treated: Combining experimental with observational studies to estimate population treatment effects. J. R. Stat. Soc. Ser. A (Stat. Soc.) 2015, 178, 757–778. [Google Scholar] [CrossRef]
  65. Tüzün, H.; Yılmaz-Soylu, M.; Karakuş, T.; İnal, Y.; Kızılkaya, G. The effects of computer games on primary school students’ achievement and motivation in geography learning. Comput. Educ. 2009, 52, 68–77. [Google Scholar] [CrossRef]
  66. Talaee, E.; Sylva, K.; Evangelou, M.; Noroozi, O. Longitudinal impacts of home computer use on primary school children’s reading and mathematics achievement. Int. Electron. J. Elem. Educ. 2018, 11, 125–134. [Google Scholar]
  67. McBride, B.A.; Dyer, W.J.; Liu, Y.; Brown, G.L.; Hong, S. The differential impact of early father and mother involvement on later student achievement. J. Educ. Psychol. 2009, 101, 498. [Google Scholar] [CrossRef] [Green Version]
  68. Prudence, C.C.; Li-Tien, W. Who benefits from the massification of higher education in Taiwan? Chin. Educ. Soc. 2012, 45, 8–20. [Google Scholar] [CrossRef]
  69. Scales, P.C.; Roehlkepartain, E.C.; Neal, M.; Kielsmeier, J.C.; Benson, P.L. Reducing academic achievement gaps: The role of community service and service-learning. J. Exp. Educ. 2006, 29, 38–60. [Google Scholar] [CrossRef]
  70. Yu, W.H.; Su, K.H. Gender, sibship structure, and educational inequality in Taiwan: Son preference revisited. J. Marriage Fam. 2006, 68, 1057–1068. [Google Scholar] [CrossRef]
  71. Martin, S.; Dillon, J.; Higgins, P.; Peters, C.; Scott, W. Divergent evolution in education for sustainable development policy in the United Kingdom: Current status, best practice, and opportunities for the future. Sustainability 2013, 5, 1522–1544. [Google Scholar] [CrossRef] [Green Version]
Figure 1. Sampling and randomization.
Sustainability 12 10092 g001
Table 1. Comparison of the student characteristics between the assigned treatment and control group within baseline students.
Variable Treatment (N = 507) Mean (SD)Control (N = 220) Mean (SD)Difference Between the Treatment and Controlp-Value
Student characteristics
[1]Baseline math score a0.09 (1.09)0.02 (0.92)−0.0620.48
[2]Gender0.49 (0.50)0.46 (0.49)−0.030.42
[3]Age (years)10.6 (0.78)10.6 (0.77)0.020.66
Family characteristics
[4]Father is Yuanzhumin0.62 (0.49)0.69 (0.46)0.070.09
[5]Mother is Yuanzhumin0.62 (0.49)0.66 (0.48)0.040.40
[6]Having computer and internet at home0.99 (0.08)1.00 (0.00)0.010.25
[7]Family asset index0.67 (1.04)0.59 (1.17)−0.090.32
[8]Only child0.08 (0.28)0.09 (0.29)0.010.62
[9]Father with educational years ≥ 9 years0.79 (0.41)0.72 (0.45)−0.07 **0.05
[10]Mother with educational years ≥ 9 years0.78 (0.41)0.74 (0.44)−0.050.17
[11]Father living together0.72 (0.45)0.68 (0.49)−0.050.20
[12]Mother living together0.81 (0.39)0.76 (0.43)−0.050.13
[13]Family tutoring0.62 (0.49)0.60 (0.49)−0.020.63
Source: Authors’ survey. ** significant at 5%; *** significant at 1%. Mean of each variable has been displayed and standard deviations in parentheses. a The standardized baseline math test score is the score on the standardized math test that is given to all sample students before the computer-assisted learning (CAL) program, and it is standardized using the baseline mean and standard deviations for the control group.
Table 2. Ordinary least squares analysis of the differences in student characteristics between the attrited students and non-attrited students, and between the treatment and control students before and after attrition.
Variable Differences between Attrited Students and Non-Attrited StudentsDifferences between Treatment Students and Control Students Before AttritionDifferences between Treatment Students and Control Students After Attrition
[1]Standardized baseline math test score (standard deviation)−0.01 (0.01)0.01 (0.02)0.03 (0.02)
[2]Gender (1 = female; 0 = male)0.04 ** (0.02)0.03 (0.04)0.03 (0.04)
[3]Age (years)−0.02 (0.02)−0.01 (0.03)−0.04 (0.03)
[4]Yuanzhumin_father (1 = father is Yuanzhumin; 0 = father isn’t Yuanzhumin)0.07 ** (0.03)−0.08 * (0.05)−0.08 (0.06)
[5]Yuanzhumin_mother (1 = mother is Yuanzhumin; 0 = mother isn’t Yuanzhumin)−0.04 (0.03)−0.03 (0.04)−0.01 (0.05)
[6]Computer use (1 = ever used computer; 0 = never used computer)−0.13 (0.17)−0.26 (0.29)−0.26 (0.36)
[7]Family asset index−0.01 (0.01)0.02 (0.02)0.01 (0.02)
[8]Only child (1 = yes; 0 = no)−0.01 (0.04)−0.05 (0.07)−0.09 (0.08)
[9]Father has junior high school or higher degrees (1 = yes; 0 = no)0.02 (0.03)0.10 ** (0.05)0.06 (0.05)
[10]Mother has junior high school or higher degrees (1 = yes; 0 = no)−0.01 (0.03)0.06 (0.05)0.06 (0.05)
[11]If father lives at home (1 = yes; 0 = no)0.01 (0.02)0.05 (0.04)0.02 (0.05)
[12]If Mother lives at home (1 = yes; 0 = no)−0.01 (0.03)0.08 * (0.05)0.11 * (0.06)
[13]Any family helps tutor homework (1 = yes;0 = no)0.01 (0.02)0.04 (0.04)0.03 (0.05)
[14]ObservationsN = 727N = 727N = 452
* significant at 10%; ** significant at 5%; *** significant at 1%. Mean of each variable has been displayed, and standard deviations are in parentheses.
Table 3. Ordinary Least Squares estimators of the impacts of the CAL program on student performance (intention-to-treat analysis).
After One Semester After Two Semesters
Math Test Score (1)Math Test Score (2)Math Test Score (3)Math Test Score (4)Math Test Score (5)Math Test Score (6)
(1) Treatment (1 = treatment group; 0 = control group)0.08 (0.08)0.12 (0.08)0.08 (0.08)0.15 (0.10)0.22 *** (0.08)0.20 *** (0.08)
(2) Baseline value of math test score0.54 *** (0.04)0.46 *** (0.04)0.60 *** (0.05)0.40 *** (0.04)0.40 ** (0.04)0.51 *** (0.05)
(3) School dummy variablesNYYNYY
(4) Other control variablesNNYNNY
(5) Observations452452452452452452
(6) R-squared0.320.480.580.180.490.59
Source: Authors’ survey. Robust standard errors in brackets. Each column reports the results of one regression of the student outcome variable (corresponding to the column title) on the treatment dummy variable, controlling for the baseline value of the outcome variable, the school dummy variables, and other control variables. * Significant at 10%. ** Significant at 5%. *** Significant at 1%.
Table 4. Comparison of the student characteristics between compliers and non-compliers in the treatment group (compliers were students who logged in at least once during the 12 months).
Variable ComplianceNon-ComplianceDifference between Non-Compliance and Compliancep-Value
Student characteristics
[1]Standardized baseline math test score (standard deviation)0.24 (1.18)−0.01 (1.00)−0.31 **0.01
[2]Standardized midline math test score (standard deviation)0.27 (0.99)−0.04 (1.05)−0.30 ***0.00
[3]Standardized endline math test score (standard deviation)0.34 (0.97)0.01 (1.02)−0.32 ***0.01
[4]Gender (1 = female; 0 = male)0.55 (0.50)0.46 (0.50)−0.08 *0.10
[5]Age (years)10.62 (0.74)10.60 (0.79)−0.020.79
[6]Yuanzhumin_father (1 = father is Yuanzhumin; 0 = father isn’t Yuanzhumin)0.57 (0.50)0.68 (0.47)0.11 **0.04
[7]Yuanzhumin_mother (1 = mother is Yuanzhumin; 0 = mother isn’t Yuanzhumin)0.61 (0.49)0.63 (0.49)0.010.80
[8]Computer use (1 = ever used computer; 0 = never used computer)1.00 (0.07)1.00 (0.08)−0.000.78
Family characteristics
[9]Family asset index0.74 (0.95)0.59 (1.07)−0.080.44
[10]Only child (1 = yes; 0 = no)0.08 (0.27)0.09 (0.29)0.010.75
[11]Father has junior high school or higher degrees (1 = yes; 0 = no)0.74 (0.44)0.82 (0.39)0.08 *0.06
[12]Mother has junior high school or higher degrees (1 = yes; 0 = no)0.77 (0.42)0.80 (0.40)0.030.55
[13]Father doesn’t live at home (1 = yes; 0 = no)0.70 (0.45)0.75 (0.44)0.040.44
[14]Mother doesn’t live at home (1 = yes; 0 = no)0.81 (0.39)0.83 (0.37)0.020.64
[15]Any family helps tutor homework (1 = yes; 0 = no)0.58 (0.49)0.62 (0.49)0.040.43
[16]Observations221121342
Source: Authors’ survey. * significant at 10%; ** significant at 5%; *** significant at 1%. Robust standard errors in parentheses.
Table 5. Two-stage least squares (2SLS) analysis of the impact of the CAL intervention between the treatment group and the control group (Average Treatment Effects on the Treated analysis).
VariablesAfter One SemesterAfter Two Semesters
(1) Math Score at Midline(2) Math Score at Midline(3) Math Score at Endline(4) Math Score at Endline
[1]login_yesno0.16 (0.16)0.15 (0.17)0.28 (0.17)0.36 ** (0.08)
[2]Math score at baseline0.54 *** (0.11)0.59 ** (0.06)0.40 *** (0.10)0.51 *** (0.05)
[3]Gender (1 = female; 0 = male) 0.09 (0.08) 0.11 (0.09)
[4]Age (years) −0.02 (0.06) 0.03 (0.06)
[5]Yuanzhumin_father (1 = father is Yuanzhumin; 0 = father isn’t Yuanzhumin) −0.20 * (0.11) 0.11 (0.11)
[6]Yuanzhumin_mother (1 = mother is Yuanzhumin; 0 = mother isn’t Yuanzhumin) −0.04 (0.10) −0.15 (0.10)
[7]Computer use (1 = ever used computer; 0 = never used computer) −0.54 (0.35) −0.26 (0.25)
[8]Family asset index 0.07 * (0.04) 0.08 ** (0.04)
[9]Only child (1 = yes; 0 = no) −0.15 (0.14) −0.29 ** (0.15)
[10]Father has junior high school or higher degrees (1 = yes; 0 = no) 0.01 (0.11) 0.07 (0.12)
[11]Mother has junior high school or higher degrees (1 = yes; 0 = no) 0.21 ** (0.10) 0.07 (0.11)
[12]Father doesn’t live at home (1 = yes; 0 = no) 0.04 (0.09) 0.14 (0.10)
[13]Mother doesn’t live at home (1 = yes; 0 = no) −0.12 (0.11) 0.22 * (0.12)
[14]Any family helps tutor homework (1 = yes; 0 = no) 0.01 (0.08) 0.07 (0.09)
[15]School dummies Y Y
[16]Observations452452452452
[17]R-squared0.330.580.180.59
Source: Authors’ survey. * significant at 10%; ** significant at 5%; *** significant at 1%. Robust standard errors in parentheses.
Publisher’s Note: MDPI stays neutral with regard to jurisdictional claims in published maps and institutional affiliations.

