Abstract
In recent years, autonomous vehicles have received increasing attention and many studies in the literature have discussed the potentialities and the opportunities they could offer. Despite the potential benefits, mainly related to the expected reduction in accidents and congestion phenomena as well as the potentially improved social inclusion of people with driving difficulties (e.g., people with physical disabilities or elderly people), many aspects remain to be addressed, mainly for understanding users’ acceptance in the case of collective transport vehicles. This study proposes an analysis based on a survey aimed at exploring user’s preferences with respect to the use of autonomous shuttles (ASs) for tourism purposes. The main correlations between the variables considered and the preferences of potential users have been discussed. Interviewees expressed high confidence in AS technology, although the analyses performed about willingness to pay show that users give more relevance to the provided transport services than the AS technology.
1. Introduction
Since the early 2000s, autonomous vehicles (AV) have emerged as a transformative technology, potentially disrupting the world of mobility and its paradigms. Many research programs and experimental tests have been started, which are developed by both private companies and public institutions—starting in the US [1], and now spreading all over the world and engaging other countries such as Japan, China, Israel and some in Europe [2].
The initial concept of AV has progressively evolved to the one of Connected and Autonomous Vehicle (CAVs), which explicitly takes into account communication and detection issues. Automation is obtained through sensor technologies to monitor the environment and to plan vehicle movements and activities, while connection functions allow communication between vehicles and infrastructure as well as among vehicles, by sharing data such as position, speed, travel time. Automation and related connection are progressively transforming the driver into an observer and controller, by reassigning many of the functions previously performed by the driver to on board artificial intelligence devices [3].
In this emerging scenario, CAVs will likely shape future travel demand [4,5] and influence road design, supply of parking facilities, public transit services and traffic flow dynamics [6,7,8]. Furthermore, some authors argued that CAVs technologies will change not only transportation planning strategies and traveler’s choices, but people’s life style, work and entertainment [9,10]. Consequently, they predict dramatic changes in urban design and spatial structures, re-design of parking lots and roads, different managing strategies for traffic control and road safety issues [11,12,13]. Some studies about connected and autonomous taxi and other on-demand transport services have been carried out to explore the opportunity of integrating CAVs with existing public transport systems [14,15]. Some others explore their potential impacts on day-to-day commuting mobility in urban areas [16,17]. In addition, as CAVs are planned to be electric, some analyses about the positive effects that they might have on the environment, included climate changes, have been proposed [18].
Several functions expected to provide a safe, automated journey are obtained through different levels of interaction between the vehicle and the external environment. Apart from road safety, reliability and efficiency, the aim of the communication function is to guarantee and provide valued services to people on board, such as the opportunity to obtain tourist information, to book attractions or services in real time, as well as to check accommodation availability [19,20]. As for communication types, the Vehicle-to-Everything approach (V2X) is split into different systems: Vehicle to Infrastructure (V2I), Vehicle to Vehicle (V2V), Vehicle to Network (V2N), Vehicle to pedestrian (V2P), Vehicle to Device (V2D) and Vehicle to grid (V2G). The last one is specific to electric cars and their interaction with electric energy provision grids, including recharging systems. The V2X approach is supported by a complex technological system—known in the literature as advanced driver-assistance system (ADAS)—based upon wireless LAN environment, such as camera, Lidar, Radar, motion perception sensors, ultrasounds sensors, inertial sensors, GNSS [21]. To endorse the positive impact of ADAS, in April 2019 the European Parliament approved EU rules requiring life-saving technologies inside vehicles [22]. Safety features such as intelligent speed assistance and advanced emergency-braking systems will have to be installed in new vehicles from May 2022 and from May 2024 for already existing models.
Automation is an ongoing process based on an agenda of goals road-mapped by the International Society of Automotive Engineers (SAE) [23]. Several levels of automation have been set for CAVs, which go from no automation (SAE Level 0) to driver assistance (SAE Level 1), partial (SAE Level 2), conditional (SAE Level 3), high (SAE Level 4), and, ultimately, full automation (SAE Level 5). Major companies are engaged in technological developments orienting research towards ADAS upgrade. It is interesting to note that the automotive industry market has been impacted by new actors, such as Google, Apple and Uber [24], Tesla, NuTonomy, Navya and EasyMile, which offer transport services by autonomous shuttles or taxis. They have also successfully developed experimentations in France in Lyon and Paris (in this latter case, by connecting the Gare d’Austerlitz with the Gare de Lyon), in Germany at Bad Birnbach and Berlin, at La Charité University Hospital Campus. More generally, Europe is increasing the efforts to test autonomous shuttles in real contexts, with more than 57% of projects developed worldwide up to late 2018 [25].
Despite the significant role that CAVs could have to increase road safety and reduce congestion, travel time and transportation costs [26,27], new ethical issues are also arising [28] such as liability in event of crash, cyber security, threat to employment, and privacy [29]. As for tourism purposes, while there are plenty of studies discussing the importance of transportation on tourism demand (for an exhaustive review see [30]), there are few studies in the literature that directly explore tourists’ transportation mode choices [31]. The studies in the literature have found, in general, a different mode choice behavior of travelers for tourist purposes compared to those for systematic journeys. Yang et al. [32] have found that in daily commuting travelers prefer to identify their travel mode after setting their trip chain, while travelers for tourism purposes make first travel mode choices. In addition, elasticity analyses suggest that commuters are relatively more sensitive to the changes in travel monetary costs than to changes in travel time. Tourists, instead, are more sensitive to travel time than travel cost. Some studies emphasize the importance of the quality of information provided to travelers; in particular, the lack of information affects tourists’ public transport use [33]. Furthermore, Kinsella et al. [34] have shown that tourists appreciate the reliability of services as well as the provided information and put less emphasis on service quality and safety, which, on the contrary, are much more relevant for commuters. Finally, according to some results [31,35] age and gender generally play a significant role in tourists’ mode choice.
Most of the existing literature on the possible applications of CAVs for tourism purposes focuses on the impacts potentially generated on the tourism industry as a whole [19], although CAVs could have the chance to be more adaptive for tourists’ needs in comparison to traditional public transport. In fact, CAVs could provide last mile solutions in multi-modal trip chain [36] by increasing the efficiency of connections between transportation nodes (as airports or train stations) and tourists’ relevant destinations. Some studies have highlighted the potential advantages of CAVs in overcoming perceived obstacles and barriers (e.g., difficulty to adapt to different driving rules) related to car rental in foreign countries [19] and in providing greater flexibility for intercity travels [17]. A large number of surveys have also been realized, allowing respondents to compare CAVs with their current transport choices and preferences, in some hypothetical contexts [37,38,39]. A smaller number of studies report the results of surveys resulting from direct experience of CAVs made by users [40].
In such a context, the emergence of CAVs in a multimodal and integrated transportation system requires a careful knowledge of users’ acceptance of AVs and related travel choices. A lot of research has been performed to point out and evaluate the main determinants of users’ intention to use AVs. Some studies are based on questionnaires [40], dealing with socio-demographic variables [41,42], while some others also focus on personal-related attitudes towards technology and service characteristics, such as performance expectancy, safety, and reliability [11]. Under the hypothesis that confidence in technology and perceived usefulness are positively related to attitude as well as intention to use AVs [43], some of the above variables have also been used to analyze AVs adoption in the framework of technology acceptance models (TAM) [44,45]. The TAM approach has been used to investigate and understand how users address new technologies, such as AV. Other contributions to predict the adoption of AVs are grounded on the theory of diffusion of innovation (DOI), often coupled with agent-based modelling, which is based on how an innovation will diffuse as a result of communication and consumer interactions [46]. TAM and DOI research approaches emphasize the user’s subjective attitudes towards new technologies, starting from their beliefs, in terms of perceived usefulness and ease of use, while a research design based on quantitative data collection and statistical analysis by means of factor analysis allows the determination of the impact of various factors on the adoption of AVs. From this perspective, this study means to contribute to the research in this field by providing further analyses for understanding mode choice key drivers of users in a tourism context. In particular, the factors that potentially shape the trust and preferences of tourists towards the use of Autonomous Shuttles (ASs) have been analyzed and discussed.
To these aims, a questionnaire has been designed and a survey has been addressed to the academic community (students, professors, researchers and administrative staff) of the University of Bologna (Italy). The choice of interviewing people within the academic community is based on two main reasons. From one side, people in academic contexts are generally open-minded and ready to accept new technologies and new systems without too many prejudices. From this perspective, the chosen sample would represent a sort of upper bound for the acceptance of such innovative systems. From the other side, such people tend to be informed about the most recent developments of technologies and their related applications, thus making easier the description and understanding of the hypothesized contexts. Moreover, the travel habits of individuals belonging to these ever-changing communities make this type of sample extremely useful to investigate the propensity to use innovative transport systems, especially for reasons other than normal home-to-work commuting. In fact, the transportation and mobility issues of the academic population are more complex than simple commuting, as they include frequent medium-long distance journeys, for example to attend conferences, research project meetings, or for staff exchanges (such as the Erasmus programs in EU) among the others [47]. Then, other than understanding travel behaviors and choices related to home-university commuting trips [48,49,50,51], choices made during medium-long distance journeys—which may be considered in the perspective of “tourism-like” choices—are also worthy of investigation. In the following work, tourism and tourism-like purposes—in the above perspective—will be simply defined as “tourism” purposes.
The paper is organized as follows. Section 2 describes the methodology adopted and the designed questionnaire. Section 3 shows the results of the data analysis and Section 4 reports the description of the principal component analysis (PCA) carried out to reduce the size of the set of considered variables and explore their correlation with the preferences expressed by the interviewees. Section 5 discusses the results obtained and, finally, Section 6 draws the conclusions.
2. Data and Methods
The data used for this study have been obtained by an online survey taken in autumn 2019, designed and proposed to people working and studying at the University of Bologna, in Northern Italy. Participants had been invited by an email reporting information about motivations of the research, data protection and privacy issue statements (i.e., anonymity of the answers). Questions refer to a hypothetical scenario with level 5 full self-driving automated vehicles defined by NHTSA and SAE [23] as follows: “Level 5 AVs are designed to perform all safety-critical driving functions and monitor roadway conditions for an entire trip. Such a design anticipates that the driver will provide destination or navigation input, but is not expected to be available for control at any time during the trip. This includes both occupied and unoccupied vehicles”. The participants of the surveys were informed about a transport system scenario where driverless vehicles are also operating, with connected and autonomous shuttles making short trips (up to 10 km) in urban areas for tourist reasons. Respondents were asked to reveal their willingness to use such vehicles. The proposed shuttle—whose image, referring to existing vehicles already tested by industries, had been included in the questionnaire—had a capacity of 11 seats. The opportunity to benefit from both practical information about available services and specific events or attractions, and historical-tourist information was also included in the questionnaire. Finally, one of the proposed scenarios considered on board stewards in order to encourage the use of such vehicles and support the access to additional tourist services. For some key factors, there could be potential differences between tourism and everyday mobility. To this aim, a few questions have been addressed to explore differences in intention to use for the two aforementioned travel purposes.
The link to the on-line questionnaire was sent to 90,488 students and academic and administrative staff and the response rate was 3%, already cleaned by ambiguous and invalid responses. The response rate was not particularly high, although values below 10% are common in online surveys [52,53], particularly if—as in this case—there are no incentives for respondents to fill in the questionnaire and the response burden is significant [54]. The final sample consists of 2705 respondents, of which 64% were students.
Respondents were asked to assign a score on a scale from 1 to 10 (1: totally disagree–10: totally agree; 6, 7, 8, 9 and 10 express positive attitude) about some proposed statements. The ten-point Likert scale has no neutral point, which, together with the influence of the number of points on the scale, has been subject of debate in the literature [55,56] as to the reliability and consistency of the results. The choice of a 10-point scale—checked by means of internal consistency reliability, as shown in the following—is due to the characteristics of the sample, composed of respondents of a high educational level, which is expected to be more reactive to the several nuances of the proposed contents [56]. Questions refer to three distinct domains: (1) social and demographic characteristics of the respondents (demographics and travel habits); (2) their attitude towards the different dimensions involved in the use of ASs (attitudinal) and (3) the acceptance (Yes or Not) of such systems.
Figure 1 shows the three levels of investigations. First, the responses to the demographics and travel habits and attitudinal items have been analyzed and then they have been used to investigate in detail the acceptance responses.
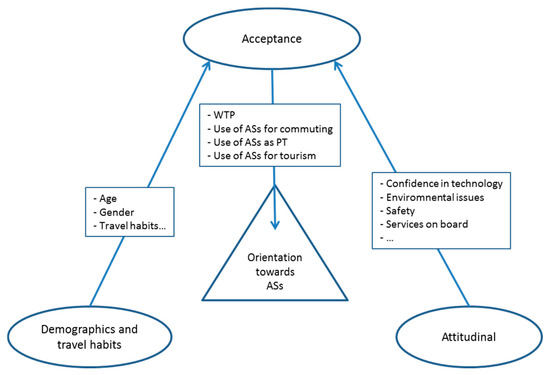
Figure 1.
Methodological framework: question domains and orientation towards Autonomous Shuttles (ASs).
Table 1 summarizes the questions considered in this analysis, grouped by domain of pertinence (demographics and travel habits, attitudinal and acceptance). After some personal details concerning the main characteristics of the respondents, a number of questions have been introduced to understand their attitudes about issues related to autonomous vehicle perception. The items considered are in line with those used in the literature; concerning demographics, income has not been considered, as on average this variable does not show a significant effect on the intention to use ASs [40,57]. As for the education level, it is implicitly expressed by the nature of the sample considered (academic community). As far as attitudinal items are concerned, some of them refer to the reliability of the ASs (such as safety level and control devices) and related level of confidence in such vehicles, including the perceived effects of sharing road infrastructures with non-motorized traffic components (pedestrians and cyclists) and the perceived safety level at given travel speed. Some questions refer to the expected benefits (such as reduction in travel times and costs, environmental gains) and some others to on board characteristics (presence of steward and driver on board) and to the social aspects of sharing the on board space of an autonomous vehicle (such as interaction among travelers). Finally, some questions investigate the ethical aspects (such as risks related to man-machine replacement and privacy issues) and social influence.

Table 1.
Items considered, grouped by domain of pertinence.
Concerning the acceptance domain, three specific questions asked the respondents to indicate their level of acceptance of ASs, particularly how much they like the idea of using such vehicles for public transport in daily life and whether they would use them for tourism purposes. Furthermore, for the transportation system described in the survey, a question investigating the willingness to pay (WTP) has been addressed to respondents in order to know the maximum amount of money they would be willing to spend for a single ride (maximum route length 10 km) on an AS, in a tourist context. The scale is expressed in Euros, at six intervals (<1 €, 1–2 €, 2–4 €, 4–6 €, 6–8 € and >8 €).
3. Analysis of Responses and Results
The answers provided by the 2705 participants have been analyzed to understand the features of the sample. The average age is 36.6 years and the sample is almost gender balanced (52% female and 48% male). A total of 93% of respondents have a driving license. The weekly frequency use of a motor vehicle as a driver, for any purpose, is 2.45 times/week. Moreover, 48% of those who answered the questionnaire are regular cyclists. The Cronbach alpha for the considered items is 0.826, confirming a relatively high level of internal consistency.
Table 2 summarizes the results, in terms of median, mode and upper/lower interquartile range, about the attitudinal items. It is worthwhile to note that the categories in Likert scales have a rank order (1, 2, …, n), but the intervals between values cannot supposed to be uniform. Therefore, the usual measures as mean and standard deviation may not be completely representative for ordinal data [58,59]. As reported in Table 2, respondents gave high ratings to environmental values and generalized transport costs—i.e., they agreed that ASs might reduce pollutant emissions due to vehicular traffic, could help reducing fuel consumption and travel time and could have a positive effect on congestion.
Table 2.
Attitudinal items towards the autonomous shuttles (AS) (median, mode, upper and lower quartiles).
The confidence expressed in the safety level of ASs appears moderate (median 6 and mode 7), while the confidence in the used technology is high, particularly the use of artificial intelligence and its applications. When respondents were asked to express their confidence in the operational context of ASs, the score given to circulation in pedestrian areas is extremely low (median 4), with the majority of respondents showing a total lack of confidence in ASs sharing the way with pedestrians (mode 1). On the contrary, the score given to circulation of ASs on vehicular roads, preferably at low speed (AS speed < 15 km/h, median 8), is higher, while in the case of higher speed there is a greater dispersion of responses (wider interquartile range).
No particular emphasis has been given to ethical aspects concerning job loss risks, while respondents seem more concerned about the possibility that a large use of ASs might reduce funds for traditional public transport (median 6 and mode 10), although with remarkable dispersion. Similarly, respondents have worries about issues related to man-machine replacement.
As for the use of ASs for tourism purposes, the potential users do not have particular preferences for on board stewards, but would appreciate the presence of a driver. Finally, respondents expressed extremely low interest in the social benefits and privacy loss risks that may arise from AS utilization.
As for the acceptance questions, most respondents are in favor of using connected and autonomous shuttles (Figure 2). In particular (Figure 2), 79.6% would use them for tourist purposes and 81% as public transport system in general; the percentage of acceptance reduces in the case of AS use for commuting (63.2%).
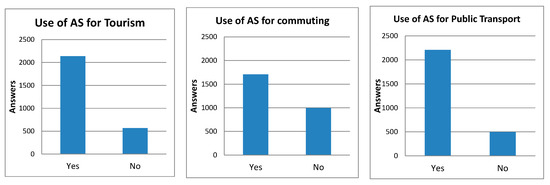
Figure 2.
Intention to use ASs for tourist purposes, for everyday mobility and as a public transport system.
Some analyses have been carried out to evaluate the effect of personal and attitudinal items on acceptance (Table 3); in particular, non-parametric tests (Mann-Whitney test) have been performed to compare differences in the intention of ASs use according to age, gender, and frequency of trips for tourism purposes. Differences in the acceptance of ASs are statistically significant for different age levels (26–45 and 46–65 years) when using ASs for tourism, while age does not seem to play a significant role when using ASs for daily commuting. The results show that the propensity to use ASs for tourism purposes is not influenced by gender, while for daily commuting the differences are statistically significant, i.e., male respondents are much more available to use ASs than female respondents. Finally, as for the effect of the annual frequency of tourism travels on the propensity to use ASs, a high frequency of trips per year generates a statistically significant difference with the intentions of use, as confirmed by the test performed on 0–1 and 4 tourism travels per year.
Table 3.
Age, gender and travel frequency effect on acceptance differences.
As far as willingness to pay (WTP) is concerned, respondents were asked to express the maximum amount of money they would be willing to pay for a single ride (max 10 km length) with the proposed ASs system for tourism purposes. The rating of WTP for a single trip has been expressed by means of a six-point scale (<1 €, 1–2 €, 2–4 €; 4–6 €, 6–8 €, >8 €) as shown in Figure 3. About 75% of the sample are not willing to spend more than €4 for the service. More in detail, most respondents showed a willingness to use the service at rates between 2 € and 4 € (37%), while a further 19% are willing to pay up to 6 €. The number of respondents willing to pay a maximum of 1 € is also significant (20%).
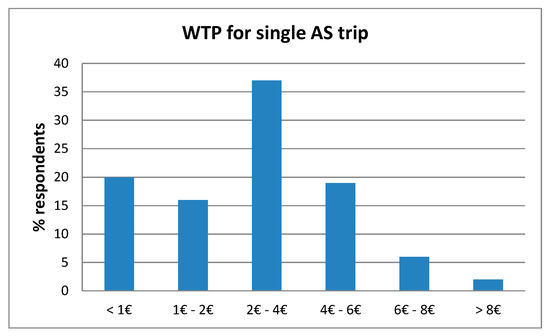
Figure 3.
Willingness to pay.
4. Principal Component and Correlation Analysis
The attitudinal items involve a number of aspects such as confidence towards safety, used technologies, reduction in environmental impacts and transport costs, ethical aspects, privacy risks and other aspects related to the specificity of the considered service, e.g., on board stewards. Such a large dataset makes it difficult to explore the correlations between attitudinal variables and intentions of AS use. For this reason, a Principal Component Analysis (PCA) has been performed in order to reduce the set of variables, by minimizing the information loss at the same time. Preserving as much information as possible leads to the definition of a set of new, uncorrelated variables that are linear functions of the original ones and that still contains most of the information from the initial dataset.
The Kaiser-Meyer-Olkin (KMO) index of sampling adequacy is 0.894, indicating that the data are suitable for factor-analytic purposes.
One of the most critical problems faced in PCA is that of identifying the optimal number of components to retain. In fact, holding too few components could lead to the loss of potentially valuable information contents. A simple and widely applied rule is based on the proportion of the total variance explained by the PCs retained in the model. As shown in the scree-plot (Figure 4), which contains the amount of variance explained by each PC, the first three components alone express more than 50% of the total variance of the original sample. For this reason, they have been retained and treated as three new variables V1, V2 and V3. The internal consistency of the retained PCs has been tested by evaluating the Cronbach’s alpha for each of them, and only items with a weight greater than 0.2 [60] have been considered. For the first three component, we obtained, respectively, alpha = 0.889, 0.751, 0.713. These values are acceptable and confirm that the size reduction in the set of considered items does not significantly reduce the consistency and, therefore, the reliability of the performed analysis.
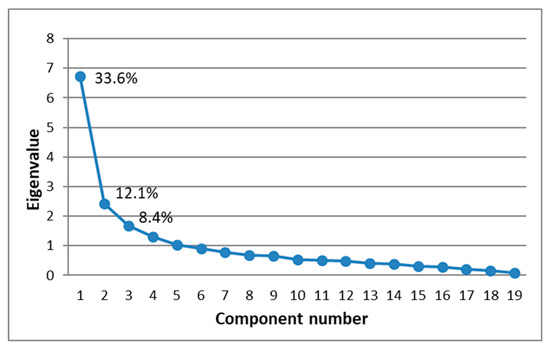
Figure 4.
Scree-plot of eigenvalues of correlation matrix and share of variance explained.
Table 4 contains the variable loadings, which measure the effect of each of the attitudinal items on the principal components. Large and positive loadings indicate that the correlation between the principal component and the related attitudinal item is high and positive (in bold are indicated the most relevant contributions). The first principal component (V1) identifies the confidence of the respondents towards the technology adopted in ASs and its safety. The highest loading (0.877) has been obtained for confidence in sensors; the second-highest loading (0.84) for confidence in technology level and the third-highest (0.83) for safety. It is worthwhile to note that the first principal component is also related to the preference for an on board steward and to the opportunities of social interaction on board. As showed in Table 4, the first component takes into account both intrinsic characteristics (confidence in technology and safety) and the on board opportunities (presence of stewards and socialization) offered by ASs. The second principal component (V2) is mainly linked to respondents’ confidence that ASs might reduce generalized transport costs and environmental impacts. Specifically, the first-highest loading (0.909) has been obtained for confidence in reduction in fuel consumption and the second (0.905) for confidence in reduction in environmental impacts. The third and fourth highest loadings are, respectively, for congestion and travel time reduction. Finally, the third principal component (V3) refers to ethical aspects, represented by job loss risk (load 0.847), risk of public transport funds reduction (load 0.781) and concerns for man-machine replacement (load 0.776).
Table 4.
Component loadings (after varimax rotation).
Table 5 shows the correlation matrix among the three principal components and the three acceptance items (intention of use for different purposes). The principal components are related to the most significant attitudinal items (according to the loadings reported in Table 4), then the correlation matrix summarizes the relationship between the ASs acceptance items and the attitudinal items.
Table 5.
Correlation matrix.
All the correlations among the elements in the correlation matrix are statistically significant at 95%. In detail, V1 has a moderately high correlation value with the propensity to use ASs for tourism purposes. Confidence in safety and technology, associated with the opportunities of socialization and the presence of a steward on board seem therefore to be the characteristics that can stimulate users to adopt these transport solutions for tourism purposes. However, it is important to note that the confidence that ASs can reduce transport costs and pollutant emissions (V2) have a higher correlation with the intention of use for tourism, while the ethical aspects (V3) have a greater relevance in the use for daily commuting.
5. Discussion
The answers provided by the sample of academic community members have been analyzed by explicitly considering the characteristics of such respondents. In fact, they share a medium-high cultural level, a particular propensity for innovation and some travel habits that are not simply based on daily home-to-work and vice versa trips, but often involve long distance travels to attend conferences or to spend periods of time at foreign universities. From this perspective, a particular emphasis has been placed on the use of ASs for tourism purposes (defined here as “tourism-like”), enhancing the peculiar propensity of this sample of respondents for trips that combine study/research reasons with the need to explore cities in contexts that can be largely comparable to tourist ones. With respect to standard tourists, the respondents have a better knowledge—often based on their technical experiences coming from study and research at the University—about autonomous vehicle systems and the several facets and impacts linked to their possible implementation.
As a first result, most of the respondents show a positive attitude towards ASs and, in general, almost 80% would use this transport solution for tourism purposes (Figure 2). By comparing the intention to use ASs for tourism and for other reasons, the percentage of acceptance is lower in the case of assumed use for daily commuting (63%). The latter result is partially in line with the literature [61], i.e., users show more distrust towards ASs when asked to replace their usual transport modes. These results therefore seem to confirm a greater confidence and intention towards the use of ASs for tourist use, rather than for daily commuting.
The analysis of attitudinal items (Table 2) shows a high confidence in the level of technology, while confidence in ASs safety appears moderate. The respondents show instead a considerable belief in the capability of these transport systems to reduce congestion, fuel consumption and environmental impacts. Low confidence is declared with respect to the circulation of autonomous vehicles in pedestrian areas. This is due to the expected interaction between different traffic components, and it is in fact consistent with the moderate confidence in AS safety, which is a more significant issue when several components may interact. At the same time, confidence in the circulation of autonomous vehicles sharing the road with other vehicles at low speed (< 15 km/h) is significantly higher than the confidence expressed when ASs are considered to move at higher speed. Again, this is consistent with trust in ASs under specific conditions, i.e., low or no interactions with other traffic components and moderate travel speed.
Moreover, respondents show little concern towards individual social benefits or privacy risks potentially arising from the use of connected and autonomous vehicles, while more attention seems to be devoted to the ethical issue of man-machine replacement and the potential risks of reducing funding for traditional public transport systems. Regarding social influence, i.e., the perceived impact of ASs use on respondents’ social status, the evidence emerged from this study is partially in contrast with the literature. The works of Sharma et al. [62] and Qu et al. [63] show a significant impact of concerns about the social image on the preference for the use of self-guided vehicles for everyday mobility. However, by considering the features of the sample, the result of this study is consistent with the trust of respondents in the opportunities offered by AS systems in terms of new job opportunities. For example, although drivers will be replaced by autonomous systems, other job opportunities are linked to travel assistant positions (e.g., on board stewards, which have been appreciated by the respondents), while technical and computing competences as well as expertise in system management will be more and more required.
As far as age is concerned, younger respondents (26–45 years old) show a higher propensity to use ASs for tourism. This result is in line with a lot of evidence in the literature on users’ orientation towards autonomous vehicles, as reported by Becker and Axhausen (in their work [16] they report that 6 out of 10 studies confirm a higher propensity of young people to use ASs than older people). This trend fades away in the case of preference for everyday use (see Table 3), and once again there is evidence in the literature [39], reporting a slight propensity of older people to ASs, but accompanied by less confidence in the case of replacement of the usual modes of transport. As far as gender is concerned, men show a greater confidence than women in ASs for public transport and daily mobility (Table 3)—also confirmed by other studies [64]. However, in the case of use for tourism purposes the results obtained in this study shows that this difference vanishes and gender has no significant effect on the acceptance of ASs. Finally, the annual frequency of tourism trips generates significant differences in the propensity to use ASs for this purpose (Table 3), while the other demographic variables and travel habits (driving license holding, frequency of car driving and being a cyclist) have not shown significant effects on the intention to use the ASs.
As regards the willingness to pay for a single trip and tourism purposes (max 10 km length), 38% of respondents declare a willingness to pay no more than 2 €, i.e., comparable to the price of a single ride in a traditional public transport system, while 37% of respondents would use the service at rates between 2 € and 4 €. These results are partly due to the greater presence of students among respondents, a category generally less willing to spend money. In general, it can be said that the results do not show a willingness to pay a price for an AS service that is significantly higher than the average amount paid for services carried out with traditional transport systems. This is partially in line with the results obtained by Chee et al. [65], which found a WTP for automated bus service in urban contexts not higher than the average cost for traditional public transport services for 44% of the respondents in their sample. These results show a considerable confidence of potential users for the technology used in AS, but with regard to the willingness to pay they seem to identify the proposed vehicle more with the service provided than with its inherent technological characteristics. In fact, as already pointed out, respondents give little importance to the image derived from the use of automated vehicles (Table 2).
The PCA analysis shows that the first three components explain a remarkable amount of the overall sample variance. The first component, V1, is correlated with the confidence in technology and the satisfaction of the characteristics of the offered service; the second, V2, is correlated with the confidence that ASs can reduce general transport costs and environmental impacts, while the third, V3, is correlated with ethical aspects (job loss, man-machine replacement, reduction in funds to traditional public transport). The propensity to use ASs is statistically significant in relation to the three principal components (Table 5), however in the case of use for tourism purposes the correlation with V1 is higher than in the case of use for public transport or daily commuting.
The correlations between the propensity to use ASs and V2 and V3 are lower, although significant. In particular, the correlation between the intention to use ASs for tourism or public transport and the confidence that ASs can reduce overall transport costs and pollution (V2) is higher compared to the correlation with risks related to job loss, man-machine replacement, reduction in funds to traditional public transport) (V3). This difference is reversed in the case of intended use for daily commuting (the correlation with V3 is higher than the correlation with V2), suggesting the idea that respondents perceive an AS transport system as something different from a traditional public transport system, at least for everyday commuting purposes.
There is also a higher positive correlation between WTP and V1 than with aspects referring to confidence in technology, safety, sensors, the characteristics of the service and the opportunities offered on board (i.e., presence of steward). Furthermore, there is a strong correlation between WTP and the use of ASs for tourism purposes. Understanding the relationship between willingness to pay and travel purposes is of pivotal importance in planning such type of services.
As final comment, the data used for this analysis refer to 2019, before the emergency caused by the COVID-19 outbreak, which has strongly forced worldwide populations to change their habits since January 2020. Adopted measures based on the need to keep suitable physical distances among persons has strongly affected transport activities, in terms of both vehicles utilization and accessibility to transport nodes (from single bus stops to railway stations and airports). The impact of the COVID-19 pandemic is expected to cause a 37% drop in jobs and 39% in travel and tourism GDP in 2020 [66]. As the worldwide current situation shows, the risk of a virus breakout return is high and, accordingly to this, keeping suitable physical distance is still the main protective measure, since transportation nodes and vehicles are proven to be contexts with a high risk of infection spread [67,68]. There are several reasons that show the potential effects of ASs on infection containment and, more generally, in the management of unforeseen and potentially disruptive situations such as the one currently in progress [69]. Most of the operative functions on AS are automated and integrated in a central processor unit, consequently it is relevant to observe that required health devices such as ventilation control and regulation, personal temperature scans, and limitations on entrance might be easily upgraded. Moreover, ASs can provide on-demand services in a very effective way, thus integrating with traditional public transport services, which is very useful, especially when the need to reduce the number of people on board makes the capacity of traditional systems low and difficult to adapt to the space-time dynamics of transportation demand.
6. Conclusions
The results of the study may support stakeholders and policymakers involved in planning and management of ASs services. In particular, demographic and attitudinal variables that have a significant influence on the preference for the use of ASs for tourism and “like-tourism” purposes have been identified. The sample of potential users used in the analysis is composed of individuals belonging to an academic community and their journeys are usually not limited to systematic home-work trips, but often include long-distance journeys to attend conferences or meetings. The results obtained have been analyzed by considering the specific elements that may emerge from such potential users. People in this context are in fact ready to accept new technologies with less prejudices and greater promptness and elasticity than people in other contexts. Moreover, they are informed people, with a cultural level that allows them to understand the proposed scenarios as correctly as possible.
The analysis of the answers to the questionnaire shows, in general, a positive attitude of the users towards the use of this transport system. The confidence towards the adopted technology is very high, even if concerns emerge in the case of the circulation of ASs in pedestrian areas or, in general, on roads with other traditional vehicles. This last aspect should be taken into account when planning the service, especially if its use is expected in historical centers or densely populated cities. The positive orientation that has emerged towards the expected, positive effects in reducing environmental impacts, fuel consumption and, more generally, congestion should be considered when promoting these transport systems by adopting information campaigns targeted to specific categories of users. In particular, the expected benefits should be clearly demonstrated as people show great confidence in these aspects. As far as demographic variables are concerned, age does not seem to play a different role from that already known from previous studies (young people show higher preference for these transport systems). Conversely, gender, unlike that which emerged in other contexts (men more inclined to use self-driven vehicles), does not seem to be a significant variable when using ASs for tourism purposes.
The principal component analysis has highlighted other remarkable aspects. First, concerns about ethical aspects (job loss, man-machine replacement, diversion of funds from traditional public transport systems) is greater in the case of AS use for everyday mobility than occasional use for tourism purposes. This seems to confirm the hypothesis that users perceive an AS transport system as different from other, traditional, public transport systems. A further relevant element concerns the willingness to pay expressed by potential users. WTP for using ASs for tourism purposes was not high in itself and comparable to the average monetary cost of traditional services—this is partially in line with what emerged in the literature in studies on urban mobility contexts. However, a relevant aspect that emerged here concerns the high and significant positive correlation between WTP and the use of ASs for tourism purposes.
Planning and management of ASs may benefit from the results obtained in this study, particularly as services might be designed in order to suit better the expectations of potential users. In addition, the results obtained might be useful for identifying policies aimed at a greater integration of ASs in urban public transport systems, even in conditions of circulation restrictions such as those caused by the COVID-19 pandemic still in progress.
While this research offers interesting insights, nevertheless there are some aspects worthy of investigation. The first issue, which is common to this type of work, is that the technology on which the questionnaire and the analysis are based (SAE level 5 automation), although existing, is not commercially and effectively available yet, and since the potential users did not practically get to see and use ASs this may have led to biased results. For example, it is possible that the respondents had overestimated positive attitudes and confidence that may have been powered by the fanciful representation of automated vehicles in the media. Another opportunity of improvement and further research, already discussed, is that this survey does not represent the entire population as the sample comes from a relatively close environment, a university; although this allows us to draw interesting insights, related to the intrinsic characteristics of such a sample, future research will necessarily have to consider other layers of society, with different characteristics and expectations. Finally, this work offers some insights, worthy of additional in-depth investigation, on the different mode choice behavior of users when using AVs for tourism or daily mobility.
Author Contributions
Conceptualization, R.B., L.M. and M.N.P.; methodology, R.B., L.M. and M.N.P.; formal analysis, R.B., L.M. and M.N.P.; data curation, R.B., L.M. and M.N.P.; writing—original draft preparation, R.B., L.M. and M.N.P.; writing—review and editing, R.B., L.M. and M.N.P.; supervision, R.B., L.M. and M.N.P. All the authors have contributed equally to this study. All authors have read and agreed to the published version of the manuscript.
Funding
This research has received no external funding.
Conflicts of Interest
The authors declare no conflict of interest.
References
- Burns, L.D. A vision of our transport future. Nature 2013, 497, 181–182. [Google Scholar] [CrossRef] [PubMed]
- West, D.M. Moving forward: Self-Driving Vehicles in China, Europe, Japan, Korea, and the United States; Center for Technology Innovation at Brookings: Washington, DC, USA, 2016. [Google Scholar]
- Lu, N.; Cheng, N.; Zhang, N.; Shen, X.; Mark, W.J. Connected vehicles: Solutions and challenges. IEEE Internet Things J. 2014, 1, 289–299. [Google Scholar] [CrossRef]
- Harper, C.D.; Hendrickson, C.T.; Mangones, S.; Samaras, C. Estimating potential increases in travel with autonomous vehicles for the non-driving, elderly and people with travel-restrictive medical conditions. Transp. Res. Part C Emerg. Technol. 2016, 72, 1–9. [Google Scholar] [CrossRef]
- Litman, T. Autonomous Vehicle Implementation Predictions; Victoria Transport Policy Institute: Victoria, BC, Canada, 2017. [Google Scholar]
- Mahmassani, H.S. 50th anniversary invited article—Autonomous vehicles and connected vehicle systems: Flow and operations considerations. Transp. Sci. 2016, 50, 1140–1162. [Google Scholar] [CrossRef]
- Meyer, J.; Becker, H.; Bösch, P.M.; Axhausen, K.W. Autonomous vehicles: The next jump in accessibilities? Res. Transp. Econ. 2017, 62, 80–91. [Google Scholar] [CrossRef]
- Zhang, W.; Guhathakurta, S. Parking spaces in the age of shared autonomous vehicles: How much parking will we need and where? Transp. Res. Rec. 2017, 2651, 80–91. [Google Scholar] [CrossRef]
- Fagnant, D.J.; Kockelman, K.M. The travel and environmental implications of shared autonomous vehicles, using agent-based model scenarios. Transp. Res. Part C Emerg. Technol. 2014, 40, 1–13. [Google Scholar] [CrossRef]
- Acheampong, R.A.; Cugurullo, F. Capturing the behavioural determinants behind the adoption of autonomous vehicles: Conceptual frameworks and measurement models to predict public transport, sharing and ownership trends of self-driving cars. Transp. Res. Part F Traffic Psychol. Behav. 2019, 62, 349–375. [Google Scholar] [CrossRef]
- Fagnant, D.J.; Kockelman, K. Preparing a nation for autonomous vehicles: Opportunities, barriers and policy recommendations. Transp. Res. Part A Policy Pract. 2015, 77, 167–181. [Google Scholar] [CrossRef]
- Zhang, W.W.; Guhathakurta, S.; Fang, J.Q.; Zhang, G. Exploring the impact of shared autonomous vehicles on urban parking demand: An agent-based simulation approach. Sustain. Cities Soc. 2015, 19, 34–45. [Google Scholar] [CrossRef]
- Barrile, V.; Postorino, M.N. GPS and GIS Methods to Reproduce Vehicle Trajectories in Urban Areas. Procedia Soc. Behav. Sci. 2016, 223, 890–895. [Google Scholar] [CrossRef][Green Version]
- Greenblatt, J.B.; Saxena, S. Autonomous taxis could greatly reduce greenhouse gas emissions of US light-duty vehicles. Nat. Clim. Chang. 2015, 5, 860–863. [Google Scholar] [CrossRef]
- Lazarus, J.; Shaheen, S.; Young, S.E.; Fagnant, D.; Voege, T.; Baumgardner, W.; Lott, J.S. Shared automated mobility and public transport. In Road Vehicle Automation 4, 1st ed.; Meyer, G., Beiker, S., Eds.; Springer: Cham, Switzerland, 2018; pp. 141–161. [Google Scholar]
- Becker, F.; Axhausen, K.W. Literature review on surveys investigating the acceptance of automated vehicles. Transportation 2017, 44, 1293–1306. [Google Scholar] [CrossRef]
- Kellerman, A. Automated and Autonomous Spatial Mobilities, 1st ed.; Edward Elgar Publishing: Cheltenham, UK, 2018. [Google Scholar]
- Greenblatt, J.B.; Shaheen, S. Automated vehicles, on-demand mobility, and environmental impacts. Curr. Sustain. Renew. Energy Rep. 2015, 2, 74–81. [Google Scholar] [CrossRef]
- Cohen, S.A.; Hopkins, D. Autonomous vehicles and the future of urban tourism. Ann. Tour. Res. 2019, 74, 33–42. [Google Scholar] [CrossRef]
- Gretzel, U.; Sigala, M.; Xiang, Z.; Koo, C. Smart tourism: Foundations and developments. Electron. Mark. 2015, 25, 179–188. [Google Scholar] [CrossRef]
- Kwon, Y.H. Improving multi-channel wave-based V2X communication to support advanced driver assistance system (ADAS). Int. J. Automot. Technol. 2016, 17, 1113–1120. [Google Scholar] [CrossRef]
- European Parliament, 2019, Regulation (EU) 2019/2144 of the European Parliament and of the Council of 27 November 2019 on Type-Approval Requirements for Motor Vehicles and Their Trailers, and Systems, Components and Separate Technical Units Intended for Such Vehicles, as Regards Their General Safety and the Protection of Vehicle Occupants and Vulnerable Road Users. Available online: https://eur-lex.europa.eu/legal-content/EN/TXT/PDF/?uri=CELEX:32019R2144&from=EN (accessed on 25 September 2020).
- SAE. International Standard J3016 Taxonomy and Definitions for Terms Related to On-Road Motor Vehicle Automated Driving Systems. 2014. Available online: https://www.sae.org/misc/pdfs/automated_driving.pdf (accessed on 25 September 2020).
- Hopkins, D.; Schwanen, T. Automated mobility transitions: Governing processes in the UK. Sustainability 2018, 10, 956. [Google Scholar] [CrossRef]
- Antonialli, F. International benchmark on experimentations with Autonomous Shuttles for Collective Transport. In Proceedings of the 27th International Colloquium of Gerpisa, Paris, France, 12–14 June 2019. [Google Scholar]
- Wadud, Z.; MacKenzie, D.; Leiby, P. Help or hindrance? The travel, energy and carbon impacts of highly automated vehicles. Transp. Res. Part A Policy Pract. 2016, 86, 1–18. [Google Scholar] [CrossRef]
- Stern, R.E.; Chen, Y.; Churchill, M.; Wu, F.; Delle Monache, M.L.; Piccoli, B.; Work, D.B. Quantifying air quality benefits resulting from few autonomous vehicles stabilizing traffic. Transp. Res. Part D Transp. Environ. 2019, 67, 351–365. [Google Scholar] [CrossRef]
- Nyholm, S.; Smids, J. The ethics of accident-algorithms for self-driving cars: An applied trolley problem? Ethical Theory Moral Pract. 2016, 19, 1275–1289. [Google Scholar] [CrossRef]
- Taeihagh, A.; Lim, H.S.M. Governing autonomous vehicles: Emerging responses for safety, liability, privacy, cybersecurity, and industry risks. Transp. Rev. 2019, 39, 103–128. [Google Scholar] [CrossRef]
- Khan, S.A.R.; Qianli, D.; SongBo, W.; Zaman, K.; Zhang, Y. Travel and tourism competitiveness index: The impact of air transportation, railways transportation, travel and transport services on international inbound and outbound tourism. J. Air Transp. Manag. 2017, 58, 125–134. [Google Scholar] [CrossRef]
- Thrane, C. Examining tourists’ long-distance transportation mode choices using a Multinomial Logit regression model. Tour. Manag. Perspect. 2015, 15, 115–121. [Google Scholar] [CrossRef]
- Yang, L.; Shen, Q.; Li, Z. Comparing travel mode and trip chain choices between holidays and weekdays. Transp. Res. Part A Policy Pract. 2016, 91, 273–285. [Google Scholar] [CrossRef]
- Dallen, J. The challenges of diverse visitor perceptions: Rail policy and sustainable transport at the resort destination. J. Transp. Geogr. 2007, 15, 104–115. [Google Scholar] [CrossRef]
- Kinsella, J.; Caulfield, B. An examination of the quality and ease of use of public transport in Dublin from a newcomer’s perspective. J. Public Transp. 2011, 14, 4. [Google Scholar] [CrossRef]
- Le-Klähn, D.T.; Hall, C.M.; Gerike, R. Analysis of visitor satisfaction with public transport in Munich. J. Public Transp. 2014, 17, 5. [Google Scholar] [CrossRef]
- Krueger, R.; Rashidi, T.H.; Rose, J.M. Preferences for shared autonomous vehicles. Transp. Res. Part C Emerg. Technol. 2016, 69, 343–355. [Google Scholar] [CrossRef]
- Kyriakidis, M.; Happee, R.; De Winter, J.C.F. Public Opinion on Automated Driving: Results of an International Questionnaire among 5000 Respondents. Transp. Res. Part F Traffic Psychol. Behav. 2015, 32, 127–140. [Google Scholar] [CrossRef]
- Hohenberger, C.; Spörrle, M.; Welpe, I.M. How and why do men and women differ in their willingness to use automated cars? The influence of emotions across different age groups. Transp. Res. Part A Policy Pract. 2016, 94, 374–385. [Google Scholar] [CrossRef]
- Zmud, J.; Sener, I.N.; Wagner, J. Self-driving vehicles: Determinants of adoption and conditions of usage. Transp. Res. Rec. 2016, 2565, 57–64. [Google Scholar] [CrossRef]
- Nordhoff, S.; de Winter, J.; Madigan, R.; Merat, N.; van Arem, B.; Happee, R. User acceptance of automated shuttles in Berlin-Schöneberg: A questionnaire study. Transp. Res. Part F Traffic Psychol. Behav. 2018, 58, 843–854. [Google Scholar] [CrossRef]
- Haboucha, C.J.; Ishaq, R.; Shiftan, Y. User preferences regarding autonomous vehicles. Transp. Res. Part C Emerg. Technol. 2017, 78, 37–49. [Google Scholar] [CrossRef]
- Hudson, J.; Orviska, M.; Hunady, J. People’s attitudes to autonomous vehicles. Transp. Res. Part A Policy Pract. 2019, 121, 164–176. [Google Scholar] [CrossRef]
- Yuen, K.F.; Cai, L.; Qi, G.; Wang, X. Factors influencing autonomous vehicle adoption: An application of the technology acceptance model and innovation diffusion theory. Technol. Anal. Strateg. Manag. 2020. [Google Scholar] [CrossRef]
- Choi, J.K.; Ji, Y.G. Investigating the importance of trust on adopting an autonomous vehicle. Int. J. Hum. Comp. Int. 2015, 31, 692–702. [Google Scholar] [CrossRef]
- Zhang, T.; Tao, D.; Qu, X.; Zhang, X.; Lin, R.; Zhang, W. The roles of initial trust and perceived risk in public’s acceptance of automated vehicles. Transp. Res. Part C Emerg. Technol. 2019, 98, 207–220. [Google Scholar] [CrossRef]
- Talebian, A.; Mishra, S. Predicting the adoption of connected autonomous vehicles: A new approach based on the theory of diffusion of innovations. Transp. Res. Part C Emerg. Technol. 2018, 95, 363–380. [Google Scholar] [CrossRef]
- Arsenault, J.; Talbot, J.; Boustani, L.; Gonzalès, R.; Manaugh, K. The environmental footprint of academic and student mobility in a large research-oriented university. Environ. Res. Lett. 2019, 14. [Google Scholar] [CrossRef]
- Shannon, T.; Giles-Corti, B.; Pikora, T.; Bulsara, M.; Shilton, T.; Bull, F. Active commuting in a university setting: Assessing commuting habits and potential for modal change. Transp. Policy 2006, 13, 240–253. [Google Scholar] [CrossRef]
- Kerr, A.; Lennon, A.; Watson, B. The call of the road: Factors predicting students’ car travelling intentions and behavior. Transportation 2010, 37, 1–13. [Google Scholar] [CrossRef]
- Zhou, J. An analysis of university employee car-sharers in Los Angeles. Transp. Res. Part D Transp. Environ. 2012, 17, 588–591. [Google Scholar] [CrossRef]
- Azzali, S.; Sabour, E.A. A framework for improving sustainable mobility in higher education campuses: The case study of Qatar University. Case Stud. Transp. Policy 2018, 6, 603–612. [Google Scholar] [CrossRef]
- Van Mol, C. Improving web survey efficiency: The impact of an extra reminder and reminder content on web survey response. Int. J. Soc. Res. Methodol. 2017, 20, 317–327. [Google Scholar] [CrossRef]
- Soe, R.M.; Müür, J. Mobility Acceptance Factors of an Automated Shuttle Bus Last-Mile Service. Sustainability 2020, 12, 5469. [Google Scholar] [CrossRef]
- Axhausen, K.W.; Schmid, B.; Weis, C. Predicting response rates updated. Arbeitsberichte Verkehrs-und Raumplanung 2015, 1063, 1–25. [Google Scholar]
- Leung, S.O. A comparison of psychometric properties and normality in 4-, 5-, 6-, and 11-point Likert scales. J. Soc. Serv. Res. 2011, 37, 412–421. [Google Scholar] [CrossRef]
- Croasmun, J.T.; Ostrom, L. Using Likert-Type Scales in the Social Sciences. J. Adult Educ. 2011, 40, 19–22. [Google Scholar]
- Berrada, J.; Mouhoubi, I.; Christoforou, Z. Factors of successful implementation and diffusion of services based on autonomous vehicles: Users’ acceptance and operators’ profitability. Res. Transp. Econ. 2020, 83, 100902. [Google Scholar] [CrossRef]
- Weng, L.J.; Cheng, C.P. Effects of response order on Likert-type scales. Educ. Psychol. Meas. 2000, 60, 908–924. [Google Scholar] [CrossRef]
- De Winter, J.F.C.; Dodou, D. Five-Point Likert Items: T test versus Mann-Whitney-Wilcoxon (Addendum added October 2012). Pract. Assess. Res. Eval. 2010, 15, 11. [Google Scholar]
- Peterson, R.A. A meta-analysis of variance accounted for and factor loadings in exploratory factor analysis. Mark. Lett. 2000, 11, 261–275. [Google Scholar] [CrossRef]
- Madigan, R.; Louw, T.; Dziennus, M.; Graindorge, T.; Ortega, E.; Graindorge, M.; Merat, N. Acceptance of automated road transport systems (ARTS): An adaptation of the UTAUT model. Transp. Res. Proc. 2016, 14, 2217–2226. [Google Scholar] [CrossRef]
- Sharma, I.; Mishra, S. Modeling consumers’ likelihood to adopt autonomous vehicles based on their peer network. Transp. Res. Part D Transp. Environ. 2020, 87, 102509. [Google Scholar] [CrossRef]
- Qu, W.; Xu, J.; Ge, Y.; Sun, X.; Zhang, K. Development and validation of a questionnaire to assess public receptivity toward autonomous vehicles and its relation with the traffic safety climate in China. Accid. Anal. Prev. 2019, 128, 78–86. [Google Scholar] [CrossRef]
- Hulse, L.M.; Xie, H.; Galea, E.R. Perceptions of autonomous vehicles: Relationships with road users, risk, gender and age. Saf. Sci. 2018, 102, 1–13. [Google Scholar] [CrossRef]
- Chee, P.N.E.; Susilo, Y.O.; Wong, Y.D.; Pernestål, A. Which factors affect willingness-to-pay for automated vehicle services? Evidence from public road deployment in Stockholm, Sweden. Eur. Transp. Res. Rev. 2020, 12, 1–17. [Google Scholar] [CrossRef]
- World Travel and Tourism Council (WTTC). Recovery Scenarios 2020 and Economic Impact from COVID-19. Available online: https://wttc.org/Research/Economic-Impact/Recovery-Scenarios-2020-Economic-Impact-from-COVID-19 (accessed on 25 September 2020).
- Xu, F.; McCluskey, C.C.; Cressman, R. Spatial spread of an epidemic through public transportation systems with a hub. Math. Biosci. 2013, 246, 164–175. [Google Scholar] [CrossRef]
- Hu, M.; Lin, H.; Wang, J.; Xu, C.; Tatem, A.J.; Meng, B.; Xie, H. The risk of COVID-19 transmission in train passengers: An epidemiological and modelling study. Clin. Infect. Dis. 2020, ciaa1057. [Google Scholar] [CrossRef]
- Agarwal, S.; Punn, N.S.; Sonbhadra, S.K.; Nagabhushan, P.; Pandian, K.K.; Saxena, P. Unleashing the power of disruptive and emerging technologies amid COVID 2019: A detailed review. arXiv 2020, arXiv:2005.11507. [Google Scholar]


Publisher’s Note: MDPI stays neutral with regard to jurisdictional claims in published maps and institutional affiliations. |
© 2020 by the authors. Licensee MDPI, Basel, Switzerland. This article is an open access article distributed under the terms and conditions of the Creative Commons Attribution (CC BY) license (http://creativecommons.org/licenses/by/4.0/).