Article

Modeling Flash Floods and Induced Recharge into Alluvial Aquifers Using Multi-Temporal Remote Sensing and Electrical Resistivity Imaging

1
Division of Geological Applications and Mineral Resources, National Authority of Remote Sensing and Space Sciences, Cairo 1564, Egypt
2
Department of Geology, Port Said University, Port Said 42526, Egypt
3
Natural Hazards Research Unit, Department of Environmental and Health Research, Umm Al-Qura University, Makkah 715, Saudi Arabia
4
Viterbi School of Engineering, University of Southern California, Los Angeles, LA 89009, USA
5
Department of Geology, Zagazig University, Zagazig 44519, Egypt
*
Author to whom correspondence should be addressed.
Sustainability 2020, 12(23), 10204; https://doi.org/10.3390/su122310204
Submission received: 21 November 2020 / Revised: 2 December 2020 / Accepted: 4 December 2020 / Published: 7 December 2020
(This article belongs to the Special Issue Remote Sensing Applied to the Environment and Sustainability)

Abstract

:
Flash flood hazard assessments, mitigation measures, and water harvesting efforts in desert environments are often challenged by data scarcity on the basin scale. The present study, using the Wadi Atfeh catchment as a test site, integrates remote sensing datasets with field and geoelectrical measurements to assess flash flood hazards, suggest mitigation measures, and to examine the recharge to the alluvium aquifer. The estimated peak discharge of the 13 March 2020 flood event was 97 m3/h, which exceeded the capacity of the culverts beneath the Eastern Military Highway (64 m3/h), and a new dam was suggested, where 75% of the catchment could be controlled. The monitoring of water infiltration into the alluvium aquifer using time-lapse electrical resistivity measurements along a fixed profile showed a limited connection between the wetted surficial sediments and the water table. Throughflow is probably the main source of recharge to the aquifer rather than vertical infiltration at the basin outlet. The findings suggest further measures to avoid the negative impacts of flash floods at the Wadi Atfeh catchment and similar basins in the Eastern Desert of Egypt. Furthermore, future hydrological studies in desert environments should take into consideration the major role of the throughflow in alluvium aquifer recharge.

1. Introduction

Flash flooding of the dryland wadi systems has become one of the most common phenomena that afflicts neighborhood activities and the surrounding environments [1,2,3]. Usually, the long-term aridity of these wadis could be interrupted by unpredicted severe storms capable of developing torrential floods [4]. The lack of frequent occurrences of short-lived hydrological activities has added further complexity to the measurement of essential quantitative parameters [5,6,7,8]. Therefore, the estimation of effective runoff, peak discharges, and flow duration is challenged with a great deal of uncertainty, particularly in the non-gauged catchments [9,10]. The absence of accurate measurements for rainfall and runoff parameters in most, if not all, dryland catchments in the Eastern Desert of Egypt can be one of the main reasons that flash floods destruct the road networks in their pathways. Examples of these destructive flash flood events throughout the Eastern Desert of Egypt are summarized in Table 1, which include the September–November 1994 event in the Sohag and Qena basins, the March–May 2014 event in the Sohag and Komombo basins, the 15 May 2014 event in the Al-Saf basin and the April 2018 event in the Fifth Settlement, “New Cairo” [4,11]. Moreover, the installed mitigation measures (e.g., check dams, culverts, etc.) are often overwhelmed by flash floods with pronounced magnitudes than originally considered in the design of the structures. Dam failures by overflows, the sweeping of segments of the networks, and flooding of urban areas are becoming more frequent, especially with the projected increase of precipitations over arid areas as a result of climate change [12,13].
In humid and semi-arid environments, where storm events are more frequent, networks of streamflow gauge stations are well-distributed and represent continuous and high-resolution measurements of stream stage and streamflow [14]. Several devices are used in these gauges, including a float-tape gauge, pressure transducers, manometer, a float sensor gauge, a staff gauge, and a water-stage recorder. Continuous measurements made over a range of flow conditions are used to estimate the rating curve, which, in turn, is used to convert continuous measurements of stream stage to a continuous record of streamflow, and finally, to assess the flooding characteristics [15]. The stream stage–streamflow relationship is very sensitive to channel changes that result from scour, deposition, vegetation, and other processes, and thus it necessitates routine and continuous streamflow measurements to ensure that the resultant rating curve is accurate [16]. When estimated peak flows are outside the range of the established rating curve, an extrapolation of the rating curve can be implemented [15]. Indirect streamflow measurement methods are also applied in some cases, which involve information on high-water marks and channel properties, and thus hydraulic principles can be used to independently estimate the streamflow. Other indirect methods of streamflow measurements include dyes, radioisotopes, and chemical tracers [17]. Recently, high-resolution radar rainfall measurements and spatial analyses, as well as field surveys and Lidar data, have been used for flash flood hazard assessments [18,19]. Early warning systems of flash flood hazards and associated natural hazards (e.g., debris flows and rockfalls) have also recently flourished by the availability of continuous satellite-based monitoring data of rainfall duration and intensity [20,21]. In arid environments, the availability of remote sensing data from different platforms has provided a wider perspective on the detection and analysis of flash flood impacts. The detection of active channels, the accumulation of water ponds in natural or artificial depressions, and the induced land cover changes in flooded areas are the key outputs from remote sensing data [22]. The remote sensing-derived hydrological parameters have widely been integrated with digital elevation model (DEM) analyses to compute the quantitative parameters of discharge [4,11]. Fortunately, a considerable part of the flash floods is usually lost by transmission into the inundated channel alluvium via surface retention [23,24], and by percolation to the groundwater via deep infiltration [25]. Consequently, the analyses magnitudes of runoff and induced retention and recharge into the groundwater aquifer are of utmost importance, particularly in areas of fragile water resources. The introduction of machine learning techniques to the prediction of flash flooding under different climatic conditions set the stage for significant future advancements of the flash flood hazard assessment and the development of early warning systems [26,27,28].
The exploration of groundwater occurrence in desert environments is very crucial since surface water supplies can be difficult or even impossible [29,30]. Ground geophysical imaging techniques provide high-resolution information on subsurface property changes. Today, state-of-the-art measurement techniques (e.g., hydrogeophysical methods such as electrical resistivity imaging (ERI)) hold particular promise regarding their sensitivity to both lithology and changes in soil saturation [31,32]. In this regard, ERI can provide results with sufficient resolution to monitor subsurface water flow as a function of resistivity changes on different temporal and spatial scales [33]. Moreover, two-dimensional (2D) ERI is a well-established technique for subsurface geological and structural investigations in field and laboratory scales, such as in fault mapping [34], estimation of infiltration rates [32], delineation of potential aquifer zones, detection of contaminant flow, and imaging of wastewater and oil leakages in soils [35,36]. Recently, investigations using ERI monitoring have provided an ideal technique for characterizing and monitoring water infiltration to aquifers [37] and monitoring CO2 migration [38]. Accordingly, time-lapse resistivity measurements are particularly useful for monitoring electrical resistivity changes, which are presumably linked to groundwater recharge from the aquifer outcrops. The time-lapse ERI method typically depends on conducting geoelectrical measurements along the same profile several times: before, during, and after a specific hydrological event (e.g., a storm event, river flooding, etc.). Moreover, time-lapse ERI utilizes the natural electrical contrasts of water to monitor longer-term groundwater–saltwater interactions [39].
In this manuscript, using the Wadi Atfeh catchment in the Eastern Desert of Egypt as a test site, multi-temporal datasets of remote sensing, a time-lapse 2D-ERI survey at the downstream site, and DEM analyses have been integrated to assess the interaction of flash floods, land use planning, and recharging of the alluvium aquifer, which are very critical to urban, industrial, and agricultural development plans in the Eastern Desert of Egypt and similar arid regions worldwide. In order to achieve this goal, the following objectives have been conducted: (1) estimating the flash flood parameters and mapping the vulnerability of rural areas and infrastructures to these hydrological hazards; (2) estimating the infiltration rate of surface runoff into the wadi alluvium by repeating the 2D-ERI measurements at the same downstream site of the Wadi Atfeh catchment over a three-month duration (the field measurements took place shortly after the flash flood event of 13 March 2020, and continued until 11 June 2020); (3) detecting the temporal response of the alluvial aquifer to the flash floods; and (4) assessing the relationship between flash flooding replenishment and regional groundwater dynamics in arid environments.

2. Site Description

The catchment of Wadi Atfeh is located in the northern part of the Egyptian Eastern Desert and extends from the south of Greater Cairo in the north to the Beni Suef Governorate in the south. Geographically, it is delimited by latitudes 29°15′41′′ and 29°27′2′′ N and longitudes 31°14′20′′ and 31°45′17′′ E, occupying an area of about 468 km2 (Figure 1). The Military Eastern High Way cuts through the downstream of the basin. This road represents the main pathway to Cairo for almost 20 million people who live in Upper Egypt. Therefore, monitoring occasional hydrological activities related to flash floods is essential to mitigating flash flood hazards. Geologically, the study area is mainly covered by Quaternary alluvium and Tertiary sedimentary rocks, which are described in [40,41,42,43]. The Tertiary carbonate deposits belong to the Pliocene and Eocene (Figure 2). The Eocene rocks, namely the Rayan Formation, underlie most of the study area and comprise a plateau terrain (Al Maaza Plateau). The plateau was affected by the opening of the Red Sea during the Oligo–Miocene time, thus the Nile Valley canyon has been carved in its western fringes [44]. The tectonic frameworks of the study area include two main groups of the lineament and fault systems: the NW–SE (Gulf of Suez rift) and the NE–SW (Syrian Arc system) [45,46]. The Nile Valley canyon was inundated by the Pliocene Gulf following the sea level rise in the Mediterranean. Therefore, clay sediments (i.e., the Kom El Shelul Formation) were deposited on the Nile Valley floor as well as on top of the pediment and foot slopes of the Eocene limestone plateau [47]. The Mediterranean was desiccated as a result of the Messinian Crisis, thus the main wadi courses running westward into the Nile Valley deeply incised their courses into the elevated plateau, and considerable parts of the Pliocene deposits were eroded [44]. The development of the Nile regime during the Quaternary has deposited distinctive sedimentary successions in the Nile Valley area occupied by the Pliocene deposits. The Prenile sand of the Pleistocene can be observed in the terraces overlooking the modern flood plain, which is mainly composed of silt and clays laid down by the Neonile of the Holocene [48].
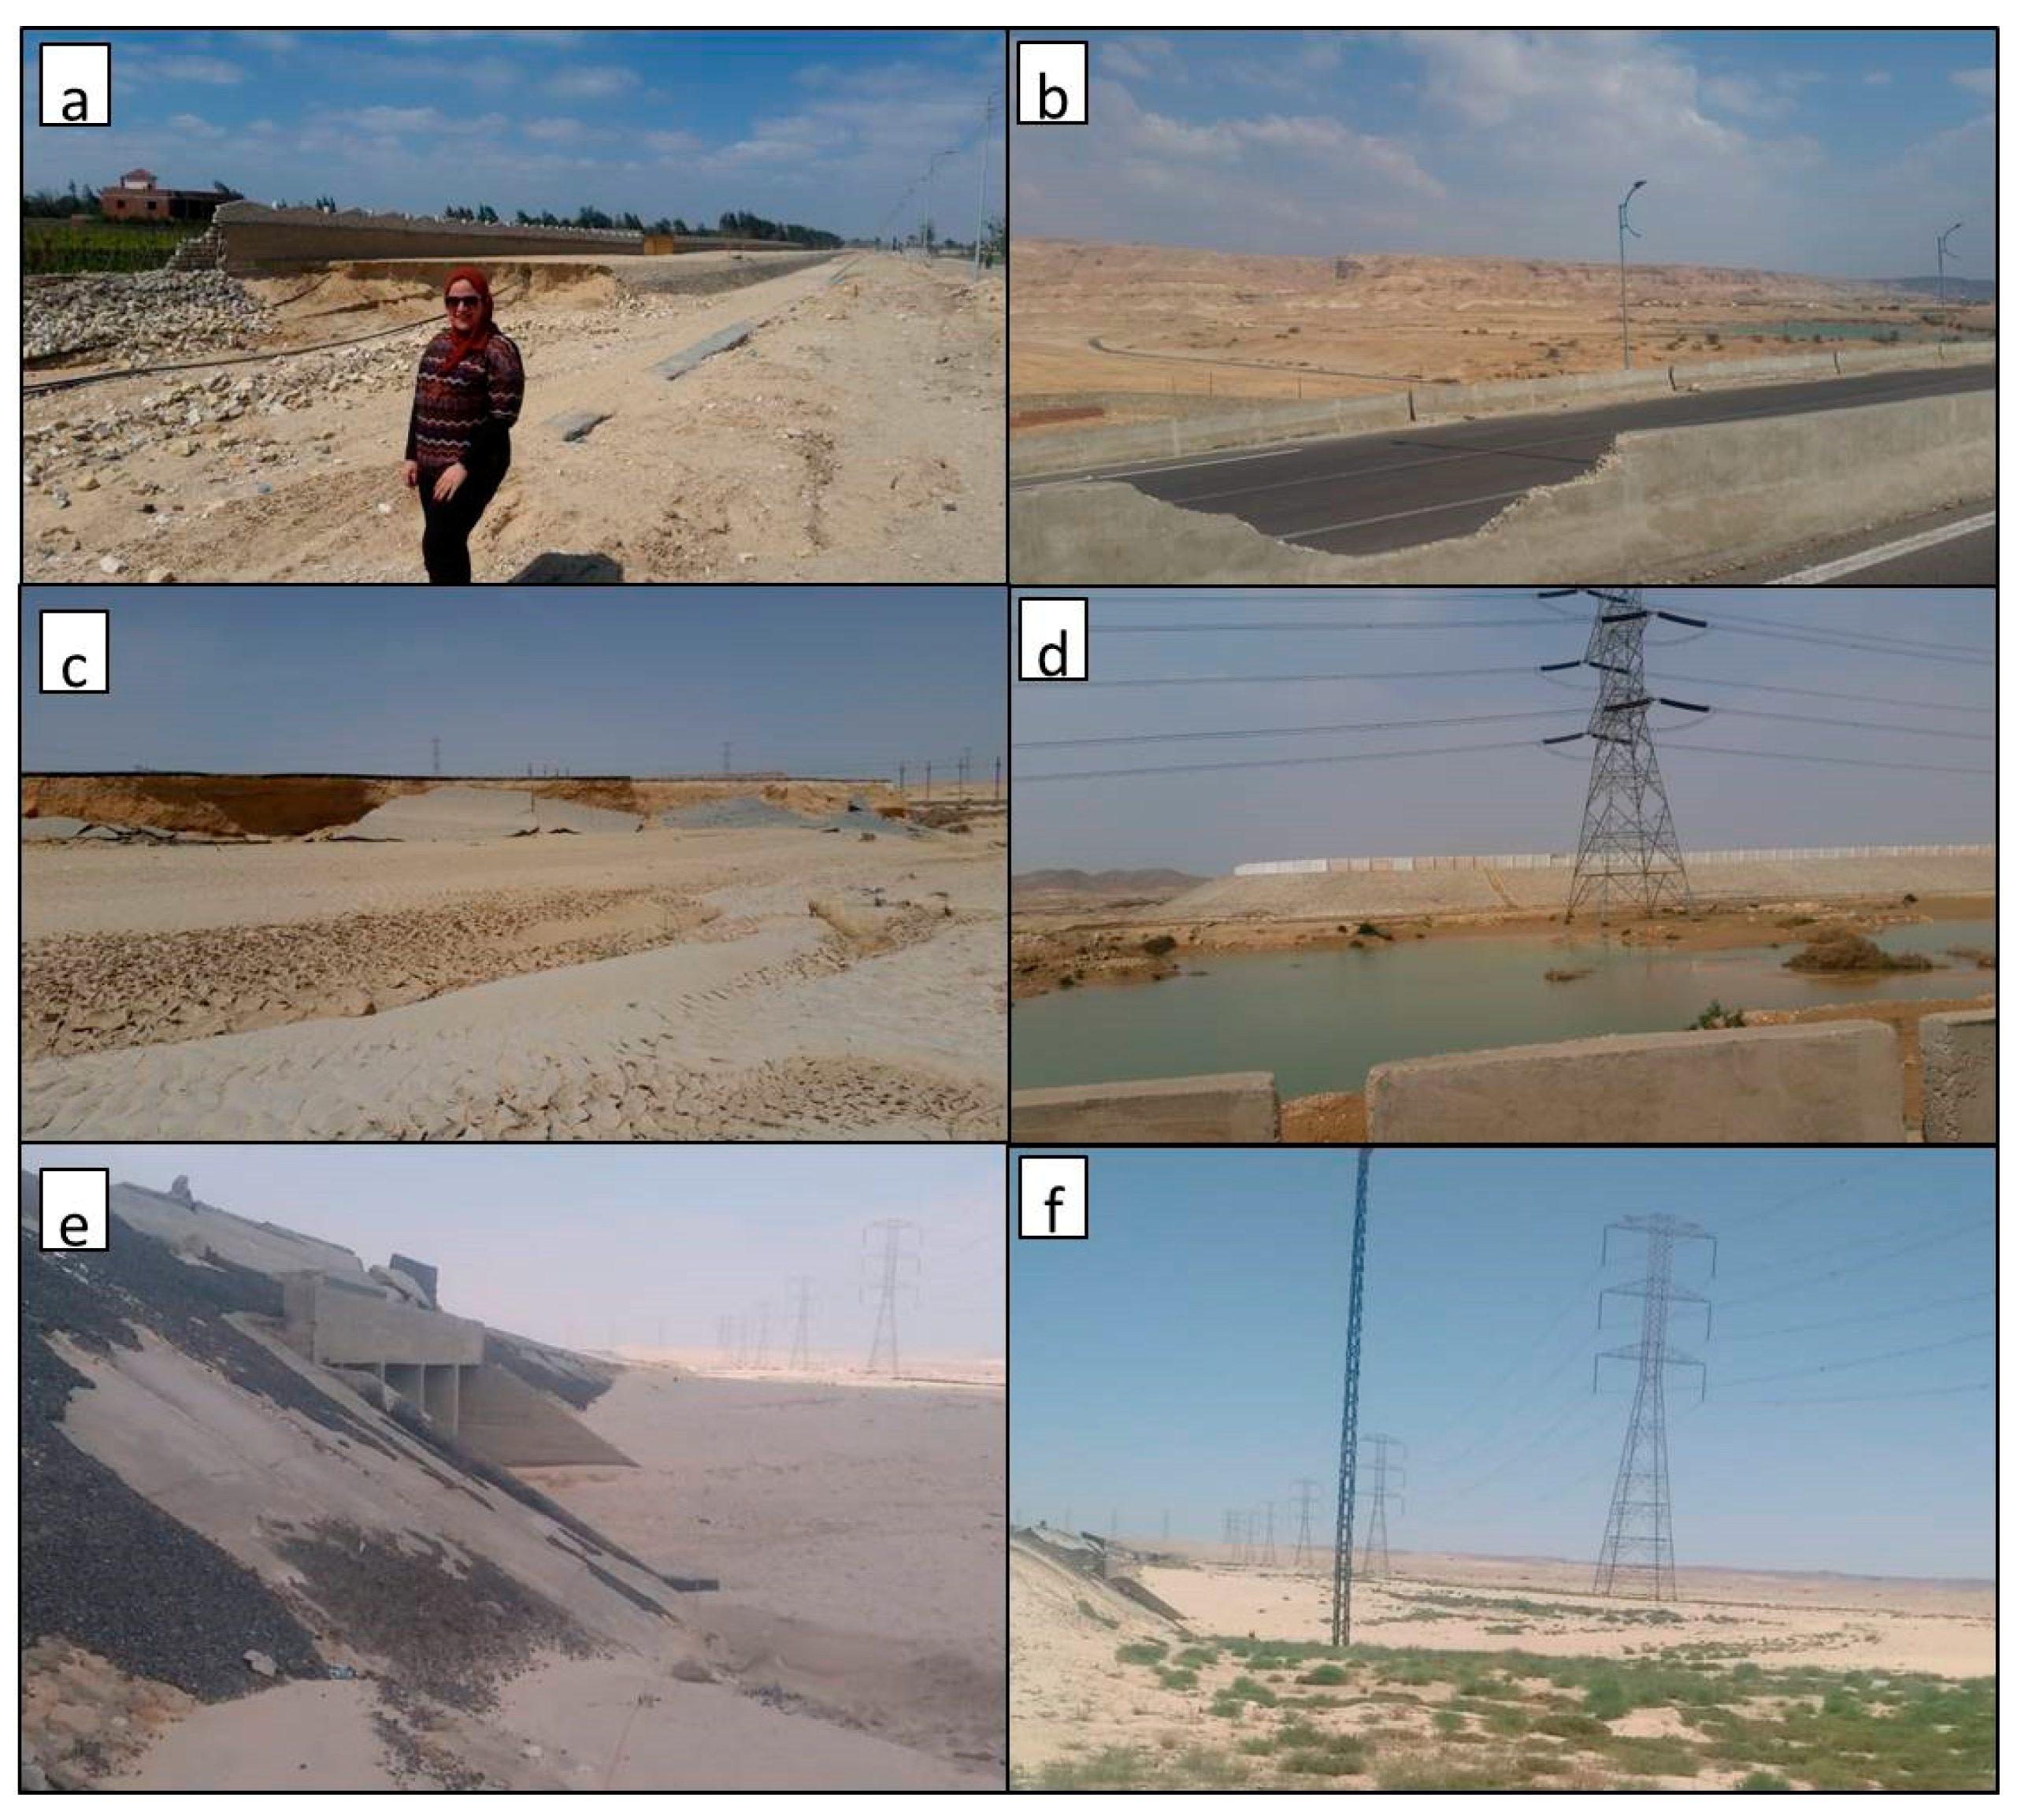
The outwash of the wadi deposits and alluvial plains are of marked extent on the geological map, thus indicating the significance of flash floods in the landforms (Figure 2). During the past few decades, considerable areas of this alluvial plain fringing the Nile Valley has been reclaimed for agricultural productions, and new urban and rural areas have also been added. Furthermore, this plain has been exploited for quarrying activities for extracting raw building materials (i.e., sand and clays), thus, artificial depressions are now dotting the landscape. Since the natural course of Wadi Atfeh has been encroached by different land use units (Figure 3), a conveying channel has been constructed by the embankment of artificial levees in the area between the Military Eastern Highway and the Nile River. However, the Wadi Atfeh catchment is characterized by hyper-arid conditions with an average annual precipitation of 15 mm, while the evaporation rates can attain 11.65 mm/day [49]. The occurrence of occasional and severe flash floods is very common. Indeed, the most recent flash flood event of 13 March 2020 has resulted in notable negative consequences on the road networks, agricultural fields, and to a lesser extent, on the urban and rural structures in the outlet area (Figure 4). The conveying channel was breached by the flash flood event of 13 March 2020 (Figure 3), and the quarrying depressions have also intercepted considerable amounts of flash floods, as shown on the satellite images (Figure 3).
Therefore, the quantitative assessment of flash flood parameters is of utmost importance to ensure the capabilities of existing structures to safely convey the peak flows of flash floods into the Nile River. The estimation of both transmission losses and surface runoff are of equal importance, as these two parameters define the peak discharge rates and control the recharge to underlying alluvium aquifers. There were two main goals to achieve in this research. Firstly, the quantitative estimates of flash flood parameters were conducted in order to define the efficiency of existing mitigation measures and the vulnerability to flash flooding. Secondly, the geo-electric time-lapse profiles were analyzed to monitor the interaction of infiltration, transmission losses, and groundwater recharge. The details of the data and methodologies used are given in the following section.

3. Materials and Methods

The materials and methods used in this study are summarized in Figure 5, which can be subdivided into two major categories: (1) remote sensing datasets and the hydrological parameters, and (2) geophysical surveys and time-lapse ERI measurements.

3.1. Remote Sensing Datasets and the Surface Hydrological Parameters

Remote sensing, a digital elevation model (DEM), and fieldwork data have been used to estimate the hydrological parameters of the flash flood event of 13 March 2020. Landsat 8 images acquired on 28 February 2020 and 31 March 2020 were downloaded from the United States Geological Survey (USGS) data portal and processed to define the imprint of the flash flood on the land cover. Routed channels by the floods were delineated in guidance by contrasting the high albedo of active channels with the non-active ones [4,22,23]. The accumulation of water ponds in low-lying areas and artificial depressions were delineated on false color composite images, given the near-infrared distinguishing capabilities of water bodies from the surroundings (Figure 3). Additionally, the land cover classes were digitized from the satellite images in order to define the spatial relationship between flash floods and the land cover parameters. The study area was visited shortly after the flash floods to investigate negative consequences, and to acquire sets of multi-temporal 2D-ERI. The DEM was obtained from two different sources: digitized topographic maps of 1:50,000 and the shuttle radar topography mission (SRTM), in order to understand the impact of extracting the hydrographic parameters from different sources on the quantitative estimates. The DEMs were processed using ArcGIS v. 10.5 to compute the surface slope and gradient that control the flow directions, accumulations, lengths, and subdivision of the catchment into sets of downstream consecutive zones (i.e., time-area zones (Figure 6)). The above-mentioned parameters were also used to extract the drainage networks and catchment parameters. Firstly, the DEMs were filled in order to ensure the continuity of flow routing from each pixel in the catchment downstream to the final outlet. Secondly, the flow direction was computed from the “filled” DEM using the available tools embedded in ArcGIS, (i.e., the D8 algorithm), which define the flow direction of each cell into one of the eight neighboring cells based on the slope and gradient values. Thirdly, the flow accumulation was calculated from the “flow direction map” in order to count (measure) the upstream flow contributing areas for each cell. Therefore, the sub-catchments and drainage networks that receive flows from the interconnecting cells could be delineated. Then, a threshold of 1.2 km2 was selected to extract the drainage networks from the “flow accumulation’’ and the catchment outlet collected the entire flow accumulation of the catchment, which approximately equaled 468 km2. Afterward, the “flow length” was computed in the downstream direction, thus the flow lengths could be estimated along the flow pathways from catchment divides to the final outlet. The “slope magnitude”, “flow length”, and the estimated cross-sectional areas of the active channels (Figure 3) were used to compute the overland flow velocities using the “Manning Equation”. Therefore, the “time” required for the flows to move downstream along the interconnected cells were estimated, given the “flow length and overland flow velocities”. Finally, the clustering of “time” map for each cell was used to subdivide the catchment into sets of spatially cascading zones, which deliver its flows to the outlet distributed on an hourly basis. These spatially distributed time–area zones were used to compute the unit hydrograph developed from the rainfall storm of 13 March 2020. The rainfall data of the Japan Aerospace Exploration Agency (JAXA) was downloaded and co-registered with the time–area zones, and the effective rainfall represents approximately 20% of the total precipitation, based on previous calibration and verification of a nearby catchment [9,22,50,51]. The constructed mitigation measures were visited to check their responses in the field against discharge parameters of the flash flood event.

3.2. Geophysical Surveys and Time-Lapse ERI Measurements

Although the Eastern Military Road intersects with the main wadi course for approximately 2 km, only two culverts measuring 5 × 2.5 m were constructed to discharge the flash floods beneath the road into an embanked conveying channel (Figure 4). The capacity of these culverts was not sufficient to discharge the peak flows, thus the road was flooded by rapidly accumulating flows. The ERI measurements were collected using Syscal Pro 48 (manufactured by Iris Instruments, Orléans, France) at a fixed extent, parallel to the main road and adjacent to the culverts (Figure 7). ERI data were collected four times; the first one was immediately measured after the flash flood on 20 March 2020, and the three other profiles were collected on 30 March, 19 April, and 11 June 2020, respectively. These ERI measurements were used to monitor the temporal changes of wetted alluvium layers and the depths of infiltration, thus the recharge mechanisms to the groundwater aquifer could be inferred and better understood. The used sequence of measurement was the Wenner beta (Wb) array, due to its sensitivity to vertical and horizontal variations [52]. The profile length was 940 m, which was constructed from 48 point electrodes with 20 m of spacing between. Moreover, the sequence with dipole separations (n) of 1a to 12a was used, resulting in a total of 342 measurements. Stainless steel electrodes were used to avoid bad contact with the ground, and the contact resistance values were less than 1 Kohm, due to the wetting of alluvium by the flash floods showing the installation of the ERI survey line (i.e., the 2D profile location (Figure 7)), which was fixed over the time-lapse ERI measurements period (i.e., three months).
During the time-lapse ERI measurements, the measured apparent resistivity data were stacked eight times and the final data were chosen when the data quality factor values were minimized (i.e., stacking error ~<2%). It is worth mentioning that the measurements were acquired in the early morning, that is, before noon, to avoid high temperature variations and thus keeping temperature effects at an acceptable level [53].
For data analysis, the 2D inversion algorithm DC2DInvRes [54] was applied. The data processing involved the exclusion of bad data points (i.e., stacking error was more than 2%) from the field resistivity data. In general, when the true errors are unknown, one can use a fixed relative error as well [55]. Accordingly, the apparent resistivity data uncertainty (δdi) was assessed in absence of reciprocal data, using a constant relative error model of 3% plus 10 μv, as suggested by [56]. The data were regularized using smoothness constraints and the quasi Gauss–Newton inversion algorithm. Numerical solutions were obtained by partial differentiation depending on the least square method. The forward calculations of 2D-ERI were solved using the 2D finite-difference (FD) method. The inversion parameters (az = λwz, called “ZWEIGHT”, and ax = λ, known as “LAMBDA”) were chosen to ensure that the inversion algorithm could construct the horizontal and vertical variations of the subsurface [57]. Accordingly, a fixed regularization (λ = 259 and λwz = 0.1) and first-order smoothness constraints were used. For a detailed description of these factors, see [58].
The DC2DInvRes software allows a priori geological and/or hydrogeological information to be introduced into the time-lapse ERI inversion procedure. Consequently, an advanced inversion method was applied with a decoupling line at a shallow depth to attenuate the resistivity artifacts at an intermediate depth and, subsequently, to produce a reliable hydrological processes interpretation. In this study, a priori hydrogeological information (infiltration front information) was incorporated into the time-lapse ERI by decoupling shallow cells from the rest of the model. In the known boundary presence, the weight can be set to zero, which produced sharp gradients at this point. Moreover, individual model cell boundaries were weighted by using the robust model method. This method has already been explained in detail and was applied for studying shallow infiltration influence on time-lapse ERI by [53]. Note, the resistivity data and accompanying topography were used to create a tetrahedral mesh with the DC2DInvRes software.

4. Results and Discussion

4.1. Regional Geomorphological and Surface Hydrological Investigation

Multi-temporal Landsat images between April 1984 and August 2020 (path 176/row 40) were downloaded and inspected to assess the historical evolution of land use and flooding imprints on the downstream of the Wadi Atfeh catchment (Figure 8). The confluence zone of the main alluvial channel with the Nile River was already occupied by agricultural areas in 1984. The conveying channel for flash floods in the downstream part appeared in 1984. The course of this conveying channel does not match the extracted drainage segment of the DEMs used. The premises of this conveying channel were free from any agricultural activity until 1998, whereas the land reclamation occupied the alluvial channels prone to flash flooding. The flash flood event of 2 November 1994 was overwhelming, thus it exceeded the capacity of the conveying channel and inundated considerable areas in the alluvial plain and nearby agricultural areas.
Additionally, flash floods do not follow well-defined pathways into the alluvial plain; the active channels are of a braided pattern that intersects with the main road in several areas. The most recent flash flood of March 2020 was of comparable magnitude to the 1994 event, where the quarrying areas in premises of the breached conveying channels were flooded. The estimated peak discharge of the 13 March 2020 event is approximately equal to 97 m3/h (Figure 9), which exceeds the discharge capacity of the culverts (64 m3/h) beneath the Eastern Military Road. Therefore, the vicinity of culverts was flooded by accumulating flash floods, and the elevated road path overflowed. The road was cut off at many sections by the rapid overflows, and casualties were reported in the north of the study area. Furthermore, rural areas were flooded due to the breaching of the conveying channel, which did not coincide with the original gradient of the flash flood pathway at the downstream of the Wadi Atfeh catchment. Therefore, mitigation measures are needed to overcome the negative impacts of flash floods and to increase the recharge into the underlying aquifer. Geologically, the most favorable sites to construct a dam that serves these purposes are located at the contact point of the Eocene rock units and the Pliocene/Quaternary deposits, where 75% of the catchment can be controlled (Figure 2).

4.2. Flash Flood Assessment Using Different Datasets: Limitations, Capabilities, and Potentials

The hydrologic analyses of flash floods and the estimation of runoff hydrographs using DEM-derived parameters have widely been implemented in dryland basins [4,22,51,59]. The availability of SRTM DEM in 2001 boosted the hydrographic analyses in dryland basins, which generally lack detailed topographic maps. The topographic maps produced in 1945 with a 1:50,000 scale were digitized and processed to produce a 90 m-resolution DEM, thus the quantitative measures from both sources could be obtained and examined. Minor changes were observed in the catchment area extracted from the SRTM and the topographic map-derived DEM with surface areas of 450 km2 and 470 km2, respectively. Accordingly, the obtained changes in the surface areas also altered the quantitative hydrologic analyses of the time–area zones, total flow length, and magnitudes of discharges (Figure 9). Furthermore, the produced hydrographs could also vary in shape and magnitudes, when the transmission losses are considered. The infiltration processes are responsible for reducing the flow quantities and peak flows during the flow routing of flash floods. When the transmission and infiltration losses are significant, the recharge to groundwater could occur rather than being retained in the top layers of the alluvium.
The main advantage of using topographic maps in the hydrologic analyses of flash floods is to reveal the topographic changes in the downstream areas being encroached by anthropogenic activities. Overall, using visual inspection, a great deal of matching and consistency were noticed in the extracted drainage networks (i.e., the active channel pathways) from both sources. The slight variations in topography in the reclaimed downstream area during the period from 1945 to 2001 could explain the notable shift in the location of the main active channel derived from the two DEMs. The main advantages of using the SRTM DEM is its regional and global coverage, consistency in data acquisition, and reliability in extracting hydrographic parameters. The current research clearly shows that the quantitative analyses of the flash flood parameters are not sensitive to the sources of DEM when they have the same spatial resolution. The complexity of estimating the rainfall/runoff parameters such as effective rainfall, infiltration rates, and transmission losses can greatly alter the magnitudes of the calculated hydrograph for certain catchments. Indeed, the absence of in-situ measured rainfall/runoff parameters remains the biggest challenge in flash floods studies.
Although of all these uncertainties and field data limitations, the availability of remote sensing data proved very useful to indirectly estimate essential flash flood parameters, given the ability to distinguish the induced albedo changes of active channels from the non-active ones during the same event. Therefore, reoccurrence, return period, and the extent of flash floods in a given catchment can be estimated from the remote sensing data. These indices can be used to reveal changes that occur from one flash flood event to another. Herein, the introduced perspective on using remote sensing data to investigate previous flash floods has provided a useful insight into the magnitudes and vulnerable areas. The mitigation measures for flash floods should carefully be planned using the information obtained from satellite images regarding the accurate delineation of flow pathways. Unfortunately, the conveying channel in the downstream part does not coincide with the pathway of active channels observed on the satellite images during the different flash flood events (Figure 8). The consequences of these discrepancies between the natural channels and the man-made conveying channels can be costly and could increase the negative impacts of flash floods. One of the most appropriate mitigation measures in these areas is to convey the flash floods into the non-used quarrying depressions to alleviate the vulnerable areas.

4.3. Monitoring Flash Flood Water Infiltration to the Alluvium Aquifer

Figure 10 is intended to be a summary plot, in pseudo-section forms, showing the measured apparent resistivity data over the three months immediately following the flooding event. It can be noticed that the apparent resistivity values range from 10 ohm-m to 259 ohm-m for all pseudo-sections. In particular, at a 350 m or 940 m profile length, there are lateral resistivity variations (i.e., abrupt changes) at sub-vertical contact. In general, the high apparent resistivity contrast allows the production of similar resistivity tomograms. Considering the local geological conditions and the remote sensing data, it can be noticed that a normal fault can be observed at the same profile distance where the surface topography changes (Figure 2). Moreover, it is clear that the apparent resistivity values change with time, especially along the fault core where the hydraulic conductivity could be increased. Obviously, the resistivity values decrease with increasing pseudo-depth levels (n) and with time.
The inference of infiltration (i.e., transmission loss) and the mechanism of recharge to the underlying alluvial aquifer have been investigated, for the first time under such settings, by measuring the time-lapsed 2D-ERI profiles spanning the period of approximately three months. Inspection of the analyzed time-lapse measurements (Figure 11), shows that significant spatial and temporal variability can be noticed. On the surface, it was noticed that the active channel course next to the culverts has witnessed an accumulation of flash floods due to lagging of the discharge (Figure 4). Generally, the time-lapse 2D-ERI indicates that the flash flood-wetted surficial sediments and water-bearing zones notably differ in resistivity ranges than the dry surface and subsurface zones. Firstly, on March 20 (Figure 11a), the near-surface layer (10 m thickness) showed low resistivity ranges (30–50 ohm-m) due to the infiltration of flash floods, which reached approximately up to 40 m underneath the main active channel. The Pliocene clays and sands, which underlie the southern terraces bounding the active channel, show the lowest resistivity ranges in the profiles (10–15 ohm-m). Figure 11a clearly shows that the wetted surface layer overlays a dry gravelly sand layer (>100 ohm-m) of 70 m thickness. The main water-bearing layer, beneath the gravelly sand layer, has intermediate resistivity ranges between 50 and 75 ohm-m and occupies the lowest part of the profile at 80 m depths from the surface. The water table was approximately at −10 m below the mean sea level.
Secondly, on March 30 (Figure 11b), the distribution and thickness of the wetted near-surface layer showed minor changes, with a slight lateral and vertical propagation downward, while the ground water-bearing layer showed lateral and vertical upward expansion at the expense of the overlying dry gravelly sand layer. The water table stood at approximately −6 m from the mean sea level. However, the thickness of the dry gravelly sand layer decreased by the expansion of the wetted surficial sediments and the water-bearing layer, yet no water infiltration was detected through the dry sand layer to the subsurface. Thirdly, on 19 April (Figure 11c), it can be observed that the notable gaining of the main water-bearing layer, where the water table is, met at zero elevation from the mean sea level. Finally, on 11 June, the wetted near-surface layer showed considerable lateral shrinking with an indication of limited wetting to the main stream course at depths of approximately 10 m above mean sea level (amsl). On the other hand, the water-bearing layer showed continuous vertical upward expansion to a level of 10 m amsl (Figure 11d).
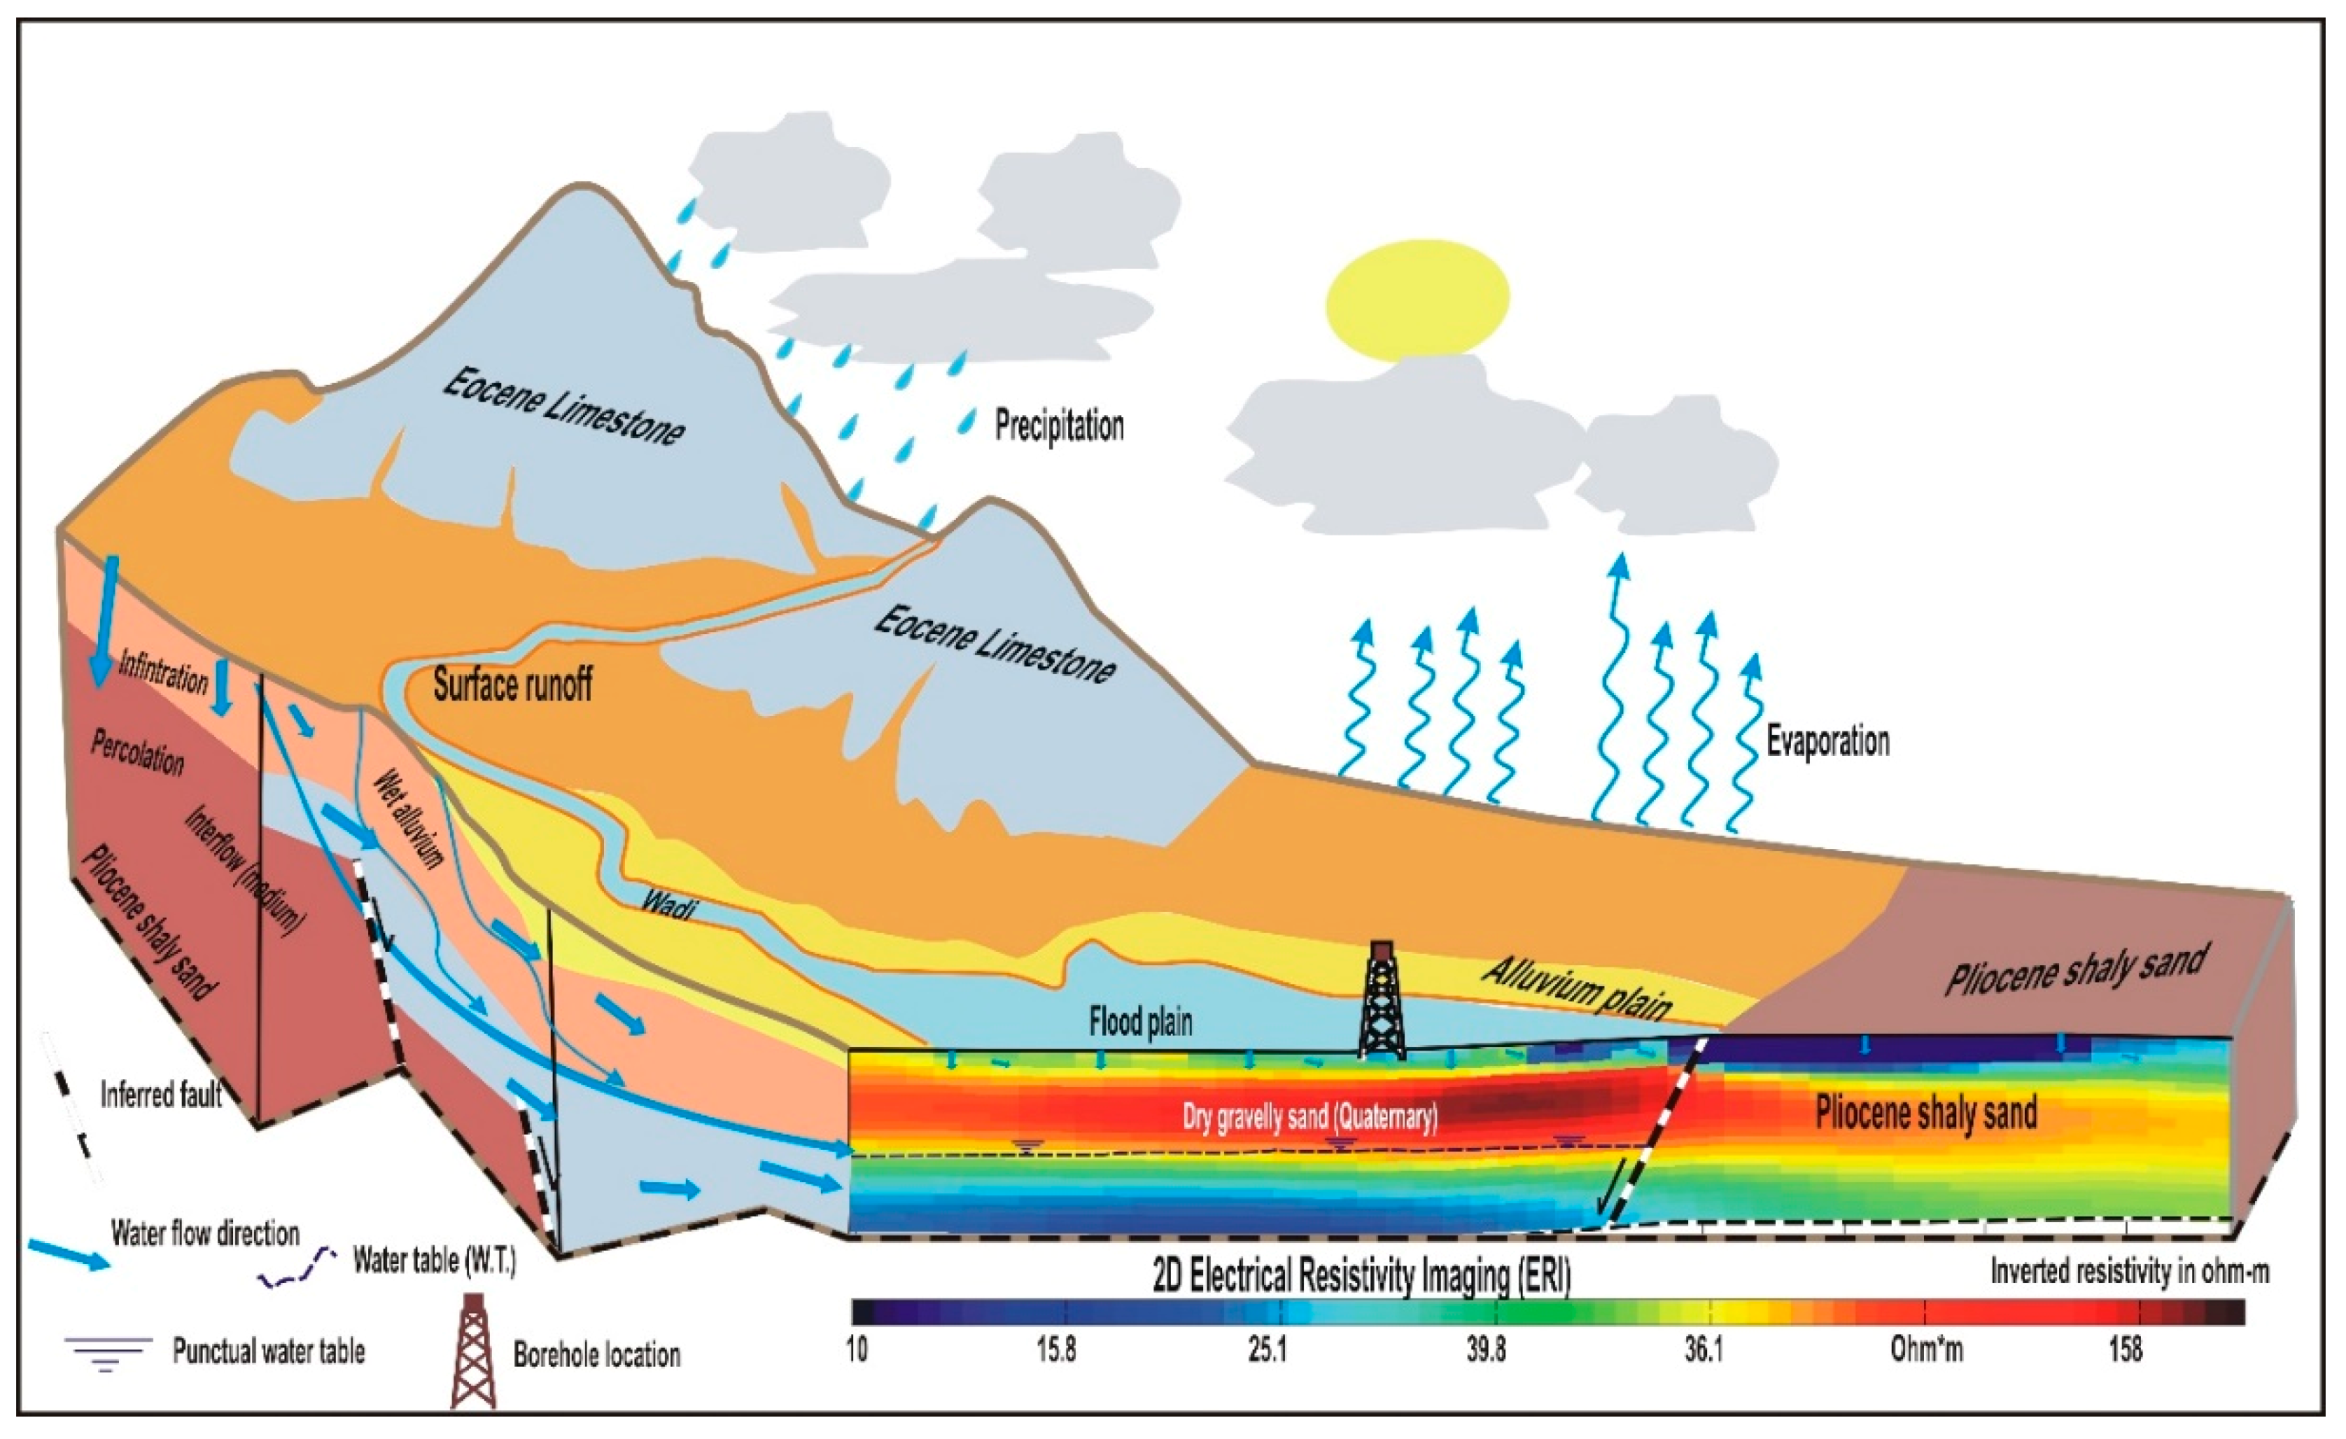
These observations extracted from the 2D-ERI monitoring over a three-month period indicate that considerable portions of infiltration from flash floods along active channels in desert environments are retained in the near-surface layers. On the other hand, the gained recharge that is capable of reaching the water table is likely taking place via regional throughflow in basin upstream areas rather than in the basin outlets from the accumulation of flash floods. This inference implies that, under arid conditions, recharge to alluvium aquifers from flash floods could occur in limited areas rather than the whole longitudinal active channel profile (Figure 12). These recharge areas could be underlain by sediments composed of coarse grain sizes, which enhance the deep percolation into the subsurface layers rather than being retained in the fine sediments of the near-surface layers. Moreover, enhanced infiltration could also occur in highly faulted zones within the basin, an assumption that is validated from isotopic analyses of groundwater in the Eastern Desert of Egypt [25].

5. Conclusions and Recommendations

The negative environmental and social impacts of flash floods in dryland areas have increased in the past few decades due to the interaction of anthropogenic activities and wadi systems prone to torrential storms. A lack of field data in these non-gauged areas represents one of the key challenges to verify and calibrate the hydrological modeling in these areas. An integrated remote sensing and geophysical approach was conducted to assess the flash flood hazards and water infiltration to alluvium aquifers in dryland basins, using the Wadi Atfeh catchment in the Eastern Desert of Egypt as a test site. The results show that the estimated peak discharge of the 13 March 2020 event (97 m3/h) exceeded the capacity of the culverts beneath the Eastern Military Highway (64 m3/h). This excess explains the destructive impact of the flash flood event. Additionally, the conveying channel that was constructed to channel the flood water to the Nile River does not match active streams mapped from multi-temporal Landsat images, which in turn hampered the proper drainage of the flash flood water, and consequently augmented its negative impacts. Mitigation measures have been recommended to overcome these negative impacts, including the construction of a check dam, the establishing of conveying channels along the extension of active streams, and essentially, to improve the capacity of culverts beneath roads that cut through the outlet of the Eastern Desert basins. Against the general agreement that flash flood water near the basin outlet essentially recharges the alluvium aquifers in the basin, time-lapse ERI demonstrated a limited connection between the wetted surficial sediments and the water-bearing layer at the downstream of the basin. Throughflow from selected locations in the basin is probably the main source of recharge to the alluvium aquifer. The findings suggest that utilizing an integrated remote sensing and time-lapse ERI can provide valuable information to flash flood hazard assessments and the dynamics of flash flood water infiltration to alluvium aquifers in desert environments.

Author Contributions

Individual contributions to the research is as follows: Conceptualization, O.E.-S., M.E.B., A.G., A.Z.A. and M.A.; methodology, O.E.-S., M.E.B., A.Z.A., M.A. and A.O.; formal analysis and investigation, O.E.-S., M.E.B., A.Z.A. and M.A.; writing—original draft preparation and review and editing, O.E.-S., M.E.B., A.G., A.Z.A. and M.A.; writing—review and editing, O.E.-S., M.E.B., A.G., A.Z.A. and M.A. All authors have read and agreed to the published version of the manuscript.

Funding

This research received no external funding.

Conflicts of Interest

The authors declare no conflict of interest.

References

  1. Borga, M.; Boscolo, P.; Zanon, F.; Sangati, M. Hydrometeorological analysis of the August 29, 2003 flash flood in the eastern Italian Alps. J. Hydrometeorol. 2007, 8, 1049–1067. [Google Scholar] [CrossRef]
  2. Ozturk, M.; Copty, N.; Saysel, A. Modeling the impact of land use change on the hydrology of a rural watershed. J. Hydrol. 2013, 497, 97–109. [Google Scholar] [CrossRef]
  3. Zhang, M.; Chen, F.; Liang, D.; Tian, B.; Yang, A. Use of Sentinel-1 GRD SAR Images to Delineate Flood Extent in Pakistan. Sustainability 2020, 12, 5784. [Google Scholar] [CrossRef]
  4. El Bastawesy, M.; El Ella, E.M.A. Quantitative estimates of flash flood discharge into waste water disposal sites in Wadi Al Saaf, the Eastern Desert of Egypt. J. Afr. Earth Sci. 2017, 136, 312–318. [Google Scholar] [CrossRef]
  5. Subyani, A.M. Hydrologic behavior and flood probability for selected arid basins in Makkah area, western Saudi Arabia. Arab. J. Geosci. 2009, 4, 817–824. [Google Scholar] [CrossRef]
  6. Sultan, M.; Wagdy, A.; Manocha, N.; Sauck, W.; Gelil, K.A.; Youssef, A.F.; Becker, R.; Milewski, A.; El Alfy, Z.; Jones, C. An integrated approach for identifying aquifers in transcurrent fault systems: The Najd shear system of the Arabian Nubian shield. J. Hydrol. 2008, 349, 475–488. [Google Scholar] [CrossRef]
  7. Moawad, M.B.; Abdel Aziz, A.O.; Mamtimin, B. Flash floods in the Sahara: A case study for the 28 January 2013 flood in Qena, Egypt. Geomat. Nat. Haz. Risk 2016, 7, 215–236. [Google Scholar] [CrossRef] [Green Version]
  8. Niyongabire, E.; Hassan, R.; Elhassan, E.; Mehdi, M. Use of digital elevation model in a GIS for flood susceptibility mapping: Case of Bujumbura City. In Proceedings of the 6th International Conference on Cartography and GIS, Albena, Bulgaria, 13–17 June 2016; pp. 241–248. [Google Scholar]
  9. Abdel-Fattah, M.; Kantoush, S.; Saber, M.; Sumi, T. Hydrological modeling of flash flood at Wadi Samail, Oman. Annu. Disaster Prev. Res. Inst. Koyto Univ. 2016, 59, 533–541. [Google Scholar]
  10. Besser, H.; Mokadem, N.; Redhouania, B.; Rhimi, N.; Khlifi, F.; Ayadi, Y.; Omar, Z.; Bouajila, A.; Hamed, Y. GIS-based evaluation of groundwater quality and estimation of soil salinization and land degradation risks in arid Mediterranean site (SW Tunisia). Arab. J. Geosci. 2017, 10, 350. [Google Scholar] [CrossRef]
  11. Saber, M.; Abdrabo, K.I.; Habiba, O.M.; Kantosh, S.A.; Sumi, T. Impacts of Triple Factors on Flash Flood Vulnerability in Egypt: Urban Growth, Extreme Climate, and Mismanagement. Geosciences 2020, 10, 24. [Google Scholar] [CrossRef] [Green Version]
  12. Azeez, O.; Elfeki, A.; Kamis, A.S.; Chaabani, A. Dam break analysis and flood disaster simulation in arid urban environment: The Um Al-Khair dam case study, Jeddah, Saudi Arabia. Nat. Hazards 2020, 100, 995–1011. [Google Scholar] [CrossRef]
  13. Othman, A.; Shaaban, F.; Abotalib, A.Z.; El-Saoud, W.A.; Gabr, S.S.; Habeebullah, T.; Hegazy, D. Assessment of Rockfalls in Mountainous Urban Areas, Western Saudi Arabia. Arab. J. Sci. Eng. 2020. [Google Scholar] [CrossRef]
  14. Rantz, S.E. Measurement and Computation of Streamflow; US Department of the Interior, Geological Survey: Virginia, VA, USA, 1982; Volume 2175.
  15. Robinson, J.B.; Hazell, W.F.; Young, W.S. Effects of August 1995 and July 1997 Storms in the City of Charlotte and Mecklenburg County. North Carolina; US Geological Survey Fact Sheet FS-036-98: Virginia, VA, USA, 1998. [Google Scholar]
  16. Holmes, R.R.; Dinicola, K. 100-Year Flood–It’s All about Chance; US Geological Survey General Information Product: Virginia, VA, USA, 2010; Volume 106. [Google Scholar]
  17. Rice, K.C.; Hornberger, G.M. Comparison of hydrochemical tracers to estimate source contributions to peak flow in a small, forested, headwater catchment. Water Resour. Res. 1998, 34, 1755–1766. [Google Scholar] [CrossRef]
  18. Smith, B.; Rodriguez, S. Spatial analysis of high-resolution radar rainfall and citizen-reported flash flood data in ultra-urban New York City. Water 2017, 9, 736. [Google Scholar] [CrossRef] [Green Version]
  19. Lamichhane, N.; Sharma, S. Development of flood warning system and flood inundation mapping using field survey and LiDAR data for the Grand River near the city of Painesville, Ohio. Hydrology 2017, 4, 24. [Google Scholar] [CrossRef] [Green Version]
  20. Liu, C.; Guo, L.; Ye, L.; Zhang, S.; Zhao, Y.; Song, T. A review of advances in China’s flash flood early-warning system. Nat. Hazards 2018, 92, 619–634. [Google Scholar] [CrossRef] [Green Version]
  21. Alfieri, L.; Thielen, J. A European precipitation index for extreme rain-storm and flash flood early warning. Meteorol. Appl. 2015, 22, 3–13. [Google Scholar] [CrossRef] [Green Version]
  22. El Bastawesy, M.; White, K.; Nasr, A. Integration of remote sensing and GIS for modelling flash floods in WadiHudain catchment, Egypt. Hydrol. Process. 2009, 23, 1359–1368. [Google Scholar] [CrossRef]
  23. Santo, A.; Nicoletta, M.; De Falco, M. Post flash flood survey: The 14th and 15th October 2015 event in the Paupisi-Solopaca area (Southern Italy). J. Maps 2017, 13, 19–25. [Google Scholar] [CrossRef] [Green Version]
  24. Yousif, M.; Hussien, H.; Abotalib, A.Z. The respective roles of modern and paleo recharge to alluvium aquifers in continental rift basins: A case study from El Qaa plain, Sinai, Egypt. Sci. Total Environ. 2020, 739, 139927. [Google Scholar] [CrossRef]
  25. Hussien, H.M.; Kehew, A.E.; Aggour, T.; Korany, E.; Abotalib, A.Z.; Hassanein, A.; Morsy, S. An integrated approach for identification of potential aquifer zones in structurally controlled terrain: Wadi Qena basin, Egypt. Catena 2017, 149, 73–85. [Google Scholar] [CrossRef]
  26. Janizadeh, S.; Avand, M.; Jaafari, A.; Phong, T.V.; Bayat, M.; Ahmadisharaf, E.; Prakash, I.; Pham, B.T.; Lee, S. Prediction success of machine learning methods for flash flood susceptibility mapping in the tafresh watershed, Iran. Sustainability 2019, 11, 5426. [Google Scholar] [CrossRef] [Green Version]
  27. Hosseini, F.S.; Choubin, B.; Mosavi, A.; Nabipour, N.; Shamshirband, S.; Darabi, H.; Haghighi, A.T. Flash-flood hazard assessment using ensembles and Bayesian-based machine learning models: Application of the simulated annealing feature selection method. Sci. Total Environ. 2020, 711, 135161. [Google Scholar] [CrossRef] [PubMed]
  28. Alipour, A.; Ahmadalipour, A.; Abbaszadeh, P.; Moradkhani, H. Leveraging machine learning for predicting flash flood damage in the Southeast US. Environ. Res. Lett. 2020, 15, 024011. [Google Scholar] [CrossRef]
  29. Sultan, M.; Yan, E.; Sturchio, N.; Wagdy, A.; Abdel Gelil, K.; Becker, R.; Manocha, N.; Milewski, A. Natural discharge: A key to sustainable utilization of fossil groundwater. J. Hydrol. 2007, 335, 25–36. [Google Scholar] [CrossRef]
  30. Abotalib, A.Z.; Sultan, M.; Elkadiri, R. Groundwater processes in Saharan Africa: Implications for landscape evolution in arid environments. Earth Sci. Rev. 2016, 156, 108–136. [Google Scholar] [CrossRef] [Green Version]
  31. Attwa, M.; Basokur, A.T.; Akca, I. Hydraulic conductivity estimation using direct current (DC) sounding data: A case study in East Nile Delta, Egypt. Hydrogeol. J. 2014, 22, 1163–1178. [Google Scholar] [CrossRef]
  32. Hübner, R.; Günther, T.; Heller, K.; Noell, U.; Kleber, A. Impacts of a capillary barrier on infiltration and subsurface stormflow in layered slope deposits monitored with 3-D ERT and hydrometric measurements. Hydrol. Earth Syst. Sci. 2017, 21, 5181. [Google Scholar] [CrossRef] [Green Version]
  33. Hojat, A.; Arosio, D.; Ivanov, V.I.; Loke, M.H.; Longoni, L.; Papini, M.; Tresoldi, G.; Zanzi, L. Quantifying seasonal 3D effects for a permanent electrical resistivity tomography monitoring system along the embankment of an irrigation canal. Near Surf. Geophys. 2020, 18, 427–443. [Google Scholar] [CrossRef]
  34. Henaish, A.; Attwa, M. Internal structural architecture of a soft-linkage transfer zone using outcrop and DC resistivity data: Implications for preliminary engineering assessment. Eng. Geol. 2018, 244, 1–13. [Google Scholar] [CrossRef]
  35. Attwa, M.; Zamzam, S. An integrated approach of GIS and geoelectrical techniques for wastewater leakage investigations: Active constraint balancing and genetic algorithms application. J. Appl. Geophys. 2020, 175, 103992. [Google Scholar] [CrossRef]
  36. Moreira, C.A.; Casagrande, M.F.S.; Borssatto, K. Analysis of the potential application of geophysical survey (induced polarization and DC resistivity) to a long-term mine planning in a sulfide deposit. Arab. J. Geosci. 2020, 13, 1–12. [Google Scholar] [CrossRef]
  37. McLachlan, P.; Chambers, J.; Uhlemann, S.; Sorensen, J.; Binley, A. Electrical resistivity monitoring of river–groundwater interactions in a Chalk river and neighboring riparian zone. Near Surf. Geophys. 2020, 18, 385–398. [Google Scholar] [CrossRef]
  38. Schmidt-Hattenberger, C.; Bergmann, P.; Labitzke, T.; Wagner, F.; Rippe, D. Permanent crosshole electrical resistivity tomography (ERT) as an established method for the long-term CO2 monitoring at the Ketzin pilot site. Int. J. Greenh. Gas Control. 2016, 52, 432–448. [Google Scholar] [CrossRef]
  39. Steelman, C.M.; Kennedy, C.S.; Capes, D.C.; Parker, B.L. Electrical resistivity dynamics beneath a fractured sedimentary bedrock riverbed in response to temperature and groundwater–surface water exchange. Hydrol. Earth Syst. Sci. 2017, 21, 3105. [Google Scholar] [CrossRef] [Green Version]
  40. Said, R. The Geology of Egypt. Bakema Rotterdam Broodfield 1990, 734, 28. [Google Scholar]
  41. Klitzsch, E.; List, F.K.; Pohlmann, G. Geological Map of Egypt; 3 Sheets, Scale 1:500,000; Conoco Coral and Egyptian General Petroleum Company: Cairo, Egypt, 1987. [Google Scholar]
  42. El-Sayed, S.A.; Morsy, S.M.; Zakaria, K.M. Recharge sources and geochemical evolution of groundwater in the Quaternary aquifer at Atfih area, the northeastern Nile Valley, Egypt. J. Afr. Earth Sci. 2018, 142, 82–92. [Google Scholar] [CrossRef]
  43. Morsy, S.M.; Abdel Monaim, N.A. Hydrological modeling for potentiality of water harvesting and land/use planning, wadi El Atfehy, Eastern Desert, Egypt. Egypt. J. Geol. 2018, 62, 1–19. [Google Scholar]
  44. Abotalib, A.Z.; Mohamed, R.S. Surface evidences supporting a probable new concept for the river systems evolution in Egypt: A remote sensing overview. Environ. Earth Sci. 2013, 69, 1621–1635. [Google Scholar] [CrossRef]
  45. RIGW (Research Institute for Groundwater). Explanatory Note on the Hydrogeological Map of Egypt, 1:500,000; University of Michigan Library: Cairo, Egypt, 1991. [Google Scholar]
  46. Sakran, S.; Said, S.M. Structural setting and kinematics of Nubian fault system, SE Western Desert, Egypt: An example of multi-reactivated intraplate strike-slip faults. J. Struct. Geol. 2018, 107, 93–108. [Google Scholar] [CrossRef]
  47. Sallam, O.M.; El Shewy, M.A.; Dawoud, M.A. New Reclamation Mega Projects and Increasing the Pressure on Water System in the Nile Valley and Delta in Egypt. In Proceedings of the WSTA 11th Gulf Water Conference, Water in the GCC. “Towards Efficient Management”, Muscat, Oman, 20–22 October 2014. [Google Scholar]
  48. Said, R. The Geological Evolution of the River Nile; Springer Science & Business Media: New York, NY, USA, 2012. [Google Scholar]
  49. Korany, E.A.; Soliman, M.M.; Faiad, B.J. Modeling of the hydrogeologic response of the Quaternary aquifer in the delta of El-Atfehy, eastern Desert, Egypt, and an assessment approach for development of groundwater resources. Ain Shams Sci. Bull. 1997, 35, 89e110. [Google Scholar]
  50. Yeh, H.F.; Chen, J.F.; Lee, C.H. Application of a water budget to evaluate rainfall recharge and slope stability. J. Chin. Inst. Environ. Eng. 2004, 14, 1e10. [Google Scholar]
  51. Masoud, M. Rainfall–runoff modeling of ungauged Wadis in arid environments (case study Wadi Rabigh–Saudi Arabia). Arab. J. Geosci. 2014, 8, 2587–2606. [Google Scholar] [CrossRef]
  52. de la Vega, M.; Osella, A.; Lascano, E. Joint inversion of Wenner and dipole–dipole data to study a gasoline-contaminated soil. J. Appl. Geophys. 2003, 54, 97–109. [Google Scholar] [CrossRef]
  53. Clément, R.; Descloitres, M.; Günther, T.; Oxarango, L.; Morra, C.; Laurent, J.P.; Gourc, J.P. Improvement of electrical resistivity tomography for leachate injection monitoring. Waste Manag. 2010, 30, 452–464. [Google Scholar] [CrossRef] [PubMed]
  54. Günther, T. DC2DInvRes-Direct Current 2D Inversion and Resolution. 2007. Available online: http://dc2dinvres.resistivity.net/ (accessed on 30 September 2019).
  55. LaBrecque, D.J.; Miletto, M.; Daily, W.; Ramirez, A.; Owen, E. The effects of noise on Occam’s inversion of resistivity tomography data. Geophysics 1996, 61, 538–548. [Google Scholar] [CrossRef]
  56. Ronczka, M.; Günther, T.; Grinat, M.; Wiederhold, H. Monitoring freshwater–saltwater interfaces with SAMOS–installation effects on data and inversion. Near Surf. Geophys. 2020, 18, 369–383. [Google Scholar] [CrossRef]
  57. Audenrieth, I.; Martin, R.; Yogeshwar, P.; Willig, D. Analysis of measurement errors from electrical resistivity imaging investigation of First World War mining tunnels in La Boisselle, France. Near Surf. Geophys. 2020, 18, 561–573. [Google Scholar] [CrossRef]
  58. Günther, T. Inversion Methods and Resolution Analysis for the 2D/3D Reconstruction of Resistivity Structures from DC- Measurements. Ph.D. Thesis, University of Mining and Technology, Freiberg, Germany, 2004. [Google Scholar]
  59. El Bastawesy, M.; White, K.H.; Gabr, S. Hydrology and geomorphology of the Upper White Nile Lakes and their relevance for water resources management in the Nile basin. Hydrol. Process. 2013, 27, 196–205. [Google Scholar] [CrossRef]
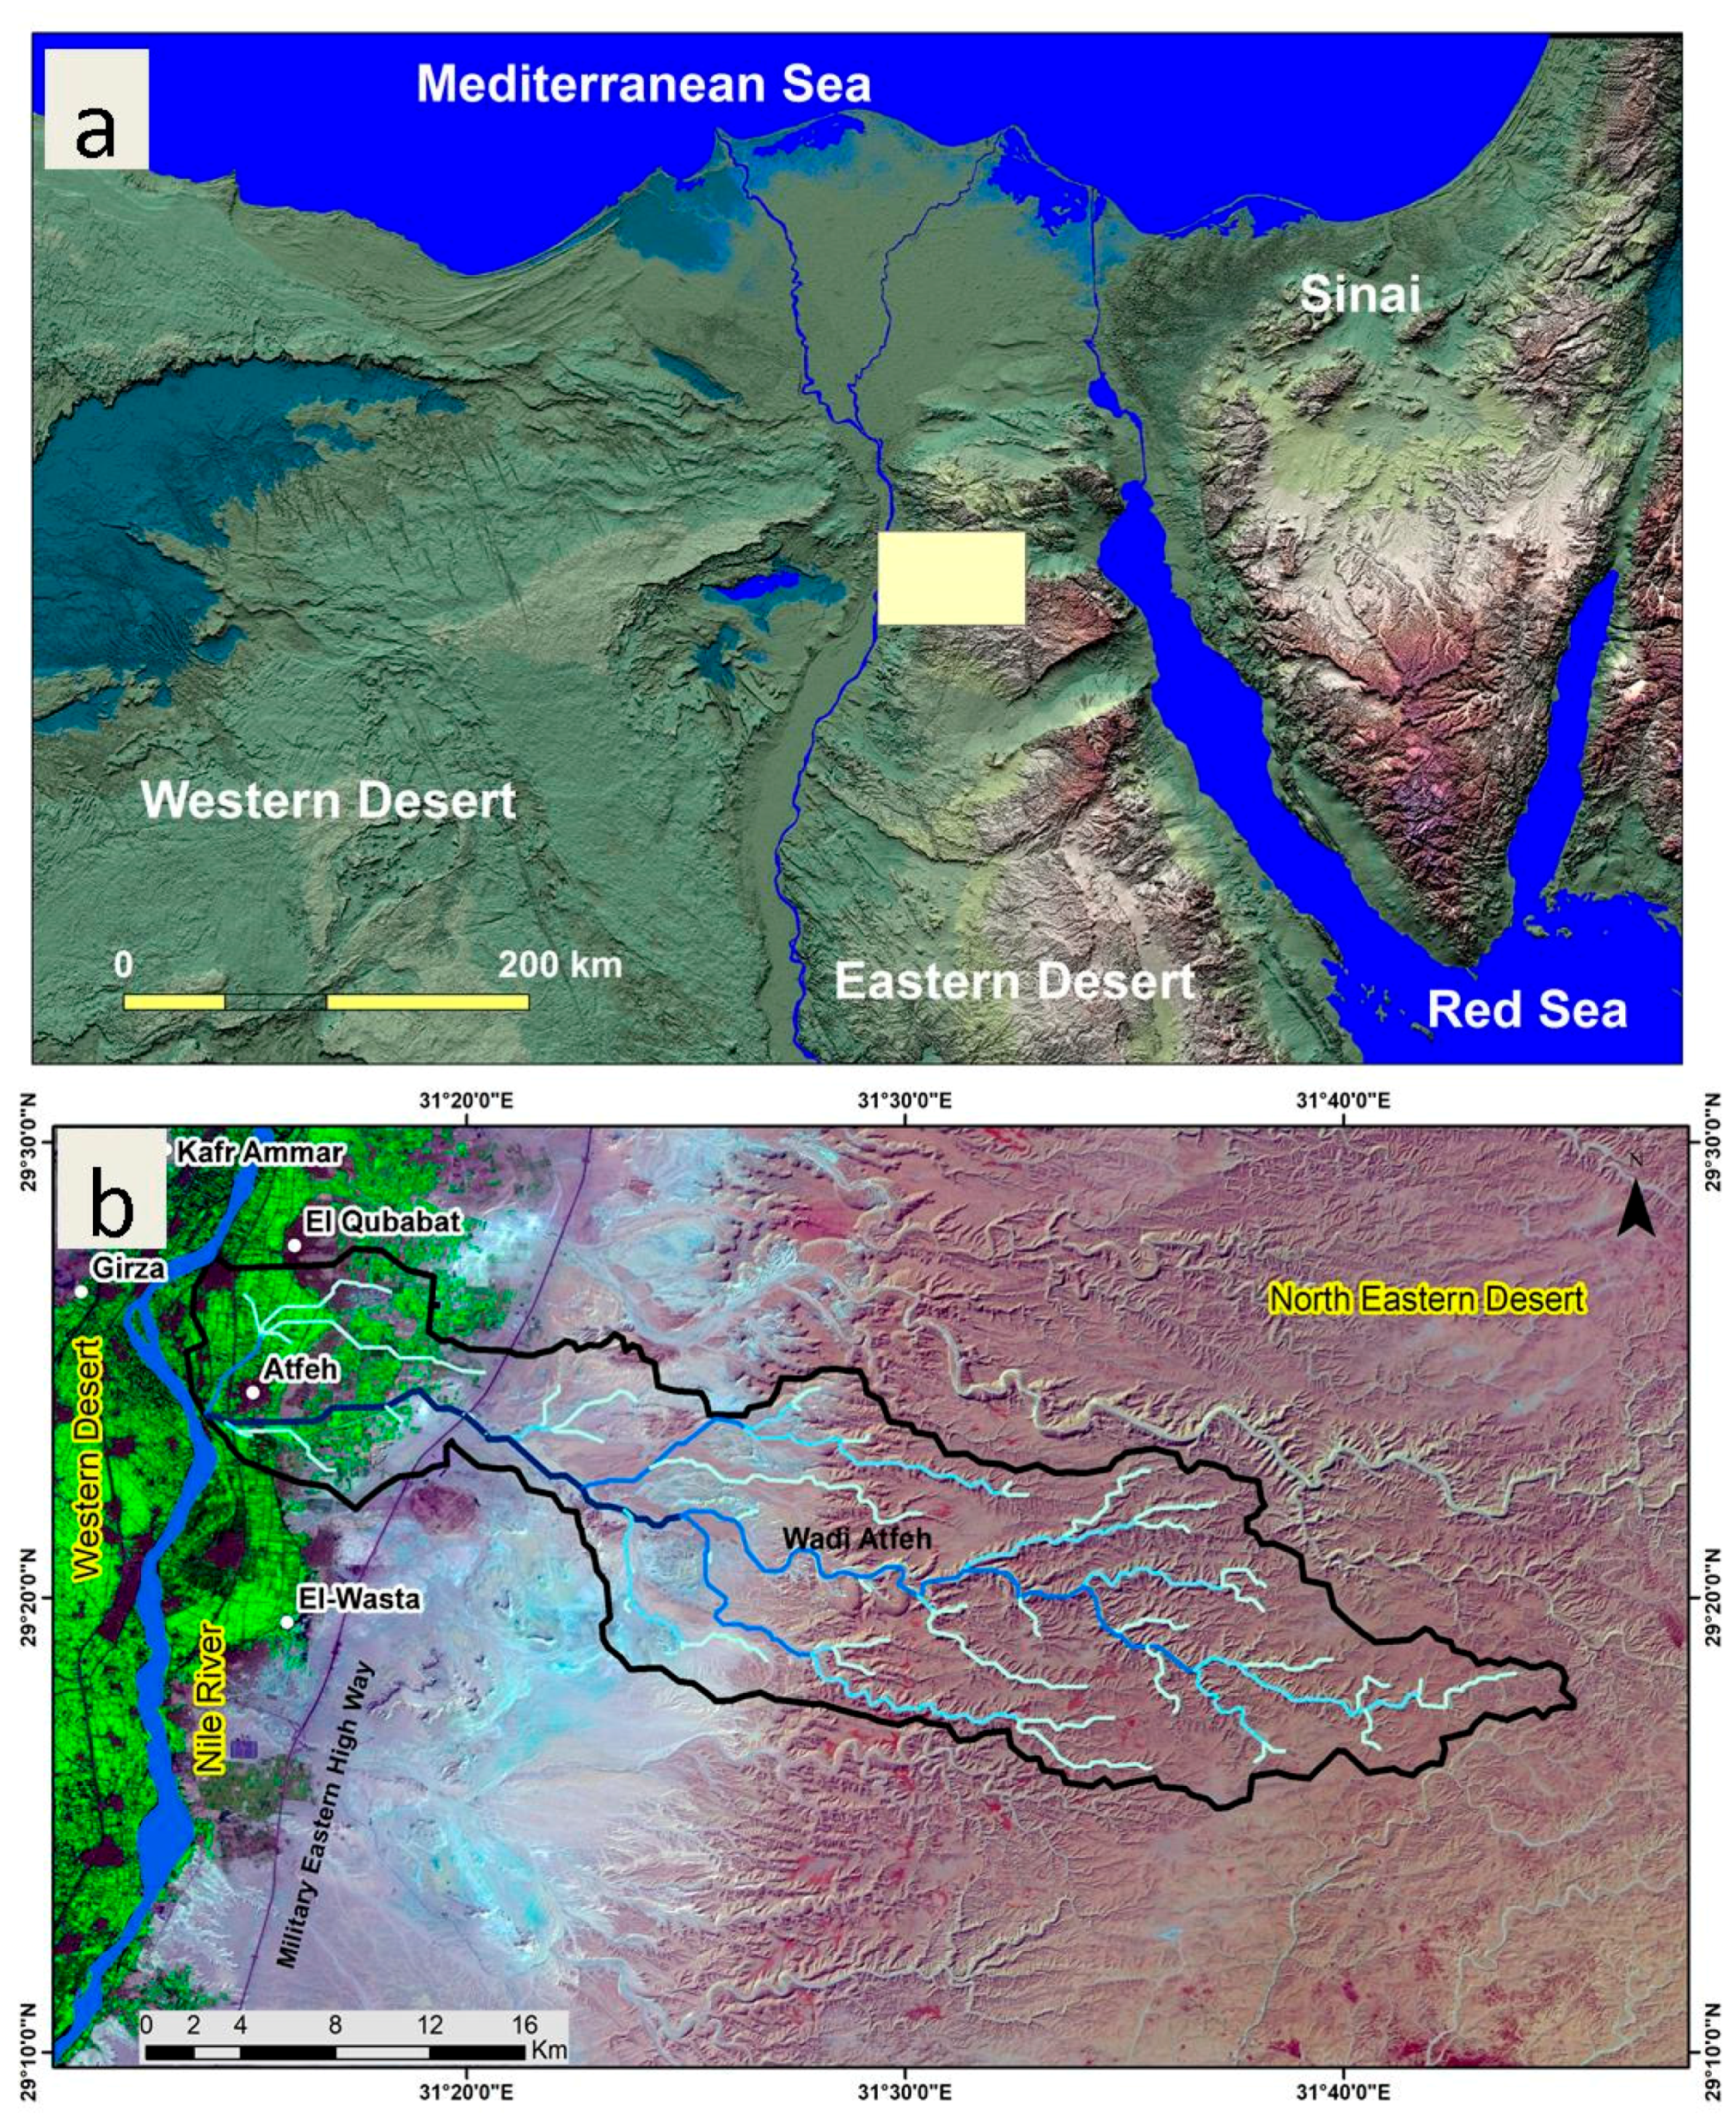
Figure 1. (a) Location map of the study area, showing the location of the Wadi Atfeh area on a painted hillshade image of Egypt. (b) The Wadi Atfeh catchment and its major stream networks superimposed on a Landsat 8 false color composite image are also shown.
Sustainability 12 10204 g001
Figure 2. Geological map of the Wadi Atfeh catchment and an inset of the rose diagram showing the dominant structural orientations in the study area, modified after [41].
Sustainability 12 10204 g002
Figure 3. Landsat 8 image showing the quarrying depressions before (a) and after (b) the flash flood event of 13 March 2020. The location of the measured electrical resistivity profile (red line) is also shown.
Sustainability 12 10204 g003
Figure 4. Field photographs along the intersection of the outlet of the Wadi Atfeh catchment and the Eastern Military Highway showing the dry conditions and limited vegetation of the catchment. Subfigures (ac) show the destructive impacts of the flash flood event of 2020 on the body of the road, and the accumulation of flash flood water along the Highway sides (d). The vegetation growth induced by surface soil wetting after the flash flood and the location of the culverts beneath the Military Eastern Highway, between 19 April 2020 (e) and (11 June 2020) (f), are also shown.
Sustainability 12 10204 g004
Figure 5. A flow chart summarizing the materials and methods included in the manuscript.
Sustainability 12 10204 g005
Figure 6. The time–area zones estimated from the derivatives of the digital elevation model (DEM) and the application of the Manning Equation inserted to the active channel.
Sustainability 12 10204 g006
Figure 7. Resistivity monitoring system configuration for resistivity data acquisition of a monitoring two-dimensional electrical resistivity imaging (2D-ERI) profile and the observed borehole for resistivity monitoring results validation.
Sustainability 12 10204 g007
Figure 8. Multi-temporal Landsat images showing the evolution of land use at the downstream of the Wadi Atfeh catchment, with different acquisition dates: (a) 7 November 1984, (b) 3 November 1994, and (c) 31 March 2020).
Sustainability 12 10204 g008
Figure 9. Simulated hydrographs for the Wadi Atfeh catchment with the infiltration using the estimated runoff coefficient from different DEMs.
Sustainability 12 10204 g009
Figure 10. Comparison of pseudo-sections obtained from the Wenner beta (Wb) array of 2D-ERI P1 (for location, see Figure 3) over the three months immediately following the flooding event. Note that the pseudo-depth levels (n) are 12.
Sustainability 12 10204 g010
Figure 11. Advanced time-lapse ERI inversion results of the measured apparent resistivity data over four months after flash flood events, showing the resistivity variations related to flood water infiltration: (a) 20 March 2020, (b) 30 March 2020, (c) 19 April 2020, and (d) 11 June 2020.
Sustainability 12 10204 g011
Figure 12. A schematic diagram showing the mechanism of recharge to the alluvium aquifer via regional throughflow rather than the infiltration of accumulated flash flood water in the basin outlet.
Sustainability 12 10204 g012
Table 1. Examples of historical flash flood events in the Eastern Desert of Egypt, from [4,7,11].
DateFlash Flood Affected ZonesRemarks
April 2018North Eastern Desert catchments and New CairoDamage to roads and vehicles
2015Wadi Assuiti and Wadi QenaDestroyed houses in the Eastern side of the Nile Valley
May 2014Wadi Al Saf and Wadi Atfeh North Eastern DesertDrowning of clay queries, road destruction, over-flooding of wastewater facilities
28 January 2013Wadi Qena basinFlooding of cultivated lands and destruction of road networks
13 November 1997Upper Egypt: Aswan, Sohag, Asyut, Minia, and QenaDeaths of 23 persons, destruction of 260 houses, over-flooding of thousands of hectares
1975Wadi Taref, Wadi Assuiti, and Sohag Governorate180 houses destroyed and 1500 citizen displaced
Publisher’s Note: MDPI stays neutral with regard to jurisdictional claims in published maps and institutional affiliations.