Article

Field and Modeling Study on Manual and Automatic Irrigation Scheduling under Deficit Irrigation of Greenhouse Cucumber

1
Water Relations and Field Irrigation Department, Agricultural and Biological Division, National Research Centre, 33 EL Bohouth St., Dokki, Giza 12622, Egypt
2
Faculty of Agricultural Engineering, Al-Azhar University, Cairo 11884, Egypt
3
Department of Botany & Microbiology, College of Science, King Saud University, Riyadh 11451, Saudi Arabia
*
Author to whom correspondence should be addressed.
Sustainability 2020, 12(23), 9819; https://doi.org/10.3390/su12239819
Submission received: 2 October 2020 / Revised: 12 November 2020 / Accepted: 18 November 2020 / Published: 24 November 2020

Abstract

:
The primary goal of all those working in the field of sustainable water management, particularly in the arid and semi-arid zones, is to increase irrigation efficiency, reduce irrigation water losses, and improve water productivity for all crops. This study assessed the automatic irrigation scheduling and irrigation management on the growth, yield, and water productivity of cucumber under greenhouse conditions. A field experiment was conducted using cucumber grown in aplastic greenhouse during the winter of 2017/18 and 2018/19 at the research farm station of the National Research Centre (NRC), El-Noubaria Region, Behaira Governorate, Egypt. In a split-plot experiment, two different methods to control irrigation scheduling (manual control (MC) and automatic control (AC)) were used in the main plots and three deficit irrigation treatments (100% of full irrigation (FI), 80% of FI, and 60% of FI). Through the obtained results, it was found that the use of the automatic control of the irrigation schedule led to an improvement in the productivity and quality characteristics of the cucumber crop. Automatic irrigation control created healthy conditions for the plant roots located under the least water stress. This led to an increase in nitrogen uptake at the ages of 3, 5, 7, and 9 weeks after planting in addition to improving the total leaf area and the chlorophyll content of leaves, which consequently had a greater effect on increasing yield and water productivity of cucumber. Although the highest values of cucumber productivity were obtained with irrigation at 100% of FI, there were no significant differences between 100% FI and 80% of FI, therefore it is preferable to irrigate at 80% of FI, and this means saving 20% of irrigation water that can be used to irrigate other areas. The SALTMED model simulating all of the following evaluation criteria performed well for soil moisture content and N-uptake as well as the leaves area, the yield, and water productivity of cucumber for all treatments for the two growing seasons 2017/18 and 2018/19, with the overall R2 of 0.882, 0.903, 0.975, 0.907, and 0.933, respectively.

1. Introduction

Water scarcity and its shortage are one of the most important and serious problems and challenges facing the irrigation process in the Arab Republic of Egypt and arid and semi-arid regions, hence the necessity to reduce the consumption of irrigation water. This can be achieved by many means, including the development and improvement of new and innovative technologies that can be an effective tool [1,2]. In arid countries as well as semi-arid regions, which are characterized by high population growth and low water resources, there is stress, negative impact, and high pressure on all sectors, chiefly the agricultural sectors to rationalize water consumption for irrigation and also rationalize the use of water for the urban and industrial sectors [3,4,5]. The agricultural production sector faces a great and dangerous challenge in increasing food production with less irrigation water, which can be achieved by many different technologies that lead to increased crop water productivity [6]. Increasing crop water productivity [7] is an important and necessary goal to increase the demand for food while increasing the rate of continuous population growth [8,9]. The increasing demand for scarce water resources resulted in all innovative and new applications competing with new irrigation technologies that aim to increase and improve water productivity for different crops [10] and Abdelraouf and Ragab [11]. The concept of increasing crop water productivity in the Arab Republic of Egypt and all dry areas is extremely important in light of the limited water resources resulting from limited rainfall [12]. To save part of the limited irrigation water, the application of modern irrigation methods and associated technologies is an important concept that must be undertaken and worked on in arid and semi-arid regions as is the case in Egypt [3,13].
Applying optimal irrigation scheduling and relying on water use patterns as well as the plantation’s response to the conditions of irrigation water shortage improve water productivity and water use efficiency. It is highly recommended to use drip irrigation methods due to their high efficiency in using water, which results in saving water and increasing water productivity [14]. Effective field pursuits with a drip irrigation system may affect the achievement of the objectives of increasing irrigation water savings and improving crop productivity [15,16]. Farmers and users of a drip irrigation system may suffer from the reduced hydraulic performance of this system due to error in design or management, and they may have to resort to using a system that is cheaper in financial cost if they are unable to manage capital needs. Inexperienced farmers will also have difficulty controlling irrigation scheduling with their irrigation systems in the most optimal way as well as having little experience monitoring irrigation system performance. Modern irrigation water management systems based on various environmental measurements provide better and significantly improved control of supply in relation to demand. In general, many irrigation systems are semi-automatic, using timers to control irrigation scheduling, i.e., the exact time of irrigation. Farmers should also renew these timers in a way that is more dependent on changes in environmental conditions and the water use requirements of the plant [17]. The use of automatic control systems in irrigation scheduling provides suitable solutions to overcome the unwanted effects resulting from the presence of either poor design, poor control and operation, or both. This advanced management and automatic control, when used in scheduling irrigation water for different crops, will be an effective and appropriate monitoring tool to increase irrigation efficiency [18]. Predicting irrigation water needs is an effective and key topic for automatic control systems in order to reach efficient and appropriate scheduling of irrigation water. In general, the results of studies conducted by [19,20,21] confirm the necessity and importance of using and applying automatic control systems to improve the performance of irrigation systems and methods, with the efficiency of water and energy use. Irrigation standardization plays an important and essential role in improving and increasing crop productivity, water productivity, and increasing net profits [22,23]. Effective and successful management of the limited amount of irrigation water required for various agricultural uses depends on better agricultural practices and techniques to improve water productivity [24,25].
Irrigation deficit (i.e., irrigation that falls below the water requirements critical to crop growth) is an effective irrigation-water-saving strategy where the cultivated crops are exposed to a certain level of water stress either during a certain period or throughout the entire growing season [26]. The main goal of using deficit irrigation” DI “is to increase water use efficiency.
Cucumber is one of the most popular and best vegetables grown in greenhouses in the Arab Republic of Egypt. The fresh crops of cucumbers are significantly affected by the irrigation schedule and by the total volume of irrigation water added in its different growth stages [27].
The model of SALTMED by Ragab [7] is considered one of the important models developed that has proven its ability to simulate many crops under various field administrations taking into account all irrigation systems, different water characteristics, irrigation strategies, different types of soils, crops, fertilizer applications, and the effect and simulation of abiotic stress such as drought, salinity, temperature, shallow groundwater quality, and various drainage systems. The current version of the model released in2015 allows simultaneous simulations of 20 fields, each with all irrigation systems, soil and crops, irrigation strategies and N fertilizers, etc. This model simulates soil moisture, dry matter, crop productivity and soil salinity, soil nitrogen dynamics and requirements for salinity filtration, nitrate filtration and drainage, soil temperature, evaporation and water absorption, water salinity, groundwater level, and effluent flow. This model was calibrated and validated using observed field data by [8,11,28,29,30,31,32,33,34,35,36,37,38]. They demonstrated and confirmed their high predictability of field-measured yield, soil moisture content, N-uptake, dry matter, yields, water productivity, and salinity.
This study aimed to improve the yield and water productivity of cucumber plants grown in aplastic greenhouse by the automatic control of irrigation scheduling under deficit irrigation strategy through a field and modeling study using the SALTMED model in the North of Egypt.

2. Materials and Methods

Location and climate of the experimental site: The field experiments were conducted during seasons 2017/2018 and 2018/2019 at the farm of National Research Centre (NRC) (latitude 30°30′1.4″ N, longitude 30°19′10.9″ E, and 21 m + mean sea level (MSL) at Al-Nubariya Region, Al-Buhayrah Governorate, Egypt. The experimental site has an arid climate with a hot dry summer and cool winter. The average data of temperature, wind speed, and relative humidity were obtained by the meteorological stations of the Central Laboratory for Agricultural Climate (CLAC), Agricultural Research Centre (ARC) as shown in Table 1.
Physical and chemical properties of soil and irrigation water: The irrigation water source was an irrigation channel passing through the experimental area, with an average pH of 7.36 and 0.42 dS m−1 as electrical conductivity (EC). The main physical and chemical properties of the soil are shown in Table 2.
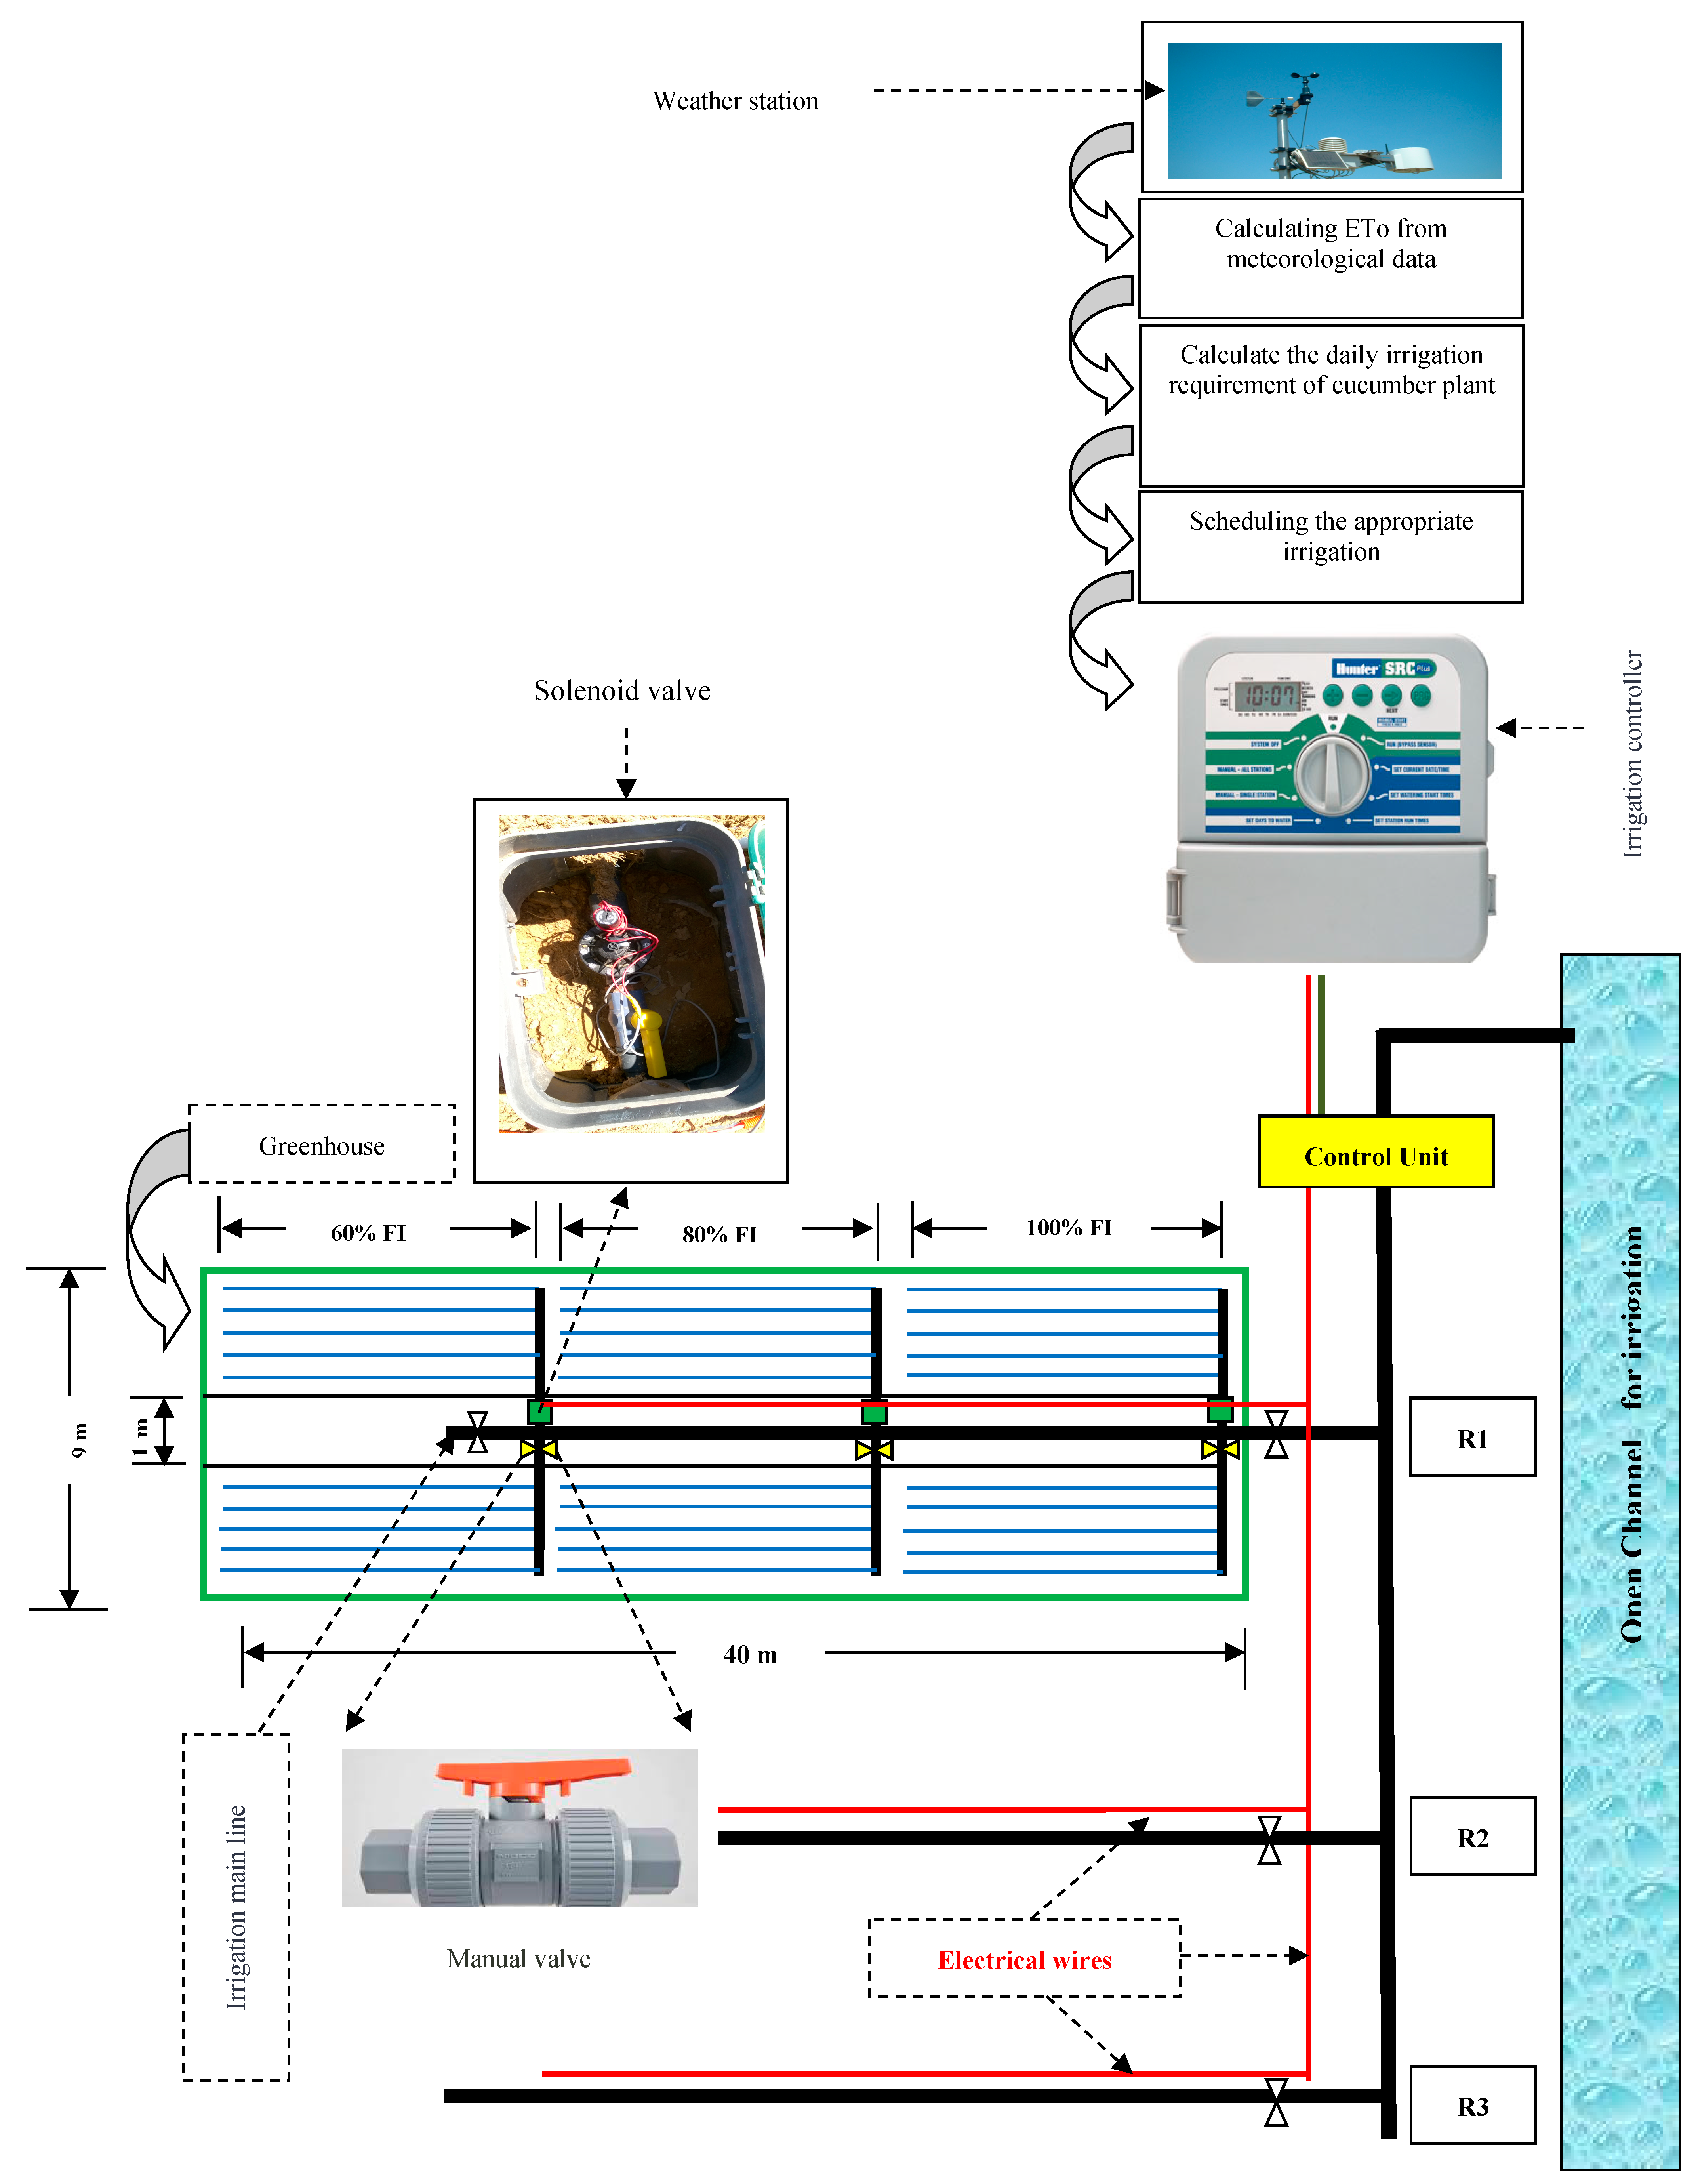
Experimental design: The experimental design and treatments were arranged in a split-plot design with five replications. The control methods of irrigation scheduling (manual control in irrigation scheduling (MC) and automatic control (AC)) were used in the main plots, and deficit irrigation strategy (100% full irrigation (FI), 80% FI, and 60%FI) were used in the sub-main plots as shown in Figure 1.
Irrigation system: The components of the irrigation system consisted of a pumping and filtration unit. It consists of a centrifugal pump with a 45 m3/h discharge and backflow prevention device, screen filter and pressure gauges, pressure regulator, control valves, and flow-meter. The main line was of PVC pipes, 110 mm in diameter, to convey the irrigation water from the source to the main control points in the field. Sub-main lines were of PVC pipes, 75 mm in diameter, connected to the main line. Manifold lines: PE pipes were 63 mm in diameter, connected to the sub-main line through control valve 2 and discharge gauge. Emitters were built in lateral tubes of PE with 16 mm in diameter and 40 m in length (emitter discharge was 4 lph at 1.0 bar operating pressure).
Estimation of seasonal irrigation water requirements for cucumber plants: The requirements of seasonal irrigation water for cucumber plants was estimated according to the meteorological data of the CLAC, Agricultural Research Centre, Dokki, Egypt, depending on the Penman–Monteith equation. The seasonal irrigation water requirements for cucumber plants were 6000 m3 ha−1 per season 2017/18 and 6100 m3 ha−1 per season 2018/19 for 100%FI, 4800 m3 ha−1 per season 2017/18 and 4880 m3 ha−1 per season 2018/19 for 80%FI, and 3600 m3 ha−1 per season 2017/18 and 3660 m3 ha−1 per season 2018/19 for 60%FI. The daily irrigation water was calculated by following Equation (1) for two seasons 2018 and 2019 for the drip irrigation system:
IRg = [(ETO × Kc × Kr)/IE] − R + LR
where IRg is gross irrigation requirements, mm/day, ETO is reference evapotranspiration, mm/day, Kc is crop factor (FAO−56), Kr is ground cover reduction factor, IE is irrigation efficiency, %, R is water received by the plant from sources other than irrigation, mm (for example rainfall), and LR is the amount of water required for the leaching of the salts, mm. Gross irrigation requirements were converted from mm/ha/day to m3/ha/day.
All agricultural practices were carried out according to the recommendations of the Ministry of Egyptian Agriculture for cucumber production in the El-Noubaria region.

Evaluation Parameters

Water stress in the effective roots zone of cucumber plant and soil moisture content: Soil moisture content was measured in the effective roots zone for cucumber plant (0–40 cm depth) before irrigation, and the field capacity and wilting point were taken as evaluation lines in consideration as an evaluation parameter for exposure of the range of plants to water stress (WS) [39]. Measurements were taken at soil depths at all growth stages of cucumber plants. Soil moisture content was measured by the profile probe device (PR2 Profile Probe https://www.delta-t.co.uk/pr2-profile-probe-sdi-12-version/.
Nitrogen uptake of cucumber plant: Nitrogen concentrations (% dry matter) in the fourth cucumber leaf grown under greenhouse conditions at 3, 5, 7, and 9 weeks from the age of the plant.
Leaves area of cucumber plant: Leaves area, cm2, was measured after 90 days from the transplanting of the cucumber plants grown under greenhouse conditions. The leaf area was determined by the CI-203 Handheld Laser Leaf Area Meter. Measurements were made easily by sweeping the scanner over a leaf to yield seven different parameters: area, width, length, perimeter, shape factor, aspect ratio, and void count.
Chlorophyll content of cucumber plant: Chlorophyll content, SPAD, was measured after 90 days from the transplanting of the cucumber plants grown under greenhouse conditions.
Total yield of cucumber: At the harvest time of cucumber, the total weight of fruits in each treatment was recorded by harvesting the cucumber (calculated as kg per 1 m2) fruits twice weekly, and then the total yield as ton per hectare was calculated.
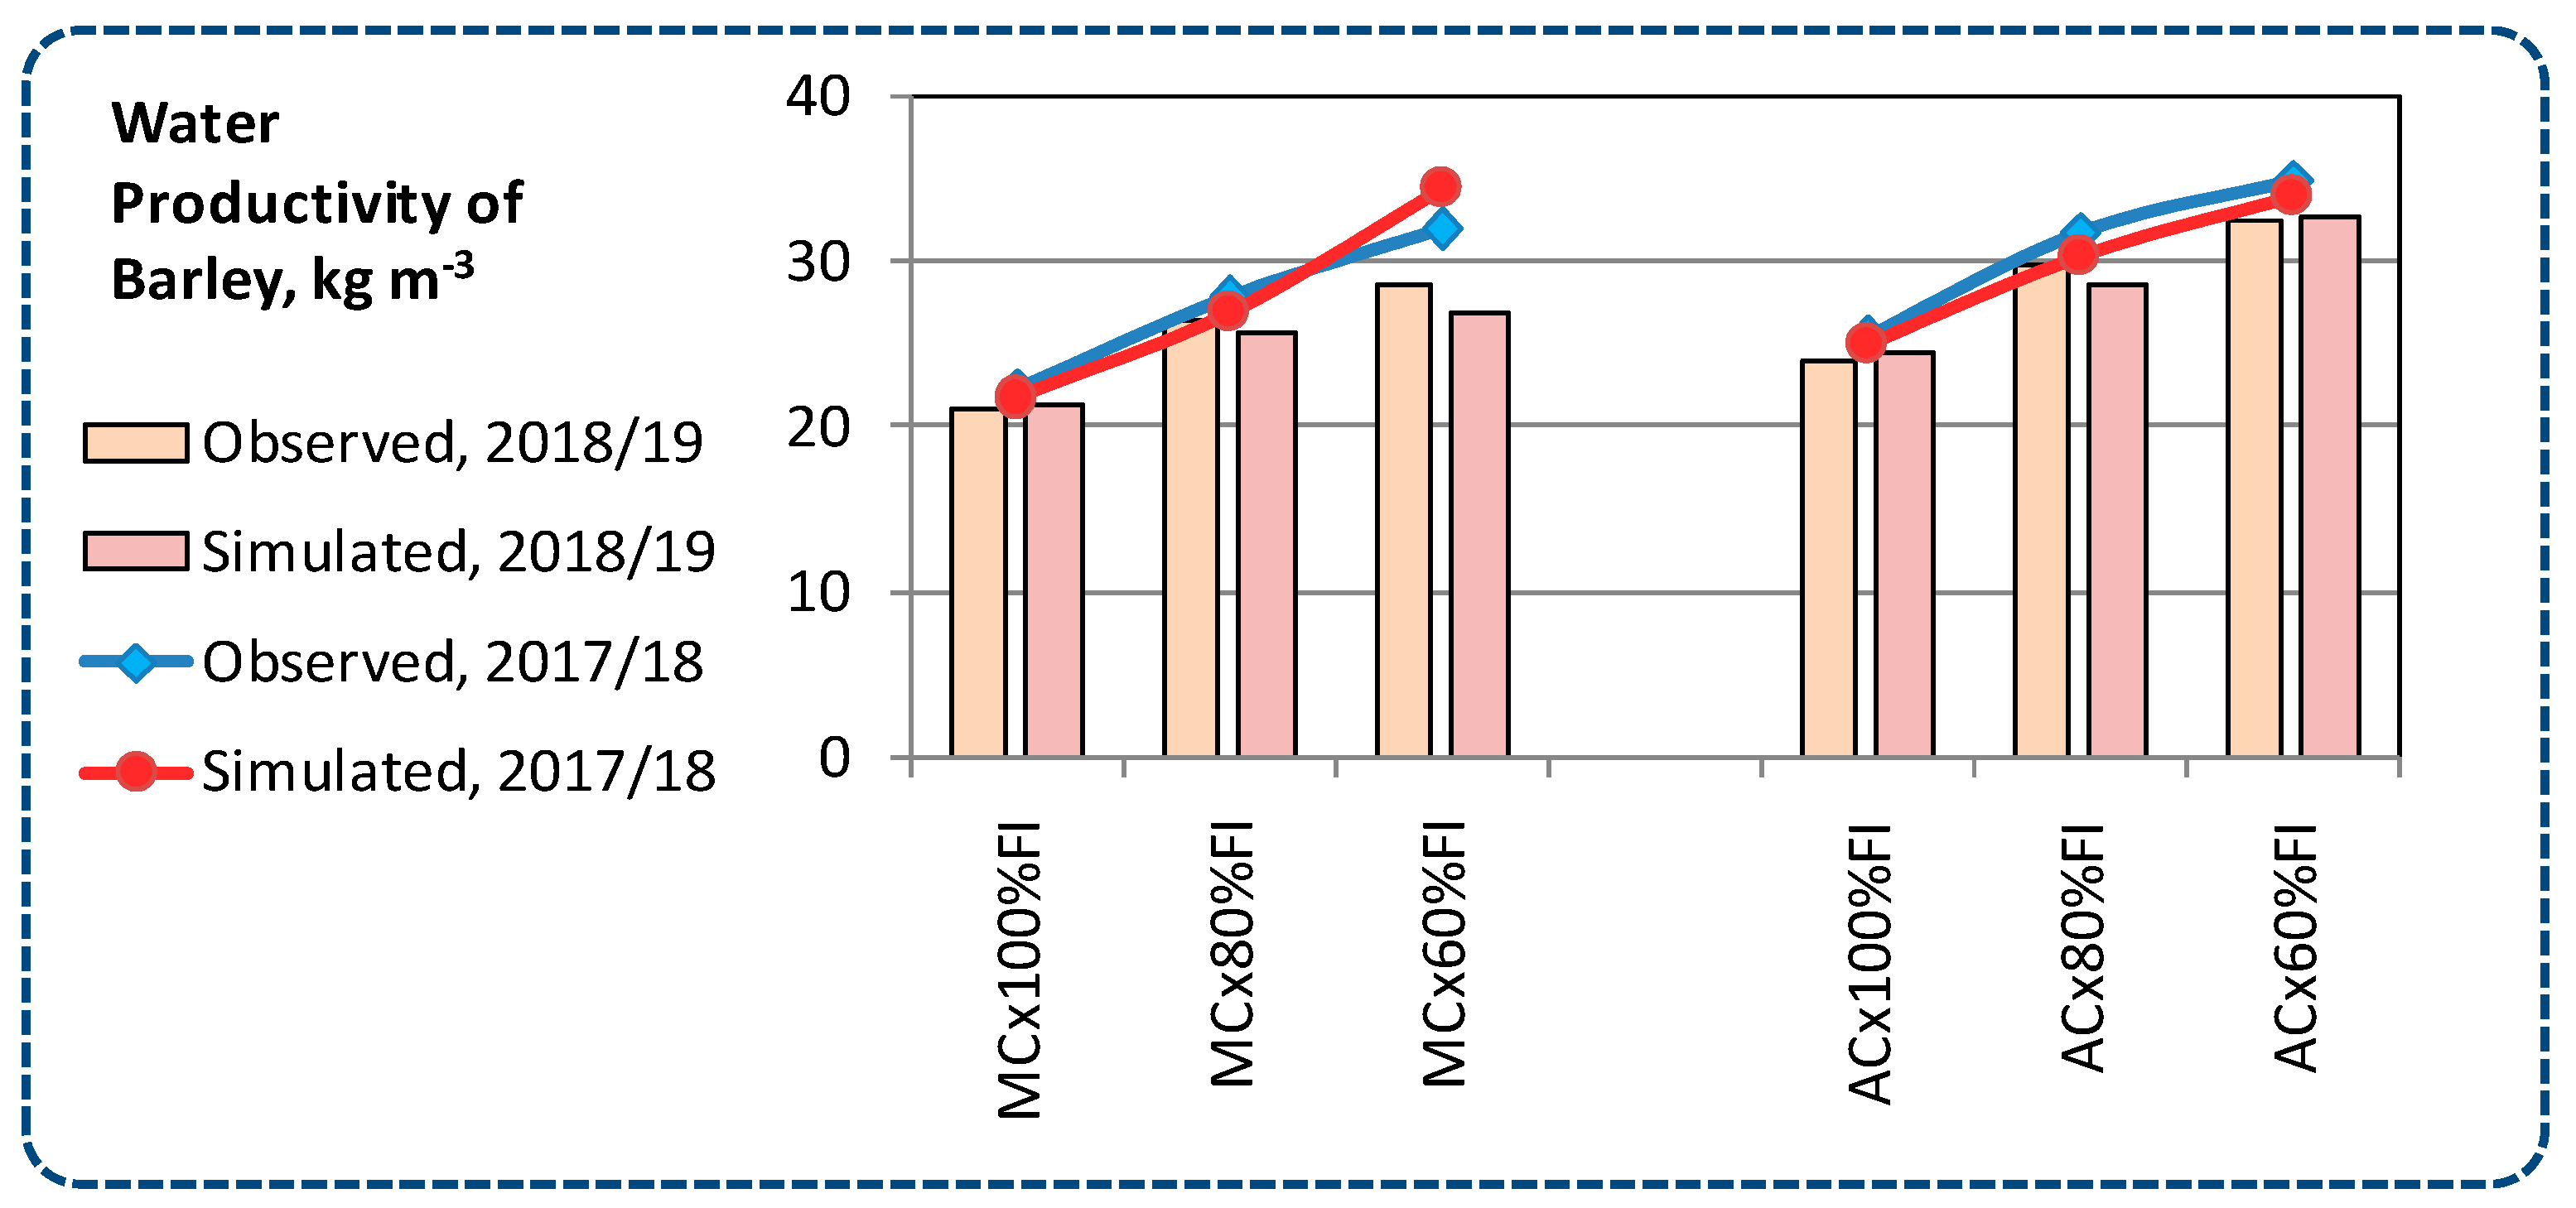
Water productivity of cucumber: WPcucumber was calculated according to James (1988) using Equation (2) as follows:
WPcucumber = Ey/Ir
where WPcucumber is water productivity of cucumber (kgcucumber m−3irrigation water), Ey is the economical yield (kgcucumber ha−1/season), and Ir is the applied amount of irrigation water (m3irrigation water ha−1/season).
SALTMED Model: The SALTMED model description and the equations for the key processes of evapotranspiration, water and solute transport, nitrogen cycle, drainage, and crop growth were provided by Ragab [7]. The model is suitable for all irrigation systems including drip irrigation. The reference evapotranspiration (ETo) according to Allen et al. [40] was selected for this study using meteorological data obtained from the field weather station. The crop-specific input data were the leaf area index (LAI), plant height, maximum and minimum root depth, and each growth stage duration. The irrigation input values were those applied in the field for drip irrigation with the deficit irrigation strategy during the 2017/2018 and 2018/2019 growing seasons. The soil profile was determined based on one layer of 0.00–0.40 m; this one layer provided the initial soil moisture conditions for the model run. The soil hydraulic property of that layer was obtained from field and laboratory measurements. Model calibration was performed for each control of irrigation scheduling (manual and automatic control) under study individually due to the different growth and other characteristics of each control as shown in Table 3, and the simulated soil moisture content, N-uptake, leaves area, total yield, and water productivity of cucumber at fully irrigated 100% FI under drip irrigation were compared with the measured and observed values during the 2017/2018 season by fine-tuning the relevant SALTMED model parameters. Model validation was carried out using the remaining treatments (using the calibrated parameter) by comparing simulated soil moisture content, N-uptake, leaves area, yield, and water productivity of cucumber with the observed ones. Statistical and graphical methods were used to evaluate model performance. For the model calibration and validation statistical measures, the R2, root mean square error (RMSE), and the coefficient of residual mass (CRM) were used. The CRM is a measure of the tendency of the model to overestimate or underestimate the measurements. Negative values for the CRM indicate that the model underestimates the measurements, and positive values for the CRM indicate a tendency to overestimate. For a perfect fit between observed and simulated data, values of RMSE, CRM, and R2 should equal 0.0, 0.0, and 1.0, respectively. All the analyses were made using Excel (Microsoft Inc.).
Statistical analysis: the combined analysis of all data for the two studied growing seasons were carried out based on [41], and values of the least significant differences (LSDat 5% level) were also calculated to compare the means of the different treatments.

3. Results and Discussion

3.1. Soil Moisture Content and Water Stress Inside the Root Zone of Cucumber Plant

The soil moisture content was measured before irrigation (as this indicates the extent to which the roots are exposed to water stress) within the root propagation area of cucumber plants for all treatments under the conditions of different control systems for irrigation scheduling and irrigation deficit strategy during the different growth stages of cucumber plants as in Figure 2.
The soil moisture content values were slightly higher with automatic irrigation scheduling compared to the manual irrigation scheduling system due to the regularity of water addition under the automatic irrigation scheduling system, with which there was no opportunity to subject the cucumber root spread area to water stress at all, but on the contrary with manual irrigation scheduling, which then exposed the spread area of cucumber roots to water stress at many times during the different growth stages due to the irregularity of adding water at inappropriate and inaccurate times with manual irrigation scheduling, as indicated in Figure 2.
The soil moisture content is affected by the irrigation deficit level. With a decrease in the amount of added irrigation water, the moisture content within the root spread area decreases, which exposes the roots of cucumber plants to increase the water stress on them with a decrease in the amount of added irrigation water, and this seems logical to a great extent. The highest values of soil moisture content before irrigation were when 100% of complete irrigation was added, and the lowest values were when 60% of complete irrigation was added, as shown in Figure 2.
The best and highest moisture content values were when scheduling automatic irrigation and when adding 100% of full irrigation, while the lowest values were when scheduling manual irrigation and when adding 60% of full irrigation. Overall, the model was able to simulate reasonably well the observed data during both the calibration and validation processes. These results are consistent with those obtained by Pulvento, Riccardi, Lavini, D’Andria, and Ragab [28] and Fghire, Wahbi, Anaya, Issa Ali, Benlhabib, and Ragab [34]. The model showed slightly higher values for the R2 during 2017/2018 for the layer (0–40 cm). Good correlation between the simulated and observations were obtained for the 2017/18 and 2018/19 seasons. Table 4 indicates that the SALTMED model proved its high sensitivity to simulate the soil moisture changes caused by irrigation events. Overall, the simulated and the observed soil moistures for all treatments combined showed a strong correlation for two seasons 2017/18 and 2018/19, with R2 for overall treatments being 0.882, as shown in Figure 2, Figure 3, Figure 4 and Table 4.

3.2. Nitrogen Uptake

Irrigation scheduling: Data presented in Figure 5, Figure 6 and Table 5 indicate that there is a markedly significant difference between automatic control (AC) and manual control (MC), where automatic control (AC) (when compared with manual control (MC)) has a more significant influence on nitrogen uptake by cucumber plants through the whole vegetative growth stage at 3, 5, 7, and 9 weeks from planting.
Deficit irrigation: Regarding the effect of deficit irrigation treatments, it was clear from the obtained data in Table 5 that deficit irrigation with the treatment of 100% FI followed by 80% FI had a significantly more obvious effect on nitrogen uptake by cucumber plants through the whole vegetative growth stage at 3, 5, 7, and 9 weeks from planting compared with 60% of deficit irrigation, and for that, deficit irrigation at 80% is economically more recommended than 100%.
Interaction: Deficit irrigation with the treatment of 80% and AC were found to be the best treatment for better nitrogen uptake by cucumber plants through the whole vegetative growth stage. This positive effect of automatic control on nitrogen uptake by cucumber plants through the whole vegetative growth stage could be due to more available water in the rhizosphere which reflects on nitrogen availability and simultaneous uptake of water and nitrogen at a satisfactory level [42]. On the other hand, over-irrigation can increase nitrogen uptake to higher levels which in turn could have a negative health effect because of the too-high nitrate content of vegetable fruits (Saleh et al.; 2010). Oppositely, under water stress drought conditions, nutrient uptake by roots was affected by a reduction in the transportation of nutrients from the soil surface to the absorbing roots, and transportation from the roots to the shoots was also adversely affected [43].
Figure 5, Figure 6 and Figure 7 indicated that a positive correlation between the simulated and observations was obtained for the 2017/18 and 2018/19 seasons, and the SALTMED model proved its high sensitivity to simulate the N-uptake under automatic irrigation scheduling and deficit irrigation scheduling.
Overall, the simulated and the observed N-uptake for all treatments combined showed a strong correlation for the two seasons 2017/18 and 2018/19, where R2 was 0.903.

3.3. Leaves Area and Chlorophyll Content of Cucumber Plant

Irrigation scheduling: As clearly shown from the obtained results in Figure 8, Figure 9 and Figure 10 and Table 6, there was a significant difference between the manual control (MC) and automatic control (AC) of the irrigation system, where automatic control (AC) had a more significant effect than manual control (MC) in terms of both leaves area and chlorophyll content of cucumber plants.
Deficit irrigation: Deficit irrigation with the treatment of 100%FI, followed by 80%FI, had a more significant effect than 60%, and for that 80% is more recommended than 100% (Table 6).
Interaction: The interaction effect between irrigation scheduling treatments and deficit irrigation treatments is presented in Figure 8, Figure 9, Figure 10 and Table 6. Deficit irrigation with the treatment of 80% and automatic control (AC) of irrigation were found to be the best treatment for better vegetative growth characteristics expressed as leaves area and chlorophyll content. Similar results were obtained by Amer et al. [44] who found that the highest leaf area index of cucumber plants was obtained when water was adequately applied (100%FI treatment). In addition, the same trend was detected by Saleh and Ibrahim [45] for cantaloupe (Cucumis melo L.). This positive effect of automatic control on the vegetative growth of cucumber plants reveals the superior management accomplished by the automatic control system for applying water in the most appropriate times, as well as the capability of the automatic control system to create the needed scheduling scheme related to avoiding over or deficit irrigation which may initiate poor uniformity.
Figure 8 and Figure 9 indicated that a positive correlation between the simulated and observations was obtained for the 2017/18 and 2018/19 seasons, and the SALTMED model proved its high sensitivity to simulate the leaves area under automatic irrigation scheduling and deficit irrigation scheduling.
Overall, the simulated and the observed leaves area for all treatments combined showed a strong correlation for the two seasons 2017/18 and 2018/19, where R2 was 0.975.

3.4. Total Yield of Cucumber

Irrigation scheduling: There was a significant difference between automatic control (AC) and manual control (MC) concerning the total fruit yield of cucumber plants (Table 7). Automatic control was found to be more significant in terms of the fruit yield of cucumber plants either as kg per individual plant or kg per square meter compared with manual control (MC).
Deficit irrigation: Regarding the influence of deficit irrigation treatments on the total fruit yield of cucumber, it was evident from the obtained data in Figure 11 and Table 7 that deficit irrigation with the treatment of 100%FI followed by 80%FI had a significantly more observable effect on the total fruit yield of cucumber compared with 60% of deficit irrigation, and for that, deficit irrigation at 80% is cost-effectively more recommended than 100%.In the present study, the cucumber fruit yields markedly increased with the increase of the amount of irrigation water applied. This result is in agreement with the former studies [46,47]. Moreover, Şimşek et al. [48] found that the fruit yield of cucumber ranged from 40 to 70 Mg/ha and was significantly reduced as the drip irrigation rate decreased from 900 to 600 mm.
Interaction: Deficit irrigation with the treatment of 80% and AC were found to be the best treatment for the total fruit yield of cucumber (Figure 11 and Table 7). This positive effect of automatic control on the total fruit yield of cucumber could be referred to as the better control achieved by the automatic control system for applying irrigation water at the most proper times. Moreover, the capability of the automatic control system to set up the desirable scheduling irrigation scheme allied with preventing over or deficit irrigation which may induce poor uniformity of water distribution. This means that the automatic control system resulted in avoiding over or deficit irrigation on cucumber plants, led to an increased water production (WP), and supported better irrigation scheduling which was found to be in harmony with those results obtained by [49,50,51].
The statistical analysis indicated that there were significant differences between crop yield values under all treatments during the two seasons 2017/18 and 2018/19. The yield was found to be decreasing in the following descending order for seasons 2017/18 and 2018/19: AC, 100%FI > AC, 80%FI > MC, 100%FI > MC, 80%FI > AC, 60%FI > MC, 60%FI. Figure 11 and Figure 12 show a good correlation between the observed and simulated crop yield for all treatments during the two seasons, with R2 of 0.907 for all treatments.

3.5. Water Productivity of Cucumber

Irrigation scheduling: There was a significant difference between automatic control (AC) and manual control (MC) concerning the water productivity of cucumber (WPcucumber) (Figure 13 and Table 7). Automatic control was found to be more significant in terms of WPcucumber, and it had a significantly higher value of WPcucumber compared with manual control (MC).
Deficit irrigation: Regarding the influence of deficit irrigation treatments on WPcucumber, it was evident from the obtained data in Figure 13 and Table 7 that deficit irrigation with the treatment of 100% FI followed by 80% FI had a significantly more observable effect on WPcucumber compared with 60% FI, and for that, deficit irrigation at 80% FI is cost-effectively more recommended than 100% FI. This result is in agreement with the former studies [46,47].
Interaction: Deficit irrigation with the treatment of 80% FI and AC control were found to be the best treatment for WPcucumber (Figure 13 and Table 7). This positive effect of automatic control on WPcucumber could be referred to as the better control achieved by the automatic control system for applying irrigation water at the most proper times. Moreover, the capability of the automatic control system to set up the desirable scheduling irrigation scheme allied with preventing over or deficit irrigation which may induce poor uniformity of water distribution.
The correlation analysis between the observed and the simulated water productivity showed a good agreement with R2 of 0.933 for all treatments during the two seasons (Figure 13 and Figure 14).

4. Conclusions

Therefore, it can be concluded that to provide optimum irrigation water and improve the yield and water productivity of cucumbers under greenhouse conditions in dry sandy soils, it is recommended to use the automatic control of the irrigation schedule with 80% of the full irrigation for the growth and production of cucumbers. This might be due to the accuracy of the applied water amounts and at the real favorite time for irrigation. The SALTMED model simulating all of the following evaluation criteria performed well for soil moisture content and N-uptake as well as the leaves area, yield, and water productivity of cucumber for all treatments for the two growing seasons 2017/18 and 2018/19, with R2 of 0.882, 0.903, 0.975, 0.907, and 0.933, respectively.

Author Contributions

Data curation, Investigation, A.R.; Software, H.G.G.; Writing—original draft preparation, A.R.; Writing—review and editing, H.G.G., N.A.B. and M.E.-Z. All authors have read and agreed to the published version of the manuscript.

Funding

This research received no external funding.

Acknowledgments

The authors extend their appreciation to the Researchers Supporting Project number (RSP-2020/229), King Saud University, Riyadh, Saudi Arabia.

Conflicts of Interest

The authors declare no conflict of interest.

References

  1. El-Metwally, I.M.; Abdelraouf, R.E.; Ahmed, M.A.; Mounzer, O.; Alarcón, J.J.; Abdelhamid, M.T. Response of Wheat (Triticum aestivum L.) Crop and Broad-Leaved Weeds to Different Water Requirements and Weed Management in Sandy Soils. Agriculture 2015, 61, 22–32. [Google Scholar] [CrossRef] [Green Version]
  2. Okasha, E.; Abdelraouf, R.E.; Abdou, M. Effect of land leveling and water applied methods on yield and irrigation water use efficiency of maize (Zea mays L.) grown under clay soil conditions. World Appl. Sci. J. 2013, 27, 183–190. [Google Scholar]
  3. Abdelraouf, R.E.; Abou-Hussein, S.; Abd-Alla, A.; Abdallah, E. Effect of short irrigation cycles on soil moisture distribution in root zone, fertilizers use efficiency and productivity of potato in new reclaimed lands. J. Appl. Sci. Res. 2012, 8, 3823–3833. [Google Scholar]
  4. Abdelraouf, R.E.; El-Shawadfy, M.; Ghoname, A.; Ragab, R. Improving crop production and water productivity using a new field drip irrigation design. Plant Arch. 2020, 20, 3553–3564. [Google Scholar]
  5. Hozayn, M.; Abdallha, M.M.; Abdelraouf, R.E.; El Saady, A.A.; Darwish, M.A. Applications of magnetic technology in agriculture: A novel tool for improving crop productivity (1): Canola. Afr. J. Agric. Res. 2016, 11, 441–449. [Google Scholar] [CrossRef] [Green Version]
  6. Abdelraouf, R.E.; El Habbasha, S.; Taha, M.; Refaie, K. Effect of irrigation water requirements and fertigation levels on growth, yield and water use efficiency in wheat. Middle-East J. Sci. Res. 2013, 16, 441–450. [Google Scholar]
  7. Ragab, R. Integrated Management Tool for Water, Crop, Soil and N-Fertilizers: The Saltmed Model. Irrig. Drain. 2015, 64, 1–12. [Google Scholar] [CrossRef] [Green Version]
  8. Abdelraouf, R.E.; Ragab, R. Applying partial root drying drip irrigation in the presence of organic mulching. Is that the best irrigation practice for arid regions? Field and modelling study using the saltmed model. Irrig. Drain. 2018, 67, 491–507. [Google Scholar] [CrossRef]
  9. Bakry, A.; Abdelraouf, R.E.; Ahmed, M.; El-Karamany, M. Effect of drought stress and ascorbic acid foliar application on productivity and irrigation water use efficiency of wheat under newly reclaimed sandy soil. J. Appl. Sci. Res. 2012, 8, 4552–4558. [Google Scholar]
  10. Abd El-Baset, M.M.; Abdelraouf, R.E.; Wahba, S.; El-Bagouri, K.; El-Gindy, A.-G. Scheduling Irrigation using automatic tensiometers for pea crop. Agric. Eng. Int. CIGR J. 2018, 19, 174–183. [Google Scholar]
  11. Abdelraouf, R.E.; Ragab, R. Is the Partial Root Drying Irrigation Method Suitable for Sandy Soils? Field Experiment and Modelling Using the Saltmed Model. Irrig. Drain. 2018, 67, 477–490. [Google Scholar] [CrossRef] [Green Version]
  12. Hozayn, M.; El Monem, A.A.A.; Abdelraouf, R.E.; Abdalla, M.M. Do Magnetic Water Affect Water Use Efficiency, Quality and Yield of Sugar Beet (Beta vulgaris L.) Plant under Arid Regions Conditions? J. Agron. 2013, 12, 1–10. [Google Scholar] [CrossRef] [Green Version]
  13. El-Habbasha, S.; Okasha, E.; Abdelraouf, R.E.; Mohammed, A. Effect of pressured irrigation systems, deficit irrigation and fertigation rates on yield, quality and water use efficiency of groundnut. Int. J. Chem.Tech. Res. 2014, 7, 475–487. [Google Scholar]
  14. Luquet, D.; Vidal, A.; Smith, M.; Dauzat, J. ‘More crop per drop’: How to make it acceptable for farmers? Agric. Water Manag. 2005, 76, 108–119. [Google Scholar] [CrossRef]
  15. van der Kooij, S.; Zwarteveen, M.; Boesveld, H.; Kuper, M. The efficiency of drip irrigation unpacked. Agric. Water Manag. 2013, 123, 103–110. [Google Scholar] [CrossRef]
  16. Lankford, B. Fictions, fractions, factorials and fractures; on the framing of irrigation efficiency. Agric. Water Manag. 2012, 108, 27–38. [Google Scholar] [CrossRef]
  17. Burnett, S.E.; van Iersel, M.W. Morphology and Irrigation Efficiency of Gaura lindheimeri Grown with Capacitance Sensor-controlled Irrigation. HortScience 2008, 43, 1555–1560. [Google Scholar] [CrossRef] [Green Version]
  18. Smarsly, K. Agricultural ecosystem monitoring based on autonomous sensor systems. In Proceedings of the 2013 Second International Conference on Agro-Geoinformatics (Agro-Geoinformatics), Fairfax, VA, USA, 12–16 August 2013. [Google Scholar]
  19. Kim, Y.; Evans, R.G.; Iversen, W.M. Remote sensing and control of an irrigation system using a distributed wireless sensor network. IEEE Trans. Instrum. Meas. 2008, 57, 1379–1387. [Google Scholar]
  20. Kim, Y.; Evans, R.G.; Iversen, W.M. Evaluation of Closed-Loop Site-Specific Irrigation with Wireless Sensor Network. J. Irrig. Drain. Eng. 2009, 135, 25–31. [Google Scholar] [CrossRef] [Green Version]
  21. Pfitscher, L.L.; Bernardon, D.P.; Kopp, L.M.; Heckler, M.V.T.; Behrens, J.; Montani, P.B.; Thome, B. Automatic control of irrigation systems aiming at high energy efficiency in rice crops. In Proceedings of the 2012 8th International Caribbean Conference on Devices, Circuits and Systems (ICCDCS), Playa Del Carmen, Mexico, 14–17 March 2012. [Google Scholar]
  22. Li, J.; Kawano, H. The areal distribution of soil moisture under sprinkler irrigation. Agric. Water Manag. 1996, 32, 29–36. [Google Scholar] [CrossRef]
  23. López-Mata, E.; Tarjuelo, J.; De Juan, J.; Ballesteros, R.; Domínguez, A. Effect of irrigation uniformity on the profitability of crops. Agric. Water Manag. 2010, 98, 190–198. [Google Scholar] [CrossRef]
  24. Howell, T.A. Enhancing Water Use Efficiency in Irrigated Agriculture. Agron. J. 2001, 93, 281–289. [Google Scholar] [CrossRef] [Green Version]
  25. Tambussi, E.; Bort, J.; Araus, J. Water use efficiency in C3 cereals under Mediterranean conditions: A review of physiological aspects. Ann. Appl. Biol. 2007, 150, 307–321. [Google Scholar] [CrossRef]
  26. Pereira, L.S.; Oweis, T.; Zairi, A. Irrigation management under water scarcity. Agric. Water Manag. 2002, 57, 175–206. [Google Scholar] [CrossRef]
  27. Mao, Z.; Zhang, Y.; Yu, Z. Water Requirement and Irrigation Scenarios of Summer Maize Production Aided by Crop Growth Simulation Model. Acta Agron. Sin. 2003, 29, 419–426. [Google Scholar]
  28. Pulvento, C.; Riccardi, M.; Lavini, A.; D’Andria, R.; Ragab, R. Parameterization and Field Validation of Saltmed Model for Grain Amaranth Tested in South Italy. Irrig. Drain. 2015, 64, 59–68. [Google Scholar] [CrossRef]
  29. Ragab, R.; Malash, N.; Gawad, G.A.; Arslan, A.; Ghaibeh, A. A holistic generic integrated approach for irrigation, crop and field management: 2. The SALTMED model validation using field data of five growing seasons from Egypt and Syria. Agric. Water Manag. 2005, 78, 89–107. [Google Scholar] [CrossRef]
  30. Ragab, R.; Malash, N.; Gawad, G.A.; Arslan, A.; Ghaibeh, A. A holistic generic integrated approach for irrigation, crop and field management: 1. The SALTMED model and its calibration using field data from Egypt and Syria. Agric. Water Manag. 2005, 78, 67–88. [Google Scholar] [CrossRef]
  31. Rameshwaran, P.; Qadir, M.; Ragab, R.; Arslan, A.; Majid, G.A.; Abdallah, K. Tolerance Of Faba Bean, Chickpea And Lentil To Salinity: Accessions’ Salinity Response Functions. Irrig. Drain. 2015, 65, 49–60. [Google Scholar] [CrossRef] [Green Version]
  32. Rameshwaran, P.; Tepe, A.; Yazar, A.; Ragab, R. The Effect of Saline Irrigation Water on the Yield of Pepper: Experimental and Modelling Study. Irrig. Drain. 2014, 64, 41–49. [Google Scholar] [CrossRef] [Green Version]
  33. Rameshwaran, P.; Tepe, A.; Yazar, A.; Ragab, R. Effects of drip-irrigation regimes with saline water on pepper productivity and soil salinity under greenhouse conditions. Sci. Hortic. 2016, 199, 114–123. [Google Scholar] [CrossRef] [Green Version]
  34. Fghire, R.; Wahbi, S.; Anaya, F.; Issa Ali, O.; Benlhabib, O.; Ragab, R. Response of Quinoa to Different Water Management Strategies: Field Experiments and Saltmed Model Application Results. Irrig. Drain. 2015, 64, 29–40. [Google Scholar] [CrossRef]
  35. Ince Kaya, Ç.; Yazar, A. Saltmed Model Performance for Quinoa Irrigated with Fresh and Saline Water in a Mediterranean Environment. Irrig. Drain. 2016, 65, 29–37. [Google Scholar] [CrossRef]
  36. Aly, A.A.; Al-Omran, A.M.; Khasha, A.A. Water management for cucumber: Greenhouse experiment in Saudi Arabia and modeling study using SALTMED model. J. Soil Water Conserv. 2015, 70, 1–11. [Google Scholar] [CrossRef]
  37. Arslan, A.; Majid, G.A.; Abdallah, K.; Rameshwaran, P.; Ragab, R.; Singh, M.; Qadir, M. Evaluating the Productivity Potential of Chickpea, Lentil and Faba Bean Under Saline Water Irrigation Systems. Irrig. Drain. 2016, 65, 19–28. [Google Scholar] [CrossRef] [Green Version]
  38. Abdelraouf, R.E.; Ragab, R. Effect of Fertigation Frequency and Duration on Yield and Water Productivity of Wheat: Field and Modelling Study Using the Saltmed Model. Irrig. Drain. 2018, 67, 414–428. [Google Scholar] [CrossRef] [Green Version]
  39. Abdelraouf, R.E.; El-Shawadfy, M.; Fadl, A.; Bakr, B. Effect of deficit irrigation strategies and organic mulching on yield, water productivity and fruit quality of navel orange under arid regions conditions. Plant Arch. 2020, 20, 3505–3518. [Google Scholar]
  40. Allen, R.G.; Pereira, L.S.; Raes, D.; Smith, M. Guidelines for computing crop water requirements. In Irrigation and Drainage Paper; FAO: Roma, Italy, 1998; Volume 56, p. 300. [Google Scholar]
  41. Snedecor, G.; Cochran, W. Statistical Methods, 7th ed.; Iowa State University Press: Iowa City, IA, USA, 1982; p. 511. [Google Scholar]
  42. O’Neill, P.M.; Shanahan, J.F.; Schepers, J.S.; Caldwell, B. Agronomic Responses of Corn Hybrids from Different Eras to Deficit and Adequate Levels of Water and Nitrogen. Agron. J. 2004, 96, 1660–1667. [Google Scholar] [CrossRef] [Green Version]
  43. Buljovcic, Z.; Engels, C. Nitrate uptake ability by maize roots dur-ing and after drought stress. Plant Soil 2001, 229, 125–135. [Google Scholar] [CrossRef]
  44. Amer, K.H.; Midan, S.A.; Hatfield, J.L. Effect of Deficit Irrigation and Fertilization on Cucumber. Agron. J. 2009, 101, 1556–1564. [Google Scholar] [CrossRef] [Green Version]
  45. Saleh, M.; Ibrahim, M. Effect of different irrigation levels on production, quality, and storage ability of cantaloupe (Cucumis melo L.) grown under polyethylene low tunnels in a newly reclaimed land. Egypt. J. Agric. Res. 2007, 32, 1109–1124. [Google Scholar]
  46. Ertek, A.; Şensoy, S.; Gedik, İ.; Küçükyumuk, C. Irrigation scheduling based on pan evaporation values for cucumber (Cucumis sativus L.) grown under field conditions. Agric. Water Manag. 2006, 81, 159–172. [Google Scholar] [CrossRef]
  47. Wang, Z.; Liu, Z.; Zhang, Z.; Liu, X. Subsurface drip irrigation scheduling for cucumber (Cucumis sativus L.) grown in solar greenhouse based on 20 cm standard pan evaporation in Northeast China. Sci. Hortic. 2009, 123, 51–57. [Google Scholar] [CrossRef]
  48. Şimşek, M.; Tonkaz, T.; Kaçıra, M.; Çömlekçioğlu, N.; Doğan, Z. The effects of different irrigation regimes on cucumber (Cucumbis sativus L.) yield and yield characteristics under open field conditions. Agric. Water Manag. 2005, 73, 173–191. [Google Scholar] [CrossRef]
  49. Dukes, M.; Muñoz-Carpena, R.; Zotarelli, L.; Icerman, J.; Scholberg, J. Soil moisture-based irrigation control to conserve water and nutrients under drip irrigated vegetable production. Jorn. Investig. Zona Saturada 2007, 8, 229–236. [Google Scholar]
  50. El Marazky, M.S.A.; Mohammad, F.S.; Al-Ghobari, H.M. Evaluation of soil moisture sensors under intelligent irrigation systems for economical crops in arid regions. Am. J. Agric. Biol. Sci. 2011, 6, 287–300. [Google Scholar] [CrossRef] [Green Version]
  51. Venkatapur, R.; Nikitha, S. Review on Closed Loop Automated Irrigation System. Asian Rev. Civ. Eng. 2017, 6, 9–14. [Google Scholar]
Figure 1. Layout of the experimental design.
Sustainability 12 09819 g001
Figure 2. Effect of automatic irrigation scheduling and deficit irrigation on soil moisture content” SMC” and water stress inside the root zone during the growth stages of the cucumber plant for season 2017/18. MC: manual control; FI: full irrigation; AC: automatic irrigation; F.C.: field capacity; W.P.: wilting point.
Sustainability 12 09819 g002
Figure 3. Effect of automatic irrigation scheduling and deficit irrigation on soil moisture content “SMC” and water stress inside the root zone during the growth stages of the cucumber plant for season 2018/19. MC: manual control; FI: full irrigation; AC: automatic irrigation; F.C.: field capacity; W.P.: wilting point.
Sustainability 12 09819 g003
Figure 4. Overall observed and simulated soil moisture content inside the root zone of the cucumber plant at all growth stages for all treatments during seasons 2017/2018 and 2018/19.
Sustainability 12 09819 g004
Figure 5. Effect of automatic irrigation scheduling and deficit irrigation scheduling on the observed and simulated nitrogen uptake for cucumber plant at 3, 5, 7, and 9 weeks from planting during season 2017/18.FI: full irrigation.
Sustainability 12 09819 g005
Figure 6. Effect of automatic irrigation scheduling and deficit irrigation scheduling on the observed and simulated nitrogen uptake for cucumber plant at 3, 5, 7, and 9 weeks from planting during season 2017/18.FI: full irrigation.
Sustainability 12 09819 g006
Figure 7. Overall observed versus simulated N-uptake for all treatments for the two seasons.
Sustainability 12 09819 g007
Figure 8. Effect of automatic irrigation scheduling and deficit irrigation on the observed and simulated leaves area after 90 days from the transplanting of the cucumber plants during seasons 2017/18 and 2018/19. MC: manual control; FI: full irrigation; AC: automatic irrigation.
Sustainability 12 09819 g008
Figure 9. Overall observed versus simulated yield for all treatments for seasons 2017/18 and 2018/19.
Sustainability 12 09819 g009
Figure 10. Effect of automatic irrigation scheduling and deficit irrigation on the chlorophyll content of cucumber leaves after 90 days from the transplanting of the cucumber plants during seasons 2017/18 and 2018/19. MC: manual control; FI: full irrigation; AC: automatic irrigation.
Sustainability 12 09819 g010
Figure 11. Effect of automatic irrigation scheduling and deficit irrigation on the observed and simulated yield of cucumber during seasons 2017/18 and 2018/19. MC: manual control; FI: full irrigation; AC: automatic irrigation.
Sustainability 12 09819 g011
Figure 12. Overall observed versus simulated yield of cucumber for all treatments for seasons 2017/18 and 2018/19.
Sustainability 12 09819 g012
Figure 13. Effect of automatic irrigation scheduling and deficit irrigation on the observed and simulated water productivity of cucumber during seasons 2017/18 and 2018/19. MC: manual control; FI: full irrigation; AC: automatic irrigation.
Sustainability 12 09819 g013
Figure 14. Overall observed versus simulated water productivity of cucumber for all treatments.
Sustainability 12 09819 g014
Table 1. The average data of temperature, wind speed, and relative humidity were obtained from the weather station of the meteorological stations of the Central Laboratory for Agricultural Climate (CLAC) at an El-Nubaryia farm.
2017/2018
MonthsSRADTMAXTMINRAINWINDTDEWTMeanRH
November13.9824.2512.230.003.428.9817.3558.36
December10.3621.2910.320.003.647.9214.9263.50
January12.3817.615.970.003.673.5410.9261.22
February15.2120.016.710.003.514.9412.4160.56
March19.8024.0510.130.004.215.9516.2751.50
2018/2019
November12.4524.3814.350.004.136.8818.7369.17
December10.5520.3510.520.005.136.1214.7769.83
January11.4018.828.7034.485.335.9513.0767.83
February14.0319.738.9817.605.676.8813.9867.00
March17.9521.5510.709.636.127.6815.9061.00
SRAD: MJ/m2/day; TMAX: maximum air temperature (degrees C); RAIN: average precipitation (mm/day); TMIN: minimum air temperature (degrees C); WIND: wind speed (m/s); TDEW: dew/frost point temperature (degrees C); RH: average relative humidity (%); TMean: average air temperature (degrees C).
Table 2. Physical and chemical properties of the soil of the experimental area. EC: electrical conductivity.
Physical Properties
Soil layer depth (cm)0–1515–3030–45
TextureSandySandySandy
Course sand (%)49.8253.6741.65
Fine sand (%)47.6342.6754.53
Silt+ clay (%)2.553.663.82
Bulk density (t m−3)1.671.671.66
Chemical Properties
EC1:5 (dS m−1)0.470.520.67
pH (1:2.5)8.548.538.80
Total CaCO3 (%)7.152.484.69
Table 3. Main calibrated values of input parameters for manual control and automatic control with 100%FI, 2017/2018, Egypt. FI: full irrigation.
Automatic Control, 100%FIManual Control, 100%FIGrowth StageParameter
20 November20 November Sowing date
130130 Harvest
2525InitialAge of cucumber plants (day after sowing)
3535Development
5050Middle
2020Late
0.60.6InitialCrop coefficient, Kc
11Middle
0.750.75End
0.630.54InitialLeaf area index, LAI
3.593.57Middle
3.513.46End
00 Minimum of the root depth (m)
0.40.35 Maximum of the root depth (m)
152134 The unstressed crop yield (t h−1)
0.90.85InitialWater uptake threshold
0.60.55Middle
0.750.7End
0.620.53 The harvest index
0.240.24 Saturated soil moisture content (m3 m−3)
0.150.15 Field capacity of the soil (m3 m−3)
0.040.04 Wilting point of the soil (m3 m−3)
0.220.22 The lambda of pore size
00 The residual of soil water content (m3 m−3)
0.310.25 The root width factor
5144 Max. depth for evaporation (mm)
1010 The bubbling pressure (cm)
Table 4. The coefficient of determination R2, root mean square error (RMSE), and coefficient of residual mass (CRM) for soil moisture content in one layer (0–40 cm) for all irrigation treatments during the 2017/18 and 2018/19 seasons.
Correlation ParameterTreatmentsOverall R2
Manual ControlAutomatic Control
100%FI80%FI60%FI100%FI80%FI60%FI
2017/18R20.930.960.940.940.940.91
RMSE−0.02−0.010.0080.0070.0090.008
RCM−0.015−0.023−0.032−0.024−0.015−0.015
2018/19R20.940.930.930.950.920.96
RMSE−0.012−0.0140.0080.0070.0090.009
RCM−0.017−0.025−0.033−0.026−0.013−0.014
Overall R2 0.882
FI: full irrigation.
Table 5. Effect of automatic irrigation scheduling and deficit irrigation on the nitrogen uptake of cucumber plant after 3, 5, 7, and 9 weeks from planting.
CSDeficit Irrigation, %Nitrogen Uptake after 3 WeeksNitrogen Uptake after 5 WeeksNitrogen Uptake after 7 WeeksNitrogen Uptake after 9 Weeks
2017/182018/192017/182018/192017/182018/192017/182018/19
Effect of automatic irrigation scheduling on the nitrogen uptake of cucumber plant
MC 4.3 b4.2 b4.1 b4.1 b4.0 b3.9 b3.8 b3.6 b
AC6.2 a6.0 a5.9 a5.7 a5.6 a5.5 a5.4 a5.0 a
LSD at 5%1.10.40.50.70.70.80.80.7
Effect of deficit irrigation on nitrogen uptake of cucumber plant
100%FI5.8 a5.6 a5.6 a5.4 a5.4 a5.2 a5.1 a4.8 a
80%FI5.7 a5.6 a5.5 a5.4 a5.2 a5.2 a5.1 a4.8 a
60%FI4.2 b4.0 b4.0 b3.9 b3.8 b3.7 b3.6 b3.4 b
LSD at 5%0.30.30.40.20.20.30.20.2
Effect of the interaction between automatic irrigation scheduling and deficit irrigation on nitrogen uptake of cucumber plant
OSOSOSOSOSOSOSOS
MC100%FI5.04.94.85.04.85.14.65.34.64.94.45.24.35.04.1 b5.2
80%FI4.64.54.74.64.54.54.64.24.54.14.64.74.34.84.2 b4.8
60%FI3.23.03.12.93.13.03.03.22.92.82.82.72.83.32.6 c2.8
AC100%FI6.66.86.46.26.46.16.26.36.16.05.96.55.86.55.5 a6.0
80%FI6.76.66.56.06.46.16.26.26.06.15.96.25.86.05.4 a5.7
60%FI5.15.55.04.84.95.24.85.34.75.14.64.44.54.94.2 b4.3
LSD at 5%N.S. N.S. N.S. N.S. N.S. N.S. N.S. 0.3
CS: control system; MC: manual control; AC: automatic control; WPcucumber: water productivity of cucumber; O: observed; S: simulated. Clarifies the significant differences between the averages of the values of the different parameters for statistical analysis and the means followed by the same letter (a or b or c or d) in a column are not statistically different, means with different letters under the yield columns are statistically different at 5% level of significance.
Table 6. Effect of automatic irrigation scheduling and deficit irrigation on the leaves area and chlorophyll content of cucumber plant.
CSDeficit Irrigation, %Leaves Area, cm2Chlorophyll Content, %
2018201920182019
Effect of automatic irrigation scheduling on the leaves area and chlorophyll content of cucumber plant
MC 9416 b8859 b34.2 b33.1 b
AC12,770 a12,010 a47.4 a45.9 a
LSD at 5%13018742.81
Effect of deficit irrigation on the leaves area and chlorophyll content of cucumber plant
100%FI11,760 a11,050 a42.8 a41.5 a
80%FI11,730 a11,040 a42.5 a41.2 a
60%FI9798 b9210 b37.0 b35.8 b
LSD at 5%3892691.31
Effect of the interaction between automatic irrigation scheduling and deficit irrigation on the leaves area and chlorophyll content of cucumber plant
OSOS
MC100%FI10,11110,0129504967737.6 c36.5 c
80%FI10,05210,1009474951237.0 c35.9 c
60%FI808580007600804927.9 d27.0 d
AC100%FI13,40513,50012,60013,10548.0 a46.5 a
80%FI13,40113,56412,59812,01148.0 ab46.5 a
60%FI11,51112,05610,82011,05246.1 b42.7 b
LSD at 5%N.S. N.S. 1.81.4
CS: control system; MC: manual control; AC: automatic control; WPcucumber: water productivity of cucumber; O: observed; S: simulated. Clarifies the significant differences between the averages of the values of the different parameters for statistical analysis and the means followed by the same letter (a or b or c or d) in a column are not statistically different, means with different letters under the yield columns are statistically different at 5% level of significance.
Table 7. Effect of automatic irrigation scheduling and deficit irrigation on the yield and water productivity of cucumber.
CSDeficit Irrigation, %Fruit Weight, kg Plant−1Total Yield, ton ha−1WPcucumber, kg m−3
2017/182018/192017/182018/192017/182018/19
Effect of automatic irrigation scheduling on the yield and water productivity of cucumber
MC 2.562.42128 b121 b27.425.4
AC2.862.74143 a137 a30.728.7
LSD at 5% 99
Effect of deficit irrigation on the yield and water productivity of cucumber
100%FI2.862.76143 a138 a23.925.0
80%FI2.862.74143 a137 a29.829.8
60%FI2.402.24120 b112 b33.432.4
LSD at 5% 23
Effect of the interaction between automatic irrigation scheduling and deficit irrigation on the yield and water productivity of cucumber
OSOSOSOS
MC100%FI2.682.58134 b130 12913022.4 21.1
80%FI2.662.56133 b129 12812527.8 26.3
60%FI2.302.10115 d124 1059831.9 28.7
AC100%FI3.002.92152 a150 14614925.4 24.0
80%FI3.002.90152 a146 14514031.8 29.8
60%FI2.522.38126 c12211912034.9 32.4
LSD at 5% 3 N.S.
CS: control system; MC: manual control; AC: automatic control; WPcucumber: water productivity of cucumber; O: observed; S: simulated. Clarifies the significant differences between the averages of the values of the different parameters for statistical analysis and the means followed by the same letter (a or b or c or d) in a column are not statistically different, means with different letters under the yield columns are statistically different at 5% level of significance.
Publisher’s Note: MDPI stays neutral with regard to jurisdictional claims in published maps and institutional affiliations.

