Possibilities to Estimate Daily Solar Radiation on 2-Axis Tracking Plane Using a Model Based on Temperature Amplitude
Abstract
:1. Introduction
- -
- -
- -
- HOBS—value of solar radiation measured in the examined time intervals;
- HEST—value of solar radiation estimated according to the model formula;
- i—number of a single test;
- n—size of database;
2. Models for Estimation of Daily Solar Radiation
- extraterrestrial solar radiation on horizontal plane in the day of consideration;
- Tmax —maximum temperature in the day of consideration;
- Tmin —minimum temperature in the day of consideration.
3. Methodology and Data
3.1. Modification of the Calibration Procedure
- -
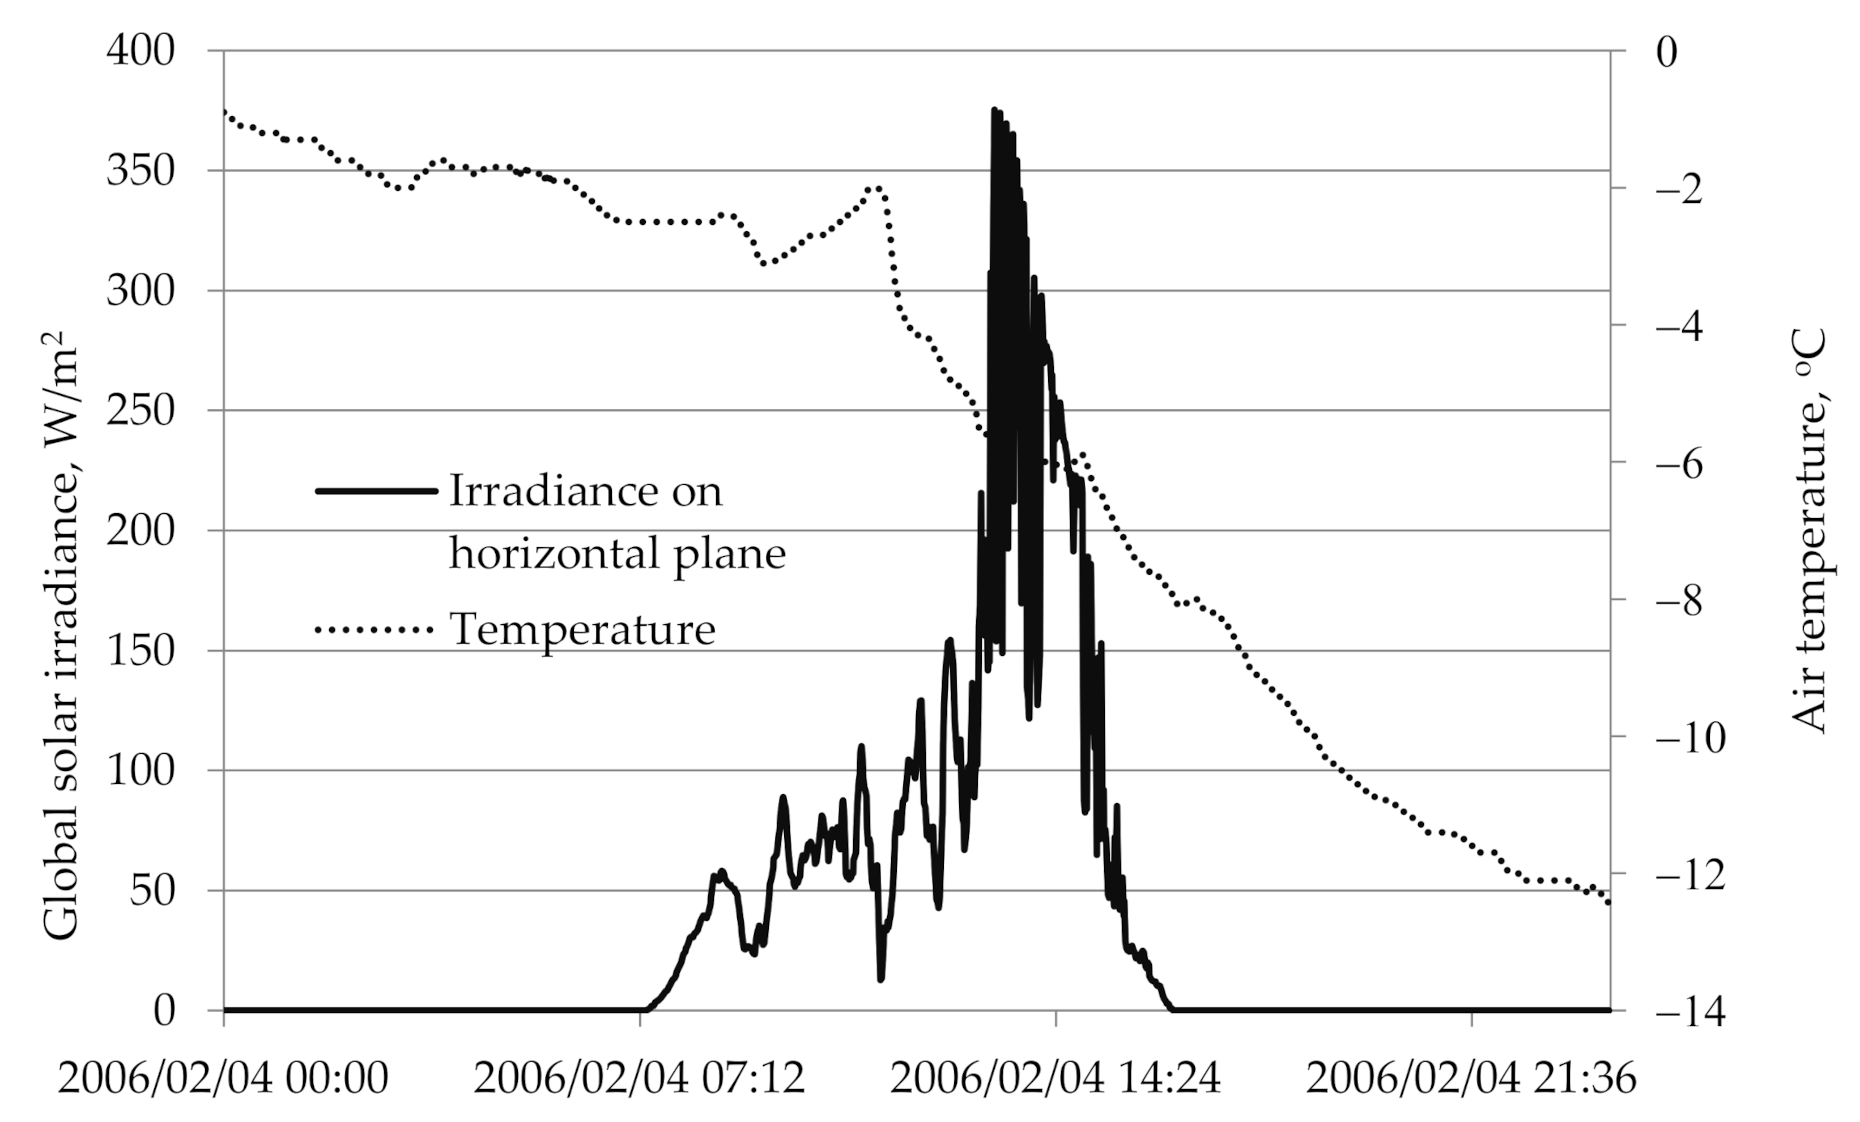
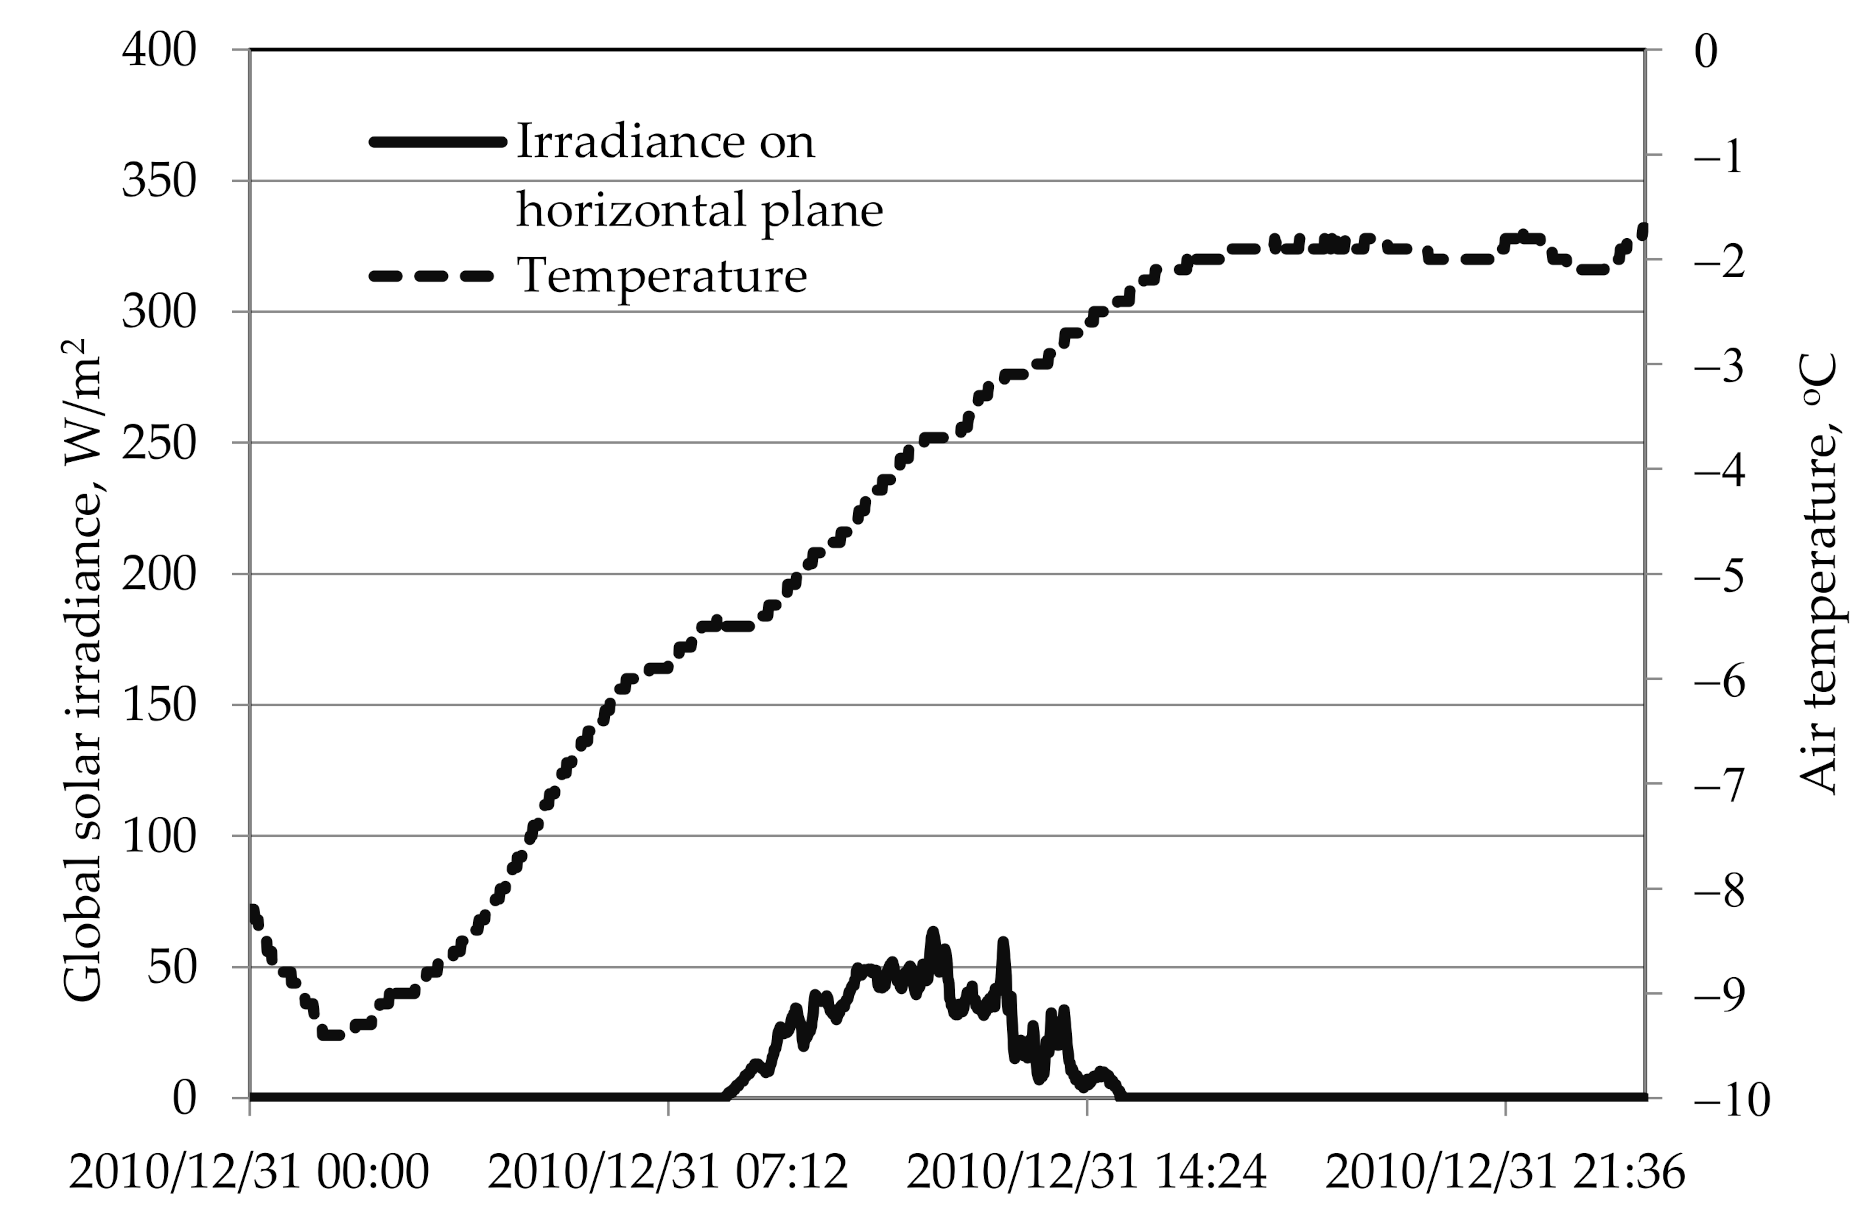
- Tmin is read from 0.00 to the second hour after sunrise;
- -
- Tmax is read from the solar noon to the second hour after sunset.
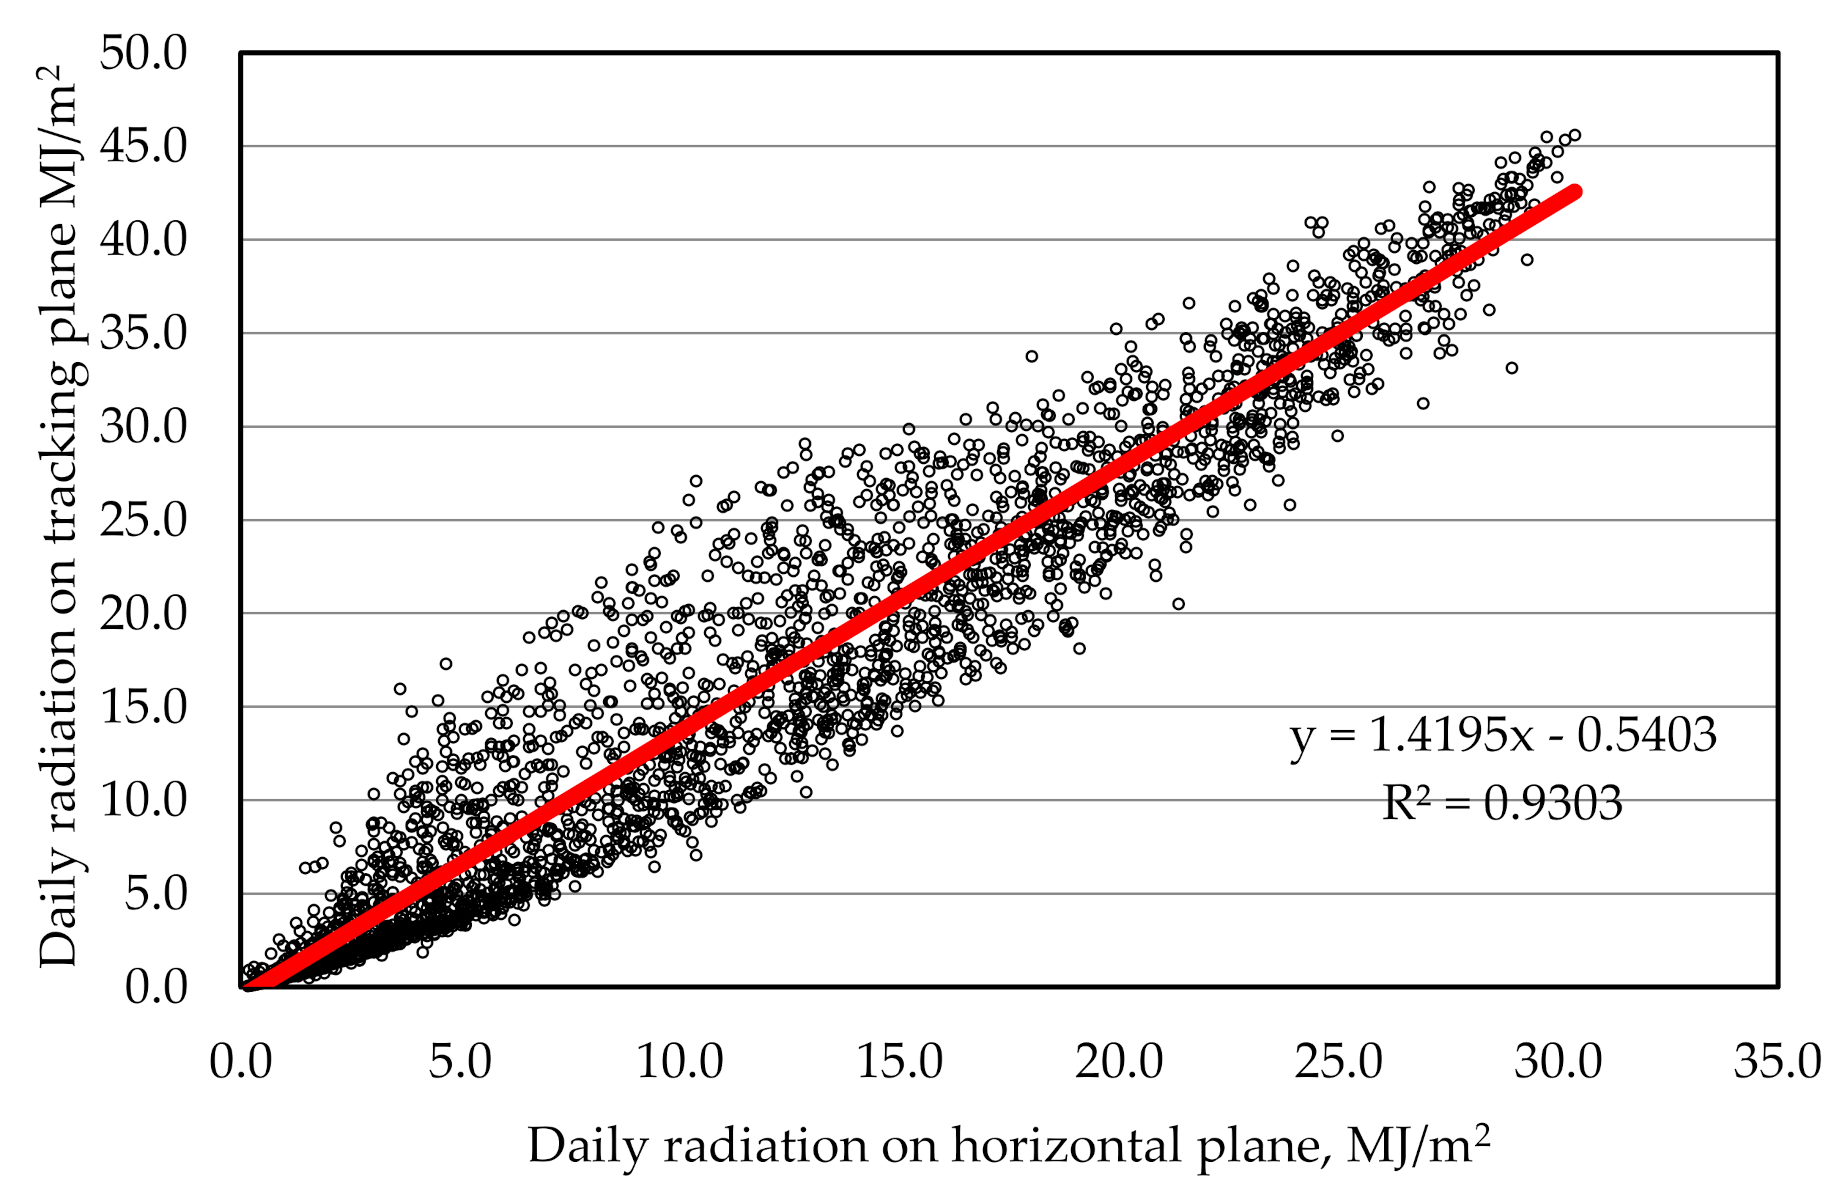
- Step 1-determination of the correlation relationship between daily solar radiation on a 2-axis tracking plane and on the horizontal plane;
- Step 2-estimation of daily radiation using the H–S model on a horizontal plane;
- Step 3-calculation of daily radiation on a 2-axis tracking plane based on the results of the second step according to the relationship determined in the first step.
3.2. Database
4. Results and Discussions
4.1. Test of the H–S Model Accuracy for Horizontal Plane
4.2. Test of the H–S Model Accuracy for a 2-axis Tracking Plane
4.3. Comparison of Estimation on Horizontal and 2-axis Tracking Planes
5. Conclusions
Author Contributions
Funding
Conflicts of Interest
References
- Bojanowski, J. Quantifying Solar Radiation at the Earth Surface with Meteorological and Satellite Data. Ph.D. Thesis, University of Twente, Enschede, The Netherlands, 2013. [Google Scholar]
- Zhang, J.; Zhao, L.; Deng, S.; Xu, W.; Zhang, Y. A critical review of the models used to estimate solar radiation. Renew. Sustain. Energy Rev. 2017, 70, 314–329. [Google Scholar] [CrossRef]
- Bandyopadhyay, A.; Bhadra, A.; Raghuwanshi, N.S.; Singh, R. Estimation of monthly solar radiation from measured air temperature extremes. Agric. For. Meteorol. 2008, 148, 1707–1718. [Google Scholar] [CrossRef]
- Goodin, D.G.; Hutchinson, J.M.S.; Vanderlip, R.L.; Knapp, M.C. Estimating solar irradiance for crop modeling using daily air temperature data. Agron. J. 1999, 91, 845–851. [Google Scholar] [CrossRef]
- Mavromatis, T. Estimation of solar radiation and its application to crop simulation models in Greece. Clim. Res. 2008, 36, 219–230. [Google Scholar] [CrossRef]
- Allen, R.G.; Pereira, L.S.; Raes, D.; Smith, M. Crop Evapotranspiration (Guidelines for Computing Crop Water Requirements). FAO Irrigation and Drainage. Paper 56. 1998. Available online: https://appgeodb.nancy.inra.fr/biljou/pdf/Allen_FAO1998.pdf (accessed on 16 August 2020).
- Samani, Z. Estimating solar radiation and evapotranspiration using minimum climatological data. J. Irrig. Drain. Eng. 2000, 126, 265–267. [Google Scholar] [CrossRef]
- Ångström, A. Solar and terrestrial radiation. Q. J. R. Meteorol. Soc. 1924, 50, 121–125. [Google Scholar] [CrossRef]
- Rivero, M.; Orozco, S.; Sellschopp, F.; Loera-Palomo, R. A new methodology to extend the validity of the Hargreaves-Samani model to estimate global solar radiation in different climates: Case study Mexico. Renew. Energy 2017, 114, 1340–1352. [Google Scholar] [CrossRef]
- Chen, R.; Ersi, K.; Yang, J.; Lu, S.; Zhao, W. Validation of five global radiation models with measured daily data in China. Energy Convers. Manag. 2004, 45, 1759–1769. [Google Scholar] [CrossRef]
- Mavromatis, T.; Jagtap, S. Estimating solar radiation for crop modeling using temperature data from urban and rural stations. Clim. Res. 2005, 29, 233–243. [Google Scholar] [CrossRef]
- Abraha, M.; Savage, M.J. Comparison of estimates of daily solar radiation from air temperature range for application in crop simulations. Agric. For. Meteorol. 2008, 148, 401–416. [Google Scholar] [CrossRef]
- Li, M.-F.; Fan, L.; Liu, H.-B.; Guo, P.-T.; Wu, W. A general model for estimation of daily global solar radiation using air temperatures and site geographic parameters in Southwest China. J. Atmos. Solar Terr. Phys. 2013, 92, 145–150. [Google Scholar] [CrossRef]
- Iziomon, M.G.; Mayer, H. Performance of solar radiation—A case study. Agric. For. Meteorol. 2001, 110, 1–11. [Google Scholar] [CrossRef]
- Ball, R.A.; Rosalind, A.; Purcel, L.C.; Larry, C.; Carey, S.K.; Sean, K. Evaluation of solar radiation prediction models in North America. Agron. J. 2004, 96, 391–397. [Google Scholar] [CrossRef]
- Rivington, M.; Bellocchi, G.; Matthews, K.; Buchan, K. Evaluation of three model estimations of solar radiation at 24 UK stations. Agric. For. Meteorol. 2005, 132, 228–243. [Google Scholar] [CrossRef]
- Trnka, M.; Žalud, Z.; Eitzinger, J.; Dubrovský, M. Global solar radiation in central European Rowlands by various empirical formulae. Agric. For. Meteorol. 2005, 131, 54–76. [Google Scholar] [CrossRef]
- Mecibah, M.S.; Boukelia, T.E.; Tahtah, R.; Gairaa, K. Introduction the best model for estimation the monthly mean daily global solar radiation on horizontal surface (Case study: Algeria). Renew. Sustain. Energy Rev. 2014, 36, 194–202. [Google Scholar] [CrossRef]
- Teke, A.; Yıldırım, H.B.; Çelik, O. Evaluation and performance comparison of different models for the estimation of solar radiation. Renew. Sustain. Energy Rev. 2015, 50, 1097–1107. [Google Scholar] [CrossRef]
- Bechini, L.; Ducco, G.; Donatelli, M.; Stein, A. Modelling, interpolation and stochastic simulation in space and time of global solar radiation. Agric. Ecosyst. Environ. 2000, 81, 29–42. [Google Scholar] [CrossRef]
- Urraca, R.; Martinez-De-Pison, E.; Sanz-Garcia, A.; Antonanzas, J. Estimation methods for global solar radiation: Case study evaluation of five different approaches in central Spain. Renew. Sustain. Energy Rev. 2017, 77, 1098–1113. [Google Scholar] [CrossRef]
- Hargreaves, G.H.; Samani, Z.A. Estimating potential evapotranspiration. J. Irrig. Drain. Eng. 1982, 108, 223–300. [Google Scholar]
- Besharat, F.; Dehghan, A.A.; Faghih, A.R. Empirical models for estimating global solar radiation: A review and case study. Renew. Sustain. Energy Rev. 2013, 21, 798–821. [Google Scholar] [CrossRef]
- Jahani, B.; Dinpashoh, Y.; Nafchi, A.R. Evaluation and development of empirical models for estimating daily solar radiation. Renew. Sustain. Energy Rev. 2017, 73, 878–891. [Google Scholar] [CrossRef]
- Duffie, J.A.; Beckman, W.A. Solar Engineering of Thermal Processes; John Wiley & Sons: New York, NY, USA, 1991. [Google Scholar]
- Mahmood, R.; Hubbard, K. Effect of time of temperature observation and estimation of daily solar radiation for the Northern Great Plains, USA. Agron. J. 2002, 94, 723–733. [Google Scholar] [CrossRef] [Green Version]
- Donatelli, M.; Campbell, G.S. A simple model to estimate global solar radiation. In Proceedings of the 5th Congress of the European Society of Agronomy, Nitra, Slovakia, 28 June–2 July 1998; Zima, M., Bartosova, M.L., Eds.; 1998; pp. 133–134. [Google Scholar]
- Bristow, K.L.; Campbell, G.S. On the relationship between incoming solar radiation and daily maximum and minimum temperature. Agric. For. Meteorol. 1984, 31, 159–166. [Google Scholar] [CrossRef]
- Almorox, J.; Hontoria, C.; Benito, M. Models for obtaining daily global solar radiation with measured air temperature data in Madrid (Spain). Appl. Energy 2011, 88, 1703–1709. [Google Scholar] [CrossRef]
- Almorox, J.; Bocco, M.; Willington, E. Estimation of daily global solar radiation from measured temperatures at Cañada de Luque. Córdoba, Argentina. Renew. Energy 2013, 60, 382–387. [Google Scholar] [CrossRef] [Green Version]
- Yusoff, M.I.; Irwanto, M.; Safwati, I.; Nair, G.; Syed, H.; Fitra, M. Estimating daily solar radiation using hargreaves model in Eastern Malaysia. Appl. Mech. Mater. 2014, 699, 564–569. [Google Scholar] [CrossRef]
- Kumar, S.; Kaur, T. Development of ANN based model for solar potential assessment using various meteorological parameters. Energy Procedia 2016, 90, 587–592. [Google Scholar] [CrossRef]
- Mohanty, S.; Patra, P.K.; Sahoo, S.S. Prediction and application of solar radiation with soft computing over traditional and conventional approach–A comprehensive review. Renew. Sustain. Energy Rev. 2016, 56, 778–796. [Google Scholar] [CrossRef]
- Da Silva, M.B.P.; Escobedo, J.F.; Rossi, T.J.; Dos Santos, C.M.; Da Silva, S.H.M.G. Performance of the Angstrom-Prescott Model (A-P) and SVM and ANN techniques to estimate daily global solar irradiation in Botucatu/SP/Brazil. J. Atmos. Sol. Terr. Phys. 2017, 160, 11–23. [Google Scholar] [CrossRef]
- Tymvios, F.S.; Jacovides, C.P.; Michaelides, S.C.; Scouteli, C. Comparative study of Ångström’s and artificial neural networks methodologies in estimating global solar radiation. Sol. Energy 2005, 78, 752–762. [Google Scholar] [CrossRef]

| Locality, Country | Latitude | aHS | bHS | Timescale, Day | NRSME% | R2 | |
|---|---|---|---|---|---|---|---|
| Wageningen The Netherlands [12] | 52.0 N | 0.140 | −0.728 | 10.2 | 1 | 33.26 | 0.828 |
| Rothamsed, England [12] | 51.8 N | 0.141 | −0.610 | 10.4 | 1 | 34.30 | 0.810 |
| Hradec Kralove Ostrava Kocelovice Kucharovice Czech Republic Retz Langenlois Gross-Enzersdorf Kremsmünster Graz Gmunden Austria [17] | 50.2− −46.9 N | 0.15–0.16 | −0.80 | 10.1–11.3 | 1 | 28.73–36.2 January 46 February 38 March 37 April 27 May 22 June 25 July 24 August 21 September 26 October 36 November 46 December 57 | 0.79−0.84 |
| Odessa (Washington State) USA [15] | 47.3 N | 0.152 | 14.9 | 1 7 | 22.07 9.12 | 0.86 0.98 | |
| Padova Italy [12] | 44.9 N | 0.19 | −2.04 | 13.6 | 1 | 25.42 | 0.846 |
| Lincoln (Nebraska State)USA[15] | 42.0 N | 0.141 | 15.4 | 1 7 | 25.32 13.11 | 0.66 0.90 | |
| Alexandroupoli Greece [5] | 40.8 N | 0.17 | −1.92 | 12.9 | 1 | 28.4 | - |
| Madrid Spain [29] | 40.2 N | 0.14–0.16 | 17.5 | 1 | 15.9−17.1 | 0.871−0.885 | |
| Corfu Greece [5] | 39.6 N | 0.19 | −1.90 | 15.0 | 1 | 22.4 | - |
| Davis (California State) USA [12] | 38.5 N | 0.162 | 18.3 | 1 | 23.7 | 0.83 | |
| Davis (California State) USA [15] | 38.5 N | 0.162 | 18.3 | 1 7 | 16.0 8.7 | 0.87 0.96 | |
| Lexington (Kentucky State) USA [15] | 38.0 N | 0.149 | 14.8 | 1 7 | 24.8 12.4 | 0.61 0.89 | |
| Samos Greece [5] | 37.7 N | 0.19 | 0.43 | 16.1 | 1 | 24.2 | - |
| Gorgan Iran [24] | 36.9 N | 14.38 | 1 | 21.6 | 0.77 | ||
| Rhodes Greece [5] | 36.4 N | 0.25 | 1.39 | 19.1 | 1 | 22.8 | - |
| Lake Alfred (Florida State) USA [15] | 35.7 N | 0.150 | 17.9 | 1 7 | 16.9 9.6 | 0.55 0.84 | |
| Teheran Iran [24] | 35.7 N | 18.4 | 1 | 21.1 | 0.71 | ||
| Griffith Australia [12] | 35.3 S | 0.163 | −0.33 | 18.5 | 1 | 21.38 | 0.81 |
| Tucson Arizona State USA [15] | 32.3 N | 0.161 | 20.9 | 1 7 | 13.8 6.8 | 0.76 0.94 | |
| Yazd Iran [24] | 31.9 N | 21.3 | 1 | 11.3 | 0.84 | ||
| Yazd Iran [23] | 31.9 N | 0.175 | 21.3 | 30 | 3.3 | 0.99 | |
| Córdoba Argentina [30] | 31.1 S | 0.146 | 20.1 | 1 5 10 15 20 25 30 | 18.3 10.3 8.3 7.5 7.0 6.8 6.6 | 0.76 0.88 0.91 0.92 0.93 0.93 0.94 | |
| Ahvaz Iran [24] | 31.3 N | 19.4 | 1 | 14.2 | 0.78 | ||
| Dehra Dun India [3] | 30.3 N | 0.160 | 19.1 | 30 | 12.8 | - | |
| Dry Arid climate Mexico [9] | 25.0– −32.4 N | 0.16 f(ΔT) * | 20.2–20.9 | 1 | 13.7–14.2 9.8–10.1 | 0.77 0.89 | |
| Tropical Moist climate Mexico [9] | 16.2– −23.2 N | 0.16 f(ΔT) * | 18.0–18.7 | 1 | 17.4–18.1 14.8–15.4 | 0.65 0.73 | |
| Bandar Abbas Iran [24] | 27.2 N | 19.8 | 1 | 18.2 | 0.47 | ||
| Pretoria South Africa [12] | 25.7 S | 0.173 | −0.258 | 19.3 | 1 | 17.6 | 0.72 |
| Kota Bharu Malaysia [31] | 6.1 N | 16.2 | 1 | 8.2 | 0.87 |
| Month | Horizontal Plane | 2-axis Tracking Plane | ||
|---|---|---|---|---|
| Number of Days | Average Daily Solar Radiation, MJ/m2 | Number of Days | Average Daily Solar Radiation, MJ/m2 | |
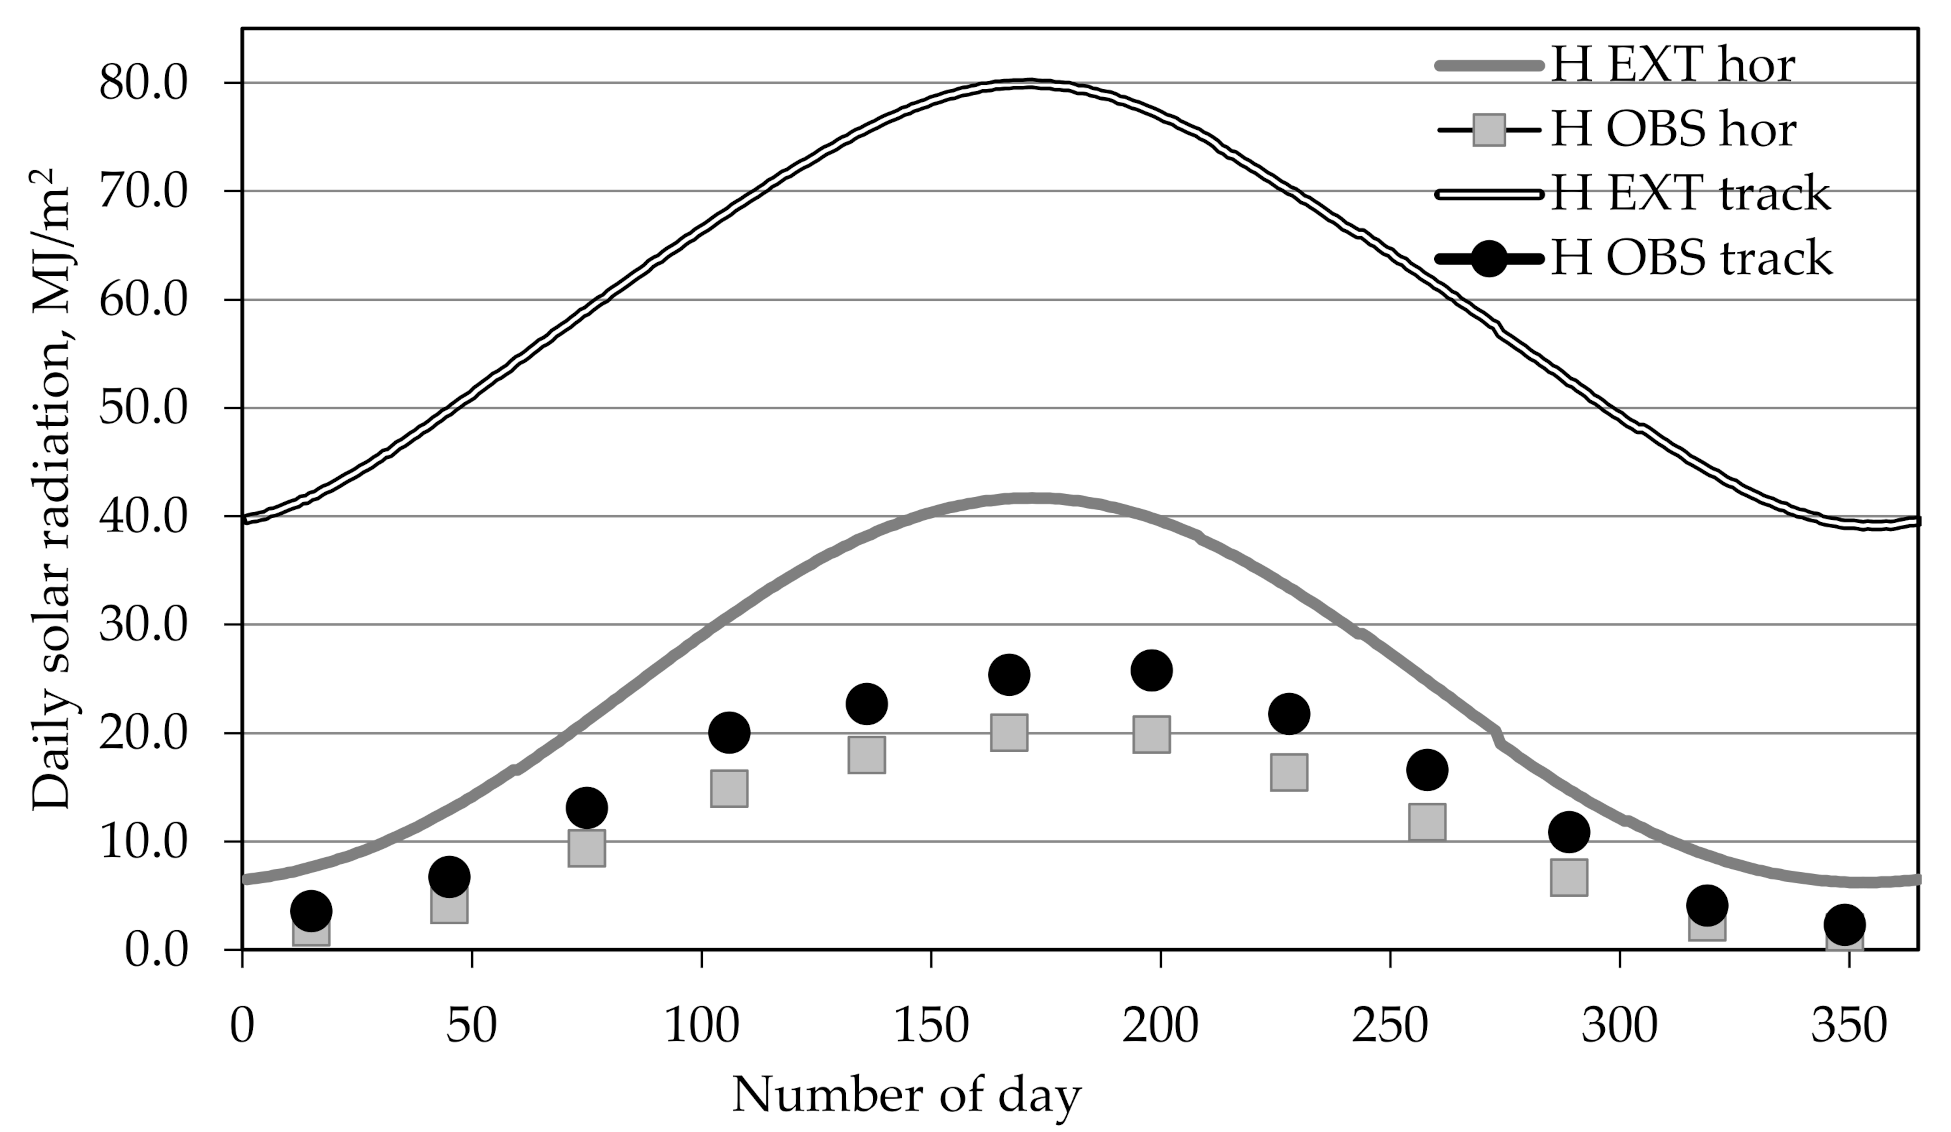
| January | 291 | 2.08 | 262 | 3.56 |
| February | 227 | 4.13 | 210 | 6.72 |
| March | 251 | 9.15 | 245 | 13.09 |
| April | 271 | 14.78 | 266 | 20.03 |
| May | 294 | 17.58 | 287 | 22.65 |
| June | 316 | 19.76 | 296 | 25.39 |
| July | 308 | 19.81 | 290 | 25.78 |
| August | 267 | 16.26 | 261 | 21.78 |
| September | 317 | 11.79 | 299 | 16.58 |
| October | 318 | 6.64 | 313 | 10.85 |
| November | 281 | 2.55 | 265 | 4.09 |
| December | 281 | 1.61 | 256 | 2.32 |
| All daily data | 3422 | 10.77 | 3250 | 15.09 |
| Month | Model H–S | Model H–SM | ||||
|---|---|---|---|---|---|---|
| MAPE% | NRSME% | R2- | MAPE% | NRSME% | R2- | |
| All daily data | 39.26 | 29.66 | 0.854 | 35.40 | 29.13 | 0.862 |
| January | 59.51 | 60.03 | 0.327 | 55.67 | 56.01 | 0.385 |
| February | 56.05 | 53.78 | 0.358 | 46.84 | 49.54 | 0.463 |
| March | 37.16 | 34.74 | 0.584 | 33.73 | 32.34 | 0.614 |
| April | 35.79 | 28.38 | 0.595 | 28.88 | 26.87 | 0.608 |
| May | 38.06 | 28.25 | 0.604 | 26.62 | 25.23 | 0.618 |
| June | 29.35 | 23.47 | 0.580 | 21.14 | 21.99 | 0.598 |
| July | 26.79 | 21.15 | 0.654 | 19.13 | 19.20 | 0.666 |
| August | 25.00 | 21.54 | 0.592 | 21.01 | 20.40 | 0.613 |
| September | 25.70 | 22.64 | 0.692 | 21.02 | 20.74 | 0.703 |
| October | 38.11 | 32.61 | 0.660 | 31.01 | 29.34 | 0.665 |
| November | 49.12 | 45.86 | 0.521 | 44.96 | 42.31 | 0.577 |
| December | 62.80 | 61.18 | 0.214 | 61.67 | 54.53 | 0.310 |
| Month | aHS | bHS | MAPE% | NRSME% | R2- |
|---|---|---|---|---|---|
| Relative Change | |||||
| All daily data | 0.164 | −0.90 | −1.5 | −1.8 | +1.0 |
| January | 0.17 | −0.61 | −6.4 | −6.7 | +17.8 |
| February | 0.17 | −1.03 | −16.1 | −7.9 | +29.3 |
| March | 0.20 | −2.31 | −9.2 | −6.9 | +5.1 |
| April | 0.19 | −4.39 | −18.9 | −5.3 | +2.2 |
| May | 0.22 | −8.55 | −14.9 | −10.7 | +2.3 |
| June | 0.20 | −6.14 | −27.8 | −6.3 | +3.1 |
| July | 0.22 | −7.73 | −28.3 | −9.2 | +1.8 |
| August | 0.19 | −3.35 | −16.0 | −5.3 | +3.5 |
| September | 0.20 | −3.13 | −18.3 | −8.4 | +3.0 |
| October | 0.21 | −2.32 | −18.6 | −10.0 | +0.8 |
| November | 0.16 | −0.43 | −8.4 | −7.7 | +10.7 |
| December | 0.15 | −0.29 | −8.5 | −10.9 | +44.8 |
| Method of Estimation | MAPE | NRSME | R2 | |
|---|---|---|---|---|
| Direct estimation with | All daily data | 107.1 | 46.77 | 0.670 |
| Direct estimation with | All daily data | 80.9 | 43.33 | 0.734 |
| January | 205.7 | 112.5 | 0.300 | |
| February | 127.5 | 81.55 | 0.404 | |
| March | 67.7 | 48.22 | 0.576 | |
| April | 57.4 | 39.94 | 0.577 | |
| May | 55.4 | 36.35 | 0.620 | |
| June | 36.7 | 30.64 | 0.575 | |
| July | 38.4 | 28.86 | 0.659 | |
| August | 37.0 | 29.56 | 0.578 | |
| September | 43.3 | 36.76 | 0.670 | |
| October | 85.1 | 51.52 | 0.597 | |
| November | 203.8 | 83.62 | 0.533 | |
| December | 354.8 | 122.50 | 0.289 | |
| Indirect estimation-first estimate horizontal than calculate tracking | All daily data (0.930) | 84.9 | 47.44 | 0.664 |
| January (0.896) | 178.3 | 113.9 | 0.240 | |
| February (0.845) | 141.5 | 87.35 | 0.303 | |
| March (0.922) | 69.2 | 51.26 | 0.499 | |
| April (0.969) | 64.3 | 39.43 | 0.579 | |
| May (0.967) | 61.6 | 33.69 | 0.590 | |
| June (0.962) | 44.9 | 31.31 | 0.577 | |
| July (0.967) | 42.1 | 28.20 | 0.625 | |
| August (0.945) | 40.6 | 30.60 | 0.514 | |
| September (0.930) | 55.4 | 35.31 | 0.603 | |
| October (0.913) | 81.2 | 54.74 | 0.514 | |
| November (0.909) | 162.1 | 86.80 | 0.394 | |
| December (0.863) | 211.7 | 114.48 | 0.286 | |
| Month | MAPE | NRSME | R2 |
|---|---|---|---|
| All daily data | 81.4 | 42.9 | 0.735 |
| January | 158.1 | 98.9 | 0.359 |
| February | 127.2 | 82.7 | 0.431 |
| March | 61.3 | 46.0 | 0.609 |
| April | 45.8 | 36.9 | 0.627 |
| May | 38.8 | 33.4 | 0.654 |
| June | 31.9 | 29.5 | 0.600 |
| July | 26.8 | 25.2 | 0.685 |
| August | 32.4 | 28.6 | 0.591 |
| September | 39.8 | 30.9 | 0.680 |
| October | 67.9 | 48.7 | 0.623 |
| November | 115.5 | 74.4 | 0.566 |
| December | 187.8 | 106.5 | 0.391 |
| Month | Relative Difference, % | ||
|---|---|---|---|
| MAPE | NRSME | R2 | |
| January | +67 | +77 | −7 |
| February | +52 | +67 | −7 |
| March | +37 | +42 | −1 |
| April | +37 | +37 | +3 |
| May | +33 | +32 | +6 |
| June | +31 | +34 | 0 |
| July | +31 | +31 | +3 |
| August | +42 | +43 | −4 |
| September | +50 | +49 | −3 |
| October | +63 | +66 | −6 |
| November | +56 | +76 | −2 |
| December | +76 | +95 | +26 |
| Whole year | +51 | +47 | −17 |
Publisher’s Note: MDPI stays neutral with regard to jurisdictional claims in published maps and institutional affiliations. |
© 2020 by the authors. Licensee MDPI, Basel, Switzerland. This article is an open access article distributed under the terms and conditions of the Creative Commons Attribution (CC BY) license (http://creativecommons.org/licenses/by/4.0/).
Share and Cite
Czekalski, D.; Obstawski, P.; Bakoń, T. Possibilities to Estimate Daily Solar Radiation on 2-Axis Tracking Plane Using a Model Based on Temperature Amplitude. Sustainability 2020, 12, 9909. https://doi.org/10.3390/su12239909
Czekalski D, Obstawski P, Bakoń T. Possibilities to Estimate Daily Solar Radiation on 2-Axis Tracking Plane Using a Model Based on Temperature Amplitude. Sustainability. 2020; 12(23):9909. https://doi.org/10.3390/su12239909
Chicago/Turabian StyleCzekalski, Dariusz, Paweł Obstawski, and Tomasz Bakoń. 2020. "Possibilities to Estimate Daily Solar Radiation on 2-Axis Tracking Plane Using a Model Based on Temperature Amplitude" Sustainability 12, no. 23: 9909. https://doi.org/10.3390/su12239909
APA StyleCzekalski, D., Obstawski, P., & Bakoń, T. (2020). Possibilities to Estimate Daily Solar Radiation on 2-Axis Tracking Plane Using a Model Based on Temperature Amplitude. Sustainability, 12(23), 9909. https://doi.org/10.3390/su12239909


