Article

Possibilities to Estimate Daily Solar Radiation on 2-Axis Tracking Plane Using a Model Based on Temperature Amplitude

Institute of Mechanical Engineering, Department of Fundamental Engineering and Energetic, Warsaw University of Life Sciences, 02-787 Warsaw, Poland
*
Author to whom correspondence should be addressed.
Sustainability 2020, 12(23), 9909; https://doi.org/10.3390/su12239909
Submission received: 15 October 2020 / Revised: 17 November 2020 / Accepted: 23 November 2020 / Published: 26 November 2020
(This article belongs to the Section Energy Sustainability)

Abstract

:
Significant errors may occur when estimating daily solar radiation in central Europe using empirical models based on air temperature (especially in the winter months). The first goal of this article is to investigate to what extent it is possible to increase the accuracy of the Hargreaves and Samani model, by using the calibration dedicated for each month. We also corrected the temperature amplitudes by narrowing the daily intervals from which the minimum and maximum values were taken. The second goal of this article is to compare the precision of the daily solar radiation estimation on the horizontal plane and on the 2-axis tracking plane. The database comprises the series of parallel measurements on both planes over a period of 10 years. We considered two procedures, direct and indirect, for the 2-axis tracking plane. The second procedure, dubbed “the first estimate horizontal than calculate tracking” is based on the strong relationship between daily solar radiations on both planes. The direct procedure allows for a slightly more accurate estimation. The estimation of daily radiation on the 2-axis tracking plane reflects the measured values worse than estimation on the horizontal plane. We discovered that the increase of estimation errors on the 2-axis tracking plane, compared to the horizontal one, is proportional to the increase in the coefficient of variability of the daily solar radiations.

1. Introduction

The history of meteorological measurements is long. Values, such as air temperature, relative humidity, atmospheric pressure, wind speed, or precipitation, have been measured using simple methods with high accuracy for many years. Throughout the years, the instruments have been improved and data have been recorded automatically. It was most difficult to measure and determine, in a quantitative manner, the incoming solar radiation. Numerous weather stations have over a 100-year series of insolation measurements. However, these databases do not comprise measurable values in terms of energy. Moreover, for decades, numerous weather stations have continued to professionally measure solar irradiance. In 2013, approximately 400 of such stations existed in Europe, which accounted for a small percentage of all weather stations [1]. In 2012, in China, out of 756 professional weather stations, only 122 measured solar radiation intensity [2]. Similarly, in India, a small percentage of weather stations are equipped with radiation intensity meters [3]. On all continents, there are still vast areas with no direct data on the incoming solar radiation. In addition, technical failures resulted in data gaps that appeared in the ground measurement databases.
The sequence of periodical global solar radiation is a key parameter necessary to predict crop growth [4,5] and to create the evapotranspiration models [6,7]. In order to determine periodical global solar radiation in areas with no appropriate measurement, numerous estimation models were developed. Initially, the estimation of the average global daily radiation in a month (average daily monthly radiation) was sufficient. The development of solar thermal and photovoltaic engineering and the progress in measurement technology resulted in increased demand for estimation of solar radiation. The estimation models associate global solar radiation with other commonly measured meteorological values, such as: insolation, cloud cover level, air temperature, and relative humidity. The first professional model was proposed in 1924 by Anders Ångström, who associated the average global daily radiation in a month, on a horizontal plane with the average daily insolation [8]. The models are most frequently based on selected daily meteorological values with a stochastic sequence and daily extraterrestrial solar radiation determined by the day of the year and latitude. Certain models include the concept of the potential total daily radiation on the surface of the earth. The accuracy of all these models generally depends on the number of input parameters from measurements and the model structure, in which the complexity is related to the number of calibrated coefficients.
In terms of the estimation accuracy, at extreme points, it can be distinguished between models based on the results of observations of the sky and models based only on the results of temperature measurements. The first group of models is obviously the most accurate.
There have been numerous publications on estimation models over the last 40 years. In studies conducted on all continents, the authors examine issues typical for this discipline, such as:
-
Precision of estimation in different climatic zones [1,9,10,11,12] or at different altitudes [13,14];
-
Comparison of models applied in a given region in terms of estimation accuracy [5,15,16,17,18,19];
-
Ability of models for spatial interpolation [17,20,21].
Obviously, the condition for the comparison of the accuracy of models tested by different authors is an identical calculation procedure. The quality of estimation depends on the examined timescale. Significantly higher precision applies to the estimation of the average daily solar radiation in a month than to daily radiation. Therefore, no doubt can exist as to the timescale considered by the researcher. To increase the estimation accuracy, coefficients are calibrated not only for the entire year, but also, separately, for the individual months of the year. The researcher should clearly specify the optimization criterion during calibration of the model. It is important whether the selection of coefficients aims to minimize statistical errors or to maximize the correlation coefficient and other indicators of a model quality. In this study, we evaluate the estimation model accuracy, mainly using the normalized statistical errors and the coefficient of determination. The mean absolute percentage error (MAPE) was calculated using the following formula:
M A P E =   1 n i = 1 n H O B S i H E S T i H O B S i × 100 %
where:
  • HOBS—value of solar radiation measured in the examined time intervals;
  • HEST—value of solar radiation estimated according to the model formula;
  • i—number of a single test;
  • n—size of database;
The model accuracy measure is also determined using the normalized rootmeansquare error (NRSME):
N R S M E = 1 n i = 1 n H O B S i H E S T i 2 H O B S ¯ × 100 %
where: H O B S ¯   — average value of radiation measured in all the examined time intervals.
The strength and direction of statistical dependence between two variables, with the assumption of linear regression, is determined by the linear correlation coefficient R. In this study, we used the coefficient of determination, R2, calculated as follows:
R 2 = i = 1 n H O B S i H O B S ¯   ) ( H E S T i H E S T ¯ 2 i = 1 n H O B S i H O B S ¯ 2 i = 1 n H E S T i H E S T ¯ 2

2. Models for Estimation of Daily Solar Radiation

For many years, data on the state of the atmosphere and the nature of cloud cover from meteorological satellites have been used to estimate and forecast solar radiation. The developed empirical models are correlated with the results of ground measurements. The usefulness of physical models results also from their compliance with meteorological stations data. Methods based on satellite data allow for the estimation of solar irradiance in hourly and shorter intervals, and even in the real time. Their structure is often unique or requires a lot of data on the state of the atmosphere. The authors of the article plan to achieve the goals by using an easy-to-use instrument—the classic estimation model.
The research presented in this article concerns the model of estimation of daily solar radiation, which is based on the measurement of ambient air temperature. The Ångström and Prescott model is deemed the classic model based on insolation, whereas among the models based on atmosphere temperatures, the Hargreaves and Samani model, designated as H–S, is regarded as a standard one. For this above reason, the results of the estimation of solar radiation using the H–S model frequently appear in comparative analyses, where in the same region, the accuracy of models with different structures is tested. The tests presented in this article relate to the H–S model. For the authors, the H–S model, as simple in its structure, is a tool for studying the precision of daily radiation estimation on the horizontal plane and the 2-axis tracking plane, depending on the season or calibration method or on the daily radiation variability index in the considered period.
Since the first publication [22], the structure of the H–S model evolved, which is reflected in the review articles [23,24]. We selected the structure of the model in accordance with articles of Bojanowski [1] and Trnka et al. [17], and this structure contains two coefficients, aHS and bHS, which require local calibration:
H E S T = H E X T h o r a H S T m a x T m i n + b H S
where:
  • H E X T h o r extraterrestrial solar radiation on horizontal plane in the day of consideration;
  • Tmax —maximum temperature in the day of consideration;
  • Tmin —minimum temperature in the day of consideration.
The procedure for calculating daily solar extraterrestrial radiation on a horizontal plane can be found in many textbooks, such as in the fundamental work by Duffie and Beckmann [25].The H–S model is characterized with a simple structure, which on the one hand makes it universal, but on the other hand limits its accuracy.
Mahmood and Hubbard developed a model based on meteorological observations in the Great Northern Plains of the United States [26]. This model has been used to estimate daily solar radiation on a horizontal plane. Instead of the extraterrestrial radiation, the authors enriched the model with the concept of clear-sky radiation, i.e., potential daily solar radiation in a cloudless and perfectly clean atmosphere.
Donatelli and Campbell [27] proposed a model with a similarly complicated structure to Mahmood and Hubbard’s model. Their model is an improved version of the classic Bristow and Campbell model [28]. In contrast to Mahmood and Hubbard model, Donatelli and Campbell define the atmospheric transitivity for the clear sky as the mean value for the five clearest days (of the period between the 120th and the 240th day of the year). They also introduce the concept of average daily temperature. In addition, as the minimum temperature of the day, they suggest use of the arithmetic average of the lowest temperatures from a given day, and from the day before. As compared to the models by Mahmood and Hubbard and Donatelli and Campbell, the H–S model structure seems very simple.
Model calibration for the given area comprises the selection of coefficients, according to a specified criterion. Using the data of a geostationary meteorological satellite, Bojanowski [1] organized the calibration of the H–S model at a regional scale and presented it on isoplethic maps. Generally, higher values aHS, up to 0.21, are recommended for the southern part of the European continent, e.g. for Italy and Greece, and lower values, around 0.14, are used for Sweden and Great Britain. The values of coefficient bHS are negative (up to the value of −2.0) for the countries of the Mediterranean and Black Sea basin and the values ranging from 0.0 to 0.5 for the latitude over 50°. For Poland, the value aHS should be within the range of 0.15 to 0.17, and bHS within the range of −0.2 to +0.2. Table 1 includes the coefficient values after calibration in numerous regions of the world. In part of the tests, the model did not contain the coefficient bHS.
In almost all of the cited locations, the coefficient aHS ranges from 0.13 to 0.19, whereas bHS ranges from −2.04 to +1.39. It is difficult to find an organized impact of latitude, altitude, or climate type on the result of the coefficient calibration. This would require normalization of the methodology in terms of the minimum size of the database and the model optimization criterion.
In terms of the estimation accuracy of daily solar radiation, quantified with the normalized root mean square error (NRSME), it may be generalized that in the regions located above the latitude of 50°, the estimation accuracy for the entire year is significantly weaker than in the subtropics zones. In the case of the first regions, the NRSME exceeds 30%, whereas in those latter ones in arid climate, the lowest errors equal approx. 14%.
The impact of climate type on the precision of estimation with the H–S model was studied by Rivero et al. [9]. The authors distinguished six climate zones in Mexico, from dry arid to tropical moist, each of which has characterized using data from few to over a dozen meteorological stations. Initially, the authors used a model with aHS constant of 0.16 and the estimation turned out to be the most accurate in the zone with the highest number of sunny days, i.e., in the dry arid climate. In the data from weather stations located in the tropical moist zone, the lowest proportion of sunny days was found at the stage of day’s classification. The NRSME estimation error in this zone compared to the dry arid zone increased by approximately 30%, and the coefficient of determination decreased by approximately 15%. The correlation between measured and estimated solar daily radiation varied depending on the tested region. The coefficient of determination (R2) reached the maximum values at the level of 0.88; however, R2 does not exceed 0.70, in some applications of the model. The estimation accuracy is obviously influenced by the adopted time step. The NRSME of the estimation of monthly radiation in arid climate only amounts to a few percentage points. Almorox et al. [29] tested the H–S model in Córdoba (Argentina), using the estimation in intervals covering: 1, 5, 10, 15, 20, 25, and 30 days, and they obtained the NRSME reduction from 18.3% to 6.6%, and at the same time an increase in R2 from 0.76 to 0.94. The model accuracy increased the most between the estimation of total 1-day and 5-day radiation.
The estimation accuracy of solar radiation also depends on the season. This issue was thoroughly examined by Trnka et al. [17], who tested seven estimation models calibrated for the lowland in the Czech Republic and in Austria. The meteorological database spanned from 6 to 17 years of recording, depending on the locality and the tests included, i.e., the H–S model. The authors did not calibrate the models themselves, but used the values according to the maps prepared for Europe. The H–S model was burdened with the highest NRSME errors of more than 45%, in the winter months of November, December, and January. In hot season months, such as May, June, July, and August, the estimation was far more accurate—and NRSMEs were reduced to the level of 20–25%.
In the first part, we determined the value of the H–S model coefficients for the central region of Poland, which is the pioneering study of such type ever done in this country. Next, we introduced a method to increase the precision of estimation of daily solar radiation by calibrating the model separately for each month of the year. We also demonstrated the improvement of model quality indicators after correcting the negative and very low estimated values of daily solar radiation. Finally, we examined the precision estimation on a 2-axis tracking plane compared to the precision achieved on a horizontal plane. We compared direct and indirect methods of estimation on the 2-axis tracking using the H–S model.

3. Methodology and Data

3.1. Modification of the Calibration Procedure

In the era of widespread use of artificial neural networks (ANN), improving the structure of estimation models is losing its importance. Numerous works prove that ANN models estimate radiation sums more precisely than classical empirical models [32,33,34,35] for the same input datasets. Therefore, it was not the model structure itself that we targeted for greater precision of estimation. The estimation of daily solar radiation using models based on the amplitude of the air temperature assumes that the course of solar irradiation produces a specific daily temperature distribution. This assumption works well in dry tropical and continental climates, resulting in precise estimation of solar radiation. However, when air masses of polar-marine origin dominate in the local climate, and clash with masses of tropical and continental origin, the relationship between the temperature course and radiation is not so obvious. In Poland, often intense influxes of warm or cold air masses are present within a single day. On such days, changes in the air temperature are not related to solar irradiation, especially in the months of the cold season, when the sunny days are short, and the altitude of the Sun is low. This phenomenon is illustrated by the charts of temperature and solar irradiance on the horizontal plane in Figure 1 and Figure 2. In the first case, for example, on February 4, the air temperature gradually decreased from −0.9°C to −12.5°C. The temperature amplitude alone would suggest a high daily radiation, while in reality it was equal to only 3.15 MJ/m2, a value significantly below the daily average in February. The temperature changes on that day were the result of an influx of cold air masses and were not related to solar irradiation. In the second case, on December 31, from 1:30 a.m. to 12 a.m., the temperature gradually increased from −9.4°C to −1.7°C, and that increase was not affected by solar radiation due to the cloud cover on that day being complete. The solar irradiance did not exceed 65 W/m2, and the daily radiation was only 0.71 MJ/m2. The temperature increase was therefore only attributed to an advection of warm air masses.
Even if the database used for the calibration of the model comprise, a small number of days with such an unusual course of temperatures, the precision of the whole model is greatly reduced. Estimation of daily radiation on such days using a model based on the temperature amplitude will be burdened with a large error. In order to limit the impact of atypical thermal conditions during the day on the precision of estimation, we propose the following procedure for determining the maximum and minimum temperatures for a given day:
-
Tmin is read from 0.00 to the second hour after sunrise;
-
Tmax is read from the solar noon to the second hour after sunset.
If the relationship between the temperatures is: Tmin>Tmax, then a day exhibiting such relationship is removed from the database. If, despite the above assumptions, there are negative values of no physical sense among the estimated daily radiation, they are replaced by the lowest daily radiation measured in a given period of the year. The model with the H−S structure calibrated with the modified database was named H−SM.
The models were calibrated according to the NRSME error minimization criterion. In the first stage of research, the H–S model was calibrated according to a standard procedure, i.e., without any database modification and without adjusting the estimation results. Then, the database was divided according to 12 months of the year, and the estimation precision was calculated depending on the month of the year using the aHS and bHS constants, generated from processing the entire database. Further, the H–SM model was calibrated by modifying the procedure of determining the daily temperature amplitudes in the database, and the estimation results were corrected when their values were negative. The model was calibrated for each of the 12 months of the year separately based on monthly intervals generated from a rich database. Results were compared to those achieved with the classically calibrated H–S model.
Then, the same method used for the horizontal plane analysis was applied to the database of measurements coming from the 2-axis tracking plane (tracking azimuth and elevation of the Sun). The measurement data on both planes came from the same station and the same period of time. The structures of models for the 2-axis tracking plane were not changed, however the sum of extraterrestrial solar radiation HEXT was calculated this time for the 2-axis tracking plane:
H E X T t r a c k =   є I 0 τ s e t τ r i s e
where:
I0—solar constant equal to 1367 W/m2;
Є—correction factor depending on the day number of the year;
τset—sunset time at the measurement location;
τrise—time of sunrise at the place of measurement.
Figure 3 illustrates the values of H E X T h o r and H E X T t r a c k during the calendar year. In addition, the average daily solar radiation recorded on the measurement station on horizontal and the 2-axis tracking planes were included. Considering the trend of the variability of the quantities presented in the graph, a hypothesis arises that for estimation of solar daily radiation on a 2-axis tracking plane, the use of H E X T h o r is more justified. To solve this question, we compared the precision of the H−S model in both variants of calculating extraterrestrial solar radiation.
The procedure for estimating solar radiation on a 2-axis tracking plane in indirect mode may be more accurate than the direct estimation. This conjecture is based in turn on the strong relationship between daily solar radiations on the horizontal plane and on the tracking plane (Figure 4). The linear regression determination factor for measured values R2 = 0.930 suggests that an intermediate procedure should be considered-first estimate the horizontal value, and then calculate it for 2-axis tracking. The procedure is composed of three steps:
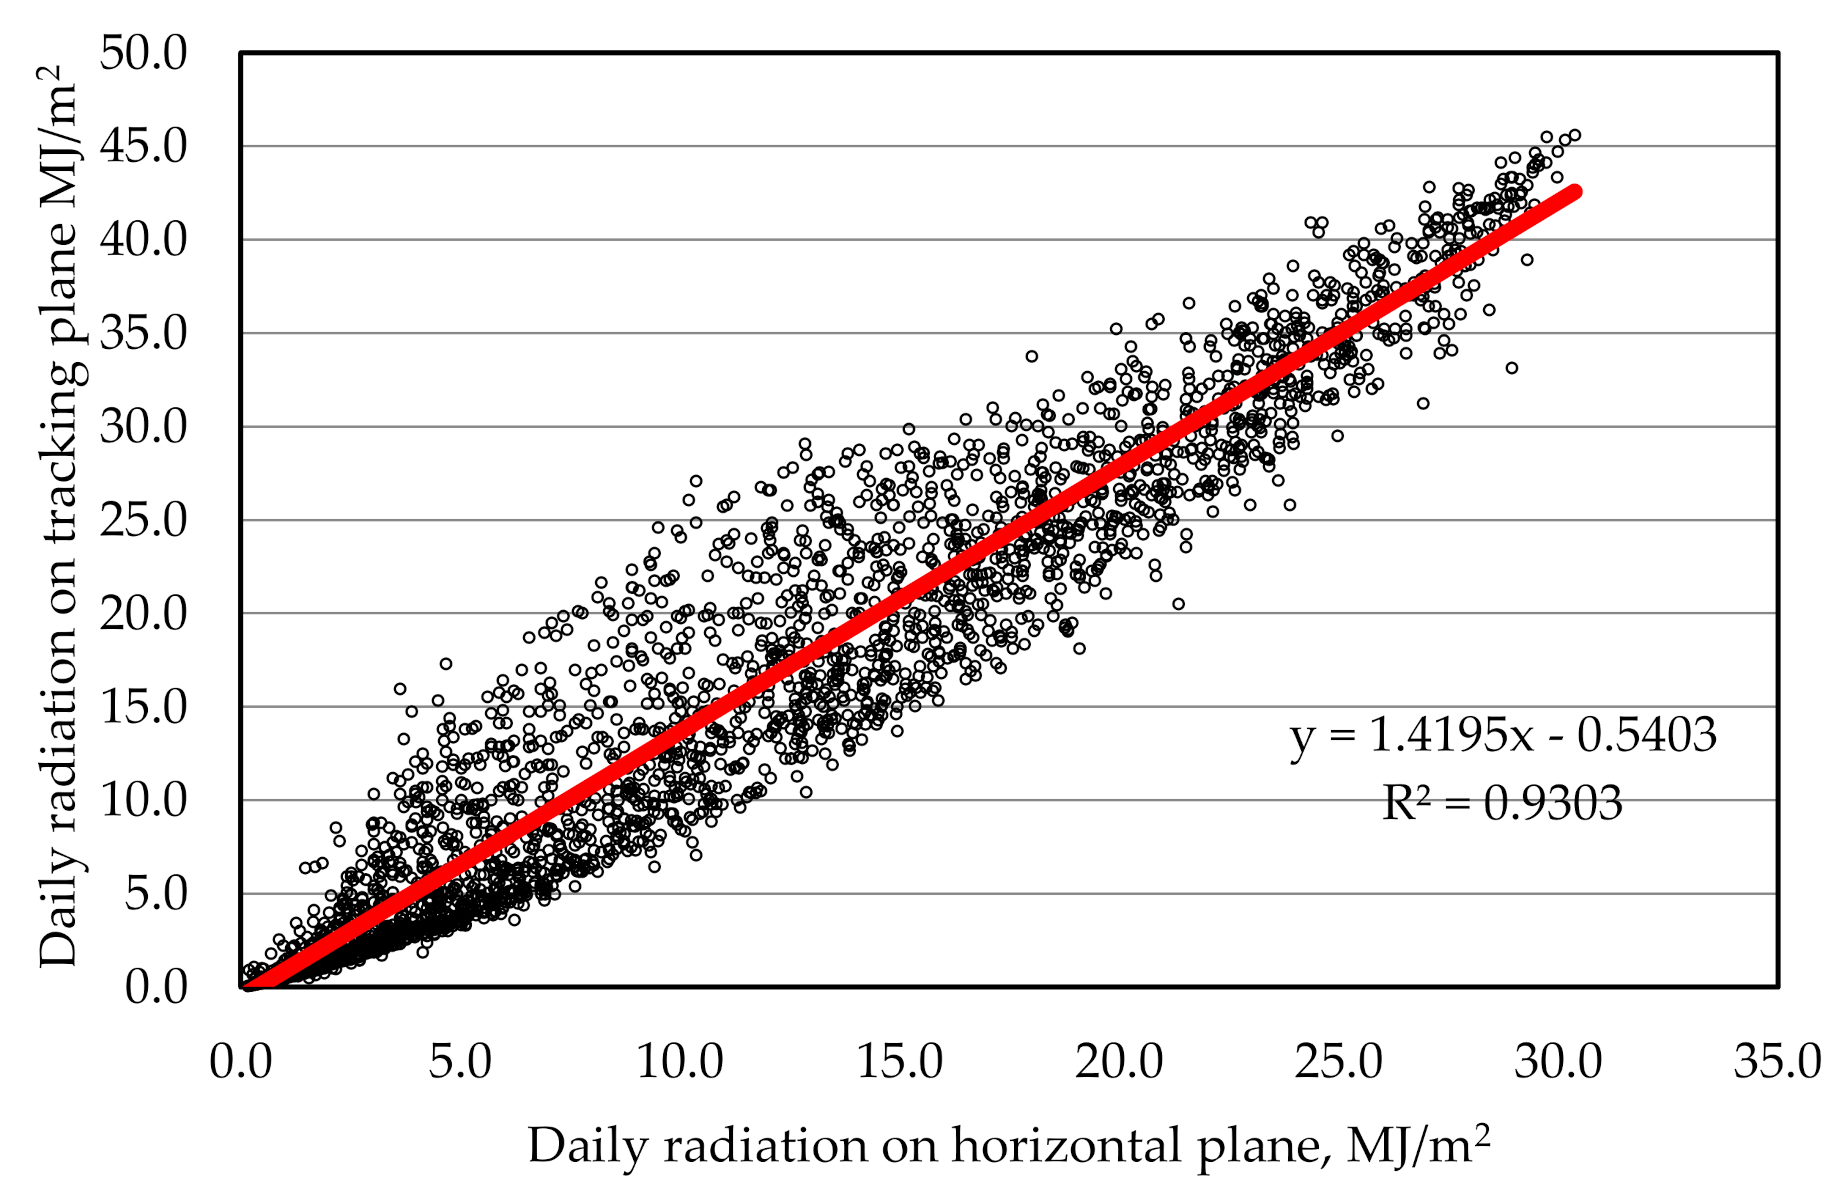
  • Step 1-determination of the correlation relationship between daily solar radiation on a 2-axis tracking plane and on the horizontal plane;
  • Step 2-estimation of daily radiation using the H–S model on a horizontal plane;
  • Step 3-calculation of daily radiation on a 2-axis tracking plane based on the results of the second step according to the relationship determined in the first step.
The accuracy of the indirect method was compared with the accuracy of the direct method.
In addition, for each of the 12 months of the year, the accuracy of direct and indirect estimation on 2-axis tracking plane was compared. The indirect method uses individual monthly correlations between daily radiations on both planes.
The precision of estimation on the 2-axis tracking plane was compared with the precision on the horizontal plane, both in the basic and modified calibration versions.
A separate question, that accompanies the subsequent stages of implementations of temperature estimation models, is the identification of the feature of solar irradiation that limits the precision of estimation. We claim that the precision of models is determined by the coefficient of variation of daily sums in monthly intervals. The simplest determinant of variability of the data set is the standard deviation in relation to the mean value.
The research presented here in this article is an application of a model based on temperature amplitude in Warsaw, Poland. Improving the precision of estimation by individual calibration of the model for individual months has universal application. The extensive database of measurements allowed us to simultaneously evaluate the estimation of solar daily radiation on a horizontal and on 2-axis tracking planes.

3.2. Database

The data used in the study, serving the Hargreaves and Samani model calibration, originate from the weather station of the Department of Fundamental Engineering, Warsaw University of Life Sciences. The station was established in 2005 and is located on the eastern edge of the Ursynów District, with the following coordinates: latitude (N)52°09’38”, longitude (E) 21°03’12”, altitude 100 m. Global solar irradiance is measured using sensors manufactured by Kipp and Zonnen: CM11 on horizontal plane and CM3 on 2-axis tracking plane. For the purpose of this study, radiation is summed up in daily intervals. Air temperature is measured by a Pt-1000 sensor, as the equipment of the thermo-hygrometer.
The database used for the calibration of models covers the years 2005–2015. The condition for comparing models for both planes is that the measurements of solar irradiance on horizontal and on 2-axis tracking plane were taken in the same place and time. For each month, the database covered at least 200 days, and in the entire period spans over 3422 days for the horizontal plane and over 3250 days for the 2-axis plane. The characteristics of the database for both planes are presented in Table 2.
The maximum daily radiation noted on horizontal plane in the examined period amounted to 29.97 MJ/m2, and the minimum to 0.20 MJ/m2. On 2-axis tracking plane, the measurement results were 42.59 MJ/m2 and 0.15 MJ/m2, respectively. The average daily radiation on horizontal plane for the complete database amounted to 10.77 MJ/m2, and on 2-axis tracking plane to 15.09 MJ/m2 with standard deviation of 8.37 MJ/m2 and 12.11 MJ/m2, respectively. Air temperature in the extreme case dropped in January to −23.4°C, whereas the maximum value of +37.0°C was reached in August. Recorded daily temperature gradients ranged from 0.7°C to 20.8°C.

4. Results and Discussions

4.1. Test of the H–S Model Accuracy for Horizontal Plane

At the first stage of the tests of the estimating daily solar radiation on horizontal plane using the H–S model, the coefficients were calibrated for the entire database. In accordance with the optimization criterion, the following values were obtained: aHS=0.164 and bHS= −0.895. For Poland, Bojanowski recommends: aHS=0.15 and bHS=0. The NRSME amounted to 24.64%. The correlation between estimated and measured radiation, expressed with the coefficient of determination R2, was equal to 0.854.
In the next step, we used the model with the coefficients aHS = 0.164 and bHS = −0.895 to estimate the daily radiation in 12 monthly intervals (Table 3). Taking into account all four model accuracy indicators, results of the estimation of daily radiation in December and January were significantly worse than the results in July, August, and September. The NRSME exceeded 60% in December and January, and the correlation between measured and estimated values was weak. The estimation was the most precise in July, August, and September. The NRSME in this period of the year decreased to 22% and the correlation achieved in these months is regarded as strong. The highest coefficient of determination was recorded in September − R2 = 0.692, and it most probably results from the fact that the average value of the daily solar radiation in September is close to the average of the whole year.
We verified whether this daily amplitude of temperature is related to the accuracy of estimating solar daily radiation. The set of input data of the model and results of the estimation are sorted in ascending order, according to the daily amplitude. Figure 5 presents the dependence between the relative error of estimating daily radiation and the amplitude of temperature. In the majority of cases, the estimation on days with low temperature amplitude results in overestimating the daily radiation. In turn, when the amplitudes are high, the daily radiations are generally underestimated.
In the second part of the research, we modified the database by recording the minimum and maximum temperatures at specific times of the day. Nearly 15% of all days in the cold half of the year were affected by the change in the temperature amplitude resulting from this modification procedure, and the number of days removed from the database accounted for 2% of the database during this period of time. In the warm half of the year, corrections were sporadic and the H–SM model was used to estimate the daily radiation for such a modified database. Compared to the H–S model based on the original database, the H–SM model has a slightly better precision throughout the year (Table 3). In the next step, individual calibration of the HSM model was used for each month separately. The NRSME in individual months decreased within 5.3 ÷ 10.9% on a relative scale compared to the primary H–S model (Table 4). The correlation of estimated daily radiation, with measured ones, improved each month. The coefficient of determination increased the most significantly during the months for which the database modification changed the temperature amplitude in the largest number of days—such as in January, February, November, and December. Unfortunately, winter remains a period of low precision estimation.
The accuracy of the estimation of daily solar radiation in monthly intervals changes with the season of the year. We noticed that estimation errors are related to the coefficients of variation of daily sums in given months. Figure 6 shows the NRSME diagram of the HS model and the coefficients of variation of daily radiations in each of the 12 months of the year. The smallest variability of daily radiations found in July and August corresponds to the highest model accuracy. However, in December, January, and February, when the variability of daily radiations is the highest in the year, the estimation is burdened with the largest errors.

4.2. Test of the H–S Model Accuracy for a 2-axis Tracking Plane

The HS model, like other models, is used to estimate the daily solar radiation on a horizontal plane. Its adaptation to a 2-axis tracking plane required a preliminary comparison of three procedures. First, the structure of the model used the value H E X T h o r , i.e., the extraterrestrial daily solar radiation for the horizontal plane. Using the calibration of coefficients for the entire database of the 2-axis tracking plane, we obtained: aHS = 0.211 and bHS= −0.665. In the next stage, H E X T t r a c k was used in the structure of model, and the calibration resulted in: aHS = 0.138 and bHS = −9.537. Precision of estimation of both models are given in Table 5. The model using H E X T h o r is characterized by larger estimation errors: MAPE of over 30%, and NRSME of 7.2% on a relative scale. The coefficient of determination is lower by 8.8%. Therefore, a model based on H E X T t r a c k was further used.
Additionally, we checked what precision could be achieved in estimation of daily radiation on the tracking plane by the indirect method—by first estimating horizontal then calculating tracking. To calculate the estimated daily radiation from the horizontal plane H E S T h o r to the 2-axis tracking plane H E S T t r a c k , the relationship was used (see Figure 4):
H E S T t r a c k = 1.419 H E S T h o r 0.54
The estimation errors by the indirect method (Table 5) are higher than when using direct estimation by about 9% on a relative scale, and the correlation is distinctly weaker.
Then, the precision of estimation by the direct and indirect method was established for each month individually. In the direct method, the version of the H–S model obtained for the entire database, i.e., containing: aHS = 0.138 and bHS= −9.537, was used for data from monthly intervals. In the case of the indirect method, the correlation between the measured daily radiation on the horizontal and the 2-axis tracking planes was initially determined for each of the 12 months. Coefficients of determination R2 in April, May, June, and July exceeded the value of 0.960. The lowest values were recorded in February (0.845) and December (0.863). Importantly, in September, the correlation between daily radiations on the examined planes is the same as when considering the whole year. The R2 values are given in Table 5 in parentheses next to the month names. The correlation of daily radiations on the 2-axis tracking plane with radiations on the horizontal plane is shown for the selected months in Figure 7. As a next step, the daily radiations on the 2-axis tracking plane were calculated according to correlation relationships in given months. The values of daily radiations on the horizontal plane were estimated with the H–S model with constants determined for the entire year, i.e., with: aHS= 0.164 and bHS= −0.895. It turns out that after dividing the database into monthly intervals, it was impossible to clearly indicate which of the estimation methods was more accurate. In February, March, August, and October, the direct estimation exhibits the advantage, but in the remaining months, there are no strong differences.
In the next step, a modified direct estimation procedure was used on the tracked plane, analogous to the previously described HSM version, where the horizontal plane is explained. The procedure for determining the temperature amplitude was corrected and the model was calibrated for each month individually. The obtained MAPE, NRSME, and R2 are presented in Table 6. The modification of the procedure increased the estimation precision in all months, except February. NRSME decreased the most by 15.9%, relatively, in September, and by 9–13% in January, May, July, and December. The strength of the correlation of measured and estimated daily radiation increased most in December, January, and February. In the months of the warm season, R2 increased only by a few percentage points.

4.3. Comparison of Estimation on Horizontal and 2-axis Tracking Planes

The comparison of errors and coefficients of determination need to be related to the results of estimation on both planes with the same assumptions as to the procedure itself. In each variant of the procedure, the estimation of daily solar radiation using a model with the H–S structure on a 2-axis tracking plane is less accurate than on a horizontal plane. For example, the results were compared when the model was calibrated for each month separately and at the same time, the temperature amplitudes were modified (version H–SM). In Table 7, positive values indicate the relative increase in estimation errors on the tracking plane compared to the estimation on the horizontal plane. In the case of the coefficient of determination, a negative value means a decrease in the value on the tracked plane. In May, June, and July the difference in the accuracy of the models is the smallest, but still the errors for the tracked plane are more than 30% higher on the relative scale. From September to February, errors are more than 50% higher. Comparing the models for the whole year, MAPE, and NRSME errors for the tracked plane are about 50% higher than for the horizontal plane. As for R2, the differences between models calibrated for monthly intervals are small. However, for the whole year, the correlation is clearly higher when the estimation concerns the horizontal plane.
The differences in the precision of estimation for both planes are not surprising. The estimation of daily solar radiation on a horizontal plane in monthly intervals has shown that the precision of the model decreases as the variability of real daily radiations increases. The sequence of daily solar radiations on the 2-axis tracking plane is characterized by higher coefficients of variation than on the horizontal plane, which results in less precise estimation. A comparison of the indicators of daily radiations variability in individual months is shown in Figure 7. The relative difference between variability on both planes is strongly correlated with the relative difference in NRSME values for the estimation daily radiation on these planes (Figure 8). The R2 determination coefficient of this relationship is 0.90.
The greater variability of daily solar radiation on tracking planes in comparison to the horizontal plane results from the structure of global radiation itself. The global radiation consists of the direct, diffuse, and reflected radiation components, and the diffuse one is the most stable value. This component is present at the highest proportion in global radiation on the horizontal plane.

5. Conclusions

The accuracy of the estimation of daily solar radiation on the horizontal plane obtained with classic calibration, i.e., uniform for the whole period, allowed to build a model with an NRSME of 29.7% and correlations of estimated and measured values with R2 =0.85. These values correspond to the values found in the Hargreaves and Samani model studies for central Europe. We confirmed, using a uniform calibration H–S model for estimating daily radiation in separate monthly intervals, the trend seen in Trnka et al.. In June, July, August, and September, NRSME were the lowest and amounted to 20–25%. The estimations in the months of climate in the winter, i.e., in November, December, January, and February, were affected with very high errors and, therefore, it becomes useless. Analysis of measured data also showed that the level of precision in estimating daily solar radiation is associated with the variability of values measured over a given period. The lowest indicators of variability characterize the region of central Europe in the summer months when the relative estimation errors are also the lowest. The opposite happens for the winter months.
In this work, we improved the precision of estimation by individual calibration coefficients of the model for monthly separate intervals. It is also justified to remove from the database an insignificant number of days with extremely atypical temperature profiles and to replace the negative results with the lowest recorded in the database in a given period. The cumulative effect of these modifications in individual months is a decrease in NRSME by 5 to 11% on a relative scale and an increase in the determination coefficient R2, significantly in the winter months, and by a few percentage points in the summer months. For the database that covers some years, it is advisable to perform calibrating models separately for each month.
The precision of estimation on the 2-axis tracking plane is much lower than that achieved on the horizontal plane. For the whole year, MAPE and NRSME errors are relatively 50% higher, and the R2 determination factor is 17% lower. When considering monthly intervals, the smallest differences in estimation precision occur in May, June, and July. Comparing the precision of the models on both planes in 12 monthly intervals, it turns out that the increase in errors on the 2-axis tracking plane is proportional to the increase in variability of daily radiations.
The estimation of solar radiation on the tracking plane can be performed by the indirect method using the correlation between daily radiations on these planes. For the whole year, the direct method is a better option, but for individual months taken separately, the results of the comparison are not definitive.
Similarly, as for the horizontal plane, the individual calibration of the model in each month of the year and corrections of temperature amplitudes and negative results improve the accuracy of estimation on the tracking plane. The modification of the procedure gave the best results in May, July and September.

Author Contributions

Conceptualization, D.C., P.O.; literature review, D.C., T.B.; database preparation, D.C., T.B.; writing—review and editing, D.C. T.B.; funding acquisition, P.O. All authors have read and agreed to the published version of the manuscript.

Funding

This research was funded by Warsaw University of Life Sciences.

Conflicts of Interest

The authors declare no conflict of interest.

References

  1. Bojanowski, J. Quantifying Solar Radiation at the Earth Surface with Meteorological and Satellite Data. Ph.D. Thesis, University of Twente, Enschede, The Netherlands, 2013. [Google Scholar]
  2. Zhang, J.; Zhao, L.; Deng, S.; Xu, W.; Zhang, Y. A critical review of the models used to estimate solar radiation. Renew. Sustain. Energy Rev. 2017, 70, 314–329. [Google Scholar] [CrossRef]
  3. Bandyopadhyay, A.; Bhadra, A.; Raghuwanshi, N.S.; Singh, R. Estimation of monthly solar radiation from measured air temperature extremes. Agric. For. Meteorol. 2008, 148, 1707–1718. [Google Scholar] [CrossRef]
  4. Goodin, D.G.; Hutchinson, J.M.S.; Vanderlip, R.L.; Knapp, M.C. Estimating solar irradiance for crop modeling using daily air temperature data. Agron. J. 1999, 91, 845–851. [Google Scholar] [CrossRef]
  5. Mavromatis, T. Estimation of solar radiation and its application to crop simulation models in Greece. Clim. Res. 2008, 36, 219–230. [Google Scholar] [CrossRef]
  6. Allen, R.G.; Pereira, L.S.; Raes, D.; Smith, M. Crop Evapotranspiration (Guidelines for Computing Crop Water Requirements). FAO Irrigation and Drainage. Paper 56. 1998. Available online: https://appgeodb.nancy.inra.fr/biljou/pdf/Allen_FAO1998.pdf (accessed on 16 August 2020).
  7. Samani, Z. Estimating solar radiation and evapotranspiration using minimum climatological data. J. Irrig. Drain. Eng. 2000, 126, 265–267. [Google Scholar] [CrossRef]
  8. Ångström, A. Solar and terrestrial radiation. Q. J. R. Meteorol. Soc. 1924, 50, 121–125. [Google Scholar] [CrossRef]
  9. Rivero, M.; Orozco, S.; Sellschopp, F.; Loera-Palomo, R. A new methodology to extend the validity of the Hargreaves-Samani model to estimate global solar radiation in different climates: Case study Mexico. Renew. Energy 2017, 114, 1340–1352. [Google Scholar] [CrossRef]
  10. Chen, R.; Ersi, K.; Yang, J.; Lu, S.; Zhao, W. Validation of five global radiation models with measured daily data in China. Energy Convers. Manag. 2004, 45, 1759–1769. [Google Scholar] [CrossRef]
  11. Mavromatis, T.; Jagtap, S. Estimating solar radiation for crop modeling using temperature data from urban and rural stations. Clim. Res. 2005, 29, 233–243. [Google Scholar] [CrossRef]
  12. Abraha, M.; Savage, M.J. Comparison of estimates of daily solar radiation from air temperature range for application in crop simulations. Agric. For. Meteorol. 2008, 148, 401–416. [Google Scholar] [CrossRef]
  13. Li, M.-F.; Fan, L.; Liu, H.-B.; Guo, P.-T.; Wu, W. A general model for estimation of daily global solar radiation using air temperatures and site geographic parameters in Southwest China. J. Atmos. Solar Terr. Phys. 2013, 92, 145–150. [Google Scholar] [CrossRef]
  14. Iziomon, M.G.; Mayer, H. Performance of solar radiation—A case study. Agric. For. Meteorol. 2001, 110, 1–11. [Google Scholar] [CrossRef]
  15. Ball, R.A.; Rosalind, A.; Purcel, L.C.; Larry, C.; Carey, S.K.; Sean, K. Evaluation of solar radiation prediction models in North America. Agron. J. 2004, 96, 391–397. [Google Scholar] [CrossRef]
  16. Rivington, M.; Bellocchi, G.; Matthews, K.; Buchan, K. Evaluation of three model estimations of solar radiation at 24 UK stations. Agric. For. Meteorol. 2005, 132, 228–243. [Google Scholar] [CrossRef]
  17. Trnka, M.; Žalud, Z.; Eitzinger, J.; Dubrovský, M. Global solar radiation in central European Rowlands by various empirical formulae. Agric. For. Meteorol. 2005, 131, 54–76. [Google Scholar] [CrossRef]
  18. Mecibah, M.S.; Boukelia, T.E.; Tahtah, R.; Gairaa, K. Introduction the best model for estimation the monthly mean daily global solar radiation on horizontal surface (Case study: Algeria). Renew. Sustain. Energy Rev. 2014, 36, 194–202. [Google Scholar] [CrossRef]
  19. Teke, A.; Yıldırım, H.B.; Çelik, O. Evaluation and performance comparison of different models for the estimation of solar radiation. Renew. Sustain. Energy Rev. 2015, 50, 1097–1107. [Google Scholar] [CrossRef]
  20. Bechini, L.; Ducco, G.; Donatelli, M.; Stein, A. Modelling, interpolation and stochastic simulation in space and time of global solar radiation. Agric. Ecosyst. Environ. 2000, 81, 29–42. [Google Scholar] [CrossRef]
  21. Urraca, R.; Martinez-De-Pison, E.; Sanz-Garcia, A.; Antonanzas, J. Estimation methods for global solar radiation: Case study evaluation of five different approaches in central Spain. Renew. Sustain. Energy Rev. 2017, 77, 1098–1113. [Google Scholar] [CrossRef]
  22. Hargreaves, G.H.; Samani, Z.A. Estimating potential evapotranspiration. J. Irrig. Drain. Eng. 1982, 108, 223–300. [Google Scholar]
  23. Besharat, F.; Dehghan, A.A.; Faghih, A.R. Empirical models for estimating global solar radiation: A review and case study. Renew. Sustain. Energy Rev. 2013, 21, 798–821. [Google Scholar] [CrossRef]
  24. Jahani, B.; Dinpashoh, Y.; Nafchi, A.R. Evaluation and development of empirical models for estimating daily solar radiation. Renew. Sustain. Energy Rev. 2017, 73, 878–891. [Google Scholar] [CrossRef]
  25. Duffie, J.A.; Beckman, W.A. Solar Engineering of Thermal Processes; John Wiley & Sons: New York, NY, USA, 1991. [Google Scholar]
  26. Mahmood, R.; Hubbard, K. Effect of time of temperature observation and estimation of daily solar radiation for the Northern Great Plains, USA. Agron. J. 2002, 94, 723–733. [Google Scholar] [CrossRef] [Green Version]
  27. Donatelli, M.; Campbell, G.S. A simple model to estimate global solar radiation. In Proceedings of the 5th Congress of the European Society of Agronomy, Nitra, Slovakia, 28 June–2 July 1998; Zima, M., Bartosova, M.L., Eds.; 1998; pp. 133–134. [Google Scholar]
  28. Bristow, K.L.; Campbell, G.S. On the relationship between incoming solar radiation and daily maximum and minimum temperature. Agric. For. Meteorol. 1984, 31, 159–166. [Google Scholar] [CrossRef]
  29. Almorox, J.; Hontoria, C.; Benito, M. Models for obtaining daily global solar radiation with measured air temperature data in Madrid (Spain). Appl. Energy 2011, 88, 1703–1709. [Google Scholar] [CrossRef]
  30. Almorox, J.; Bocco, M.; Willington, E. Estimation of daily global solar radiation from measured temperatures at Cañada de Luque. Córdoba, Argentina. Renew. Energy 2013, 60, 382–387. [Google Scholar] [CrossRef] [Green Version]
  31. Yusoff, M.I.; Irwanto, M.; Safwati, I.; Nair, G.; Syed, H.; Fitra, M. Estimating daily solar radiation using hargreaves model in Eastern Malaysia. Appl. Mech. Mater. 2014, 699, 564–569. [Google Scholar] [CrossRef]
  32. Kumar, S.; Kaur, T. Development of ANN based model for solar potential assessment using various meteorological parameters. Energy Procedia 2016, 90, 587–592. [Google Scholar] [CrossRef]
  33. Mohanty, S.; Patra, P.K.; Sahoo, S.S. Prediction and application of solar radiation with soft computing over traditional and conventional approach–A comprehensive review. Renew. Sustain. Energy Rev. 2016, 56, 778–796. [Google Scholar] [CrossRef]
  34. Da Silva, M.B.P.; Escobedo, J.F.; Rossi, T.J.; Dos Santos, C.M.; Da Silva, S.H.M.G. Performance of the Angstrom-Prescott Model (A-P) and SVM and ANN techniques to estimate daily global solar irradiation in Botucatu/SP/Brazil. J. Atmos. Sol. Terr. Phys. 2017, 160, 11–23. [Google Scholar] [CrossRef]
  35. Tymvios, F.S.; Jacovides, C.P.; Michaelides, S.C.; Scouteli, C. Comparative study of Ångström’s and artificial neural networks methodologies in estimating global solar radiation. Sol. Energy 2005, 78, 752–762. [Google Scholar] [CrossRef]
Figure 1. Solar irradiance and temperature during a selected day, with intensive advection of cool air masses.
Sustainability 12 09909 g001
Figure 2. Solar irradiance and temperature during a selected day, with intensive advection of warm air masses.
Sustainability 12 09909 g002
Figure 3. Solar daily radiation on horizontal and 2-axis tracking planes, extraterrestrial and maximum ground observed.
Sustainability 12 09909 g003
Figure 4. Correlation between daily solar radiation on horizontal plane and 2-axis tracking plane.
Sustainability 12 09909 g004
Figure 5. Impact of daily temperature amplitude on accuracy; the estimation of daily radiation on horizontal plane.
Sustainability 12 09909 g005
Figure 6. Estimation error of daily solar radiation against the background of variability of daily radiations in individual months.
Sustainability 12 09909 g006
Figure 7. Variability of daily solar radiations on horizontal and 2-axis tracking planes.
Sustainability 12 09909 g007
Figure 8. Relative difference between NRSME errors in estimation of daily solar radiation on horizontal plane and 2-axis tracking plane depending on the relative difference between variability of daily solar radiations.
Sustainability 12 09909 g008
Table 1. The calibration of the Hargreaves and Samani (H–S) model and statistical accuracy indicators in different regions of the world.
Locality, CountryLatitudeaHSbHS   H O B S ¯ MJ / m 2 Timescale, DayNRSME%R2
Wageningen
The Netherlands [12]
52.0 N0.140−0.72810.2133.260.828
Rothamsed,
England [12]
51.8 N0.141−0.61010.4134.300.810
Hradec Kralove
Ostrava
Kocelovice
Kucharovice
Czech Republic
Retz
Langenlois
Gross-Enzersdorf
Kremsmünster
Graz
Gmunden
Austria [17]
50.2− −46.9 N0.15–0.16−0.8010.1–11.3128.73–36.2
January 46
February 38
March 37
April 27
May 22
June 25
July 24
August 21
September 26
October 36
November 46
December 57
0.79−0.84
Odessa
(Washington State)
USA [15]
47.3 N0.152 14.91
7
22.07
9.12
0.86
0.98
Padova
Italy [12]
44.9 N0.19−2.0413.6125.420.846
Lincoln
(Nebraska State)USA[15]
42.0 N0.141 15.41
7
25.32
13.11
0.66
0.90
Alexandroupoli
Greece [5]
40.8 N0.17−1.9212.9128.4-
Madrid
Spain [29]
40.2 N0.14–0.16 17.5115.9−17.10.871−0.885
Corfu
Greece [5]
39.6 N0.19−1.9015.0122.4-
Davis
(California State)
USA [12]
38.5 N0.162 18.3123.70.83
Davis
(California State)
USA [15]
38.5 N0.162 18.31
7
16.0
8.7
0.87
0.96
Lexington
(Kentucky State)
USA [15]
38.0 N0.149 14.81
7
24.8
12.4
0.61
0.89
Samos
Greece [5]
37.7 N0.190.4316.1124.2-
Gorgan
Iran [24]
36.9 N 14.38121.60.77
Rhodes
Greece [5]
36.4 N0.251.3919.1122.8-
Lake Alfred
(Florida State)
USA [15]
35.7 N0.150 17.91
7
16.9
9.6
0.55
0.84
Teheran
Iran [24]
35.7 N 18.4121.10.71
Griffith
Australia [12]
35.3 S0.163−0.3318.5121.380.81
Tucson
Arizona State
USA [15]
32.3 N0.161 20.91
7
13.8
6.8
0.76
0.94
Yazd
Iran [24]
31.9 N 21.3111.30.84
Yazd
Iran [23]
31.9 N0.175 21.3303.30.99
Córdoba
Argentina [30]
31.1 S0.146 20.11
5
10
15
20
25
30
18.3
10.3
8.3
7.5
7.0
6.8
6.6
0.76
0.88
0.91
0.92
0.93
0.93
0.94
Ahvaz
Iran [24]
31.3 N 19.4114.20.78
Dehra Dun
India [3]
30.3 N0.160 19.13012.8-
Dry Arid climate
Mexico [9]
25.0–
−32.4 N
0.16
f(ΔT) *
20.2–20.9113.7–14.2
9.8–10.1
0.77
0.89
Tropical Moist climate
Mexico [9]
16.2–
−23.2 N
0.16
f(ΔT) *
18.0–18.7117.4–18.1
14.8–15.4
0.65
0.73
Bandar Abbas
Iran [24]
27.2 N 19.8118.20.47
Pretoria
South Africa [12]
25.7 S0.173−0.25819.3117.60.72
Kota Bharu
Malaysia [31]
6.1 N 16.218.20.87
* where f(ΔT)–means that aHS is variable and depends on the level of amplitude of temperature.
Table 2. Characteristics of the database used to estimate solar daily radiation on horizontal and 2-axis tracking planes.
MonthHorizontal Plane2-axis Tracking Plane
Number of DaysAverage Daily Solar Radiation, MJ/m2Number of DaysAverage Daily Solar Radiation, MJ/m2
January2912.082623.56
February2274.132106.72
March2519.1524513.09
April27114.7826620.03
May29417.5828722.65
June31619.7629625.39
July30819.8129025.78
August26716.2626121.78
September31711.7929916.58
October3186.6431310.85
November2812.552654.09
December2811.612562.32
All daily data342210.77325015.09
Table 3. Accuracy of the estimation of daily solar radiation on horizontal plane using the H–S model with uniform calibration, aHS = 0.164; bHS = −0.895.
MonthModel H–SModel H–SM
MAPE%NRSME%R2-MAPE%NRSME%R2-
All daily data39.2629.660.85435.4029.130.862
January59.5160.030.32755.6756.010.385
February56.0553.780.35846.8449.540.463
March37.1634.740.58433.7332.340.614
April35.7928.380.59528.8826.870.608
May38.0628.250.60426.6225.230.618
June29.3523.470.58021.1421.990.598
July26.7921.150.65419.1319.200.666
August25.0021.540.59221.0120.400.613
September25.7022.640.69221.0220.740.703
October38.1132.610.66031.0129.340.665
November49.1245.860.52144.9642.310.577
December62.8061.180.21461.6754.530.310
Table 4. Comparison of the precisions the H−SM model with the H–S model, application to the horizontal plane.
MonthaHSbHSMAPE%NRSME%R2-
Relative Change
All daily data0.164−0.90−1.5−1.8+1.0
January0.17−0.61−6.4−6.7+17.8
February0.17−1.03−16.1−7.9+29.3
March0.20−2.31−9.2−6.9+5.1
April0.19−4.39−18.9−5.3+2.2
May0.22−8.55−14.9−10.7+2.3
June0.20−6.14−27.8−6.3+3.1
July0.22−7.73−28.3−9.2+1.8
August0.19−3.35−16.0−5.3+3.5
September0.20−3.13−18.3−8.4+3.0
October0.21−2.32−18.6−10.0+0.8
November0.16−0.43−8.4−7.7+10.7
December0.15−0.29−8.5−10.9+44.8
Table 5. Statistical indicators of direct and indirect estimation on the 2-axis tracking plane.
Method of EstimationMAPENRSMER2
Direct estimation with H E X T h o r All daily data107.146.770.670
Direct estimation with H E S T t r a c k All daily data80.943.330.734
January205.7112.50.300
February127.581.550.404
March67.748.220.576
April57.439.940.577
May55.436.350.620
June36.730.640.575
July38.428.860.659
August37.029.560.578
September43.336.760.670
October85.151.520.597
November203.883.620.533
December354.8122.500.289
Indirect estimation-first estimate horizontal than calculate trackingAll daily data (0.930)84.947.440.664
January (0.896)178.3113.90.240
February (0.845)141.587.350.303
March (0.922)69.251.260.499
April (0.969)64.339.430.579
May (0.967)61.633.690.590
June (0.962) 44.931.310.577
July (0.967) 42.128.200.625
August (0.945)40.630.600.514
September (0.930)55.435.310.603
October (0.913)81.254.740.514
November (0.909)162.186.800.394
December (0.863)211.7114.480.286
Table 6. Precision of H−SM model applied to the 2-axis tracking plane.
MonthMAPENRSMER2
All daily data81.442.90.735
January158.198.90.359
February127.282.70.431
March61.346.00.609
April45.836.90.627
May38.833.40.654
June31.929.50.600
July26.825.20.685
August32.428.60.591
September39.830.90.680
October67.948.70.623
November115.574.40.566
December187.8106.50.391
Table 7. Relative increase in estimation errors on the tracking plane compared to the estimation on the horizontal plane.
MonthRelative Difference, %
MAPENRSMER2
January+67+77−7
February+52+67−7
March+37+42−1
April+37+37+3
May+33+32+6
June+31+340
July+31+31+3
August+42+43−4
September+50+49−3
October+63+66−6
November+56+76−2
December+76+95+26
Whole year+51+47−17
Publisher’s Note: MDPI stays neutral with regard to jurisdictional claims in published maps and institutional affiliations.

