Article

Coal Industrial Supply Chain Network and Associated Evaluation Models

School of Chemical Engineering, Sichuan University, Chengdu 610065, China
*
Author to whom correspondence should be addressed.
Sustainability 2020, 12(23), 9919; https://doi.org/10.3390/su12239919
Submission received: 15 September 2020 / Revised: 7 November 2020 / Accepted: 9 November 2020 / Published: 27 November 2020
(This article belongs to the Section Sustainable Management)

Abstract

:
To improve integration and achieve better coal industry materials and energy balance, integrated collaborative supply chains (SCs) are needed. However, as single-core SC models are not suitable for complex coal industry systems, a multicore, correlated, conditional SC model, called a supply chain network (SCN), is proposed. SCN collaborative evaluation models are discussed including industrial metabolic balance (IMB), enterprise profitability, contract execution ability and information interaction ability, for which IMB is used as the efficiency index of resource coordination of SCN, also as the constraints of the models on system levels. Further, data modeling by using BP-ANN algorithm is used to predict the profitability of supply chain network. Finally, the feasibility of the above models is illustrated by cases. The proposed evaluation models in this paper form the scientific and quantitative evaluation method of SC, which could be used for both SC planning and operations management helping detect and eliminate risks.

1. Introduction

As a result of technological development trends and the structural characteristics of new energy, the energy industry, which encompasses the coal, oil and gas and new energy industries, needs to find new development modes to respond to the challenges of the ever-increasing environmental requirements and production and marketing and energy-price volatility imbalances [1]. In China, the resource endowment is characterized by rich coal, poor oil and less gas, so the coal industry occupies a dominant position in China’s energy consumption. In the past 40 years of economic development, coal accounts for 70% of energy consumption. The development of the Chinese coal industry can be divided into four stages [2]. The first stage to the fourth stage is the introduction period, growth period, maturity period and decline period. At present, due to the strong constraints on environmental resources and the enhancement of energy substitutability, the market demand for coal has declined [3]. With the reform of government supply side and the improvement of energy structure, the coal proportion has decreased as the share of natural gas and other clean energies has increased, intensifying the coal chemical industry production surplus. In 2014, mining fixed asset investment was USD 0.23 trillion, an increase of 0.7%; however, coal asset investment experienced a decrease of 9.5% to USD 73.2 billion, the second consecutive year of negative growth (2015 China Mineral Resources, 2015), and in 2015, average coal industry capacity utilization decreased by 26%. Therefore, the government has issued a series of policies to eliminate backward production capacity, resolve excess capacity and improve the quality of coal supply [4,5]. In the coal supply chain involved in the production, supply, transportation, demand and other different links, there are many trading subjects and enterprises, and always through the two-way flow of logistics and capital flow, bank settlement and financing demand is huge [6,7]. Enterprise agglomeration and industry integration trends, which have attracted significant research and engineering practice attention, have therefore become important development directions for the coal industry [8]. Supply chain integration has been seen to be a typical solution, with such supply chain (SC) integration and collaboration mainly focused on material movement value chains from raw material suppliers to manufacturers to distributors to retailers and customers [9,10], as shown in Figure 1.
Consequently, SC collaborative evaluation has become an important research focus for SC establishment and optimization [11,12,13,14,15,16,17]. Lambert et al. indicated that successful SC management depended on the focal members of SC, which integrated SC by four components: planning, control methods, workflow, communication and information flow facility structure. The integration and redesign initiatives of SC should be aimed at promoting efficiency and effectiveness of the whole SC and every member of the supply chain [18,19]. Zhang analyzed the influential factor action mechanism in supply chains using self-organization theory, from which SC technology spillover models were established [20]. Kristianto introduced an initial basis for an innovative decision support systems platform which was capable of integrating supply chain system design, management, control and optimization activities [21]. Anbanandam developed a method, which included factors such as management commitment, information sharing, trust between supply chain partners, long-term relationships, as well as risk and reward sharing variables, to measure the collaborative degree between apparel retailers and manufacturers in the retail apparel industry [22]. Zokaee presented a robust optimization model for the design of a supply chain facing uncertainty in demand, supply capacity and major cost data including transportation and shortage cost parameters [23]. Arampantzi propose a new Multi-objective Mixed Integer Linear Programming (MMILP) model, which captures significant decisions involved in designing or redesigning high performance, sustainable supply chains. To solve the proposed model, both goal programming and the e-constraint method to achieve efficient trade-offs among the three objectives are used [24]. However, to date, as most SC research has been business oriented, there have been few energy industry focused studies. In fact, to realize sustainable coal chemical industry development, enterprises need to diversify value and promote industrial chain integration, increasing the complexity of the SC structure [25,26,27]. The coal chemical industry chain is shown in Figure 2.
The coal chemical industry refers to the process of converting coal into gas, liquid and solid fuels and chemicals, mainly including coal gasification, liquefaction, retorting, tar processing and calcium carbide acetylene chemical industry. In order to realize clean and efficient utilization of coal resources, various technical paths, product categories and market supplies should be integrated and complementary based on the balance of mass, energy, chemical reactions and special market conditions. At the same time, the utilization of waste gas, synthetic tail gas, coal gasification and combustion ash and other wastes and surplus energy are also important. In essence, on each node of SC, the physical form and material composition could be changed obeying the rules of energy and material balance, it is the distinctions between chemical industry supply chain integration and other industry supply chain integration. Therefore, it is difficult to establish a single-core model for a complex supply chain that embraces coal resources, industrial production, consumption as well as environmental factors. As business difficulties by a single enterprise in the coal industrial chain can lead to a decrease and/or fluctuation in SC integration, making it difficult to maintain normal operations, constructing collaborative evaluation models adapted to the carbon industry chain would be a more practical solution [28]. To improve the coordination and the robustness of the coal industry chain, the viability of a multicore supply chain and its associated collaborative evaluation models needs to be evaluated based on the coal industry properties.
There have been some research interests in the development of multinode SC models. Dan proposed a stochastic programming model for locating distribution centers to adapt to the dynamically changing demands at retailers’ sites [29]. Tang analyzed the SC robustness when faced with catastrophic disruption events [30]. Ma proposed an integrated bilevel production-distribution planning model aimed at minimizing total costs on the condition that the core firm plays a key role in deciding which node in the SC serves customers [31]. Herwig identified resources, objects and parameters for supply chain flexibility, and designed and highlighted the potential of a strategic supply chain network to improve SC flexibility [32]. Farahani [33] reviewed and introduced the main features of the models proposed in both supply chain network design (SCND) and competition literature. After investigating the proposed competitive SCND model, a general framework of competitive SCND problem modeling considering management insight is developed, and the potential areas for future research are proposed. Based on the closed-loop supply chain network, Amin [34] propose a mixed-integer linear programming model with minimum total cost, which can be extended to consider environmental factors by weighted sum and a-constraint method. The test results show that the model can deal with demand and return uncertainties, simultaneously. Amin [35] proposed a mathematical model for a closed-loop supply chain network by considering global factors, including exchange rates and customs duties. To design a multiproduct closed-loop green supply chain network consisting of manufacturing/remanufacturing and collection/inspection centers as well as disposal center and markets, Talaei [36] proposed a mixed-integer linear programming model capable of reducing the network total costs. The model has been developed so as to consider such environmental objectives as reducing the rate of carbon dioxide emission in the environment throughout the network in question. Li et al. [37] take the coal supply chain network as the research object, combined with the carbon emission policy and establish the comprehensive decision-making model for sustainable design of coal supply chain. Through empirical analysis and comparison of four different carbon emission policies on coal supply chain network optimization, it is found that coal enterprises have the best emission reduction effect under carbon trading policy. Ghahremani-Nahr [38] proposed a facility location/allocation model for a multiechelon multiproduct multiperiod CLSC network under shortage, uncertainty and discount on the purchase of raw materials. To design the network, a mixed-integer nonlinear programming (MINLP) model capable of reducing total costs of network is proposed. Ahmadzadeh [39] propose a nonlinear programming model based on the three-level closed loop supply chain for location-inventory-pricing decisions and use three meta-heuristic algorithms for solving it namely the genetic algorithm (GA), the imperialist competitive algorithm (ICA) and the firefly algorithm (FA).However, as the above SC models were based on one core firm, these models and methods are unable to meet the evaluation and optimization needs for a complex multicore SC. To improve coal industry industrial structural theory and address the shortage of collaborative evaluation models for the coal industry supply chain network, a new collaborative SC evaluation model will be proposed in this paper which considers industrial metabolic balance, sustainable profitability, enterprise contract execution ability and information interactivity.
The remainder of this paper is organized as follows. Section 2 presents a multicore supply chain, called the SCN and presents a theoretical discussion of the current evaluation models. In Section 3, case studies are presented to analyze the SCN and the associated coal industry evaluation models. Grey relational analysis (GRA) is applied to remove lowly correlated, nonindependent influential factors, and a hybrid GA-BP algorithm is used to establish an enterprise profitability model. Finally, in Section 4, we conclude the paper and discuss future research directions.

2. Multinode Supply Chain and Collaborative Evaluation Models

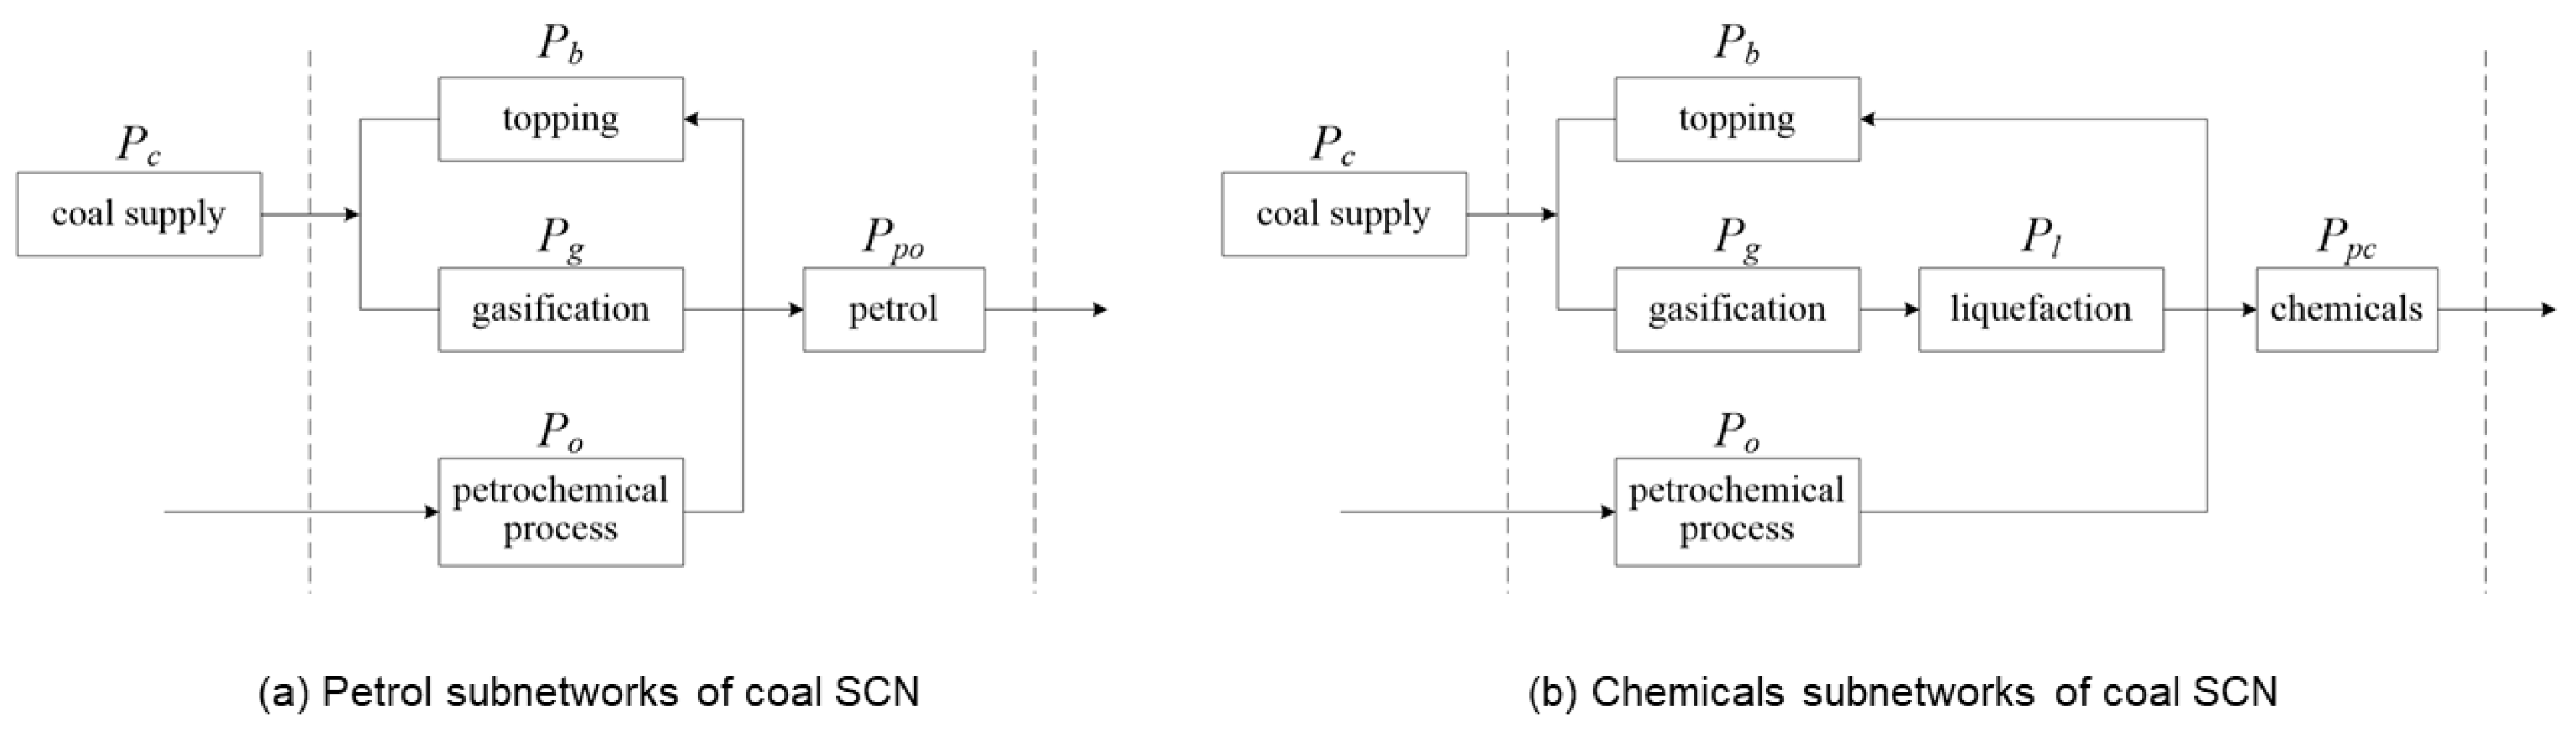
2.1. Multinode Supply Chain

As discussed, because of complex product structures, materials cross linking, the rigid constraints for each single chemical process and the need for close collaboration between SC node enterprises, it is difficult to establish stable closed-loop material balance and decision optimization models for coal enterprise groups [40]. To achieve thermodynamic equilibrium, material balances and conditions suitable for the enterprise group, a multicore, correlated, conditional supply chain mode is required to integrate the environmental, industrial and market requirements; a “resource–product–consumption–waste–renewable resource”; which is composed of a variety of enterprises and correlative entities, all of which are seen as equivalent.
To distinguish the difference from a single-core SC model, the above multicore SC mode is named the supply chain network (SCN). In the SCN, resources, machining, markets, the environment and other related factors are called nodes, each of which is independent but also connected through cooperative contracts and material flows. The connection modes between the nodes are known as a cooperative mode, a competitive mode and a cooperative-competitive mode. The SCN can achieve overall optimal benefit and minimum environmental impacts by balancing resources and energy and integrating production and the market. As there are multiple core enterprises in the SCN, integration and cooperation between the nodes is extremely important. Stable, reliable coordination among the nodes is the most important feature of SCNs, for which codecisions, information sharing, fair competition and benefit equilibrium are the key factors for overall SCN collaborations and optimal performances. SCN coordination evaluation models, therefore, are significantly different to those of a SC.

2.2. SCN Coordinated Evaluation Models

Previous studies have shown that partnership diagnoses, reliability analyses and risk identification and assessment are important for general SCN collaborative evaluations. For the coal chemical industry, correlation, conditionality and an atomic economy are the main differences from other industries; therefore, the coal industry supply chain network should be studied from the atomic levels to the system levels to meet the evaluative collaborative needs. In this thesis, the evaluation models for SCN was built based on the three-hierarchized process mechanism models and management models for chemical processes, shown as Figure 3, which include dynamic process simulation models, process control models, technical and economic evaluation and decision-making models.

2.2.1. Models for SCN Industrial Metabolic Balance

Resource recycling and environmental protection, which are directly related to long-term industrial development, are important targets for the energy industry. Industrial metabolism made up of product metabolism and waste metabolism is therefore proposed to assess the environmental impacts of the material and energy flows during the manufacturing process [41,42]. Product metabolism focuses on the production chain to realize its value conversion, while waste metabolism focuses on the waste chain, in which the manufacturing process waste from one process becomes the raw materials for another process for conversion into another product, thereby extending the waste chain and converting waste into valuable materials, improving gains in the production chain. In the coal chemical industry, maintaining the balance between production metabolism and waste metabolism is critical for SCN collaboration [43]. In this study, the SCN industrial metabolic balance was achieved using an effective chemical element utilization rate. The relationship between the material flows is shown in Figure 4.
For element i, the industrial metabolic balance for subsupply chain j is expressed in Formula (1):
E i j = 1 ( w i j + P i j × η p i j + B i j × η B i j ) R i j V i j
where Eij is the industrial metabolic balance for subsupply chain j expressed by element i; Vij is the inflow of the component; Pij, Bij and Wij are respectively the product flow, the by-products and the wastes; ηPij and ηBij are the product waste rate and the by-products after consumption and Rij is the recycled quantity.
The multiple subsupply chains are related to element i in the SCN (j = 1, 2…, n). The SCN comprehensive industry metabolic balance represented by element i can be expressed by Formula (2):
E i = j = 1 n E i j
Analyzing Equation (1), Ei could be increased by reducing Bij, Wij, ηPij and ηBij. Increasing Rij is also an important alternative. In this way, a more complete industrial chain can be established, within which more waste is recycled, thereby improving the collaboration between the upstream industry and the downstream industry.

2.2.2. SCN Evaluation Models for Sustainable Profitability

SCN stability depends on the sustainable development and profitability of the enterprises inside the network. If a single enterprise in the SCN falls into difficulty, or its collaboration with other enterprises fails, the overall SCN industrial metabolic balance reduces, affecting supply chain development. Therefore, sustainable profitability is one of the main goals for supply chain network construction and also the main evaluation indicator. As is known, enterprise sustainability requires the integration of decision-making abilities, organizing abilities, execution abilities, partner collaborative abilities and innovation abilities, amongst others. Using cluster analysis and canonical correlation methods, Liu verified the relationships between enterprise operating ability and profitability and development [44]. To address the profitability and sustainability compromise, coal chemistry enterprises need to strengthen their core technical abilities to achieve the goals of structural industrial optimization, energy conservation and environmental protection and recycling. As the key to coal chemical industry profitability, the main focus needs to be on achieving atomic level equilibrium by focusing on the atomic economy within the supply chain network through supply chain network assimilation and node enterprise coordination. Therefore, the evaluation indexes for the supply chain network, such as profitability, development ability and the collaborative degree, must be based on the industrial metabolic balance. The related evaluation models are established in the following.
(1). 
Development Ability Evaluation Models
The economic status of a single enterprise can be assessed from its operating revenue, profit, growth trends, total assets, net asset value, debt-paying ability and cash flow. The sustainable development capacity can be assessed through the degree of product differentiation, human resources and R&D input [45]. The comprehensive SCN development ability evaluation model, therefore, can be expressed by Equation (3):
Fa = f(m, e, o, k, g)
where Fa is the SCN development ability index and; m, e, o, k, and g are customer relationships, decision-making capacity, operating superiority, supply network support and financial profitability of the SCN enterprises, respectively. As SCN enterprises may belong to different areas, function f is established based on actual operating data. In the following case study, a GA-BP was used to establish the model.
(2). 
Industrial Collaboration Degree Evaluation
As enterprises in the industrial chain have deterministic interconnections, the flexible operation under the uncertain conditions is the key to achieve industrial collaboration [46], there are some limitation to operating flexibility. The greater the enterprise’s industrial collaboration, the greater the SCN restriction. From the perspective of industrial metabolism balance, its operation-feasible values range of θ decides the size of flexible region of coal chemical process. The SCN industry collaboration degree evaluation model is shown in Equation (4):
Fb = f(c, v, r, s, p, fi)
min θ T ( δ ) max i I f i ( d ¯ , z ¯ , θ ) 0
T ( δ ) = { θ | θ i N δ i Δ θ i θ i θ i N + δ i Δ θ i + }
where Fb is the SCN industry collaboration index, c, v, r, s and p are: the conformity between product and service, customer viscosity, delivery reliability, business flexibility, and client satisfaction, respectively. fi is the constraint condition of node i which integrates objective parameters, operating parameters and industrial metabolic balance. i presents the node i. Equation (5) presents the minimum operating region for all nodes under the certain metabolic balance. d   ¯ is the vector of design business objectives described by Equation (3) and z ¯ , is the vector of actual operation variables. θ is the industrial metabolic balance among the SCN enterprises. T(δ) presented in Formula (6) is the hyper-rectangle describing the range of operation-feasible θ. θ i N is the nominal point of node i, Δ θ i + , Δ θ i are the corresponding positive and negative deviations, δ is the scalar parameter mainly based on actual operations, respectively. I is the set of all nodes.
For a conventional chemical process, the adjustment strategies of z ¯ should meet the requirements of the certain range of hyper-rectangle considering the node plant only. While in the SCN, the coordination of multinodes is subject to the more rigorous ranges of θ, and so the adjustable regions of z   ¯ is smaller.
(3). 
Sustainable Profitability Evaluation
SCN sustainable profitability is evaluated based on development ability and collaboration, which is expressed by Equation (7)
F = f (Fai, Fbi) (i = 1, 2, …, n)
where Fai is the development ability index for enterprise i, Fbi is the industrial collaboration degree index for enterprise i. Fi is the profitability index of enterprise i, and F is the aggregative indicator for overall SCN profitability. To evaluate F, the following aspects are considered:
For F, the SCN industrial metabolic balances are both restraints and influential factors.
Business integration could improve customer viscosity and delivery reliability but could also restrict SCN business flexibility; therefore, the industrial correlative degree models are both goal functions and constraints.
Market demand and resource supply stability as well as competition with enterprises outside the SCN are all influential factors [47].
As product price is an important factor when evaluating enterprise competitiveness in fully competitive conditions, it needs to be compared with the price and manufacturing costs of competing products; therefore, as the manufacturing costs in competing industries are also an important comparative index, oil, natural gas and shale gas prices can substantially influence coal industry operations.

2.2.3. Evaluation of Enterprise Contract Execution Ability

SCN enterprise operations must be consistent with interests across the whole SCN, and must also meet shareholder profit expectations [48]. However, these two demands may conflict and even threaten normal SCN operations. Therefore, an enterprise’s ability to execute contracts needs to be analyzed as an enterprise’s profitability is the most important influential factor when implementing contracts. The model for an enterprise’s ability to execute contracts can be expressed as:
P n i = F i max { F t | t = 1 ,   2 ,     ,   n }
where Pni is the contract execution ability of enterprise i facing n competitors and Fi is the profitability index for enterprise i. The denominator in (6) is the maximum profitability of n related member enterprises both inside and outside the SCN, for which Pni equals 1 when enterprise i has maximum profitability. The ability to execute contracts in the overall SCN is expressed as Pn, the value for which depends on the relationship between the node enterprises. The fundamental SCN structures are cooperative mode, competitive mode and hybrid cooperative-competitive mode, as shown in Figure 5.
The Pn for the cooperative structure in Figure 5a can be calculated using Equation (9):
P n = i = 1 n P n i
The Pn for the competitive structure in Figure 5b can be calculated using Equation (10):
P n = min { P n i | i = 1 ,   2 ,     ,   n }
The Pn for the cooperative-competitive structure in Figure 5c can be calculated using Equation (11):
P n = P n a × ( min { P n b 1 ,   P n b 2 ,   P n b 3 } ) × P n c × P n d
where Pna, Pnb1, Pnb2, Pnb3, Pnc, Pnd, are the contract execution ability indicators of the node enterprises a, b1, b2, b3, c, d, respectively, when facing n competitors.
As an enterprise’s profitability changes with the operating environment and each enterprise’s situation, the ability to execute SCN contracts has dynamic attributes.

2.2.4. SCN Information Interactive Ability

Research has shown that information interactivity is very important for successful supply chain integration [48,49,50,51]. With the increasing integration of digital networks and physical entities, a new type of network, shown as Figure 6, was proposed, which connects information, resources, entities and human beings, supports the automatic delivery of information to the SCN production elements and promotes SCN integration and optimization throughout the complete lifecycle. This structure integrates the information into networks using cloud computing and emphasizes collaboration between the information network system and the physical system.
In summary, SCN collaborative evaluation is useful for sophisticated planning and operations management as by evaluating the SCN collaboration level, enterprises seeking to enter an industrial park can be carefully selected in the planning phase. Additionally, dynamic collaborative evaluations conducted during operations can detect and eliminate risks.

3. Coal Industry SCN Evaluation Models

Taking the coal industry as shown in Figure 2 as an example, the SCN model was established as in Figure 7, in which the petrochemical industry is the system competitor. The coal industry SCN was analyzed based on the methods outlined in Section 2.

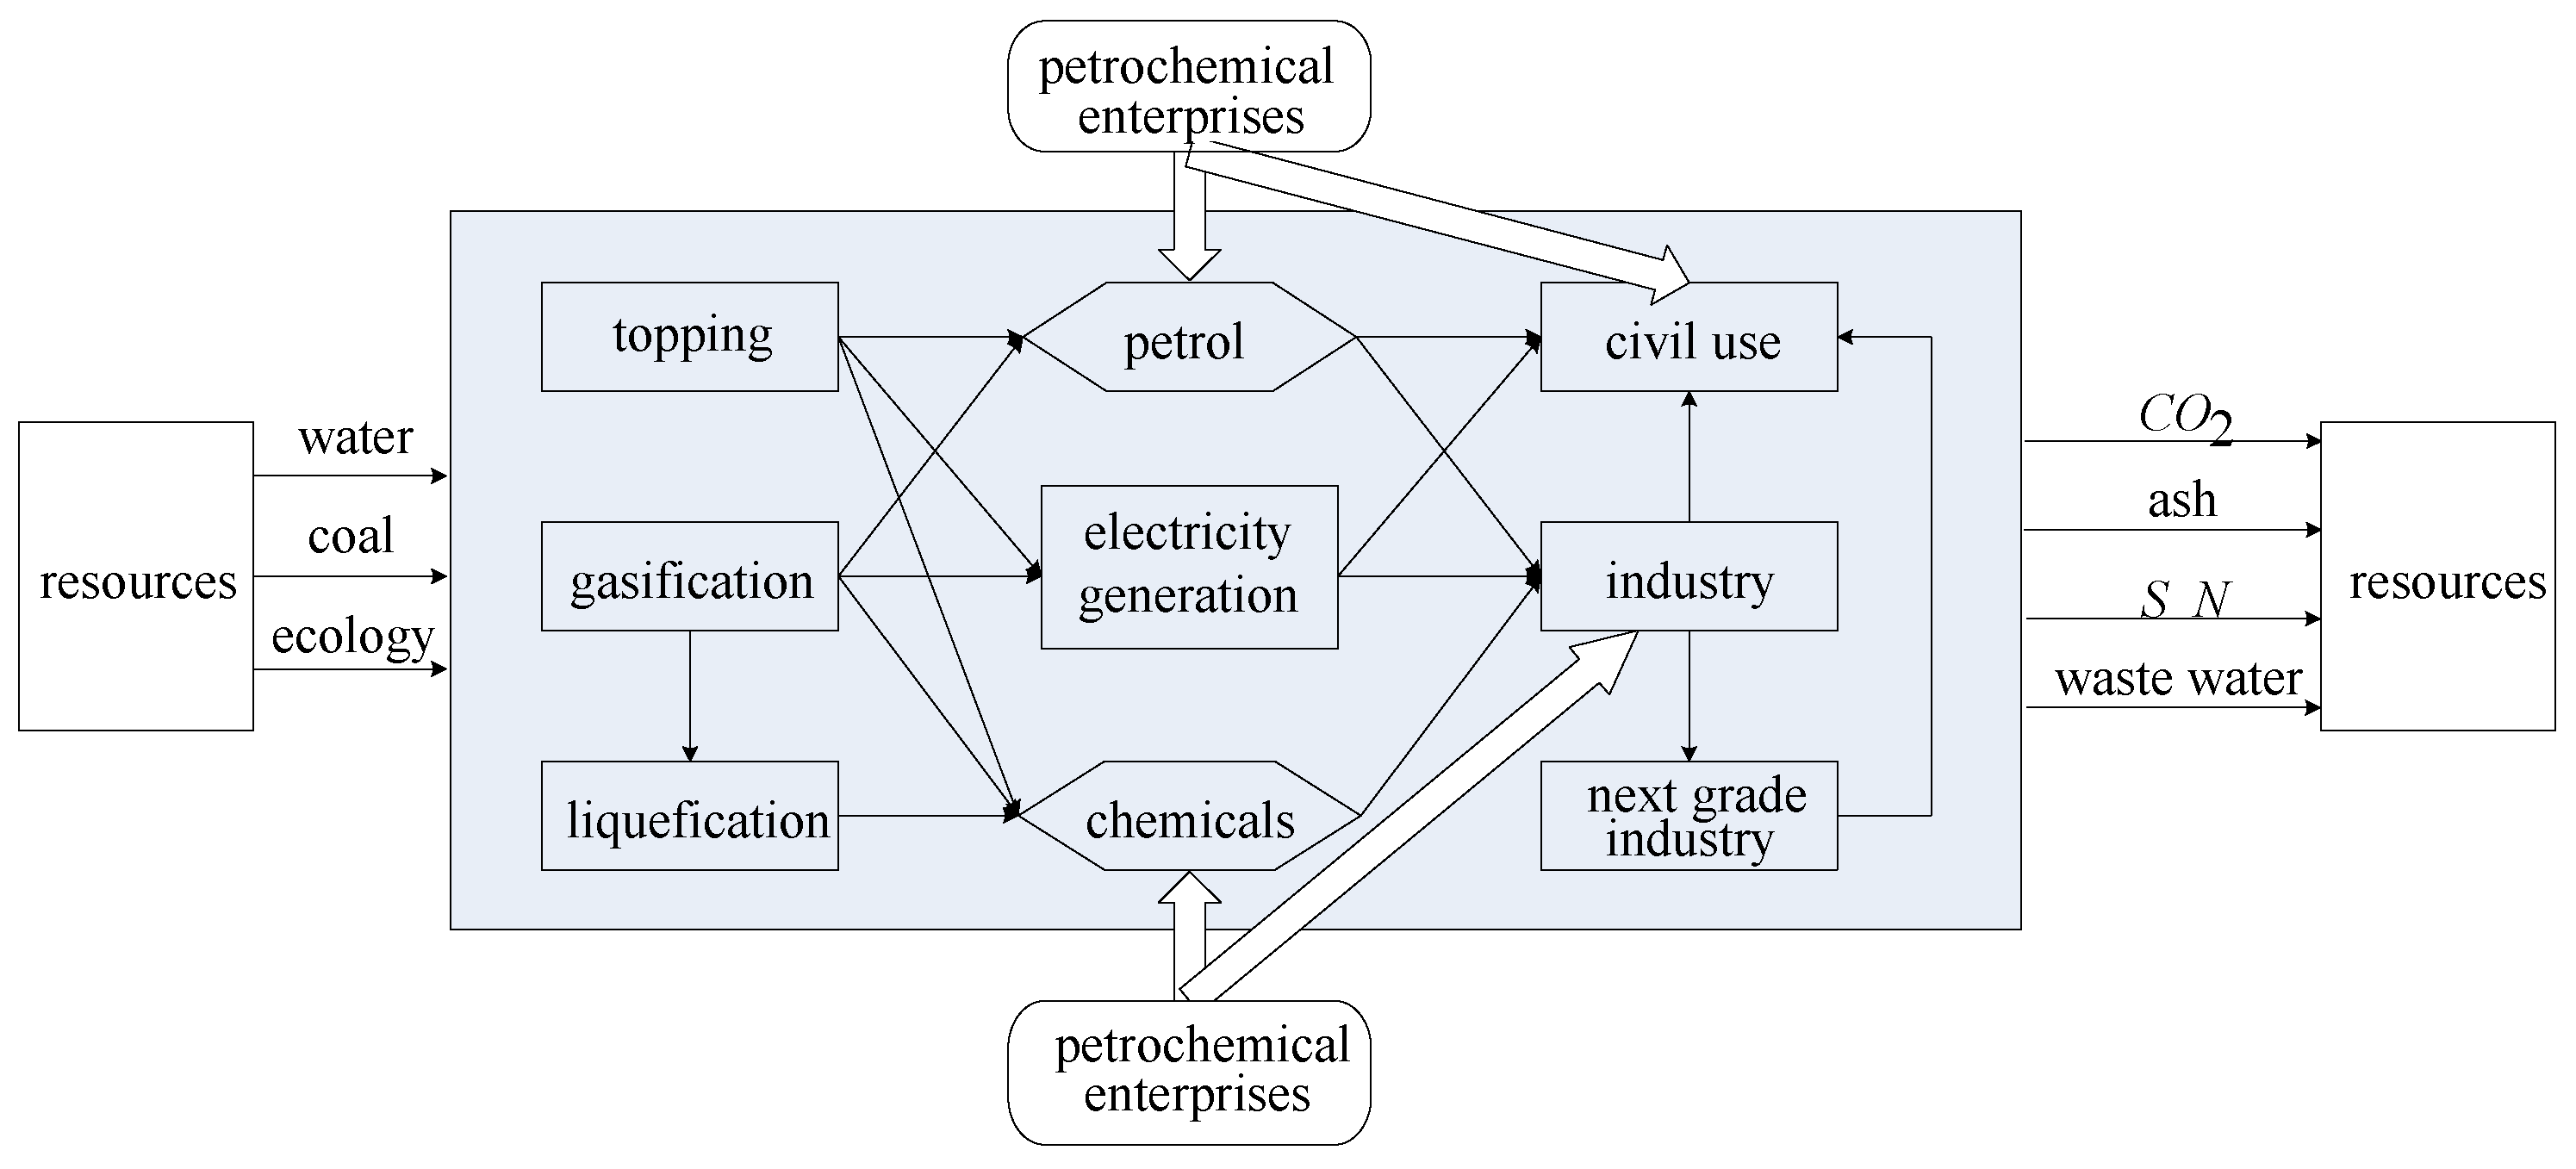
3.1. Industry Metabolic Balance Analysis

On the basis of the coal industry product structure, technical routes and equipment operating conditions, dioxide emissions are selected to evaluate the industry metabolic balance. As CO2 comes mainly from the utilization of fossil energy [52], CO2 emissions are considered to be a strong correlation index for coal industry industrial metabolic balance. For data accuracy and the necessity to reflect the carbon balance across the whole industry, China, Japan and America were taken as examples to calculate the results using Equation (1) (Table 1).
In Table 1, the carbon industry metabolism in China is lower than in either America or Japan because China’s low-carbon technologies need further improvements and China’s energy sector is characterized by abundant coal and less oil, resulting in greater CO2 emissions.
The carbon industry metabolic balance can be improved by strengthening the carbon utility inside the SCN. Xie developed a new method for carbon capture and utilities (CCU) to reduce CO2 emissions which focused on the S-based compound fertilizer being produced by mineralizing solid wastes phosphogypsum and CO2 [53]. The chemical reaction was as in Equations (12) and (13) with the magnesium chloride conversion rate being up to 100% under 600 °C.
MgCl2.6H2O→Mg(OH)2 + 4H2O + 2HCL
Mg(OH)2 + CO2→MgCO3 + H2O
Xie et al. found that about 0.125 billion tonnes of CO2 could be mineralized in China using 0.5 billion tons of phosphogypsum, thereby improving the carbon metabolic balance by about 13.5%. Therefore, if the SCN covers the element’s complete life cycle, the overall industry metabolic balance could be improved.

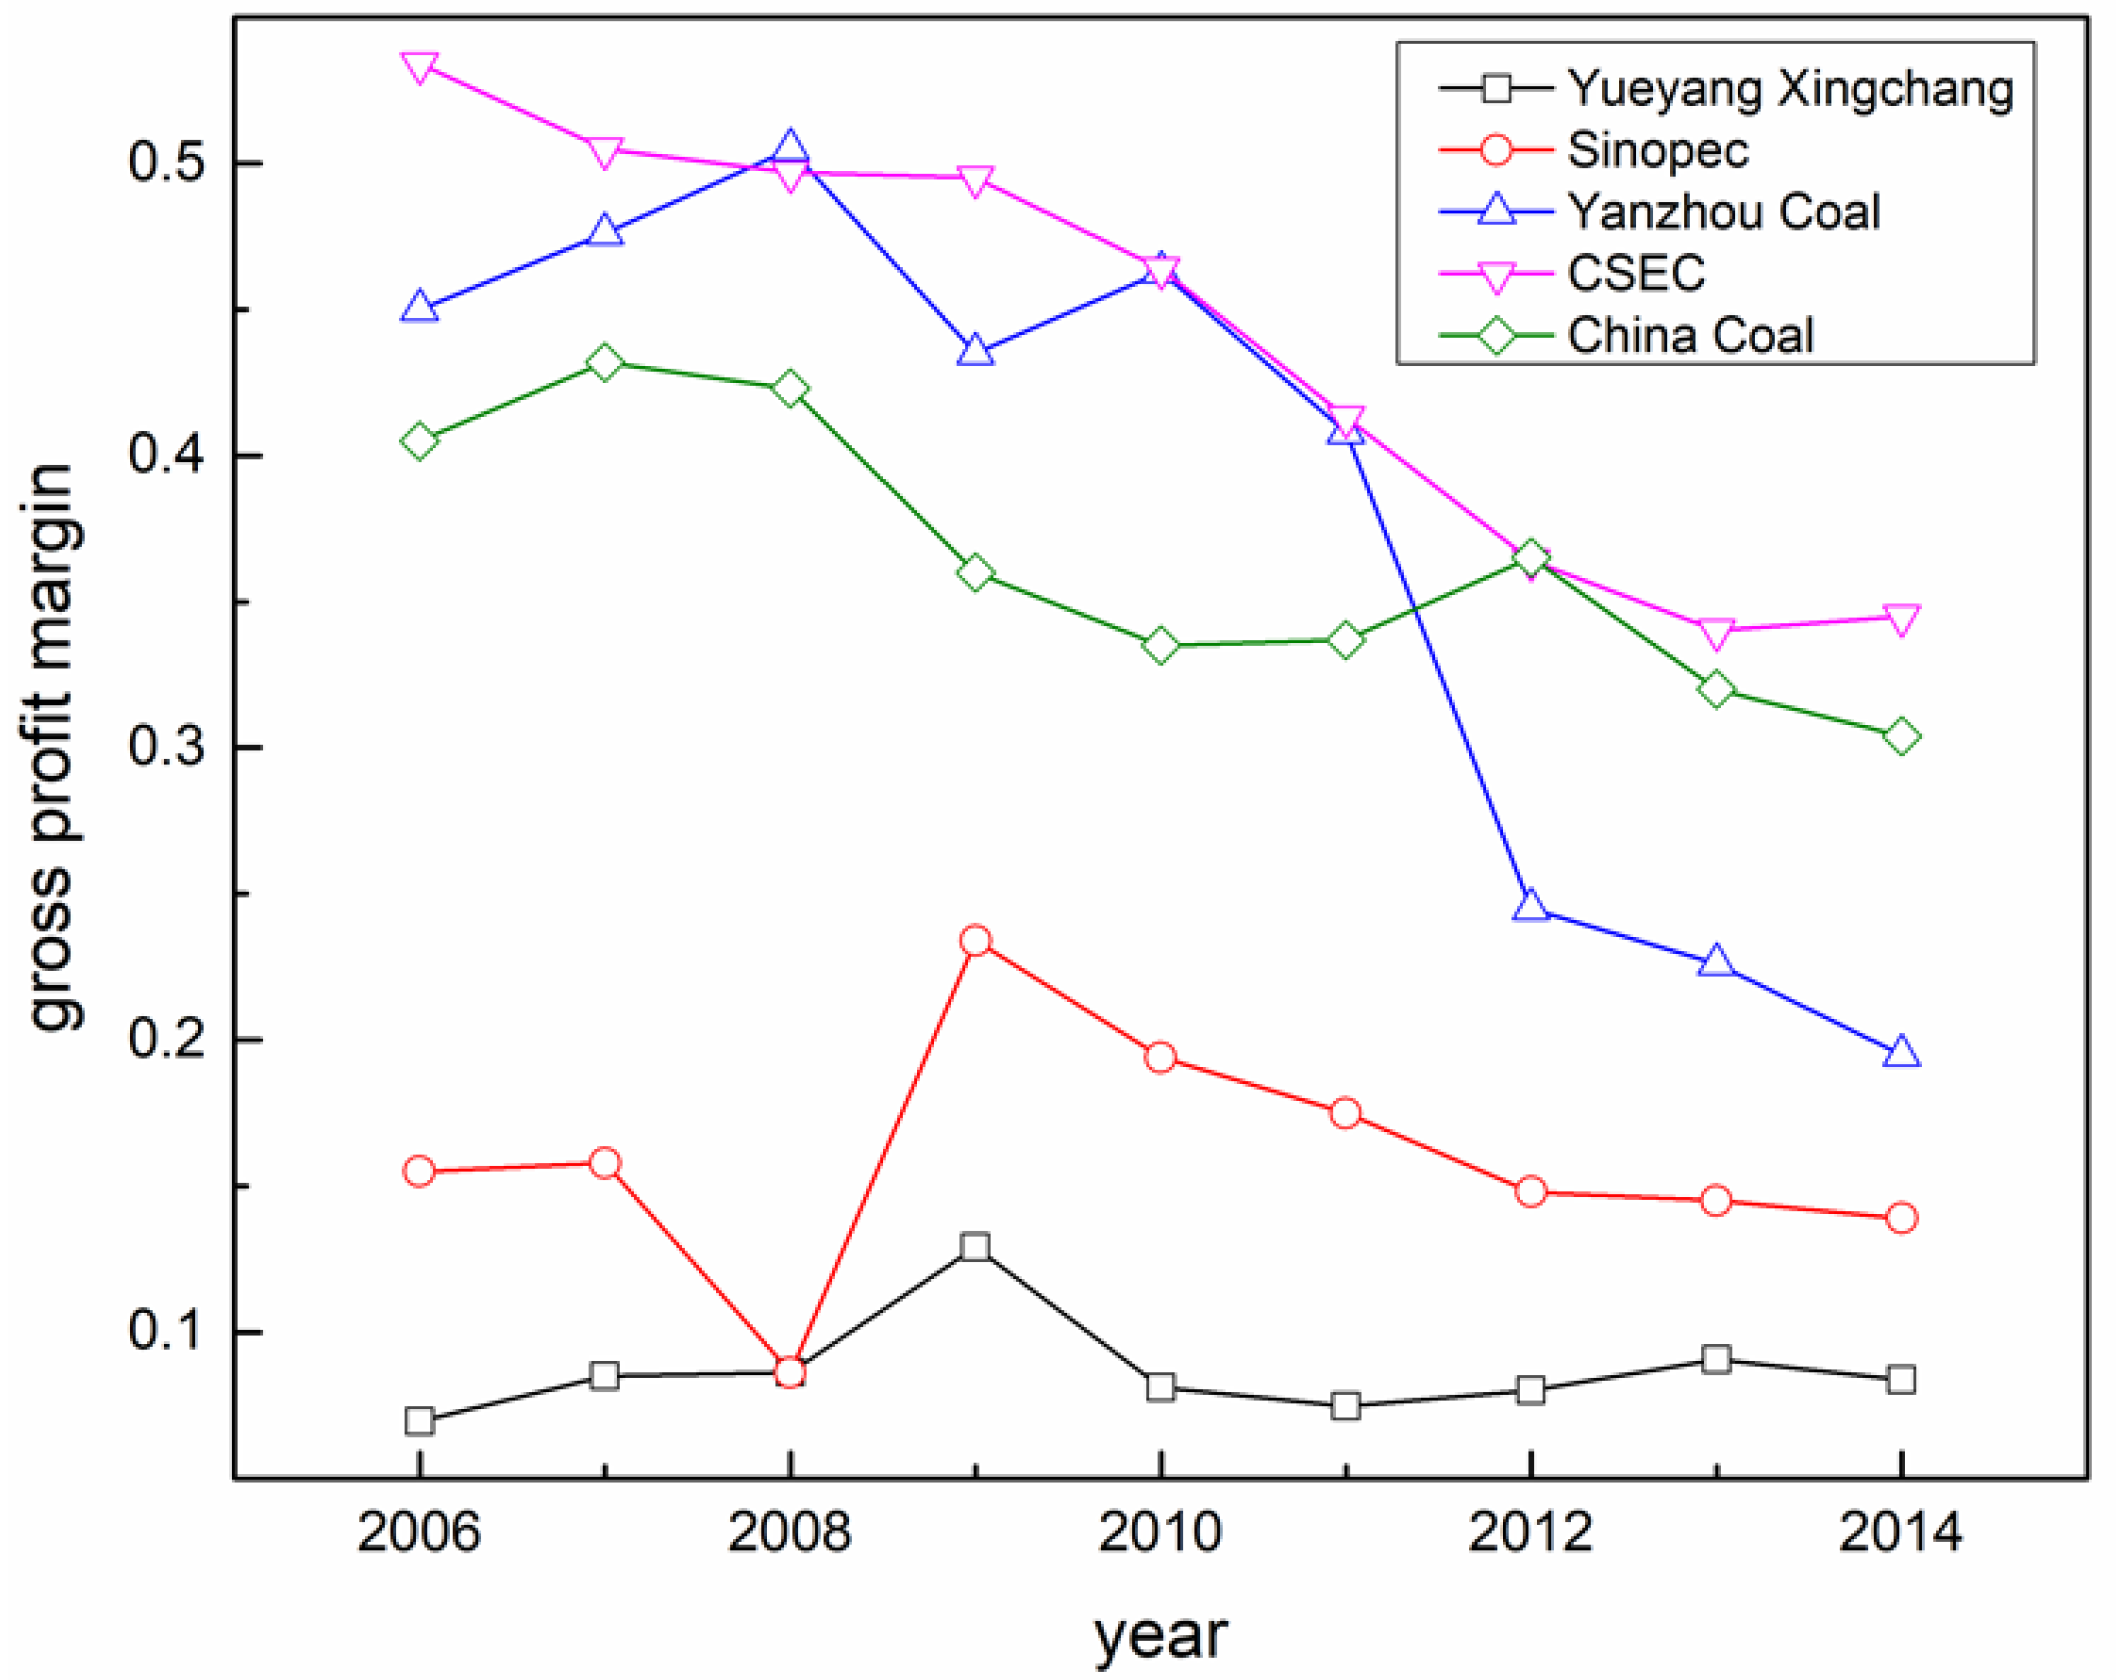
3.2. Enterprise Profitability Evaluation Based on Grey Relationship Analysis

Equations (3) and (4) constitute the framework for the SCN sustainable profitability models. When applied, concrete evaluation models are needed. Enterprise profitability models primarily focus on quantitative economic factors. The range of related evaluation indexes that reflect the various enterprise profitability aspects and have a different impact on overall profitability evaluations are listed in Table 2; therefore, a nonlinear time-varying coefficient factor model could be a viable alternative solution [54]. However, as the indices in Table 2 are not independent, the models based on these factors remain extremely complex; therefore, it is necessary to isolate the essential model inputs to establish a concise enterprise profitability evaluation model. Chang developed a hybrid model by integrating Self Organization Map (SOM) neural networks, Genetic Algorithms (GA) and a Fuzzy Rule Base (FRB) to forecast a company’s future sales [55]. Marquez created a list of attributes that together defined customer value, and then grouped customers who prioritized the same attributes, thereby improving decision-making and increasing sales, revenue and market share [56]. As a result of the multicriteria evaluations and complicated influencing factors facing the coal industry, the research in this paper used Grey relational analysis (GRA) to remove the lowly correlated, non-independent influencing factors.

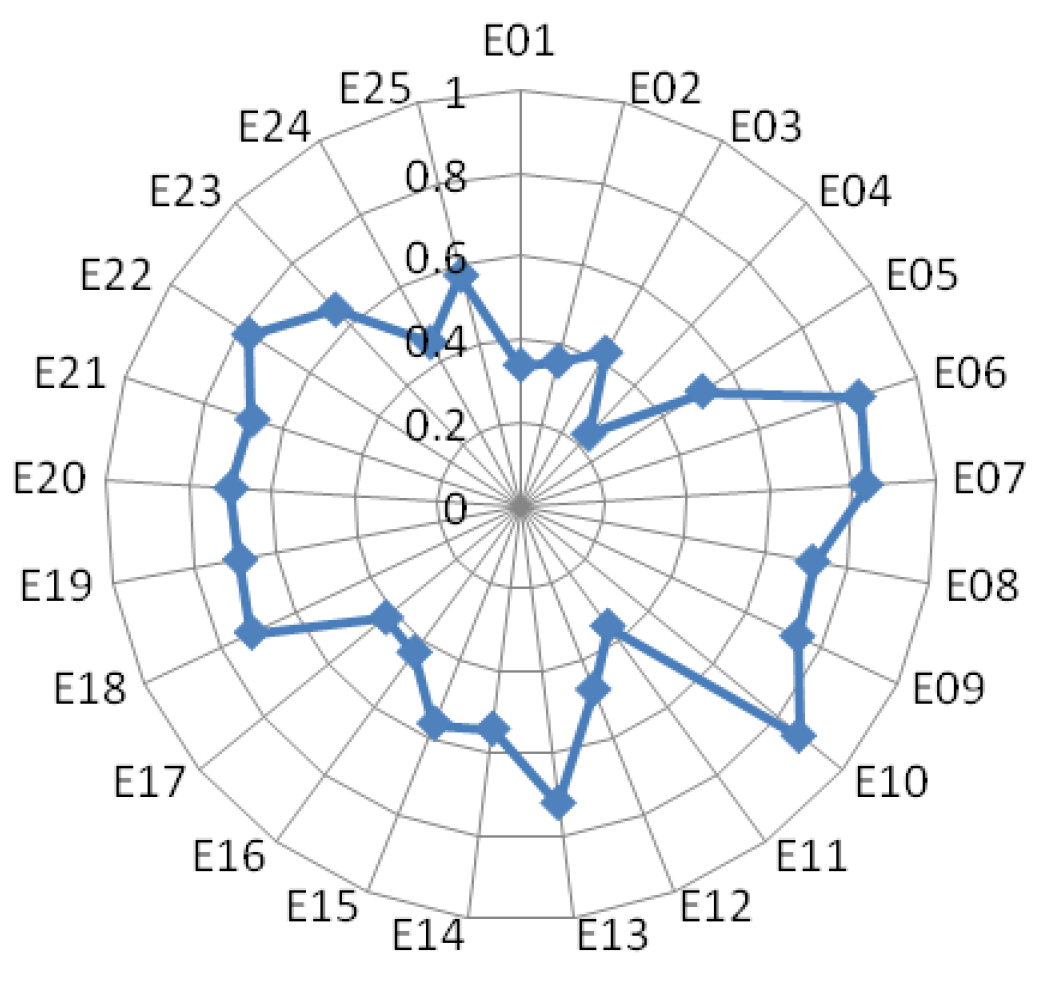
3.2.1. Grey Relational Analysis of the SCN Influencing Factors

As stated, as the enterprise evaluation indexes are complex and lack independence, diversified evaluation indicators was required. GRA is a feasible method to eliminate more weakly correlated factors [57] as it measures the relational degrees (IDs) between the different factors based on serial data similarity degrees. Factors which have a lower correlation degree than a certain discriminatory coefficient or a preset correlation degree could be regarded as being weakly correlated factors [58].
According to the GRA, the reference sequence that reflects SCN behavior and the comparative sequence affecting SCN behavior are first determined. The former is expressed as X 0 ( k ) , k = 1 , 2 , n , the latter is expressed as X i = { X i ( k ) | k = 1 , 2 , n } ,   i = 1 , 2 m . The data for each influential factor are processed using the mean value method and nondimensionalization and normalization. The correlation coefficient is defined as in Equation (14), which identifies the relationships between the influential factors and enterprise profitability.
ξ i ( k ) = min i min k | X 0 ( k ) X i ( k ) | + ρ max i max k | X 0 ( k ) X i ( k ) | | X 0 ( k ) X i ( k ) | + ρ max i max k | X 0 ( k ) X i ( k ) |
where ξ i ( k ) is the correlation coefficient, for which, the greater the value, the higher the correlation degree, and p. is the discrimination coefficient, which is usually set at 0.5.
Taking China Coal Energy (the Shanghai Stock Exchange, stock code 601898) as an example, the gross profit rate (GPR) was selected as the index for the reference sequence, and the 25 evaluation indexes in Table 2 are the indicators for the comparative sequence, the values for which were calculated based on financial statements. The GPR was calculated using Equation (15)
G P R = 100 ( T R     O C ) / T R   %
where TR is the total revenue and OC is the operating cost. According to Equation (12), ξ i ( k ) for the 25 comparative indices were calculated, and the results are presented in Figure 8. It was found that the values for ξ i ( E 06 ) , ξ i ( E 07 ) , ξ i ( E 10 ) were all larger than 0.8, indicating that they had a greater impact on the GPR than any other index. Research has shown that there is a competitive relationship between the coal industry and the petrochemical industry, with crude oil prices having a significant impact on coal industry profitability [59], which is in accordance with the calculated values for ξ i ( k ) .
Therefore, from the calculated values for ξ i ( k ) , E06, E07 and E10 were selected as the key factors for the establishment of the SCN profitability evaluation models. As it is difficult to establish a theoretical model between crude oil prices and coal industry profitability due to unstable and uncertain correlations, conventional regression models were unable to achieve an ideal correlation model.
To compensate for the drawbacks in traditional linear and nonlinear regression models, there has been increased attention on the use of artificial intelligence (AI) techniques such as artificial neural networks, fuzzy logic, genetic algorithms and hybrid models. In this study, hybrid genetic algorithms (GA) and a back-propagation artificial neural network were applied.

3.2.2. Profitability Model Based on the GA-BP

The back-propagation artificial neural network (BP-ANN) is a large-scale nonlinear dynamic system consisting of a number of interconnected simple nonlinear processing elements that have adjustable strength, the independent and dependent variables for which are respectively the input values and output values of the network. BP-ANN is good at dealing with unstructured and uncertain relationships; for example, an improved neural network algorithm has been used to establish performance evaluation models for a green supply chain in an uncertain environment [59].
Different from regression algorithms that use statistical regression to establish the mathematical relationship models between the causal variables, BP-ANN has various input nodes and one or several output nodes, which represent the mapping relationships between the independent and dependent variables. BP-ANN uses a gradient descent method and an error backpropagation algorithm to adjust the weights and thresholds on each layer to ensure the outputs are closer to expected values and to accelerate convergence. BP-ANN is therefore applied to build the enterprise profitability models, with the output nodes being the SCN evaluation indexes, and the input nodes being the influencing factors from the SCN evaluation models listed in Table 2. To eliminate interference and improve accuracy, the key factors identified by the GRA are selected as the input nodes, with the GPR as the output node.
As a random search method based on the biological evolution [60], genetic algorithms (GAs) have a remarkable ability to escape the local optima and find a global optimal solution that minimizes the differences between the actual and calculated values; therefore GAs have become increasingly popular for solving optimization problems [61,62]. As they use the survival of the fittest principle, GAs guide the search to the most promising areas in the stated space, accelerating the dynamic optimization process for the BP-ANN weights and thresholds [63]; therefore, in this study a GA and BP-ANN were combined to improve the models’ accuracy and convergence, the hybrid algorithm for which is shown in Figure 9.
To evaluate the accuracy of the model, the root-mean-square error (RMSE) and the R-square coefficient (R2) of the output were calculated (Yuan et al., 2014).
RMSE is used to measure the deviation between the simulated values and the true values, and is given by Equation (16).
R M S E = 1 N i = 1 N ( O i t i ) 2
R2 is a measure of how well the independent variables account for the measured dependent variable and is determined using Equation (17).
R 2 = 1 i = 1 N ( O i t i ) 2 i = 1 N ( O i ) 2
where ti is the true value of GPR, Oi is the simulated value and N is the total number of data points.
In this article, China Coal Energy (CCE, stock code: 601898), China Shenhua Energy Company Limited (CSEC, stock code: 601088) and Yanzhou Coal Mining Company Limited (YanzCoal, stock code: 600188) were selected as the research objects, with a time period ranging from the first quarter 2012 (2012Q1) to first quarter 2015 (2015Q1). Data from 2012Q1 to 2014Q2 were chosen as the BP-ANN training data, and data from 2014Q3 to 2015Q1 were selected as the test values. The BP-ANN simulated results are listed in Table 3. The RMSE was 0.0231 and the R2 was 0.998, indicating that there were deterministic relationships between the GPR and E06, E07, E10. As the influential factors for the coal industry GPR are complex, the above relationships are only reflections of certain situations under established technical and equipment conditions; however, whether these results have a wider adaptability range needs to be verified with additional samples. The average relative error was −2.32%. Figure 10 shows the relative errors in the GPR output values for the BP-ANN models in comparison to the real values, indicating that the BP-ANN-based enterprise profitability model is feasible, and proving that there are significant correlations between the coal chemical industry earning ability and crude oil prices, coal prices and coal output.
Figure 11 shows that the GPR value trends for the companies since 2006 were decreasing year on year, which was primarily due to overcapacity in China’s coal chemical industry. The GPR for CCE and CESC are better than for YanzCoal, indicating a more stable profit-earning ability. The two petrochemical companies, coming from more competitive industries, (Sinopec and Yueyang Xingchang Petro-chemical Co. Ltd., Yueyang, China) have a more stable GPR because of better SCN integration. It could be concluded, therefore, that to achieve sustainable profitability, the coal chemical industry should have strong capital integration with the petrochemical industry to improve industrial SCN integration and financial profit-earning and to increase the ability to combat risks.
In summary, crude oil and coal prices are significant influential factors for enterprise profitability in the coal chemical industry; with this in mind, the profitability evaluation models could be simplified to Equation (18).
P i = f ( P c o a l ,   P o i l ,   Q c o a l )
where Pi is the contract execution ability indicator of node enterprise i in facing the competitors, Pcoal is the coal price, Poil is the crude oil price and Qcoal is the coal output.

3.3. Contract Execution Ability Evaluation

To analyze SCN contract execution ability, the contracts need to truncate the network chain into its basic relationship structure through the selection of the core enterprise nodes to develop an independent sub-network. The SCN chains shown in Figure 7 are truncated, with gasoline, diesel oil and olefin being the core nodes, as shown in Figure 12:
The execution contract abilities of mode (a) Pertrol subnetworks of coal SCN and (b) Chemicals subnetworks of coal SCN can be calculated using Equations (19) and (20):
P t a = P c × ( min { P b ,   P g ,   Q o } ) × P p o
P t b = P c × ( min { P b ,   P g × P l ,   Q o } ) × P p c
The comprehensive SCN contract execution ability is
P = max { P t k | k = 1 ,   2 ,     ,   n }
where Pc is the contract execution ability index for the coal supply node, Pb is the contract execution ability index for the light fraction separation node, Pg is the contract execution ability index for the gasification node, Pl is the contract execution ability index for the liquefaction node, Po is the contract execution ability index for the petrochemical process node, Ppc is the contract execution ability index for the chemicals node, Pta and Ptb are the contract executions in subnetworks (a) and (b) as shown in Figure 12, respectively, Ptk is the contract execution in subnetwork k, k is 1, 2…, n, with n being the maximum number of independent SCN subnetworks, and P is the complete overall SCN contract execution.

3.4. Information Interactive Ability Evaluation

The information interactive ability can be evaluated using investment intensity and the information project business scopes. In this paper, the SCN information interactive ability was calculated using Equation (22):
I n = i = 1 n I i R i n
where Ii is the information project investment intensity for enterprise i, Ri is the revenue from enterprise i and n is the number of the SCN enterprises. From Equation (20), the investment intensity of CCE is 0.25%, and that of YanzCoal and CSEC are 0.16% and 0.19%, respectively. From these results, it could be surmised that lower investment intensity is one of the reasons that YanzCoal has a lower GPR. The qualitative evaluation indexes listed in Table 4 are proposed to evaluate the information interactive ability which can be analyzed using the Delphi method.
Combined with the model and method proposed in this paper, the following experiences can be applied: (1) Comprehensively use oil, natural gas, clean energy, etc., and constantly optimize the energy structure; (2) formulate scientific and reasonable countermeasures, adopt advanced technology, continuously improve the quality of coal, realize energy conservation and emission reduction, and meet the green and sustainable development; (3) accelerate the development of advanced capacity, speed up the development of advanced capacity, provide adequate and stable supply of coal, and further accelerate the construction of the base of coal industry on the basis of the use of advanced technology and equipment, and combine the big data and Internet plus to make the coal industry develop towards the direction of information, intelligence and technology; (4) reorganize coal, steel, building materials and other related industries, give full play to the role of advantageous enterprises, develop and integrate all kinds of favorable resources, coordinate the relationship between upstream and downstream, cooperate with related industries, continuously extend the industrial chain and realize the intensive development of industries.

4. Conclusions

As it is difficult to evaluate the collaboration in coal industry supply chains using single-core supply chain models, a multinode, no-core, correlation, conditional SC mode, known as a supply chain network (SCN), was proposed, for which associated collaborative evaluation models were developed. Compared with previous SCN evaluation models, the models presented in this paper had the following features and advantages.
(1)
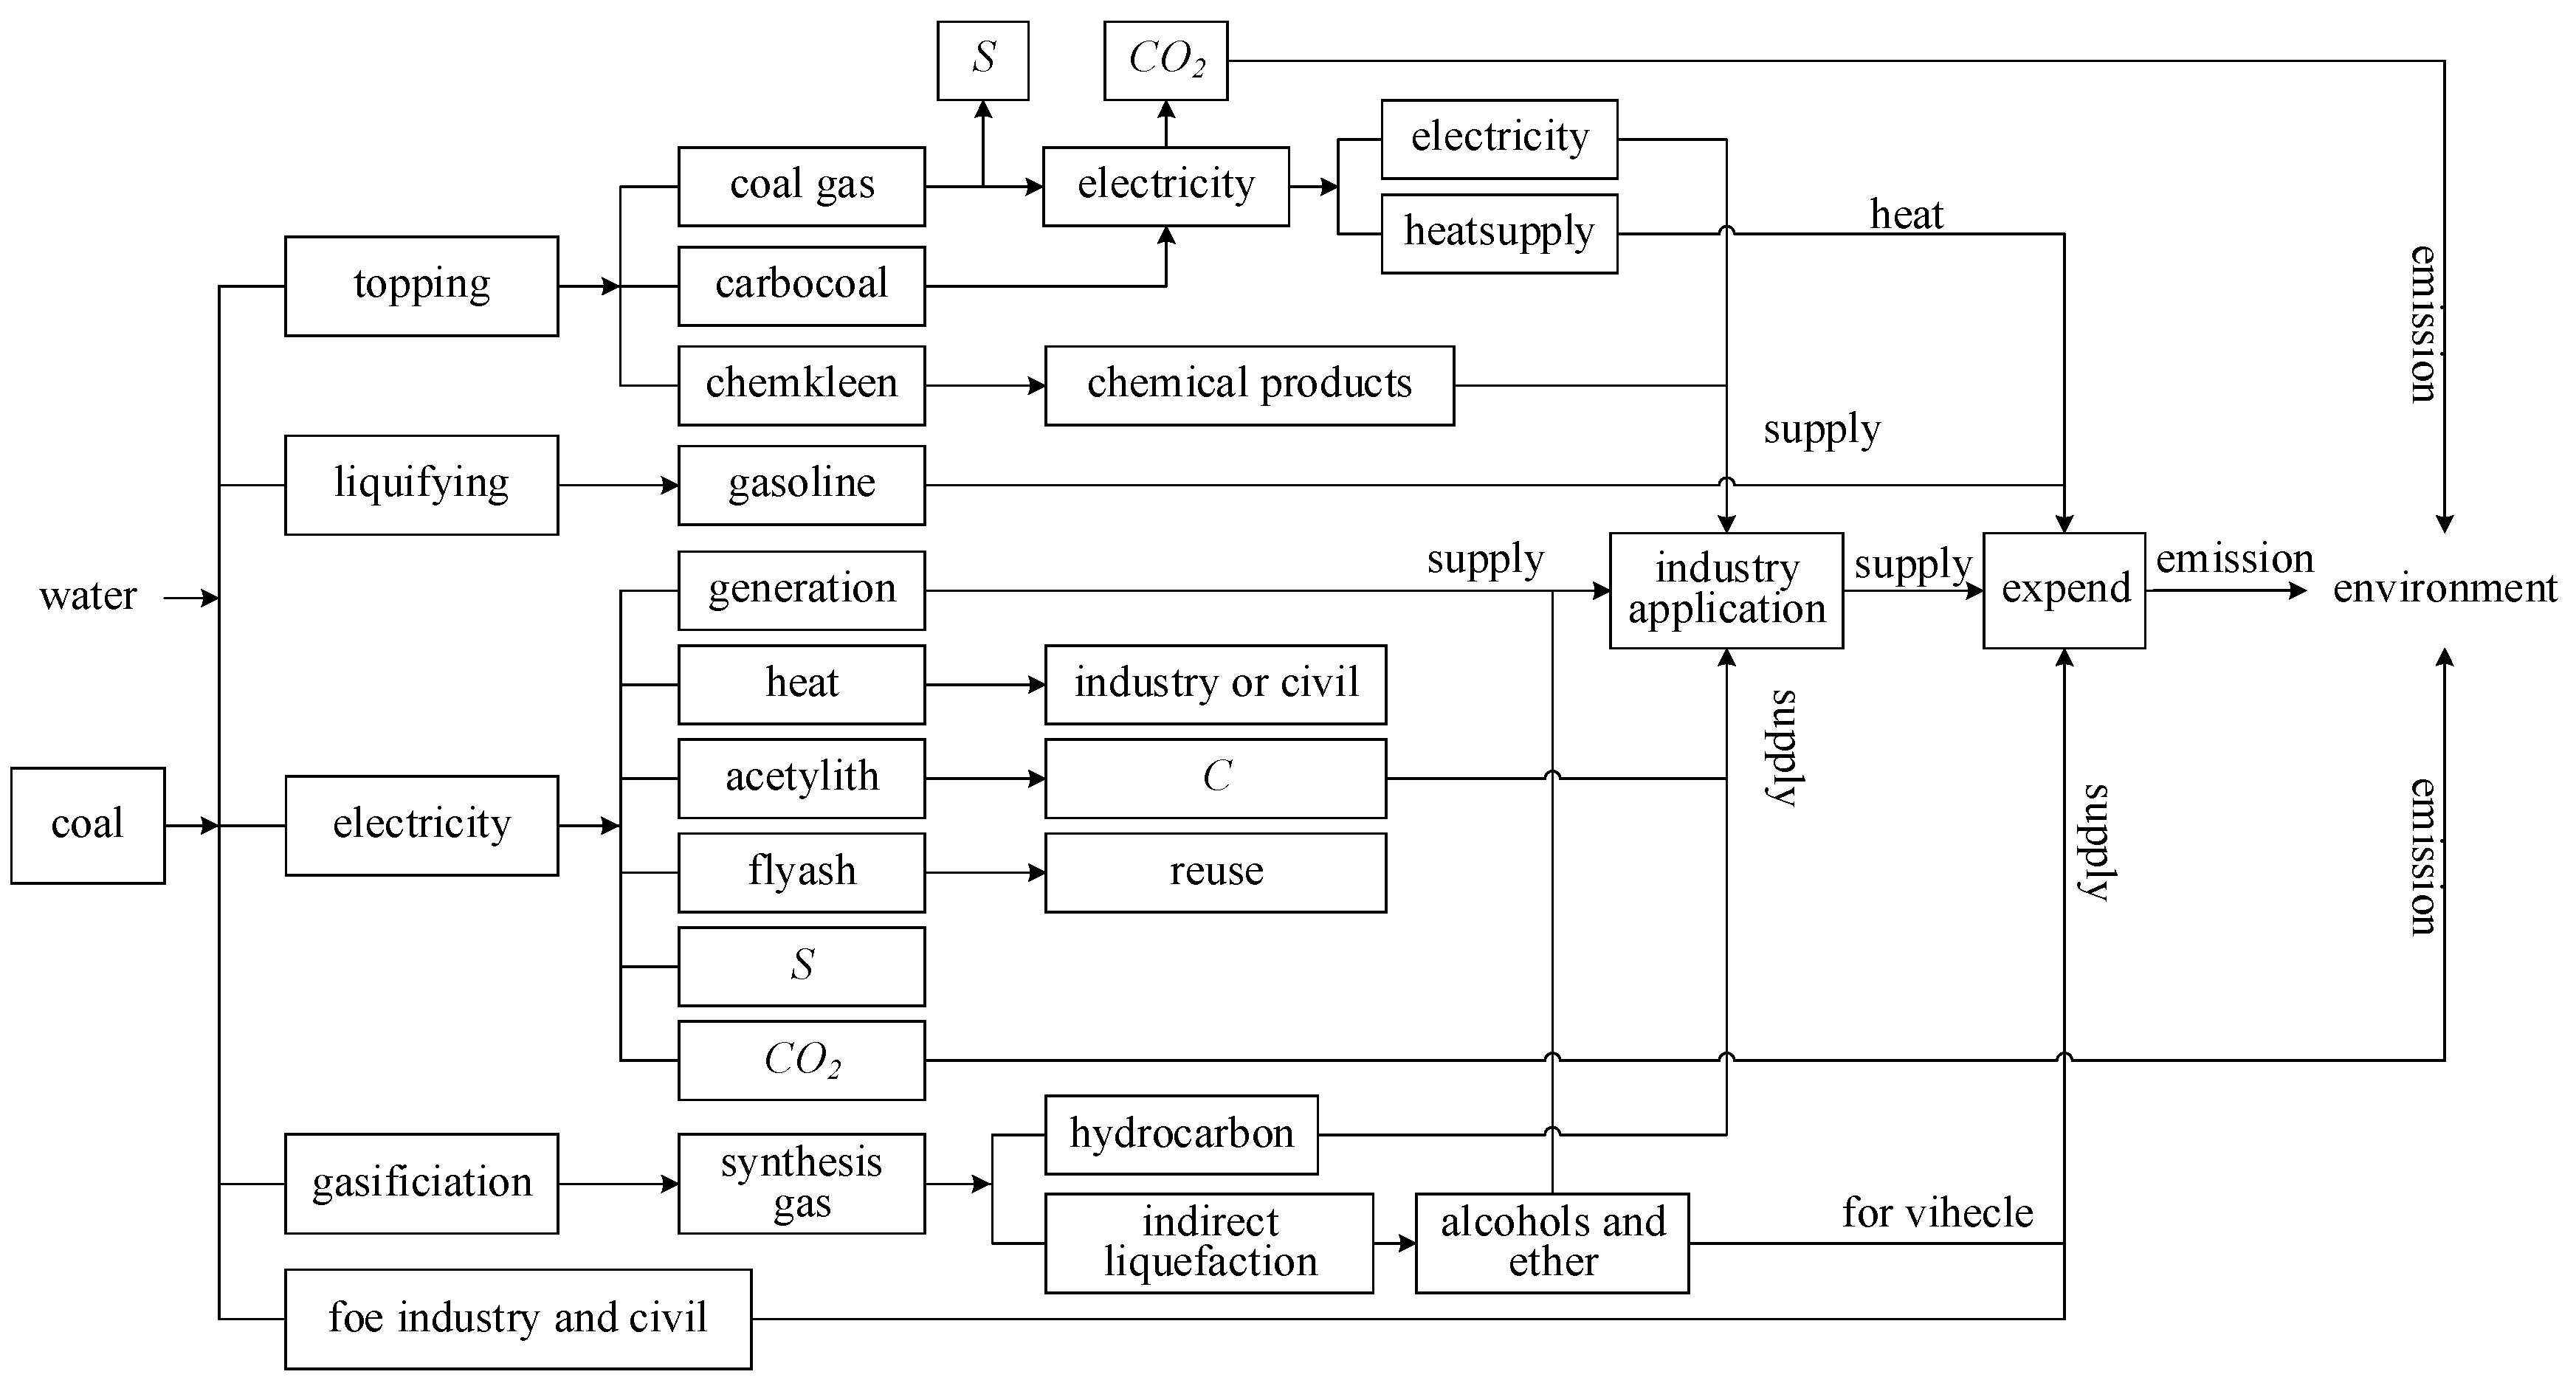
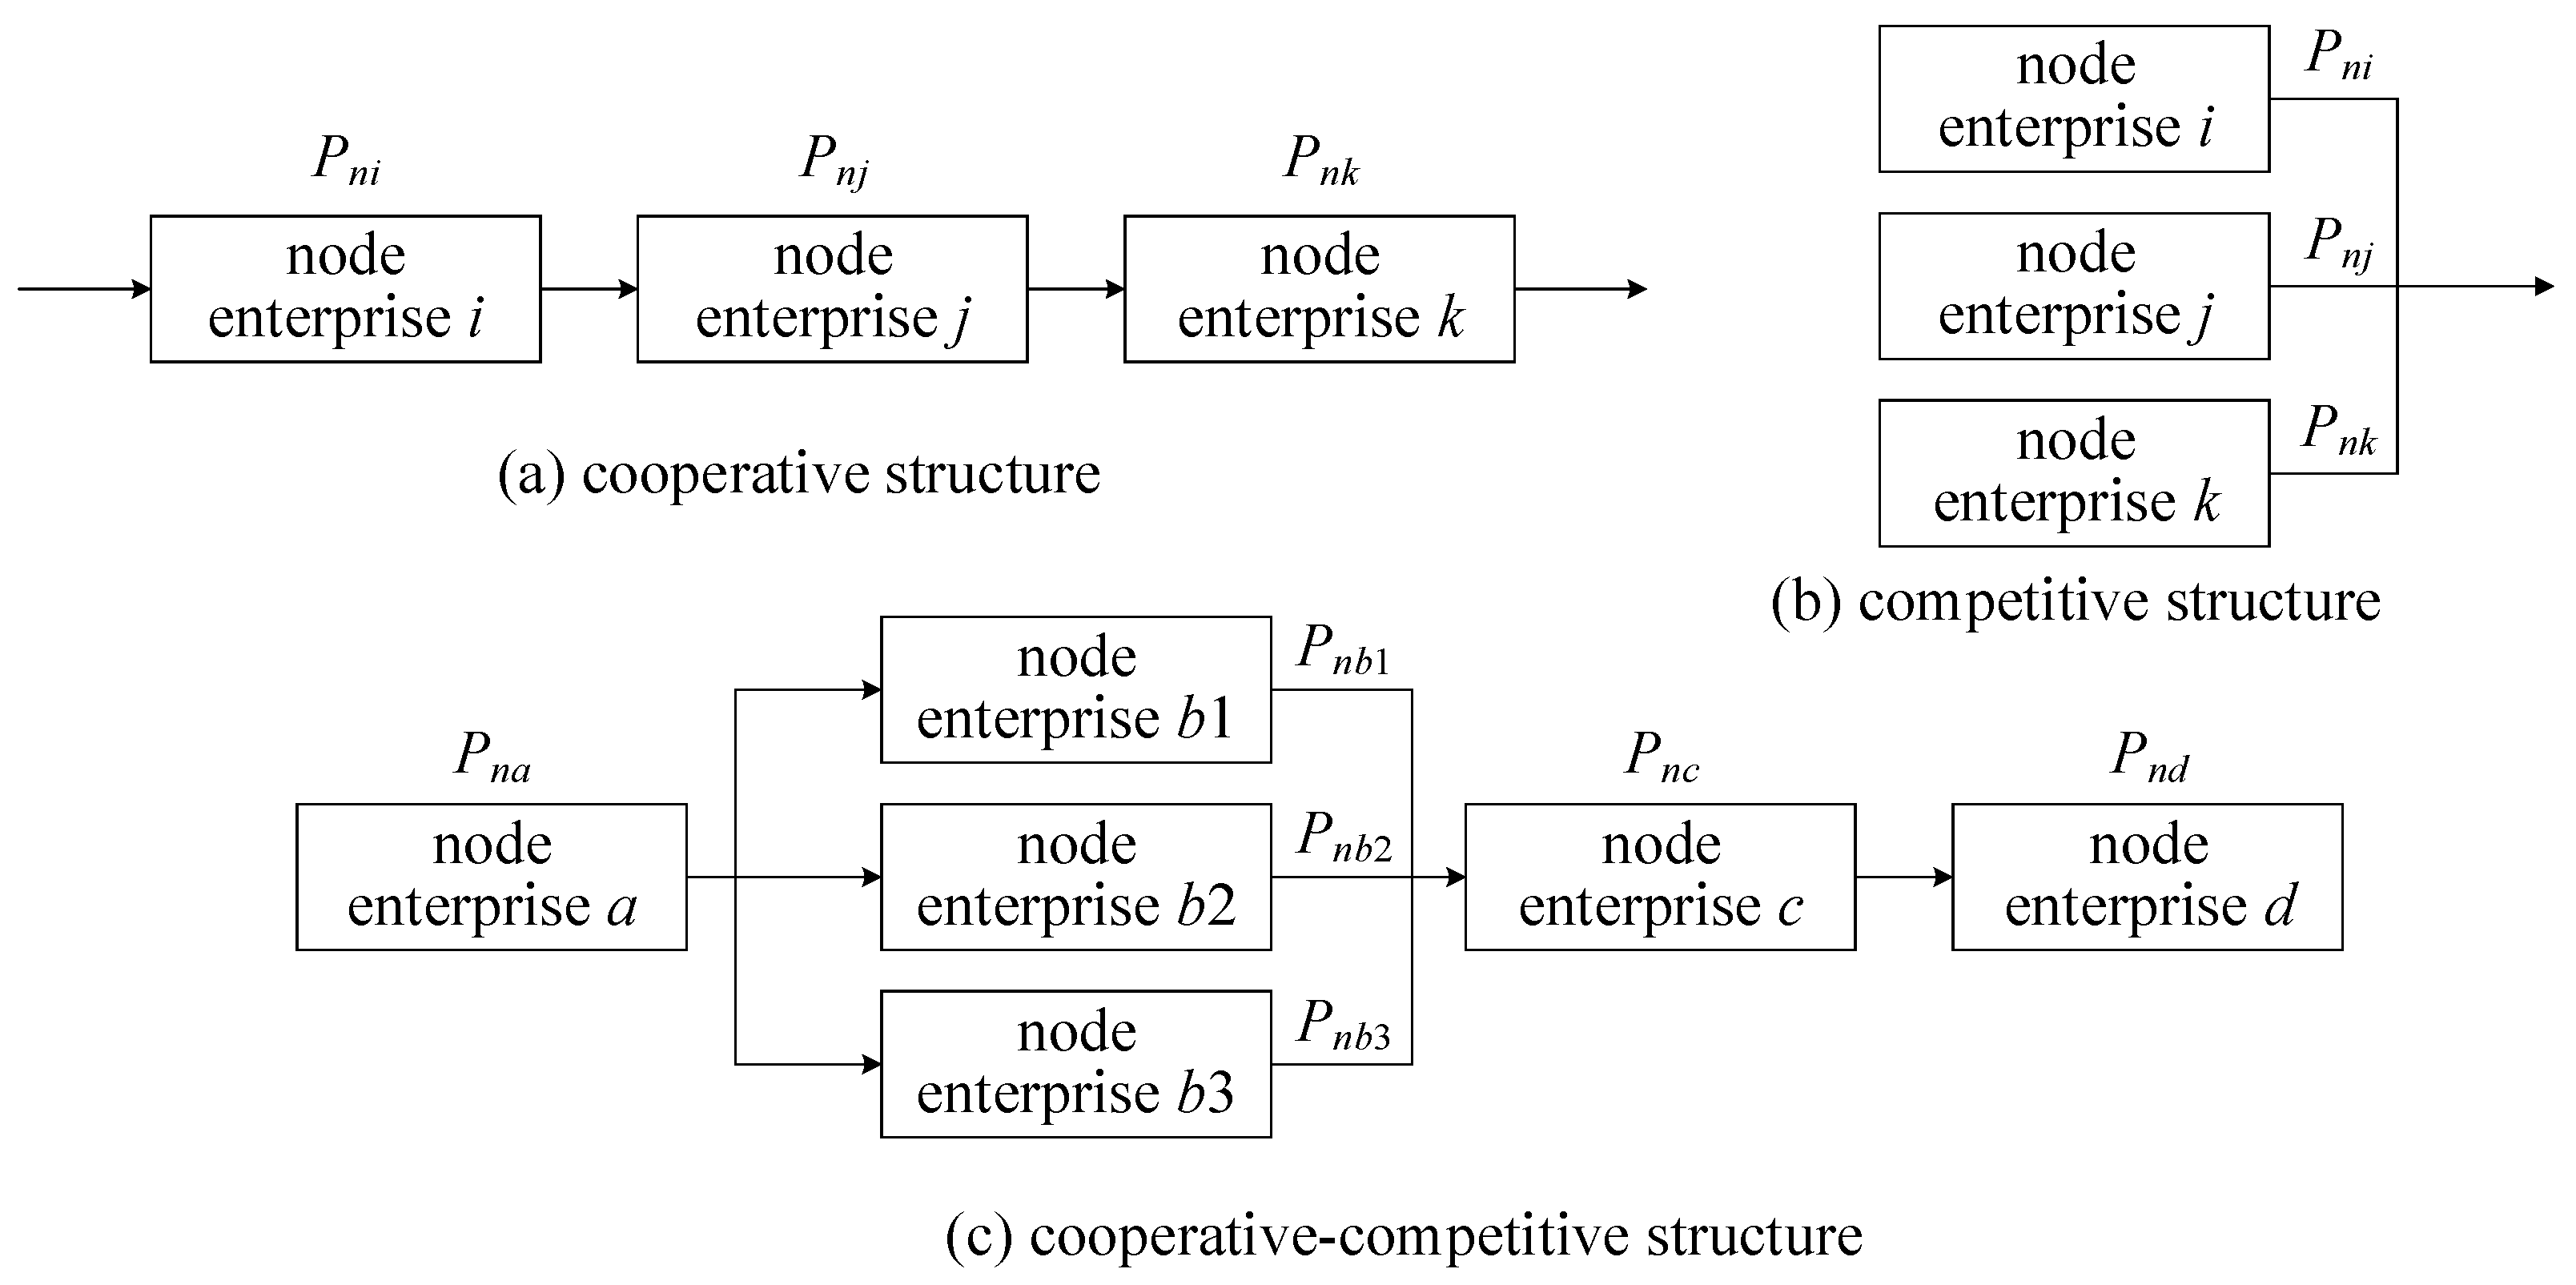
For thermodynamic equilibrium, material balances, and process conditions, coal chemical processes must have rigid constraints and strong collaboration between the supply chain node enterprises; therefore, the multinode, no-core, correlation condition supply chain network mode is more suitable compared to previous modes which primarily focus on material flows. Cooperative, competitive and cooperative–competitive SCN modes were discussed and examined. Through the above mode analysis, the more reasonable supply chain could be constituted, and the operational risks could be precontrolled.
(2)
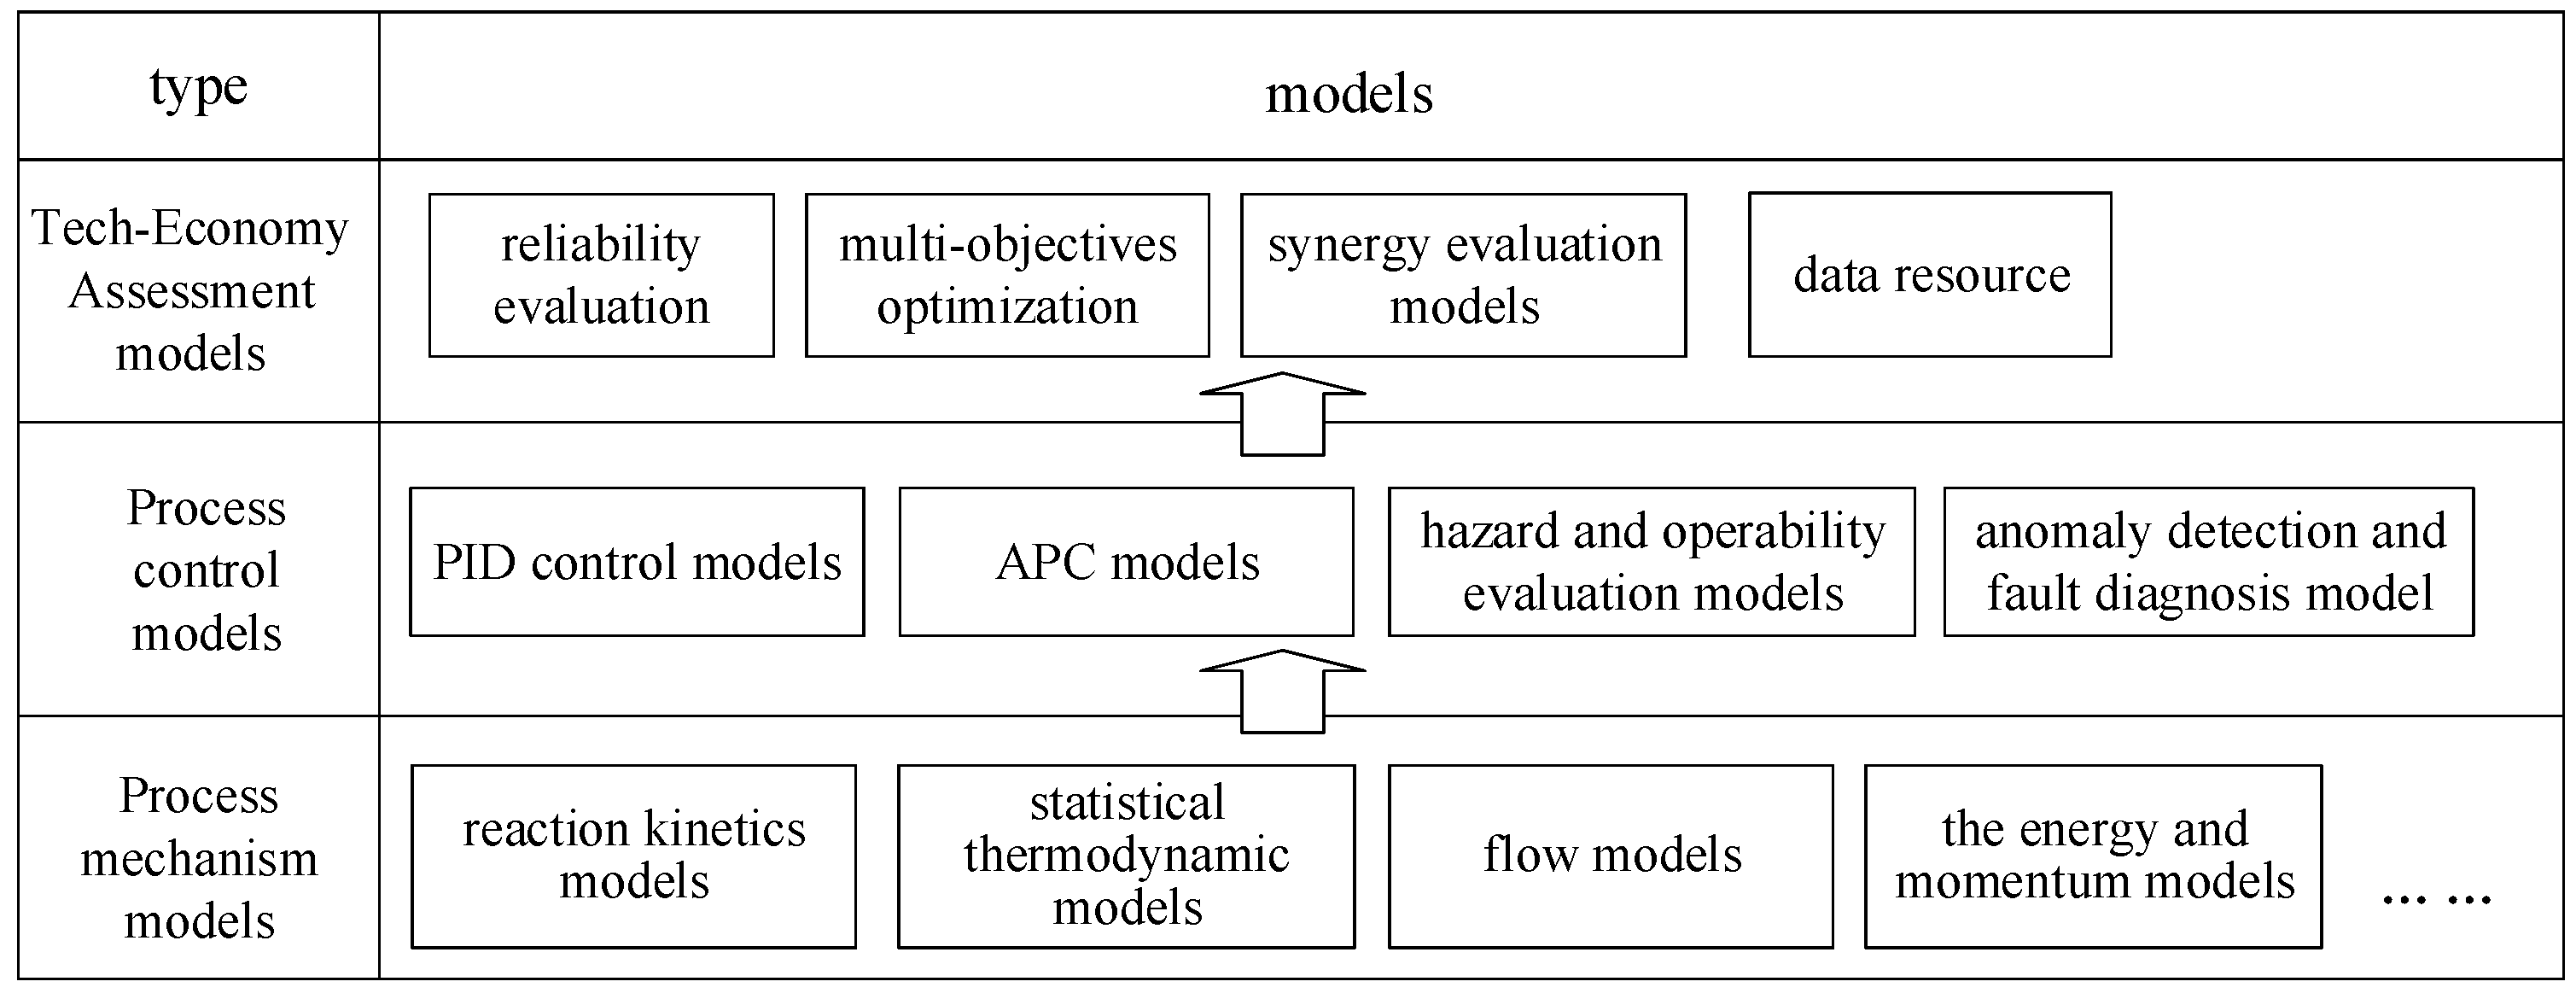
As a result of coal chemical industry characteristics such as correlation, conditionality and atomic economy, this paper examined the supply chain networks from the atomic level to system level, and established related evaluation models which took account of industrial metabolic balances, enterprise sustainable profitability, contract execution ability and information interaction abilities. In this study, the industrial metabolic balance degree, the enterprise profitability indexes and the contract execution ability indexes were defined, and respective computational formulas developed. The proposed evaluation models in this paper form the scientific and quantitative evaluation method of SC, which could be used for both SC planning and operations management helping detect and eliminate risks.
(3)
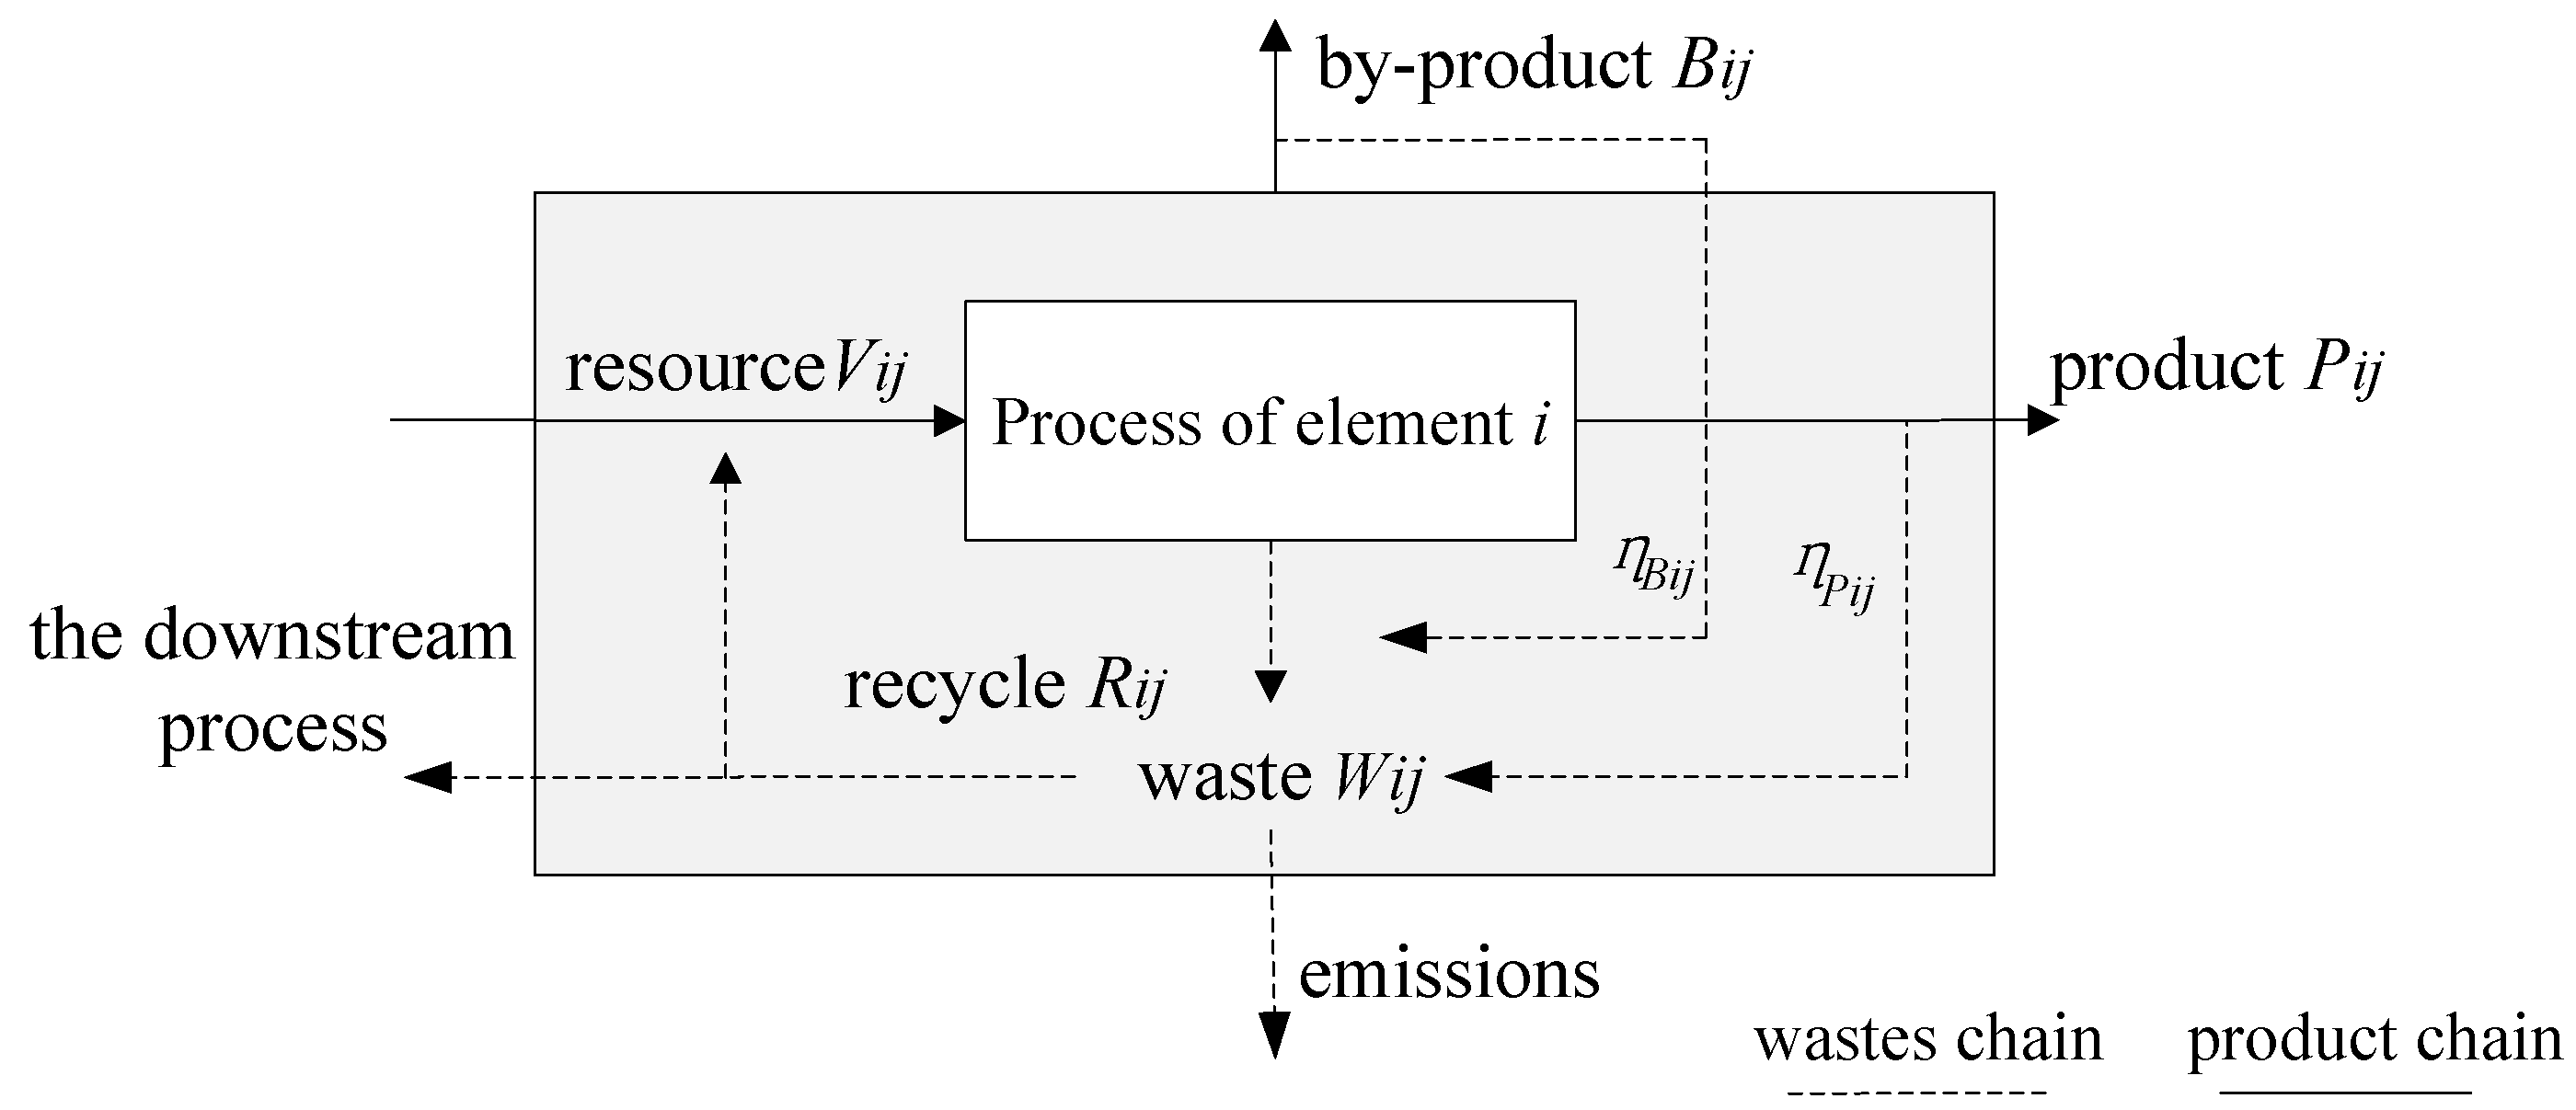
Based on the technological economic characteristics of the coal chemical industry, the industrial metabolic balance was used as the efficiency index for SCN resource coordination, and as the evaluation models’ constraints on the system levels, the industrial metabolic balance met the requirements for clean efficient resource utilization. In this study, the SCN industrial metabolic balance was defined by the effective chemical element utilization rate, which was a combination of the product metabolism and waste metabolism rates. The industrial metabolic balance evaluation is the important distinction between the evaluations models of chemical industrial supply chain and that of other types of supply chains, such as the logistics industry.
(4)
As the enterprise evaluation indexes were complex and non-independent, on the basis of enterprise actual operation data, GRA was used to analyze the SCN influential factors to remove the weakly correlated factors and the independent factors. BP-ANN was used to deal with the unstructured and indeterminate collaborative relationships. In the case analysis, crude oil prices, coal prices and coal output were found to be the key factors affecting enterprise profitability in the three coal chemical enterprises, and the hybrid algorithm of GA and BP-ANN confirmed the relationships between the output layer and the input layers, with the RMSE calculated at 0.0231, the R2 at 0.998, and the average prediction error at −2.32%. The results indicated that the BP-ANN algorithm was feasible for SCN profitability analysis, and could also be used in other SC problems which are not suitable for fitting modeling method.

Author Contributions

Conceptualization, X.J. and L.Z.; methodology, G.H.; software, G.H.; validation, Y.D. (Yiyang Dai); formal analysis, Y.D. (Yagu Dang); investigation, Y.D. (Yagu Dang); data curation, G.H.; writing—original draft preparation, G.H.; writing—review and editing, X.J.; visualization Y.D. (Yiyang Dai); supervision, L.Z.; project administration, X.J.; funding acquisition, X.J. All authors have read and agreed to the published version of the manuscript.

Funding

This research was funded by Key Lab of Process Analysis and Control of Sichuan Universities, grant number 2016003.

Acknowledgments

The authors gratefully acknowledge the support of the National Natural Science Foundation, China (No. 51473102).

Conflicts of Interest

The authors declare no conflict of interest.

References

  1. Zhou, R.-J.; Li, L.-J. Joint capacity planning and distribution network optimization of coal supply chains under uncertainty. AIChE J. 2018, 64, 1246–1261. [Google Scholar] [CrossRef]
  2. Qu, Y.; Yu, Y.; Appolloni, A.; Li, M.; Liu, Y. Measuring green growth efficiency for Chinese manufacturing industries. Sustainability 2017, 9, 637. [Google Scholar] [CrossRef] [Green Version]
  3. Wu, X.F.; Chen, G.Q. Coal use embodied in globalized world economy: From source to sink through supply chain. Renew. Sustain. Energy Rev. 2018, 81, 978–993. [Google Scholar] [CrossRef]
  4. Appolloni, A.; Sun, H.; Jia, F.; Li, X. Green Procurement in the private sector: A state of the art review between 1996 and 2013. J. Clean. Prod. 2014, 85, 122–133. [Google Scholar] [CrossRef]
  5. Cheng, W.; Appolloni, A.; D’Amato, A.; Zhu, Q. Green public procurement, missing concepts and future trends—A critical review. J. Clean. Prod. 2017, 176, 770–784. [Google Scholar] [CrossRef]
  6. Wang, C.; Zhang, L.; Zhou, P.; Chang, Y.; Zhou, D.; Pang, M.; Yin, H. Assessing the environmental externalities for biomass- and coal-fired electricity generation in China: A supply chain perspective. J. Environ. Manag. 2019, 246, 758–767. [Google Scholar] [CrossRef] [PubMed]
  7. Rioux, B.; Galkin, P.; Murphy, F.; Pierru, A. Economic impacts of debottlenecking congestion in the Chinese coal supply chain. Energy Econ. 2016, 60, 387–399. [Google Scholar] [CrossRef] [Green Version]
  8. Hu, S.; Chen, D.; Jin, Y.; Zhu, B.; Ma, S.; Song, X.; Chen, Z. Green development strategies for chemical industry in China: Based on analysis of fertilizer industry and coal chemical industry. Huagong Xuebao CIESC J. 2014, 65, 2704–2709. [Google Scholar]
  9. Wang, S.K.; Chen, G.H. Risk assessment of industry chain and its application in chemical industrial parks. J. Chem. Eng. Chin. Univ. 2014, 28, 1097–1104. (In Chinese) [Google Scholar]
  10. Kong, Y.; Xie, C.; Zheng, S.; Jiang, P.; Guan, M.; Wang, F. Dynamic early warning method for major hazard installation systems in chemical industrial park. Complexity 2019, 2019, 6250483:1–6250483:18. [Google Scholar] [CrossRef]
  11. Cooper, M.C.; Lambert, D.M.; Pagh, J.D. Supply chain management: More than a new name for logistics. Int. J. Logist. Manag. 1997, 8, 1–14. [Google Scholar] [CrossRef]
  12. Manzini, R.; Gamberi, M.; Gebennini, E.; Regattieri, A. An integrated approach to the design and management of a supply chain system. Int. J. Adv. Manuf. Technol. 2008, 37, 625–640. [Google Scholar] [CrossRef]
  13. Carter, C.; Easton, P. Sustainable supply chain management: Evolution and future directions. Int. J. Phys. Distrib. Logist. Manag. 2011, 41, 46–62. [Google Scholar] [CrossRef]
  14. Silvestre, B. Sustainable supply chain management in emerging economies: Environmental turbulence, institutional voids and sustainability trajectories. Int. J. Prod. Econ. 2015, 167, 156–169. [Google Scholar] [CrossRef]
  15. Ralston, P.; Blackhurst, J.; Cantor, D.; Crum, M. A structure-conduct-performance perspective of how strategic supply chain integration affects firm performance. J. Supply Chain Manag. 2014, 51. [Google Scholar] [CrossRef]
  16. Gong, J.; Yang, Y.; Wang, J. Meeting the challenges to sustain capacity through process integration—Process systems engineering review. Chem. Ind. Eng. Prog. 2006, 25, 721–728. [Google Scholar]
  17. Gardner, T.A.; Benzie, M.; Borner, J.; Dawkins, E.; Fick, S.; Garrett, R.; Godar, J.; Grimard, A.; Lake, S.; Larsen, R.K.; et al. Transparency and sustainability in global commodity supply chains. World Dev. 2019, 121, 163–177. [Google Scholar] [CrossRef]
  18. Lambert, D.; Cooper, M.; Pagh, J. Supply chain management: Implementation issues and research opportunities. Int. J. Logist. Manag. 1998, 9, 1–20. [Google Scholar] [CrossRef]
  19. Gharaei, A.; Karimi, M.; Shekarabi, S.A.H. An integrated multi-product, multi-buyer supply chain under penalty, green, and quality control polices and a vendor managed inventory with consignment stock agreement: The outer approximation with equality relaxation and augmented penalty algorithm. Appl. Math. Model. 2019, 69, 223–254. [Google Scholar] [CrossRef]
  20. Lingron, Z. Influence factors and action mechanism of supply chain technology spillover: A multi-case study based on the self-organizing process of supply chain. J. Manag. Case Stud. 2014, 7, 182–194. [Google Scholar]
  21. Kristianto, Y.; Gunasekaran, A.; Helo, P.; Sandhu, M. A decision support system for integrating manufacturing and product design into the reconfiguration of the supply chain networks. Decis. Support Syst. 2012, 52, 790–801. [Google Scholar] [CrossRef]
  22. Anbanandam, R.; Banwet, D.K.; Shankar, R. Evaluation of supply chain collaboration: A case of apparel retail industry in India. Int. J. Product. Perform. Manag. 2011, 60, 82–98. [Google Scholar] [CrossRef]
  23. Zokaee, S.; Jabbarzadeh, A.; Fahimnia, B.; Sadjadi, S.J. Robust supply chain network design: An optimization model with real world application. Ann. Oper. Res. 2017, 257, 15–44. [Google Scholar] [CrossRef]
  24. Arampantzi, C.; Minis, I. A new model for designing sustainable supply chain networks and its application to a global manufacturer. J. Clean. Prod. 2017, 156, 276–292. [Google Scholar] [CrossRef]
  25. Tian, Y. Opinions on the development of China’s Coal Chemical Industry—Remarks drawn before the 13th five-year plan. Coal Chem. Ind. 2014, 175, 1–8. (In Chinese) [Google Scholar]
  26. Vanany, I.; Zailani, S.; Pujawan, N. Supply chain risk management: Literature review and future research. IJISSCM 2009, 2, 16–33. [Google Scholar] [CrossRef]
  27. Hong, Z.F.; Guo, X.L. Green product supply chain contracts considering environmental responsibilities. Omega Int. J. Manag. Sci. 2019, 83, 155–166. [Google Scholar] [CrossRef]
  28. Laeequddin, M.; Sardana, G.D.; Sahay, B.S.; Abdul Waheed, K.; Sahay, V. Supply chain partners’ trust building process through risk evaluation: The perspectives of UAE packaged food industry. Supply Chain Manag. Int. J. 2009, 14, 280–290. [Google Scholar] [CrossRef]
  29. Zhuge, D.; Yu, S.; Zhen, L.; Wang, W. Multi-Period distribution center location and scale decision in supply chain network. Comput. Ind. Eng. 2016, 101, 216–226. [Google Scholar] [CrossRef]
  30. Tang, L.; Jing, K.; He, J.; Stanley, H. Robustness of assembly supply chain networks by considering risk propagation and cascading failure. Phys. A Stat. Mech. Appl. 2016, 459, 129–139. [Google Scholar] [CrossRef]
  31. Ma, Y.; Yan, F.; Kang, K.; Wei, X. A novel integrated production-distribution planning model with conflict and coordination in a supply chain network. Knowl. Based Syst. 2016, 105, 119–133. [Google Scholar] [CrossRef]
  32. Winkler, H. How to improve supply chain flexibility using strategic supply chain networks. Logist. Res. 2009, 1, 15–25. [Google Scholar] [CrossRef]
  33. Farahani, R.Z.; Rezapour, S.; Drezner, T.; Fallah, S. Competitive supply chain network design: An overview of classifications, models, solution techniques and applications. Omega Int. J. Manag. Sci. 2014, 45, 92–118. [Google Scholar] [CrossRef]
  34. Amin, S.H.; Zhang, G.Q. A multi-objective facility location model for closed-loop supply chain network under uncertain demand and return. Appl. Math. Model. 2013, 37, 4165–4176. [Google Scholar] [CrossRef]
  35. Amin, S.H.; Baki, F. A facility location model for global closed-loop supply chain network design. Appl. Math. Model. 2017, 41, 316–330. [Google Scholar] [CrossRef]
  36. Talaei, M.; Moghaddam, B.F.; Pishvaee, M.S.; Bozorgi-Amiri, A.; Gholamnejad, S. A robust fuzzy optimization model for carbon-efficient closed-loop supply chain network design problem: A numerical illustration in electronics industry. J. Clean. Prod. 2016, 113, 662–673. [Google Scholar] [CrossRef]
  37. Li, J.Y.; Wang, L.; Tan, X. Sustainable design and optimization of coal supply chain network under different carbon emission policies. J. Clean. Prod. 2020, 250, 119548. [Google Scholar] [CrossRef]
  38. Ghahremani-Nahr, J.; Kian, R.; Sabet, E. A robust fuzzy mathematical programming model for the closed-loop supply chain network design and a whale optimization solution algorithm. Expert Syst. Appl. 2019, 116, 454–471. [Google Scholar] [CrossRef] [Green Version]
  39. Ahmadzadeh, E.; Vahdani, B. A location-inventory-pricing model in a closed loop supply chain network with correlated demands and shortages under a periodic review system. Comput. Chem. Eng. 2017, 101, 148–166. [Google Scholar] [CrossRef]
  40. Jin, Y.; Wei, F. Sustainable development and ecological process engineering. China J. Nonferous Met. 2004, 14, S1. (In Chinese) [Google Scholar]
  41. Korhonen, J. On the ethics of corporate social responsibility—Considering the paradigm of industrial metabolism. J. Bus. Ethics 2003, 48, 301–315. [Google Scholar] [CrossRef]
  42. Fan, Y.P.; Qiao, Q.; Fang, L. Network analysis of industrial metabolism in industrial park—A case study of Huai’an economic and technological development area. J. Clean. Prod. 2017, 142, 1552–1561. [Google Scholar] [CrossRef]
  43. Zhe, Z. Coal-Based industrial metabolism and ecological optimization. Comput. Appl. Chem. 2001. [Google Scholar] [CrossRef]
  44. Liu, T.; Han, Y.-J. Exploring the relationship among the enterprise operation ability, profitability and development ability. In Proceedings of 2012 3rd International Asia Conference on Industrial Engineering and Management Innovation (IEMI2012); Springer Science & Business Media: Berlin/Heidelberg, Germany, 2013; pp. 813–821. [Google Scholar]
  45. Cheng, X.J. Simple analysis on some evaluating indexes for enterprise development ability. Pet. Petrochem. Today 2015, 244, 34–39. [Google Scholar]
  46. Li, Y.-Q.; Fang, P.; Deng, B.-G.; Li, Y. The collaboration evolution mechanism research of industrial chain and innovation chain based on system dynamics. Value Eng. 2015, 21, 79–82. (In Chinese) [Google Scholar]
  47. Mercure, J.-F.; Salas, P. An assessement of global energy resource economic potentials. Energy 2012, 46, 322–336. [Google Scholar] [CrossRef] [Green Version]
  48. Yang, Y.Q.; Jiang, X.Y. Development strategy of China’s chemical industries in Merge of Industrialization and Information. Mod. Chem. Ind. 2009, 29, 9–14. (In Chinese) [Google Scholar]
  49. SiWei, C. Improving integration of enterprises by relying on process systems engineering. Mod. Chem. Ind. 1998, 7, 1–5. (In Chinese) [Google Scholar]
  50. Brito Alves, R.; Nascimento, C. Analysis and detection of outliers and systematic errors in industrial plant data. Chem. Eng. Commun. 2007, 194, 382–397. [Google Scholar] [CrossRef]
  51. Ji, X.; He, G.; Xu, J.; Guo, Y. Study on the mode of intelligent chemical industry based on cyber-physical system and its implementation. Adv. Eng. Softw. 2016, 99, 18–26. [Google Scholar] [CrossRef]
  52. Shen, L.; Sun, Y. Review on carbon emissions, energy consumption and low-carbon economy in China from a perspective of global climate change. J. Geogr. Sci. 2016, 26, 855–870. [Google Scholar] [CrossRef] [Green Version]
  53. Xie, H.; Xie, L.; Wang, Y.; Zhu, J.; Liang, B.; Ju, Y. CCU: A more feasible and economic strategy than CCS for reducing CO2 emissions. J. Sichuan Univ. (Eng. Sci. Ed.) 2012, 44, 1–5. [Google Scholar]
  54. Fritsche, U.; Kuzin, V. Analysing convergence in Europe using the non-linear single factor model. Empir. Econ. 2011, 41, 343–369. [Google Scholar] [CrossRef] [Green Version]
  55. Chang, P.-C.; Liu, C.-H.; Wang, Y.-W. A hybrid model by clustering and evolving fuzzy rules for sales decision supports in printed circuit board industry. Decis. Support Syst. 2006, 42, 1254–1269. [Google Scholar] [CrossRef]
  56. Crespo Marquez, A.; Blanchar, C. A decision support system for evaluating operations investments in high-technology business. Decis. Support Syst. 2006, 41, 472–487. [Google Scholar] [CrossRef]
  57. Han, X.; Li, B.; Guan, Z. Atmospheric quality prediction model based on RBF neural network-markov chain of grey correlational analysis filter indexes. Acta Sci. Nat. Univ. Nankaiensis 2013, 46, 22–27. [Google Scholar]
  58. Lin, H.-L. The use of the Taguchi method with grey relational analysis and a neural network to optimize a novel GMA welding process. J. Intell. Manuf. 2012, 23, 1671–1680. [Google Scholar] [CrossRef]
  59. Cao, X. Achieving a healthy development of coal-based chemicals and CTL in China. Chem. Ind. Eng. Prog. 2011, 30, 80–87. (In Chinese) [Google Scholar]
  60. Goldberg, D.E.; Holland, J.H. Genetic algorithms and machine learning. Mach. Learn. 1988, 3, 95–99. [Google Scholar] [CrossRef]
  61. Fu, Z.; Mo, J.-H.; Chen, L.; Chen, W. Using genetic algorithm-back propagation neural network prediction and finite-element model simulation to optimize the process of multiple-step incremental air-bending forming of sheet metal. Mater. Des. 2010, 31, 267–277. [Google Scholar] [CrossRef]
  62. Rao, D.S.H.; Reddy, S.P.V.; Ghorpade, D.V.G.; Reddy, D.C.T. Development of genetic algorithm based hybrid neural network model for predicting the ultimate flexural strength of ferrocement elements. Int. J. Eng. Sci. Technol. 2012, 4, 867–873. [Google Scholar]
  63. Xue, X.; Li, Y.; Yang, X.; Chen, X.; Xiang, J. Prediction of slope stability based on GA-BP hybrid algorithm. Neural Netw. World 2015, 25, 189–202. [Google Scholar] [CrossRef] [Green Version]
Figure 1. Supply chain model with single core.
Sustainability 12 09919 g001
Figure 2. The coal industry chain.
Sustainability 12 09919 g002
Figure 3. The three-hierarchized models for chemical processes.
Sustainability 12 09919 g003
Figure 4. Material flow relationship for chemical process j.
Sustainability 12 09919 g004
Figure 5. Basic supply chain network (SCN) structural models.
Sustainability 12 09919 g005
Figure 6. The information interaction architecture facing SCN.
Sustainability 12 09919 g006
Figure 7. Coal chemical industry SCN structure.
Sustainability 12 09919 g007
Figure 8. Radar chart for the correlation coefficients for the 25 comparative indexes.
Sustainability 12 09919 g008
Figure 9. Hybrid algorithm of genetic algorithm (GA) and back-propagation artificial neural network (BP-ANN).
Sustainability 12 09919 g009
Figure 10. Relative error for the GPR output values vs. the real values.
Sustainability 12 09919 g010
Figure 11. GPR for the coal chemical companies.
Sustainability 12 09919 g011
Figure 12. Truncated SCN chains.
Sustainability 12 09919 g012
Table 1. Industrial metabolic balance for carbon dioxide.
Petrochemical Resource Consumption (Mtonne of Standard Coal Equivalent)CO2 Emissions (Mtonne)Carbon Balance—Degree of Industrial Metabolism
201120122011201220112012
CHN31713460832486400.2860.318
USA26622620543353410.4430.444
JAP576591117111800.4450.455
(Data resources: World Bank Database).
Table 2. Partial evaluation indexes for enterprise’s profitability.
ItemEvaluation IndexesItemEvaluation Indexes
E01network densityE14current ratio
E02network centralizationE15ratio of liabilities to assets
E03viscosity of brand with customersE16total assets turnover
E04product quality qualification rateE17current asset turnover
E05product species diversityE18accounts receivable turnover
E06products pricesE19rate of capital turnover
E07prices for the competitive products
(crude oil)
E20inventory turnover
E08sales-output ratioE21return on sales
E09production-demand balanceE22ratio of Profits to Cost
E10products outputE23raw material supply timeliness
E11revenue growth rateE24purchasing lead time
E12market shareE25delivery timeliness
E13profit rate to net worth … …
Table 3. Test values for the BP-ANN based gross profit rate (GPR) for coal chemical companies.
QuarterE10
Coal Output
(Gigatonne)
E06
Coal Price
(RMB/Tonne)
E07
Oil Price
(Dollar/bbl)
CCECSECYanzCoal
GPRANN OutputGPRANN
Output
GPRANN
Output
2012Q10.838501118.4937.4%-36.9%-31.9%-
2012Q21.072491108.4234.3%-37.4%-27.2%-
2012Q30.97442109.6135.5%-37.8%-23.3%-
2012Q40.77438110.0936.2%-36.0%-24.1%-
2013Q10.83448112.4935.4%-36.1%-24.4%-
2013Q20.96424102.5833.3%-36.3%-21.4%-
2013Q30.98400110.2732.8%-35.0%-21.7%-
2013Q40.91416109.2131.8%-33.9%-22.3%-
2014Q10.85401108.1735.1%-34.8%-17.1%-
2014Q20.966363109.7032.6%-35.0%-17.2%-
2014Q31.034340101.8230.7%29.9%34.0%34.9%18.7%18.6%
2014Q40.10236476.4030.0%28.8%34.3%35.4%19.1%21.2%
2015Q10.8534753.9229.8%28.7%39.8%35.9%28.0%23.2%
(Data resources: the financial statements of the listed company. The price is the average for the quarter).
Table 4. Qualitative evaluation indexes for information interactive ability.
Evaluation MethodEvaluation Indexes
Qualitative evaluationInformation Openness
Accuracy and agility of information
Value of information sharing
Information integration
Information content and intensity
Publisher’s Note: MDPI stays neutral with regard to jurisdictional claims in published maps and institutional affiliations.

