Analytical Mathematical Modeling of the Thermal Bridge between Reinforced Concrete Wall and Inter-Floor Slab


1
Faculty of Engineering and Architecture, University of Enna “Kore”, 94100 Enna, Italy
2
Department of Architecture, University of Palermo, 90100 Palermo, Italy
3
Department Unit for Energy Efficiency, Energy and Sustainable Economic Development (ENEA), Italian National Agency for New Technologies, 90100 Palermo, Italy
*
Author to whom correspondence should be addressed.
Sustainability 2020, 12(23), 9964; https://doi.org/10.3390/su12239964
Submission received: 26 October 2020
/
Revised: 24 November 2020
/
Accepted: 25 November 2020
/
Published: 28 November 2020
(This article belongs to the Special Issue Sustainable Design and Construction)
Abstract
:The evaluation of thermal bridges in buildings, following the UNI TS 11300-1:2014 standard, must be carried out with finite element analysis or through the use of atlases compliant with the UNI EN ISO 14683:2018. The paper illustrates the development of an analytical tool to determine the internal linear thermal transmission coefficient (ψi) for the thermal bridge between concrete wall and inter-floor slab, neglected in the main existing catalogs or atlases. This type of thermal bridge is relevant in multi-story buildings, and is typical of public housing districts built between the 1960s and 1970s throughout Europe by means of industrialized systems. Considering energy requalification, due to their low energy efficiency, these buildings require adaptation to the standards imposed by law, and this thermal bridge, which has a high percentage incidence on the total heat losses, cannot be overlooked. From the survey of a representative number of such buildings in Italy, three different technological solutions were examined, with dimensional variations in the individual technical elements and the related functional layers. The combination of these variables resulted in 216 different case studies. The analysis of the existing atlases and catalogues has demonstrated their inapplicability for the selected case studies. For each one of these, ψi was calculated, using off-the-shelf software. The correlation of the data made it possible to determine an analytical mathematical modeling process to assess heat losses due to the analyzed thermal bridge. The validity of this mathematical formula was verified by recalculating the typologies investigated, reaching an error evaluated by means of the mean square deviation equal to ±4%.
1. Introduction
The evaluation of heat losses through thermal bridges is a much-debated topic at an international level, as evidenced by the several energy saving standards issued in recent years, up to UNI/TS 11300-1:2014, which put an end to the use of approximate methods or percentage increases. The evaluation of thermal bridges is no longer negligible and must be carried out with finite element analysis or with the use of thermal bridge atlases compliant with the recently updated UNI EN ISO 14683:2018. This issue becomes increasingly important given the need to adapt existing buildings to the standards imposed by regulations aimed at improving energy performance, especially following Directive (EU) 2010/31, proposing to consider thermal bridges in the calculation of the energy performance of buildings. Recently, this Directive was amended by Directive (EU) 2018/844, which aims to increase the energy performances of existing and new buildings, focusing not only on technological solutions in the building envelope, but even on passive techniques reducing the energy needs for heating and/or cooling. This last Directive, mentioning the 2009 World Health Organization guidelines [1], focuses on thermal bridges, inadequate insulation and unplanned air pathways as sources of surface temperatures below the dew point of the air, and dampness. Hanapi et al. developed a study on the mold risk at the dampness surface, connected to thermal bridges in heritage buildings [2], and Fantucci et al. analyzed the mitigation of the thermal bridges’ impact on the mold growth by applying internal insulation [3]. The state of knowledge regarding the effects of thermal bridges is still not satisfying in some parts of Europe [4]. Three-dimensional modelling can help in localizing and reducing thermal bridges’ influence in the phase of renovation [5]. Decreasing the transmission losses of the envelope, by means of increasing the thermal transmittance of the building envelope elements, in certain conditions, cannot produce the reduction in energy losses through thermal bridges [6,7]. According to the study carried out by Citterio et al. [8], the impact of thermal bridges on the energy consumption is higher in the case of building retrofit, particularly when insulation cannot be applied externally. The impact of thermal bridges on the overall annual heating load for a Greek residential building was estimated at 13% by Kotti et al. [9], and up to 30%, by Theodosiou et al. [10], in the case of double brick wall construction, which is widely used in Greece. Ilomets et al. estimated a contribution of up to 23% before renovation and only 10% after renovation for apartment buildings in Eastern Europe [11]. Bergero et al. studied the case of an Italian five-level residential building, determining a contribution of thermal bridges up to 12% [12]. Gao et al. estimated 14% of the total heat loss depends on thermal bridges in a French building, by means of a simplified model in a graphically based software environment used to simulate the behavior of transient systems (TRNSYS) [13]. Several studies aim at analyzing the influence of thermal bridges on the heat losses of technological solutions, in order to address the choice of the most suitable solutions, and concern recurrent building in various countries. Some of these studies concern the wall/reinforced concrete (RC) frame junction, intending to reduce heat losses in different climatic regions with different corrective solutions [14,15,16,17], while others analyze the influence of the insulation in the wall/floor junction [18] or in the wall/balcony junction [19]. Several studies proposed models for the improvement of thermal bridge quantitative assessment by infrared thermography [20,21,22,23,24]. Ge et al. proposed a method to evaluate the insulation performance of the wall-to-floor thermal bridge [25]. From the analysis of the existing literature [26,27,28], it emerges that, except for a few studies [29,30] and the recent catalog of thermal bridges by PHI (Passive House International) [31], thermal bridges of the wall/inter-floor slab are mostly neglected.
The Building Context and Techniques
Thermal bridges are recurrent in buildings made with the industrialized construction techniques of coffrage-tunnel and banche et table. The use of these industrialized systems started in Italy twenty years later than in other European countries, and concerns a limited time span, from the early 1960s to the early 1990s, mainly interesting the public residential sector. The coffrage-tunnel system and the banche et table system imported from the French construction industry have been widely used for the construction of numerous residential public housing districts in different European contexts: Bron-Parilly (Lyon, 1959), Adhalen residential unit (Bern, 1960–1962), Kelenfold (Budapest, 1964–1975), Laurentino (Rome, 1971–1974), Fossolo (Bologna, 1967–1971), Pilastro (Bologna, 1962), Cavedone (Bologna 1972–1977), Sperone (Palermo, 1969) and ZEN 2 (Palermo, 1969–1990) [32,33,34,35]. The coffrage-tunnel system, where coffrage means formwork in French, involves the use of tunnel formworks for the simultaneous casting of RC walls and floors (Figure 1).
The banche et table system was based on vertical (banche) and horizontal (table) formworks for the construction of load-bearing walls and floors; wooden formworks were often used for wall’s casting, while the floors were realized by means of semi-prefabricated hollow tile panels or “Predalles” panels (concrete slabs with embedded steel trusses), completed by concrete casting on site, as showed in Figure 2.
Both construction procedures allowed the construction of buildings with transverse load-bearing walls (more rarely longitudinal), for both in-line and tower building typologies, as shown in the typological schemes of Figure 3 [33].
The industrialized construction of this short period was relevant, as it was built to respond quickly and at low cost to the great demand for public housing, particularly in large towns, giving rise to peripheries’ expansion (only the ZEN2 in Palermo was conceived as a settlement for 9000 inhabitants, with a volume of 380,000 m3) [36]. This building stock, like all existing buildings of the period, is particularly energy-intensive, and compared to RC frame buildings shows high heat losses due to the thermal bridges of the external RC walls. In addition, the different aggregation system of the tunnels, aligned or staggered with each other and with respect to the staircase, and the possible aggregation of tunnels of different lengths, both in the in-line and in the tower types (Figure 3), increases the dispersing surface of the RC walls, making buildings particularly energy-inefficient. In these buildings, there is a close correlation between typological-constructive elements and energy performance factors. In these type of industrialized building, specific thermal bridges were found and identified graphically in an apartment floor plan of the Sperone district in Palermo, built with the coffrage-tunnel system (Figure 4). The several thermal bridges were also divided into horizontal and vertical ones, and according to whether the thermal bridge was geometric, material or mixed [32,37]. To each of them an identifying code was given in analogy to the details in the UNI EN ISO 14683:2018, and these are reported in Figure 5 and Figure 6. The characteristic thermal bridges of the coffrage-tunnel system are as follows: header RC wall/RC floor (IFn), RC wall/balcony floor (Bn), RC wall/cavity wall (Cn) and RC wall/internal partition (IWn), not provided for in either the UNI EN ISO 14683 or in the most common atlases, and thus identified with n; other thermal bridges correspond to the IF2, B2 and C2 types of the cited international standard. Among these thermal bridges, we decided to develop a methodology for the simplified calculation of IFn, which has the highest influence on the total heat losses of the building.
As Dell’Acqua et al. reported in their study: “The strong presence of heat losses attributable to the presence of thermal bridges is very evident for structures built with tunnel mode, in which the load-bearing walls in RC penetrate the external walls, even interrupting them from ground level to roof and thus creating a strong thermal discontinuity of transmittance”. The tunnel construction types with RC partitions orthogonal to the façade have a considerable effect on heat losses due to thermal bridges, with values of 20–25% compared to those due to transmission, without considering the presence of overhangs and loggias, whose presence would further increase this percentage. In these construction types, the thermal bridges are relevant and accentuated by the positioning of the insulation within the stratigraphy used, which never exceeds 2 cm in thickness. For structures with load-bearing RC walls, the contribution to the total heat losses of the wall–floor thermal bridge is relevant, due to the lack of further penetration of thermally inhomogeneous material into the thickness of the masonry. The incidence of this thermal bridge in tower buildings in the Cavedone district of Bologna is 26% [38]. This incidence increases in the case of energy efficiency interventions. A previous study on the calculation of the heat losses of the same buildings has shown that the percentage incidence of the thermal bridge, in particular conditions, after retrofitting, increases from 21% to 31% [39]. Considering this high contribution to the calculation of heat losses in industrialized buildings, from the view point of requalification intervention, and the lack of an analytical determination method, this study aims at providing a mathematical method to correctly assess the main and relevant thermal bridges found in this type of construction. A comparative study was developed, considering the most widespread catalogues and atlases of thermal bridges, whose inapplicability was demonstrated, so as to provide an efficient and suitable calculation of this thermal bridge. The calculation method was described at first. The application was made on the RC wall/RC slab junction, considering all the possible changes in materials and thicknesses, resulting in n. 216 different solutions. The results of these calculations allowed us to identify a trend that was mathematically represented by a non-linear regression, thus giving an easily applicable formula.
2. Methodology
The study is based on a methodological and systematic process which, starting from the analysis of the most recurrent and relevant thermal bridges in buildings, based on RC walls, focuses on the most present one in multi-story buildings: the external wall/inter-floor slab junction, which has a greater impact, depending on the number of floors, on the total heat losses of the building. For this thermal bridge, the possible dimensional and material characteristics of the technical elements involved were identified, i.e., the thickness of the RC partition, the type and thickness of the floor, any presence and thickness of thermal insulation layer and finishes. This allowed us to identify the material and dimensional variables and to draw up a list of the most recurrent technical solutions. From studies and research previously carried out on buildings made with cast industrialization techniques, various technical solutions have been identified for the wall/inter-floor slab junction [32,33,34,38]. The survey of these buildings was at the base of an Italian Research Project, in 2008, entitled “The industrialized construction in Italy between the 1960s and 1980s. Methods and techniques of conservation and recovery”. Three categories of wall/inter-floor slab thermal bridge were identified and labeled as IF3a, IF3b and IF3c (Figure 7) in analogy to the nomenclature of the UNI EN ISO 14683:2018, which identifies as IF3 the thermal bridge between wall and intermediate floor, with an insulating layer placed inside. We considered several (n. 4) thicknesses of RC walls (dp), depending on the standard dimensions of the metal formwork used for casting, and we choose n. 3 thicknesses (ds) for floors. The technical solutions analyzed almost always provided for a layer of thermal insulation applied to the internal side of the wall with a variable thickness (di), and the case of absence of thermal insulation was also considered.
For the internal finishing of the wall, plasterboard paneling was generally found. In the floors, a shallow layer of plaster was applied in the intrados and a completion layer in the extrados with screed and flooring. Taking these design variables into account, 24 different walls and 9 different floors have been identified for a total of 216 junctions, 72 for each of the IF3a, IF3b and IF3c types.
For these solutions, the calculation of the linear thermal transmittance was carried out as the design parameters changed. In particular, the presence and the different thicknesses of the thermal insulation layer were considered to take into account the thermal conditions even after a possible retrofitting intervention. In compliance with the UNI/TS 11300-1:2014, the linear thermal transmission coefficient of the thermal bridge was determined through the use of a finite element calculation software (THERM 7.4, by the Lawrence Berkeley National Laboratory of the University of California) [39], which meets the requirements of the UNI EN ISO 10211:2018 standard. Finally, the values of the linear thermal transmission coefficient for each type identified have been reported in summary tables and graphs from which we derived, by non-linear regression, the mathematical formula as a function of different geometric and material data. The non-linear regression can be analyzed by means of appropriate “open source” software [40], or some macros written in Visual Basic® [41] or a function in Microsoft Excel®. This technique was also used by Borelli et al. in the description of the thermal bridges in the case of flooring on the ground with a grade beam/load-bearing wall over lean concrete [42]. With the equation obtained, it will be possible to determine the linear thermal transmittance ψi of the analyzed type of thermal bridge as a function of the dimensions of the wall, floor and thermal insulation, the related thermal transmittances, and other fixed parameters. This will allow us to estimate in a simplified but accurate way the thermal behavior of this thermal bridge both in the design phase and in the energy efficiency intervention. The general expression of the non-linear regression is:
The value of the dependent variable y is the linear thermal transmittance ψi, which is a function of several independent variables x, representing the dimensional and material parameters of the wall/inter-floor slab junction—the thickness of the floor (ds), the thickness of the wall + insulation (dpi), the transmittance of the wall + insulation (Upi), and the transmittance of the wall (Up) and the floor (Us), while the values of m are coefficients corresponding to any exponential value of x, and b is a constant. The function of the exponential curve in the analyzed case becomes:
The “LOGEST” module of Microsoft Excel® calculates the exponential curve that adapts to the data and returns the values of the coefficients m and b of the Equation (2) and the related standard errors. The application of the non-linear regression is reported in Section 3.3.
3. Results and Calculation
3.1. Inapplicability of Existing Manuals/Atlases for the Calculation of Thermal Bridges
The UNI TS 11300-1 provides for the calculation of thermal bridges, beyond the numerical calculation (finite element analysis) in accordance with UNI EN ISO 10211, even by means of thermal bridge atlases in compliance with UNI EN ISO 14683. It is a fact that these atlases do not report the thermal bridges typical of industrialized buildings; their inapplicability for the RC wall/inter-floor slab junctions was demonstrated. The main atlases of existing thermal bridges, both national and international, are more flexible than those reported in the UNI EN ISO 14683, as they concern broader series of the geometric parameters and thermal characteristics of the materials. As for Italy, there are, in addition to the UNI EN ISO 14683, two atlases—the one by Cappelletti et al. [15], an engineering and software company, and a second one by CESTEC [27], the in-house company of the Lombardy Region. Both of these atlases claim to comply with the requirements of the UNI EN ISO 10211, UNI EN ISO 6946:2018 and UNI EN ISO 14683. Besides the Italian atlases, the paper analyzed the Swiss atlas of OFEN [28] and the Passive House Institute atlas [31], too. The existing catalogues are certainly useful in the preliminary design phase and refer to types of thermal bridges concerning recurring construction techniques and materials for the design of new buildings (load-bearing masonry or RC framed structures), neglecting, however, most of the types regarding existing buildings, which are essential for retrofitting interventions. In general, the examples given in the catalogues do not correspond exactly to the actual detail taken into consideration, thus considering the ψ values specified in the catalogue introduces an uncertainty. However, the ψ values of the catalogue may be used on condition that both the dimensions and thermal properties of the example are similar to those of the real detail, or (such as in the case of thermal) less favorable than those of the considered detail. However, outside the ranges of thermal conductivity and the dimensions of the building components constituting the thermal bridge, catalogues are very inaccurate and usually underestimate the influence of the thermal bridge. The analysis of the existing atlases has demonstrated their inapplicability for the selected case studies. We compared the data obtained by means of finite element calculation by means of THERM 7.4 [43] with those reported in atlases relating to the “vertical wall/intermediate floor slab” junction, considering the RC wall, 0.20 m thick, and the floor slab, 0.20 m thick, with insulation on the inner side, 0.10 m thick. For each catalogue, the thickness of the layers and the values of thermal transmittance of the materials, as well as the methodology used to obtain the ψ values, were considered. For this technological detail, the linear thermal transmittance by means of THERM 7.4 version was calculated. This software reports the trend of the isotherms, both in the form of flux lines and color scale, allowing us to determine the linear transmittance coefficient ψi of the thermal bridge, giving the value of 1.059 W/(m·K). We also considered the first Italian atlases to be reported in the Technical Standard UNI EN ISO 14683:2001, updated in 2008 and in 2018, and no longer applicable following the UNI/TS 11300-1, reporting different values. The National Atlas of Edilclima complies with the UNI EN ISO 14683, providing the same designation of thermal bridges, but increasing the amount of variables. The thermal bridges’ table in the CESTEC atlas introduces an equivalent thermal conductivity according to the UNI EN ISO 10211, considering the conductivity of the various layers, excluding insulation. The equivalent thermal conductivity of the wall (λeq) is defined as the product of the conductance of the wall (C), excluding the insulating layer, and the wall thickness (L) not including the insulating layer. The selected case study for our comparison is labeled SOL.002. Finally, we consulted the Catalogue des ponts thermiques, published by the Office Federal de l’Energie (OFEN) [28], including the RC wall/inter-floor slab junction, called 2.1-I1. Comparing the values of the linear transmittance, calculated by means of finite element software, and those of a similar type from the atlases, we noticed an underestimation of the thermal bridge influence ranging from 16.9% to 32.1%; in the UNI 14683:2018, the value is closer to the calculated value, which is 5.6% lower. The difference between the data calculated and those of the atlases considered is due mainly to the validity limits of the wall conductivity, the maximum value of which for the Edilclima one is 0.90 W/(m·K) and for the CESTEC one is 0.81 W/(m·K), corresponding to a hollow brick wall with 1800 Kg/m3 density, much lower than that of the examined RC wall, which is 2.3 W/(m·K). Table 1 shows the calculated values and the ones taken by the atlases and catalogues, together with the corresponding percentage difference with the calculated value.
Considering this discrepancy, we developed a numerical model to include into catalogues or atlases, constituting one of the most recurrent thermal bridges of industrialized buildings [34].
3.2. Numerical Model
For the calculation of the linear thermal transmission coefficients of the various technological solutions of the considered thermal bridge, the project variables were defined with the range of variation for each of them, as defined in the Section 2. The dimensions considered are 1 m around the junction, which is considered as a limit beyond which the influence of the thermal bridge is negligible. The boundary conditions used for the thermal analysis are reported in Table 2.
The chosen values of the thermal conductivity coefficient of the technical elements constituting the junction were reported in Table 3, and they were chosen on the basis of those reported in the existing technical literature, atlases, and the UNI 10351:2015, thus guaranteeing a precautionary overestimation of the thermal bridges’ effects. For the thermal conductivity coefficients of the composite elements, such as “Predalles” floors and brick-cement floors, instead of using table data, the calculation was made by means of THERM 7.4. Figure 8 reports the thermograms and isotherms obtained for a 0.2 m “Predalles” floor and a 0.2 m hollow brick floor.
Figure 8 shows a false color diagram allowing us to identify the relationship between each color and the component’s temperature (+5 °C–+20 °C). At the same thickness and under other conditions, for energy purposes the “Predalles” floor is more efficient, the ribs being spaced higher than the hollow brick floor, and therefore the surface of the insulating material opposes the heat flow more effectively. Table 3 reports the summary of the input data used for the calculation.
For each of the 216 identified nodes, THERM 7.4 provides the thermal transmittance of the node (considering a unit length), considering the heat losses through the thermal bridge. In order to obtain the value of the heat losses due to the thermal bridge alone (ψi), it is necessary to subtract the thermal transmittance of the wall (Up), without considering the contribution of the thermal bridge, from the value obtained by THERM 7.4. In particular, the software provides the thermal transmittance values of the node in reference to both the upper (UFiup) and lower (UFidown) internal surfaces, related to the upper interior length (liup), lower interior length (lidown) and external length (le). Therefore, it is possible to choose whether to use the transmittance based on the entire external surface (UFe) or the one projected onto the internal surface (UFi). Dimensions in the project phase are well-known, while in the phase of the assessment of the energy performance of the existing technical element, it is easier to measure the internal dimensions. Therefore, for the calculation of the transmittance of the wall, considering the presence of the thermal bridge, the values that refer to the internal dimensions, above (liup) and below (lidown) the floor, corresponding to UFi, were chosen. To obtain the linear thermal transmission coefficient ψi of the junction, it is necessary to apply the following formula:
Table 4 reports the case of the thermal bridge between the 0.14 m RC wall and the 0.16 RC slab, for different thicknesses of insulation. Multiplying the linear thermal transmission coefficient by the length of the thermal bridge, the value of the increase in heat loss due to the presence of the junction is obtained.
The trend of isothermal lines is shown in Figure 9 for the three types of junction analyzed. The temperature trend confirms that the temperature variations are distributed gradually in the technical solution based on RC floor (IF3a), due to the material continuity, compared to the cases with hollow brock floors (IF3b) and Predalles (IF3c), in which, instead, there is an intensification in the reduction of temperatures in correspondence with the material discontinuity between floor and wall. Furthermore, in the case of the RC floor, the wall and floor area affected by the thermal bridge is wider than that of the other two cases, where it remains fairly close to the physical extension of the thermal bridge. In particular, in the case of IFa, the affected wall area is 0.96 m and the floor area is 0.80 m, while for IFb, it is respectively 0.72 m and 0.56 m, and for IFc it is 0.78 m and 0.63 m.
The trend of the linear thermal transmission coefficient as the thickness of the insulation varies is represented in Figure 10, showing there is a relationship between the values of ψi, the thickness of the insulation (di), the thickness (dp) and the transmittance of the wall (Up) and the thickness (ds) and the transmittance of the floor (Us). The values of ψi increase up to an insulation thickness of 0.06 m, and then decrease. This stands to indicate the low relative impact of the thermal bridge in poorly insulated buildings, relative to higher thermal insulation protection levels. For higher insulation thicknesses, more than 0.06 m, the linear thermal transmittance decreases with a small slope, showing that the absolute magnitude is only slightly affected by a further increase in the thermal insulation thickness. This trend is also confirmed by the data reported in the study of Theodosiou et al. [30] and in the PHI catalog [31]. Figure 10 and Figure 11 show the impact of the thermal bridge on the overall heat losses as a function of the thickness of the insulation. In particular, without insulation the impact of the thermal bridge is negligible (4%), while insulation produces a considerable reduction in heat losses, increasing with thickness, both through the wall and the thermal bridge, with an increasing percentage incidence of heat losses due to the thermal bridge (from 26% to 46%) up to 0.06 m of insulation, corresponding to the maximum value of ψi. From 0.06 m thick insulation, the trend changes and heat losses due to thermal bridges exceed, even if only slightly, the ones through the wall. Only in two cases (0.14 m RC wall/0.16 m Predalles and hollow brick floors) does the maximum value of ψi recur with 0.04 m insulation, with a percentage difference of 0.6–0.8% with the corresponding value at 0.06 m insulation. Therefore, we consider these two cases negligible. The value of ψi increases as the thickness of the wall and the thickness of the floor increases, and decreases as the type of floor varies, from slab to hollow brick floor to “Predalles”. In terms of cost-effectiveness, considering the costs of rigid rock wool panels for internal partition wall insulation, with thermal conductivity of 0.034 ·(m·K), which is compliant with UNI EN 13162, picked up by the regional price list of Lombardy [45], the base cost only for material, without considering the labor costs and the cost of adhesive material for affixing the panels to the wall, is 3.18 EUR/m2 for a 20 mm panel, and increases of 1.00 EUR/m2 per every 10 mm additional thickness. Thus, the economic impact of this type of thermal insulation varies between 5.18 EUR/m2 and 7.18 EUR/m2, for 40–60 mm thicknesses.
3.3. Non-Linear Regression
The regular and uniform trend of the linear thermal transmittance reported in Figure 10 suggests the possibility of finding a mathematical correlation as a function of the dimensional and material parameters of the technical elements constituting the wall/inter-floor slab junction. Table 6 reports the matrix derived by the elaboration of data.
In the case studied, the coefficient of determination assumes the value of 0.9956 with a standard error for the estimate of ψi = 0.017. The other statistical parameters of the matrix also confirm an excellent correlation between the data examined. The linear thermal transmission coefficient for the junction between wall and floor, with any thermal insulation, can be calculated as follows:
By applying the Equation (4) to the 216 case studies examined, a maximum percentage variation of 4%, as reported in the Table A1 of Appendix A, was verified between the data calculated by means of THERM 7.4. Figure 12 shows the data derived by the calculation of ψi by THERM 7.4 and the application of Equation (4).
4. Discussion and Conclusions
Although several technologies are currently available on the market that allow one to limit the main constructive thermal bridges, their calculation at the design level is little understood, and even less practiced. This study provides an analytical tool to calculate one of the most common technical solutions in industrialized constructions (RC wall/RC floor) and similar technical solutions, different by type, dimensions and constituent materials. Based on the calculation of 216 solutions of this junction, the results allowed the determining of a common trend that was translated into a non-linear regression. The correspondence of the results obtained by the tool was confirmed by correlation with those ones calculated by means of the finite element method. The mean square deviation error was calculated between the two methods, resulting in a maximum percentage variation of 4%, significantly reducing the existing difference between the finite element method and the catalogues and atlases. Equation (4) also allows for the optimization of this construction junction, producing structural thermal bridges, due to the discontinuity of materials, determining the optimal thickness of the thermal insulation layer. The study demonstrates that the main technical element influencing the thermal transmission of an RC wall is the insulating layer. Therefore, the results of this study can also be used to estimate the values of other thermal bridges with construction systems similar to those studied here, possibly applying a safety margin to the values obtained. In addition, the adopted analytical methodology can be applied to determine other general correlations for other recurrent thermal bridges, giving to designers an efficient tool, and thus avoiding the use of atlases and catalogs.
Author Contributions
Conceptualization, T.B. and A.C.; state of the art and introduction, D.E., methodology, T.B.; case study and simulations A.C.; validation, T.B., A.C. and D.E.; writing—review and editing, T.B., A.C. and D.E. All authors have read and agreed to the published version of the manuscript.
Funding
This research received no external funding
Conflicts of Interest
The authors declare no conflict of interest.
Appendix A
The calculation sheet reported in Appendix A demonstrates the assessment of the linear thermal transmittance for the overall 216 case studies of thermal bridges analyzed in this study, and also demonstrates a maximum percentage variation of 4% between the data calculated by means of THERM 7.4 and Equation (4).

Table A1.
Data sheet of the linear thermal transmittance percentage variation.
| Type of Floor | dp | di | Ψi THERM 7.4 | ds | dpi = dp + di | Upi | Up | Us | Ψi Equation (4) | ΔΨi |
|---|---|---|---|---|---|---|---|---|---|---|
| Reinforced concrete slab | 0.14 | 0.02 | 0.957 | 0.160 | 0.160 | 128.454 | 359.081 | 313.077 | 0.926 | −3.18% |
| 0.04 | 1.049 | 0.160 | 0.180 | 0.78217 | 359.081 | 313.077 | 1.058 | 0.85% | ||
| 0.06 | 1.054 | 0.160 | 0.200 | 0.56228 | 359.081 | 313.077 | 1.077 | 2.18% | ||
| 0.08 | 1.033 | 0.160 | 0.220 | 0.43889 | 359.081 | 313.077 | 1.054 | 2.08% | ||
| 0.10 | 1.003 | 0.160 | 0.240 | 0.35991 | 359.081 | 313.077 | 1.014 | 1.04% | ||
| 0.16 | 0.02 | 0.927 | 0.160 | 0.180 | 127.035 | 348.208 | 313.077 | 0.915 | −1.28% | |
| 0.04 | 1.025 | 0.160 | 0.200 | 0.77689 | 348.208 | 313.077 | 1.041 | 1.59% | ||
| 0.06 | 1.032 | 0.160 | 0.220 | 0.55954 | 348.208 | 313.077 | 1.059 | 2.60% | ||
| 0.08 | 1.015 | 0.160 | 0.240 | 0.43722 | 348.208 | 313.077 | 1.036 | 2.12% | ||
| 0.10 | 0.987 | 0.160 | 0.260 | 0.35879 | 348.208 | 313.077 | 0.996 | 0.88% | ||
| 0.18 | 0.02 | 0.901 | 0.160 | 0.200 | 125.647 | 337.975 | 313.077 | 0.901 | 0.01% | |
| 0.04 | 1.003 | 0.160 | 0.220 | 0.77168 | 337.975 | 313.077 | 1.021 | 1.82% | ||
| 0.06 | 1.012 | 0.160 | 0.240 | 0.55683 | 337.975 | 313.077 | 1.038 | 2.54% | ||
| 0.08 | 0.997 | 0.160 | 0.260 | 0.43556 | 337.975 | 313.077 | 1.015 | 1.77% | ||
| 0.10 | 0.972 | 0.160 | 0.280 | 0.35767 | 337.975 | 313.077 | 0.975 | 0.28% | ||
| 0.20 | 0.02 | 0.872 | 0.160 | 0.220 | 124.289 | 328.326 | 313.077 | 0.884 | 1.37% | |
| 0.04 | 0.977 | 0.160 | 0.240 | 0.76653 | 328.326 | 313.077 | 0.999 | 2.27% | ||
| 0.06 | 0.993 | 0.160 | 0.260 | 0.55415 | 328.326 | 313.077 | 1.014 | 2.11% | ||
| 0.08 | 0.981 | 0.160 | 0.280 | 0.43392 | 328.326 | 313.077 | 0.991 | 1.02% | ||
| 0.10 | 0.957 | 0.160 | 0.300 | 0.35656 | 328.326 | 313.077 | 0.952 | −0.48% | ||
| 0.14 | 0.02 | 1.041 | 0.200 | 0.160 | 128.454 | 359.081 | 296.911 | 1.002 | −3.73% | |
| 0.04 | 1.152 | 0.200 | 0.180 | 0.78217 | 359.081 | 296.911 | 1.144 | −0.71% | ||
| 0.06 | 1.165 | 0.200 | 0.200 | 0.56228 | 359.081 | 296.911 | 1.165 | 0.00% | ||
| 0.08 | 1.147 | 0.200 | 0.220 | 0.43889 | 359.081 | 296.911 | 1.140 | −0.56% | ||
| 0.10 | 1.113 | 0.200 | 0.240 | 0.35991 | 359.081 | 296.911 | 1.096 | −1.53% | ||
| 0.16 | 0.02 | 1.008 | 0.200 | 0.180 | 127.035 | 348.208 | 296.911 | 0.989 | −1.80% | |
| 0.04 | 1.128 | 0.200 | 0.200 | 0.77689 | 348.208 | 296.911 | 1.126 | −0.24% | ||
| 0.06 | 1.138 | 0.200 | 0.220 | 0.55954 | 348.208 | 296.911 | 1.145 | 0.57% | ||
| 0.08 | 1.125 | 0.200 | 0.240 | 0.43722 | 348.208 | 296.911 | 1.120 | −0.39% | ||
| 0.10 | 1.093 | 0.200 | 0.260 | 0.35879 | 348.208 | 296.911 | 1.077 | −1.51% | ||
| 0.18 | 0.02 | 0.977 | 0.200 | 0.200 | 125.647 | 337.975 | 296.911 | 0.974 | −0.34% | |
| 0.04 | 1.096 | 0.200 | 0.220 | 0.77168 | 337.975 | 296.911 | 1.104 | 0.75% | ||
| 0.06 | 1.116 | 0.200 | 0.240 | 0.55683 | 337.975 | 296.911 | 1.122 | 0.53% | ||
| 0.08 | 1.105 | 0.200 | 0.260 | 0.43556 | 337.975 | 296.911 | 1.097 | −0.66% | ||
| 0.10 | 1.076 | 0.200 | 0.280 | 0.35767 | 337.975 | 296.911 | 1.055 | −2.01% | ||
| 0.20 | 0.02 | 0.947 | 0.200 | 0.220 | 124.289 | 328.326 | 296.911 | 0.956 | 0.99% | |
| 0.04 | 1.071 | 0.200 | 0.240 | 0.76653 | 328.326 | 296.911 | 1.080 | 0.88% | ||
| 0.06 | 1.094 | 0.200 | 0.260 | 0.55415 | 328.326 | 296.911 | 1.096 | 0.22% | ||
| 0.08 | 1.086 | 0.200 | 0.280 | 0.43392 | 328.326 | 296.911 | 1.072 | −1.30% | ||
| 0.10 | 1.059 | 0.200 | 0.300 | 0.35656 | 328.326 | 296.911 | 1.030 | −2.73% | ||
| 0.14 | 0.02 | 1.121 | 0.240 | 0.160 | 128.454 | 359.081 | 282.332 | 1.091 | −2.66% | |
| 0.04 | 1.246 | 0.240 | 0.180 | 0.78217 | 359.081 | 282.332 | 1.246 | 0.00% | ||
| 0.06 | 1.265 | 0.240 | 0.200 | 0.56228 | 359.081 | 282.332 | 1.269 | 0.25% | ||
| 0.08 | 1.250 | 0.240 | 0.220 | 0.43889 | 359.081 | 282.332 | 1.242 | −0.66% | ||
| 0.10 | 1.224 | 0.240 | 0.240 | 0.35991 | 359.081 | 282.332 | 1.194 | −2.44% | ||
| 0.16 | 0.02 | 1.082 | 0.240 | 0.180 | 127.035 | 348.208 | 282.332 | 1.078 | −0.43% | |
| 0.04 | 1.215 | 0.240 | 0.200 | 0.77689 | 348.208 | 282.332 | 1.226 | 0.88% | ||
| 0.06 | 1.239 | 0.240 | 0.220 | 0.55954 | 348.208 | 282.332 | 1.247 | 0.64% | ||
| 0.08 | 1.226 | 0.240 | 0.240 | 0.43722 | 348.208 | 282.332 | 1.220 | −0.45% | ||
| 0.10 | 1.201 | 0.240 | 0.260 | 0.35879 | 348.208 | 282.332 | 1.173 | −2.37% | ||
| 0.18 | 0.02 | 1.049 | 0.240 | 0.200 | 125.647 | 337.975 | 282.332 | 1.061 | 1.10% | |
| 0.04 | 1.186 | 0.240 | 0.220 | 0.77168 | 337.975 | 282.332 | 1.203 | 1.38% | ||
| 0.06 | 1.211 | 0.240 | 0.240 | 0.55683 | 337.975 | 282.332 | 1.222 | 0.90% | ||
| 0.08 | 1.202 | 0.240 | 0.260 | 0.43556 | 337.975 | 282.332 | 1.195 | −0.59% | ||
| 0.10 | 1.182 | 0.240 | 0.280 | 0.35767 | 337.975 | 282.332 | 1.149 | −2.79% | ||
| 0.20 | 0.02 | 1.018 | 0.240 | 0.220 | 124.289 | 328.326 | 282.332 | 1.041 | 2.31% | |
| 0.04 | 1.156 | 0.240 | 0.240 | 0.76653 | 328.326 | 282.332 | 1.176 | 1.79% | ||
| 0.06 | 1.186 | 0.240 | 0.260 | 0.55415 | 328.326 | 282.332 | 1.194 | 0.68% | ||
| 0.08 | 1.181 | 0.240 | 0.280 | 0.43392 | 328.326 | 282.332 | 1.167 | −1.15% | ||
| 0.10 | 1.161 | 0.240 | 0.300 | 0.35656 | 328.326 | 282.332 | 1.122 | −3.40% | ||
| Hollow brick floor | 0.14 | 0.02 | 0.611 | 0.160 | 0.160 | 128.454 | 359.081 | 215.900 | 0.597 | −2.38% |
| 0.04 | 0.690 | 0.160 | 0.180 | 0.78217 | 359.081 | 215.900 | 0.681 | −1.27% | ||
| 0.06 | 0.686 | 0.160 | 0.200 | 0.56228 | 359.081 | 215.900 | 0.694 | 1.16% | ||
| 0.08 | 0.660 | 0.160 | 0.220 | 0.43889 | 359.081 | 215.900 | 0.679 | 2.79% | ||
| 0.10 | 0.630 | 0.160 | 0.240 | 0.35991 | 359.081 | 215.900 | 0.653 | 3.54% | ||
| 0.16 | 0.02 | 0.602 | 0.160 | 0.180 | 127.035 | 348.208 | 215.900 | 0.589 | −2.14% | |
| 0.04 | 0.671 | 0.160 | 0.200 | 0.77689 | 348.208 | 215.900 | 0.670 | −0.15% | ||
| 0.06 | 0.673 | 0.160 | 0.220 | 0.55954 | 348.208 | 215.900 | 0.682 | 1.26% | ||
| 0.08 | 0.650 | 0.160 | 0.240 | 0.43722 | 348.208 | 215.900 | 0.667 | 2.71% | ||
| 0.10 | 0.621 | 0.160 | 0.260 | 0.35879 | 348.208 | 215.900 | 0.641 | 3.22% | ||
| 0.18 | 0.02 | 0.587 | 0.160 | 0.200 | 125.647 | 337.975 | 215.900 | 0.580 | −1.22% | |
| 0.04 | 0.662 | 0.160 | 0.220 | 0.77168 | 337.975 | 215.900 | 0.658 | −0.61% | ||
| 0.06 | 0.663 | 0.160 | 0.240 | 0.55683 | 337.975 | 215.900 | 0.668 | 0.82% | ||
| 0.08 | 0.642 | 0.160 | 0.260 | 0.43556 | 337.975 | 215.900 | 0.653 | 1.79% | ||
| 0.10 | 0.615 | 0.160 | 0.280 | 0.35767 | 337.975 | 215.900 | 0.628 | 2.05% | ||
| 0.20 | 0.02 | 0.570 | 0.160 | 0.220 | 124.289 | 328.326 | 215.900 | 0.569 | −0.11% | |
| 0.04 | 0.649 | 0.160 | 0.240 | 0.76653 | 328.326 | 215.900 | 0.643 | −0.88% | ||
| 0.06 | 0.654 | 0.160 | 0.260 | 0.55415 | 328.326 | 215.900 | 0.653 | −0.25% | ||
| 0.08 | 0.634 | 0.160 | 0.280 | 0.43392 | 328.326 | 215.900 | 0.638 | 0.61% | ||
| 0.10 | 0.608 | 0.160 | 0.300 | 0.35656 | 328.326 | 215.900 | 0.613 | 0.89% | ||
| 0.14 | 0.02 | 0.638 | 0.200 | 0.160 | 128.454 | 359.081 | 194.931 | 0.631 | −1.11% | |
| 0.04 | 0.735 | 0.200 | 0.180 | 0.78217 | 359.081 | 194.931 | 0.721 | −1.98% | ||
| 0.06 | 0.738 | 0.200 | 0.200 | 0.56228 | 359.081 | 194.931 | 0.734 | −0.58% | ||
| 0.08 | 0.715 | 0.200 | 0.220 | 0.43889 | 359.081 | 194.931 | 0.718 | 0.45% | ||
| 0.10 | 0.683 | 0.200 | 0.240 | 0.35991 | 359.081 | 194.931 | 0.691 | 1.16% | ||
| 0.16 | 0.02 | 0.628 | 0.200 | 0.180 | 127.035 | 348.208 | 194.931 | 0.623 | −0.80% | |
| 0.04 | 0.719 | 0.200 | 0.200 | 0.77689 | 348.208 | 194.931 | 0.709 | −1.30% | ||
| 0.06 | 0.724 | 0.200 | 0.220 | 0.55954 | 348.208 | 194.931 | 0.721 | −0.34% | ||
| 0.08 | 0.703 | 0.200 | 0.240 | 0.43722 | 348.208 | 194.931 | 0.706 | 0.40% | ||
| 0.10 | 0.672 | 0.200 | 0.260 | 0.35879 | 348.208 | 194.931 | 0.678 | 0.90% | ||
| 0.18 | 0.02 | 0.612 | 0.200 | 0.200 | 125.647 | 337.975 | 194.931 | 0.614 | 0.28% | |
| 0.04 | 0.705 | 0.200 | 0.220 | 0.77168 | 337.975 | 194.931 | 0.696 | −1.34% | ||
| 0.06 | 0.713 | 0.200 | 0.240 | 0.55683 | 337.975 | 194.931 | 0.707 | −0.83% | ||
| 0.08 | 0.695 | 0.200 | 0.260 | 0.43556 | 337.975 | 194.931 | 0.691 | −0.50% | ||
| 0.10 | 0.666 | 0.200 | 0.280 | 0.35767 | 337.975 | 194.931 | 0.664 | −0.19% | ||
| 0.20 | 0.02 | 0.595 | 0.200 | 0.220 | 124.289 | 328.326 | 194.931 | 0.602 | 1.28% | |
| 0.04 | 0.691 | 0.200 | 0.240 | 0.76653 | 328.326 | 194.931 | 0.681 | −1.57% | ||
| 0.06 | 0.701 | 0.200 | 0.260 | 0.55415 | 328.326 | 194.931 | 0.691 | −1.45% | ||
| 0.08 | 0.686 | 0.200 | 0.280 | 0.43392 | 328.326 | 194.931 | 0.675 | −1.56% | ||
| 0.10 | 0.657 | 0.200 | 0.300 | 0.35656 | 328.326 | 194.931 | 0.649 | −1.28% | ||
| 0.14 | 0.02 | 0.665 | 0.240 | 0.160 | 128.454 | 359.081 | 178.084 | 0.680 | 2.34% | |
| 0.04 | 0.775 | 0.240 | 0.180 | 0.78217 | 359.081 | 178.084 | 0.777 | 0.28% | ||
| 0.06 | 0.784 | 0.240 | 0.200 | 0.56228 | 359.081 | 178.084 | 0.791 | 0.92% | ||
| 0.08 | 0.764 | 0.240 | 0.220 | 0.43889 | 359.081 | 178.084 | 0.774 | 1.37% | ||
| 0.10 | 0.737 | 0.240 | 0.240 | 0.35991 | 359.081 | 178.084 | 0.745 | 1.00% | ||
| 0.16 | 0.02 | 0.651 | 0.240 | 0.180 | 127.035 | 348.208 | 178.084 | 0.672 | 3.22% | |
| 0.04 | 0.754 | 0.240 | 0.200 | 0.77689 | 348.208 | 178.084 | 0.765 | 1.34% | ||
| 0.06 | 0.772 | 0.240 | 0.220 | 0.55954 | 348.208 | 178.084 | 0.778 | 0.76% | ||
| 0.08 | 0.751 | 0.240 | 0.240 | 0.43722 | 348.208 | 178.084 | 0.761 | 1.29% | ||
| 0.10 | 0.726 | 0.240 | 0.260 | 0.35879 | 348.208 | 178.084 | 0.731 | 0.78% | ||
| 0.18 | 0.02 | 0.634 | 0.240 | 0.200 | 125.647 | 337.975 | 178.084 | 0.662 | 4.31% | |
| 0.04 | 0.745 | 0.240 | 0.220 | 0.77168 | 337.975 | 178.084 | 0.750 | 0.62% | ||
| 0.06 | 0.757 | 0.240 | 0.240 | 0.55683 | 337.975 | 178.084 | 0.762 | 0.71% | ||
| 0.08 | 0.742 | 0.240 | 0.260 | 0.43556 | 337.975 | 178.084 | 0.745 | 0.52% | ||
| 0.10 | 0.718 | 0.240 | 0.280 | 0.35767 | 337.975 | 178.084 | 0.716 | −0.27% | ||
| 0.20 | 0.02 | 0.619 | 0.240 | 0.220 | 124.289 | 328.326 | 178.084 | 0.649 | 4.95% | |
| 0.04 | 0.728 | 0.240 | 0.240 | 0.76653 | 328.326 | 178.084 | 0.734 | 0.75% | ||
| 0.06 | 0.746 | 0.240 | 0.260 | 0.55415 | 328.326 | 178.084 | 0.745 | −0.25% | ||
| 0.08 | 0.732 | 0.240 | 0.280 | 0.43392 | 328.326 | 178.084 | 0.728 | −0.52% | ||
| 0.10 | 0.709 | 0.240 | 0.300 | 0.35656 | 328.326 | 178.084 | 0.699 | −1.30% | ||
| Predalles floor | 0.14 | 0.02 | 0.562 | 0.160 | 0.160 | 128.454 | 359.081 | 196.885 | 0.547 | −2.62% |
| 0.04 | 0.639 | 0.160 | 0.180 | 0.78217 | 359.081 | 196.885 | 0.625 | −2.19% | ||
| 0.06 | 0.634 | 0.160 | 0.200 | 0.56228 | 359.081 | 196.885 | 0.636 | 0.36% | ||
| 0.08 | 0.610 | 0.160 | 0.220 | 0.43889 | 359.081 | 196.885 | 0.623 | 2.11% | ||
| 0.10 | 0.581 | 0.160 | 0.240 | 0.35991 | 359.081 | 196.885 | 0.599 | 3.08% | ||
| 0.16 | 0.02 | 0.555 | 0.160 | 0.180 | 127.035 | 348.208 | 196.885 | 0.541 | −2.61% | |
| 0.04 | 0.622 | 0.160 | 0.200 | 0.77689 | 348.208 | 196.885 | 0.615 | −1.12% | ||
| 0.06 | 0.623 | 0.160 | 0.220 | 0.55954 | 348.208 | 196.885 | 0.625 | 0.40% | ||
| 0.08 | 0.600 | 0.160 | 0.240 | 0.43722 | 348.208 | 196.885 | 0.612 | 2.01% | ||
| 0.10 | 0.572 | 0.160 | 0.260 | 0.35879 | 348.208 | 196.885 | 0.588 | 2.85% | ||
| 0.18 | 0.02 | 0.541 | 0.160 | 0.200 | 125.647 | 337.975 | 196.885 | 0.532 | −1.70% | |
| 0.04 | 0.613 | 0.160 | 0.220 | 0.77168 | 337.975 | 196.885 | 0.603 | −1.62% | ||
| 0.06 | 0.614 | 0.160 | 0.240 | 0.55683 | 337.975 | 196.885 | 0.613 | −0.11% | ||
| 0.08 | 0.593 | 0.160 | 0.260 | 0.43556 | 337.975 | 196.885 | 0.600 | 1.04% | ||
| 0.10 | 0.568 | 0.160 | 0.280 | 0.35767 | 337.975 | 196.885 | 0.576 | 1.50% | ||
| 0.20 | 0.02 | 0.525 | 0.160 | 0.220 | 124.289 | 328.326 | 196.885 | 0.522 | −0.53% | |
| 0.04 | 0.602 | 0.160 | 0.240 | 0.76653 | 328.326 | 196.885 | 0.590 | −1.98% | ||
| 0.06 | 0.607 | 0.160 | 0.260 | 0.55415 | 328.326 | 196.885 | 0.599 | −1.33% | ||
| 0.08 | 0.587 | 0.160 | 0.280 | 0.43392 | 328.326 | 196.885 | 0.586 | −0.24% | ||
| 0.10 | 0.561 | 0.160 | 0.300 | 0.35656 | 328.326 | 196.885 | 0.563 | 0.29% | ||
| 0.14 | 0.02 | 0.598 | 0.200 | 0.160 | 128.454 | 359.081 | 177.827 | 0.584 | −2.32% | |
| 0.04 | 0.693 | 0.200 | 0.180 | 0.78217 | 359.081 | 177.827 | 0.667 | −3.75% | ||
| 0.06 | 0.696 | 0.200 | 0.200 | 0.56228 | 359.081 | 177.827 | 0.679 | −2.43% | ||
| 0.08 | 0.673 | 0.200 | 0.220 | 0.43889 | 359.081 | 177.827 | 0.665 | −1.22% | ||
| 0.10 | 0.642 | 0.200 | 0.240 | 0.35991 | 359.081 | 177.827 | 0.639 | −0.44% | ||
| 0.16 | 0.02 | 0.581 | 0.200 | 0.180 | 127.035 | 348.208 | 177.827 | 0.577 | −0.71% | |
| 0.04 | 0.669 | 0.200 | 0.200 | 0.77689 | 348.208 | 177.827 | 0.656 | −1.88% | ||
| 0.06 | 0.674 | 0.200 | 0.220 | 0.55954 | 348.208 | 177.827 | 0.668 | −0.95% | ||
| 0.08 | 0.653 | 0.200 | 0.240 | 0.43722 | 348.208 | 177.827 | 0.653 | 0.04% | ||
| 0.10 | 0.632 | 0.200 | 0.260 | 0.35879 | 348.208 | 177.827 | 0.628 | −0.65% | ||
| 0.18 | 0.02 | 0.566 | 0.200 | 0.200 | 125.647 | 337.975 | 177.827 | 0.568 | 0.33% | |
| 0.04 | 0.657 | 0.200 | 0.220 | 0.77168 | 337.975 | 177.827 | 0.644 | −2.00% | ||
| 0.06 | 0.664 | 0.200 | 0.240 | 0.55683 | 337.975 | 177.827 | 0.654 | −1.48% | ||
| 0.08 | 0.646 | 0.200 | 0.260 | 0.43556 | 337.975 | 177.827 | 0.640 | −0.95% | ||
| 0.10 | 0.618 | 0.200 | 0.280 | 0.35767 | 337.975 | 177.827 | 0.615 | −0.50% | ||
| 0.20 | 0.02 | 0.550 | 0.200 | 0.220 | 124.289 | 328.326 | 177.827 | 0.557 | 1.34% | |
| 0.04 | 0.644 | 0.200 | 0.240 | 0.76653 | 328.326 | 177.827 | 0.630 | −2.21% | ||
| 0.06 | 0.653 | 0.200 | 0.260 | 0.55415 | 328.326 | 177.827 | 0.639 | −2.11% | ||
| 0.08 | 0.638 | 0.200 | 0.280 | 0.43392 | 328.326 | 177.827 | 0.625 | −2.04% | ||
| 0.10 | 0.610 | 0.200 | 0.300 | 0.35656 | 328.326 | 177.827 | 0.600 | −1.56% | ||
| 0.14 | 0.02 | 0.618 | 0.240 | 0.160 | 128.454 | 359.081 | 163.004 | 0.635 | 2.76% | |
| 0.04 | 0.727 | 0.240 | 0.180 | 0.78217 | 359.081 | 163.004 | 0.726 | −0.17% | ||
| 0.06 | 0.735 | 0.240 | 0.200 | 0.56228 | 359.081 | 163.004 | 0.739 | 0.46% | ||
| 0.08 | 0.716 | 0.240 | 0.220 | 0.43889 | 359.081 | 163.004 | 0.723 | 0.98% | ||
| 0.10 | 0.690 | 0.240 | 0.240 | 0.35991 | 359.081 | 163.004 | 0.695 | 0.77% | ||
| 0.16 | 0.02 | 0.607 | 0.240 | 0.180 | 127.035 | 348.208 | 163.004 | 0.628 | 3.46% | |
| 0.04 | 0.713 | 0.240 | 0.200 | 0.77689 | 348.208 | 163.004 | 0.714 | 0.12% | ||
| 0.06 | 0.725 | 0.240 | 0.220 | 0.55954 | 348.208 | 163.004 | 0.726 | 0.21% | ||
| 0.08 | 0.706 | 0.240 | 0.240 | 0.43722 | 348.208 | 163.004 | 0.711 | 0.66% | ||
| 0.10 | 0.681 | 0.240 | 0.260 | 0.35879 | 348.208 | 163.004 | 0.683 | 0.30% | ||
| 0.18 | 0.02 | 0.592 | 0.240 | 0.200 | 125.647 | 337.975 | 163.004 | 0.618 | 4.42% | |
| 0.04 | 0.700 | 0.240 | 0.220 | 0.77168 | 337.975 | 163.004 | 0.701 | 0.03% | ||
| 0.06 | 0.711 | 0.240 | 0.240 | 0.55683 | 337.975 | 163.004 | 0.712 | 0.13% | ||
| 0.08 | 0.696 | 0.240 | 0.260 | 0.43556 | 337.975 | 163.004 | 0.696 | 0.05% | ||
| 0.10 | 0.673 | 0.240 | 0.280 | 0.35767 | 337.975 | 163.004 | 0.669 | −0.64% | ||
| 0.20 | 0.02 | 0.577 | 0.240 | 0.220 | 124.289 | 328.326 | 163.004 | 0.606 | 5.10% | |
| 0.04 | 0.684 | 0.240 | 0.240 | 0.76653 | 328.326 | 163.004 | 0.685 | 0.17% | ||
| 0.06 | 0.702 | 0.240 | 0.260 | 0.55415 | 328.326 | 163.004 | 0.695 | −0.89% | ||
| 0.08 | 0.687 | 0.240 | 0.280 | 0.43392 | 328.326 | 163.004 | 0.680 | −1.03% | ||
| 0.10 | 0.664 | 0.240 | 0.300 | 0.35656 | 328.326 | 163.004 | 0.653 | −1.66% |
References
- World Health Organization. Technical and Policy Recommendations to Reduce Health Risks Due to Dampness and Mould; Project Report; WHO: Copenhagen, Denmark, 2009. [Google Scholar]
- Hanafi, M.H.; Umar, M.U.; Razak, A.A.; Rashid, Z.Z.A.; Noriman, N.Z.; Dahham, O.S. An introduction to thermal bridge assessment and mould risk at dampness surface for heritage building. IOP Conf. Ser. Mater. Sci. Eng. 2018, 454, 1–8. [Google Scholar] [CrossRef]
- Fantucci, S.; Isaia, F.; Serra, V.; Dutto, M. Insulating coat to prevent mold growth in thermal bridges. Energy Procedia 2017, 134, 414–422. [Google Scholar] [CrossRef]
- Berggren, B.; Wall, M. State of Knowledge of Thermal Bridges—A Follow up in Sweden and a Review of Recent Research. Sustainability 2018, 8, 154. [Google Scholar] [CrossRef] [Green Version]
- Kalousek, L.; Brzoň, R.; Fišarová, Z. Analysis of thermal bridges in loggias of pre-cast concrete apartment buildings. MATEC Web Conf. 2019, 279, 1–6. [Google Scholar] [CrossRef]
- Jedidi, M.; Benjeddou, O. Effect of thermal bridges on the heat balance of buildings. IJSRCE 2018, 2, 41–49. [Google Scholar]
- Berggren, B.; Wall, M. Calculation of thermal bridges in (Nordic) building envelopes—Risk of performance failure due to inconsistent use of methodology. Energy Buildings 2013, 65, 331–339. [Google Scholar] [CrossRef]
- Citterio, M.; Cocco, M.; Erhorn-Kluttig, H. Thermal bridges in the EBPD context: Overview on MS approaches in regulations. In Build Up. The European Portal for Energy Efficiency in Buildings; Information Paper P64 of the EPBD Buildings Platform, European Communities; 2008; pp. 1–9. Available online: http://www.buildingsplatform.eu/ (accessed on 22 September 2020).
- Kotti, S.; Telia, D.; James, P.A.B. Quantifying thermal bridge effects and assessing retrofit solutions in a Greek residential building. Procedia Environ. Sci. 2017, 38, 306–313. [Google Scholar] [CrossRef]
- Theodosiou, T.G.; Papadopoulos, A.M. The impact of thermal bridges on the energy demand of buildings with double brick wall constructions. Energy Build. 2008, 40, 2083–2089. [Google Scholar] [CrossRef]
- Ilomets, S.; Kuusk, K.; Paap, L.; Arumägi, E.; Kalamees, T. Impact of linear thermal bridges on thermal transmittance of renovated apartment buildings. J. Civ. Eng. Manag. 2016, 1–9. [Google Scholar] [CrossRef]
- Bergero, S.; Chiari, A. The influence of thermal bridge calculation method on the building energy need-: A case study. Energy Proced. 2018, 148, 1042–1049. [Google Scholar] [CrossRef]
- Gao, Y.; Roux, J.J.; Zhao, L.H.; Jiang, Y. Dynamical building simulation: A low order model for thermal bridges losses. Energy Build. 2008, 40, 2236–2243. [Google Scholar] [CrossRef]
- Ben-Nakhi, A.E. Minimizing thermal bridging through window systems in buildings of hot regions. Appl. Therm. Eng. 2002, 22, 989–998. [Google Scholar] [CrossRef]
- Cappelletti, F.; Corrado, V.; Gasparella, A.; Gorrino, A. Detailed assessment of thermal bridges in highly insulated buildings. In Proceedings of the CLIMA 2010, 10th Rehva World Congress Sustainable Energy Use in Buildings, Antalya, Turkey, 9–12 May 2010. [Google Scholar]
- Dilmac, S.; Guner, A.; Senkal, F.; Kartal, S. Simple method for calculation of heat loss through floor/beam-wall intersections according to ISO 9164. Energy Convers Manag. 2007, 48, 826–835. [Google Scholar] [CrossRef]
- Evola, G.; Margani, G.; Marletta, L. Cost-effective design solutions for low-rise residential Net ZEBs in Mediterranean climate. Energy Build. 2014, 68, 7–18. [Google Scholar] [CrossRef]
- Karabulut, K.; Buyruk, E.; Fertelli, A. Numerical investigation of the effect of insulation on heat transfer of thermal bridges with different types. Therm. Sci. 2016, 20, 185–195. [Google Scholar] [CrossRef]
- Ghazi Wakili, K.; Simmler, H.; Frank, T. Experimental and numerical thermal analysis of a balcony board with integrated glass fibre reinforced polymer GFRP elements. Energy Build. 2007, 39, 76–81. [Google Scholar] [CrossRef]
- Baldinelli, G.; Bianchi, F.; Rotili, A.; Costarelli, D.; Seracini, M.; Vinti, G.; Asdrubali, F.; Evangelisti, L. A model for the improvement of thermal bridges quantitative assessment by infrared thermography. Appl Energy 2018, 211, 854–864. [Google Scholar] [CrossRef]
- O’Grady, A.; Lechowska, A.; Harte, A.M. Assessment of thermal bridging heat loss by means of the Infrared thermography technique: Sustainable Buildings in Cold Climates. In Cold Climate HVAC 2018; Springer: Cham, Switzerland, 2019. [Google Scholar] [CrossRef]
- Asdrubali, F.; Baldinelli, G.; Bianchi, F.; Costarelli, D.; Rotili, A.; Seracini, M.; Vinti, G. Detection of thermal bridges from thermographic images by means of image processing approximation algorithms. Appl. Math. Comput. 2018, 317, 160–171. [Google Scholar] [CrossRef]
- Garrido, I.; Lagüela, S.; Arias, P.; Balado, J. Thermal-based analysis for the automatic detection and characterization of thermal bridges in buildings. Energy Build. 2018, 158, 1358–1367. [Google Scholar] [CrossRef]
- Tejedor, B.; Barreira, E.; Almeida, R.M.S.F.; Casals, M. Thermographic 2D U-value map for quantifying thermal bridges in building façades. Energy Build. 2020, 224. [Google Scholar] [CrossRef]
- Ge, J.; Xue, Y.; Fan, Y. Methods for evaluating and improving thermal performance of wall-to-floor thermal bridges. Energy Build. 2020. [Google Scholar] [CrossRef]
- Capozzoli, A.; Corrado, V.; Gorrino, A.; Soma, P. Atlante Nazionale dei Ponti Termici. Conforme alle UNI EN ISO 14683 e UNI EN ISO 10211; Edizioni EDILCLIMA: Novara, Italy, 2011. [Google Scholar]
- Centro per lo Sviluppo Tecnologico, L’energia e la Competitività (CESTEC SPA). Associazione regionale dei costruttori edili lombardi (ANCE Lombardia). In Abaco dei Ponti Termici; Politecnico di Milano: Milano, Italy, 2011. [Google Scholar]
- Office Fédéral de L’ÉNergie (OFEN). Catalogue des Ponts Thermiques; Office Fédéral de L’ÉNergie (OFEN): Bern, Switzerland, 2003. [Google Scholar]
- Ben, L.A. Statistical modelling of heat transfer for thermal bridges of buildings. Energy Build. 2005, 37, 945–951. [Google Scholar] [CrossRef]
- Theodosiou, T.; Tsikaloudaki, K.; Kontoleon, K.; Giarma, C. Assessing the accuracy of predictive thermal bridge heat flow methodologies. Renew. Sust. Energy Rev. 2021, 136. [Google Scholar] [CrossRef]
- Passive House Institute (PHI). Thermal Bridge Catalogue; Passive House Institute: Darmstadt, Germany, 2019. [Google Scholar]
- Carini, A. Housing in Europa; Luigi Parma Editions: Bologna, Italy, 1978. [Google Scholar]
- Basiricò, T.; Bertorotta, S. L‘Industrializzazione nei Quartieri di Edilizia Residenziale Pubblica; ARACNE: Roma, Italy, 2013. [Google Scholar]
- Marchigiani, S. Cooperative edili e industrializzazione: Appunti critici. Edil. Pop. 1978, 142, 47–50. [Google Scholar]
- Basiricò, T.; Cottone, A. Sustainable retrofitting of the ‘70s public housing. In An application to the ZEN 2 district in Palermo. Proceedings of the 30th IAHS Changing, Needs, Adaptive Buildings, Smart Cities; Milano, Italy, 15–17 September 2013, pp. 151–161.
- Basiricò, T. Degrado, Manutenzione, Recupero. Il Caso del Quartiere ZEN 2 a Palermo; Fotograf: Palermo, Italy, 2009. [Google Scholar]
- Zedan, M.F.; Al-Sanea, S.; Al-Mujahid, A.; Al-Suhaibani, Z. Effect of thermal bridges in insulated walls on air-conditioning loads using whole building energy analysis. Sustainability 2016, 8, 560. [Google Scholar] [CrossRef] [Green Version]
- Dell’Acqua, A.C.; Degli Esposti, V.; Ferrante, A.; Mochi, G. Caratteri Tipologici del Costruito e Criteri di Adeguamento Tecnologico e Ambientale; Alinea Editrice: Firenze, Italy, 2011. [Google Scholar]
- Basiricò, T.; Cottone, A. Performance analysis and durability of environmental and energy sustainability interventions on existing buildings. In Proceedings of the XIII International Conference on Durability of Building Materials and Components (DBMC), Sao Paolo, Brasil, 2–5 September 2014; pp. 166–173. [Google Scholar]
- Mineo, A.M. Una Guida All’utilizzo Dell’ambiente Statistico R; Free Software Foundation: Cambridge, MA, USA, 2003. [Google Scholar]
- Venturini, S.; Poli, M. Statistica 4038 (ver.1.2) Software Didattico per L’insegnamento della Statistica; Istituto di Metodi Quantitativi, Università “L. Bocconi”: Milan, Italy, 2001. [Google Scholar]
- Borelli, D.; Cavalletti, P.; Marchitto, A.; Schenone, C. A comprehensive study devoted to determine linear thermal bridges transmittance in existing buildings. Energy Build. 2020, 224. [Google Scholar] [CrossRef]
- National Fenestration Rating Council, Inc. THERM 7, NFRC Simulation Manual; NFRC: Greenbelt, MD, USA, 2017. [Google Scholar]
- Basiricò, T.; Cottone, A. Thermal bridge in industrialized building. The case of reinforced concrete wall/floor junction. In Proceedings of the 42th IAHS World Congress the Housing for the Dignity of Mankind, Naples, Itay, 10–13 April 2018; pp. 109–120. [Google Scholar]
- Lombardy Region, Prezzario Regionale delle Opere Pubbliche. 2020. Available online: https://www.regione.lombardia.it (accessed on 19 November 2020).
Figure 1.
(a) Construction phase of a Cavedone building in Bologna [33]; (b) Three-dimensional scheme of the coffrage-tunnel system [34].

Figure 2.
(a) Construction phase of a Borgo Nuovo building in Palermo [33]; (b) Three-dimensional scheme of the banche et table system [34].
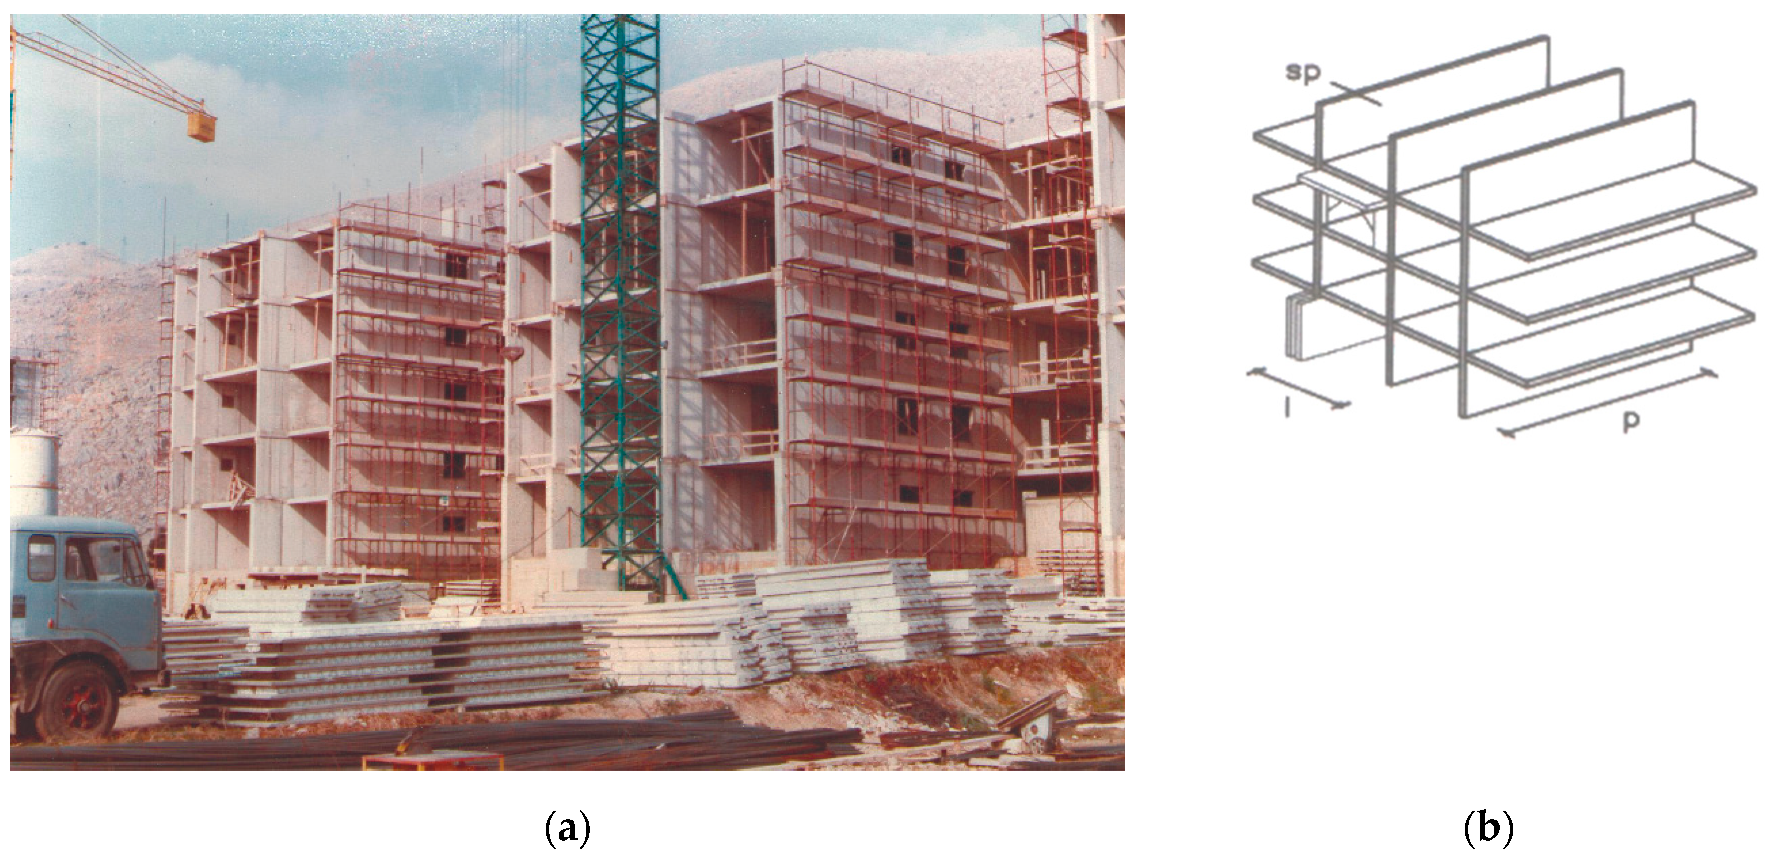
Figure 3.
Typological plan schemes used in some Italian industrialized constructions. (a) Four in-line buildings’ schemes; (b) two in tower buildings’ schemes. Reinforced Concrete (RC) walls are represented with a thicker line.
Figure 3.
Typological plan schemes used in some Italian industrialized constructions. (a) Four in-line buildings’ schemes; (b) two in tower buildings’ schemes. Reinforced Concrete (RC) walls are represented with a thicker line.
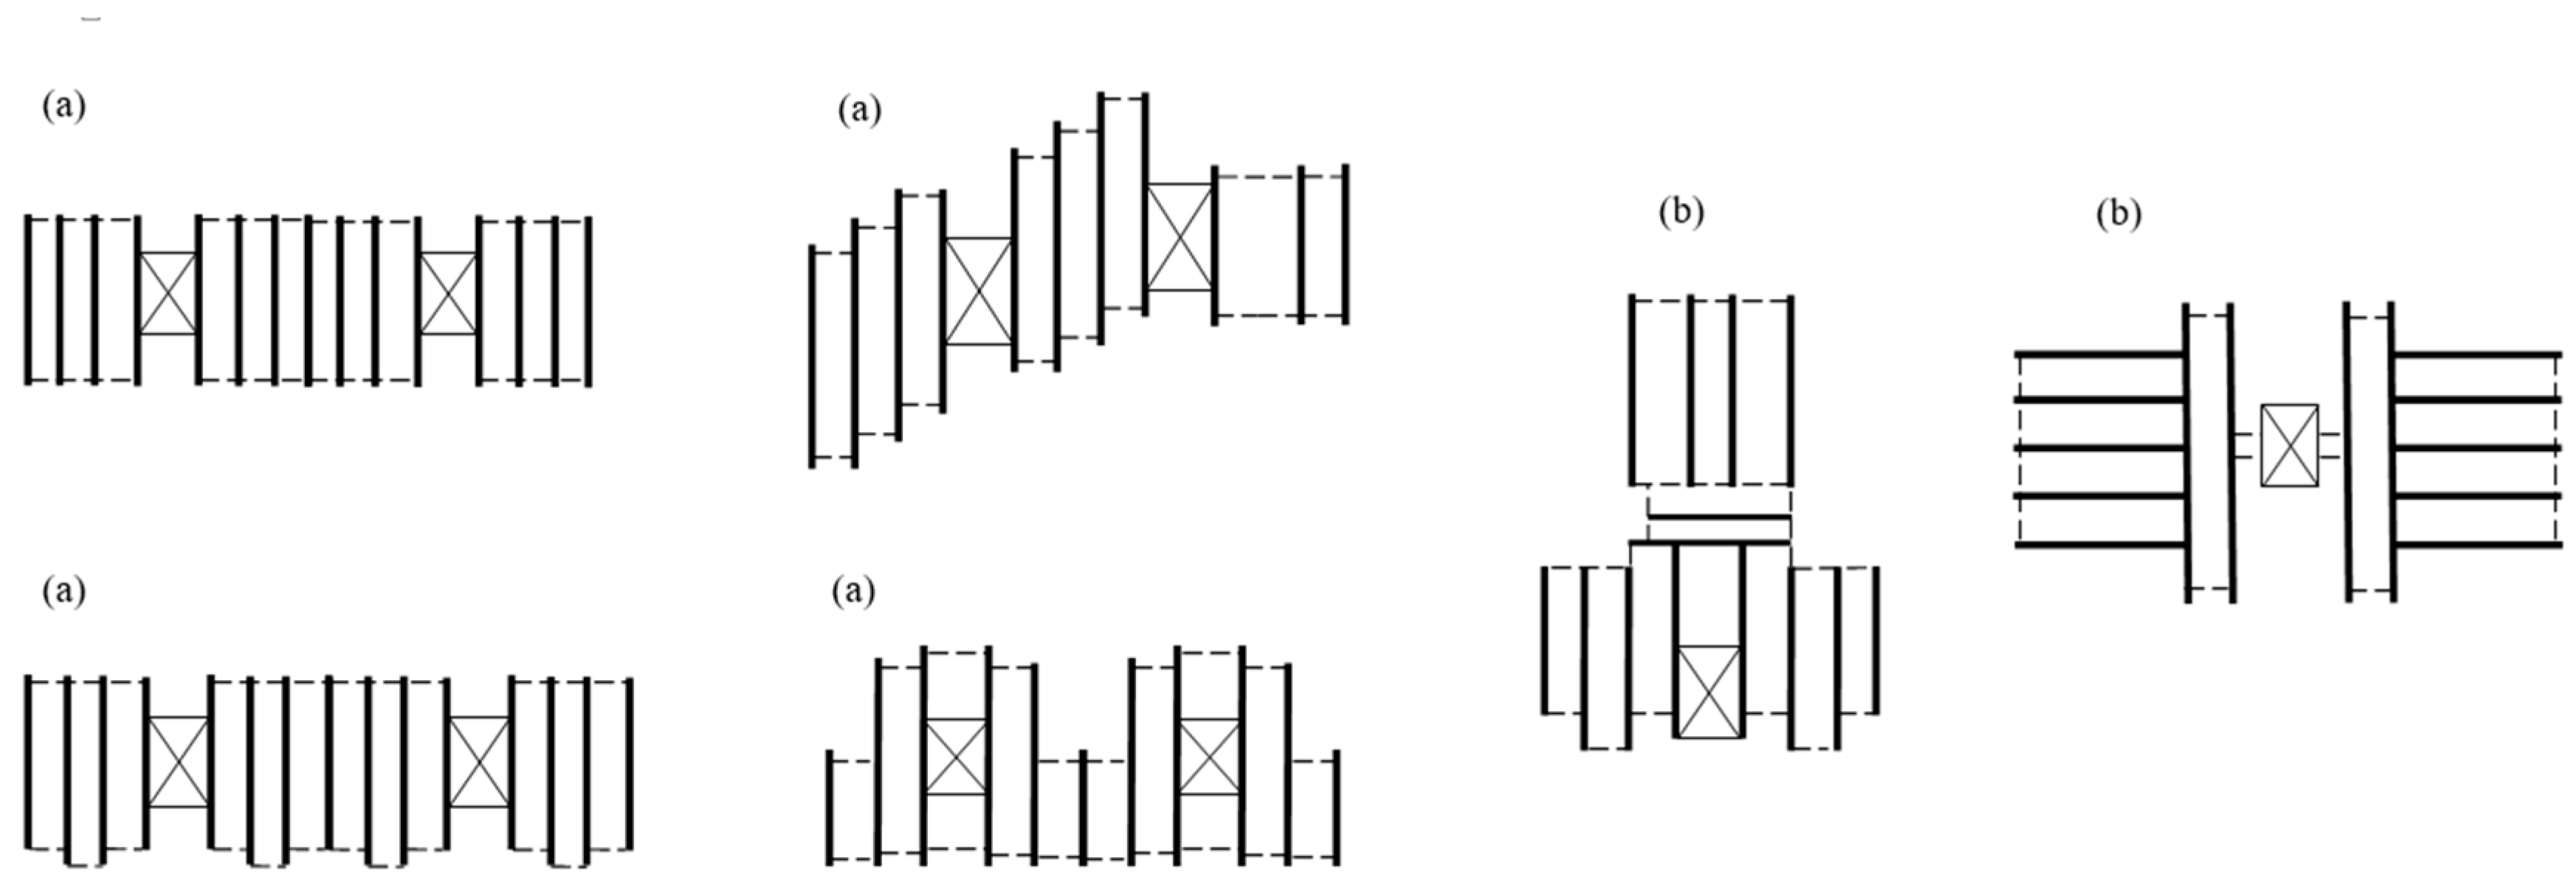
Figure 4.
(a) Floor plan of an apartment in the Sperone district, Palermo [33]; (b) View of the head of building, which the apartment is part of.
Figure 4.
(a) Floor plan of an apartment in the Sperone district, Palermo [33]; (b) View of the head of building, which the apartment is part of.
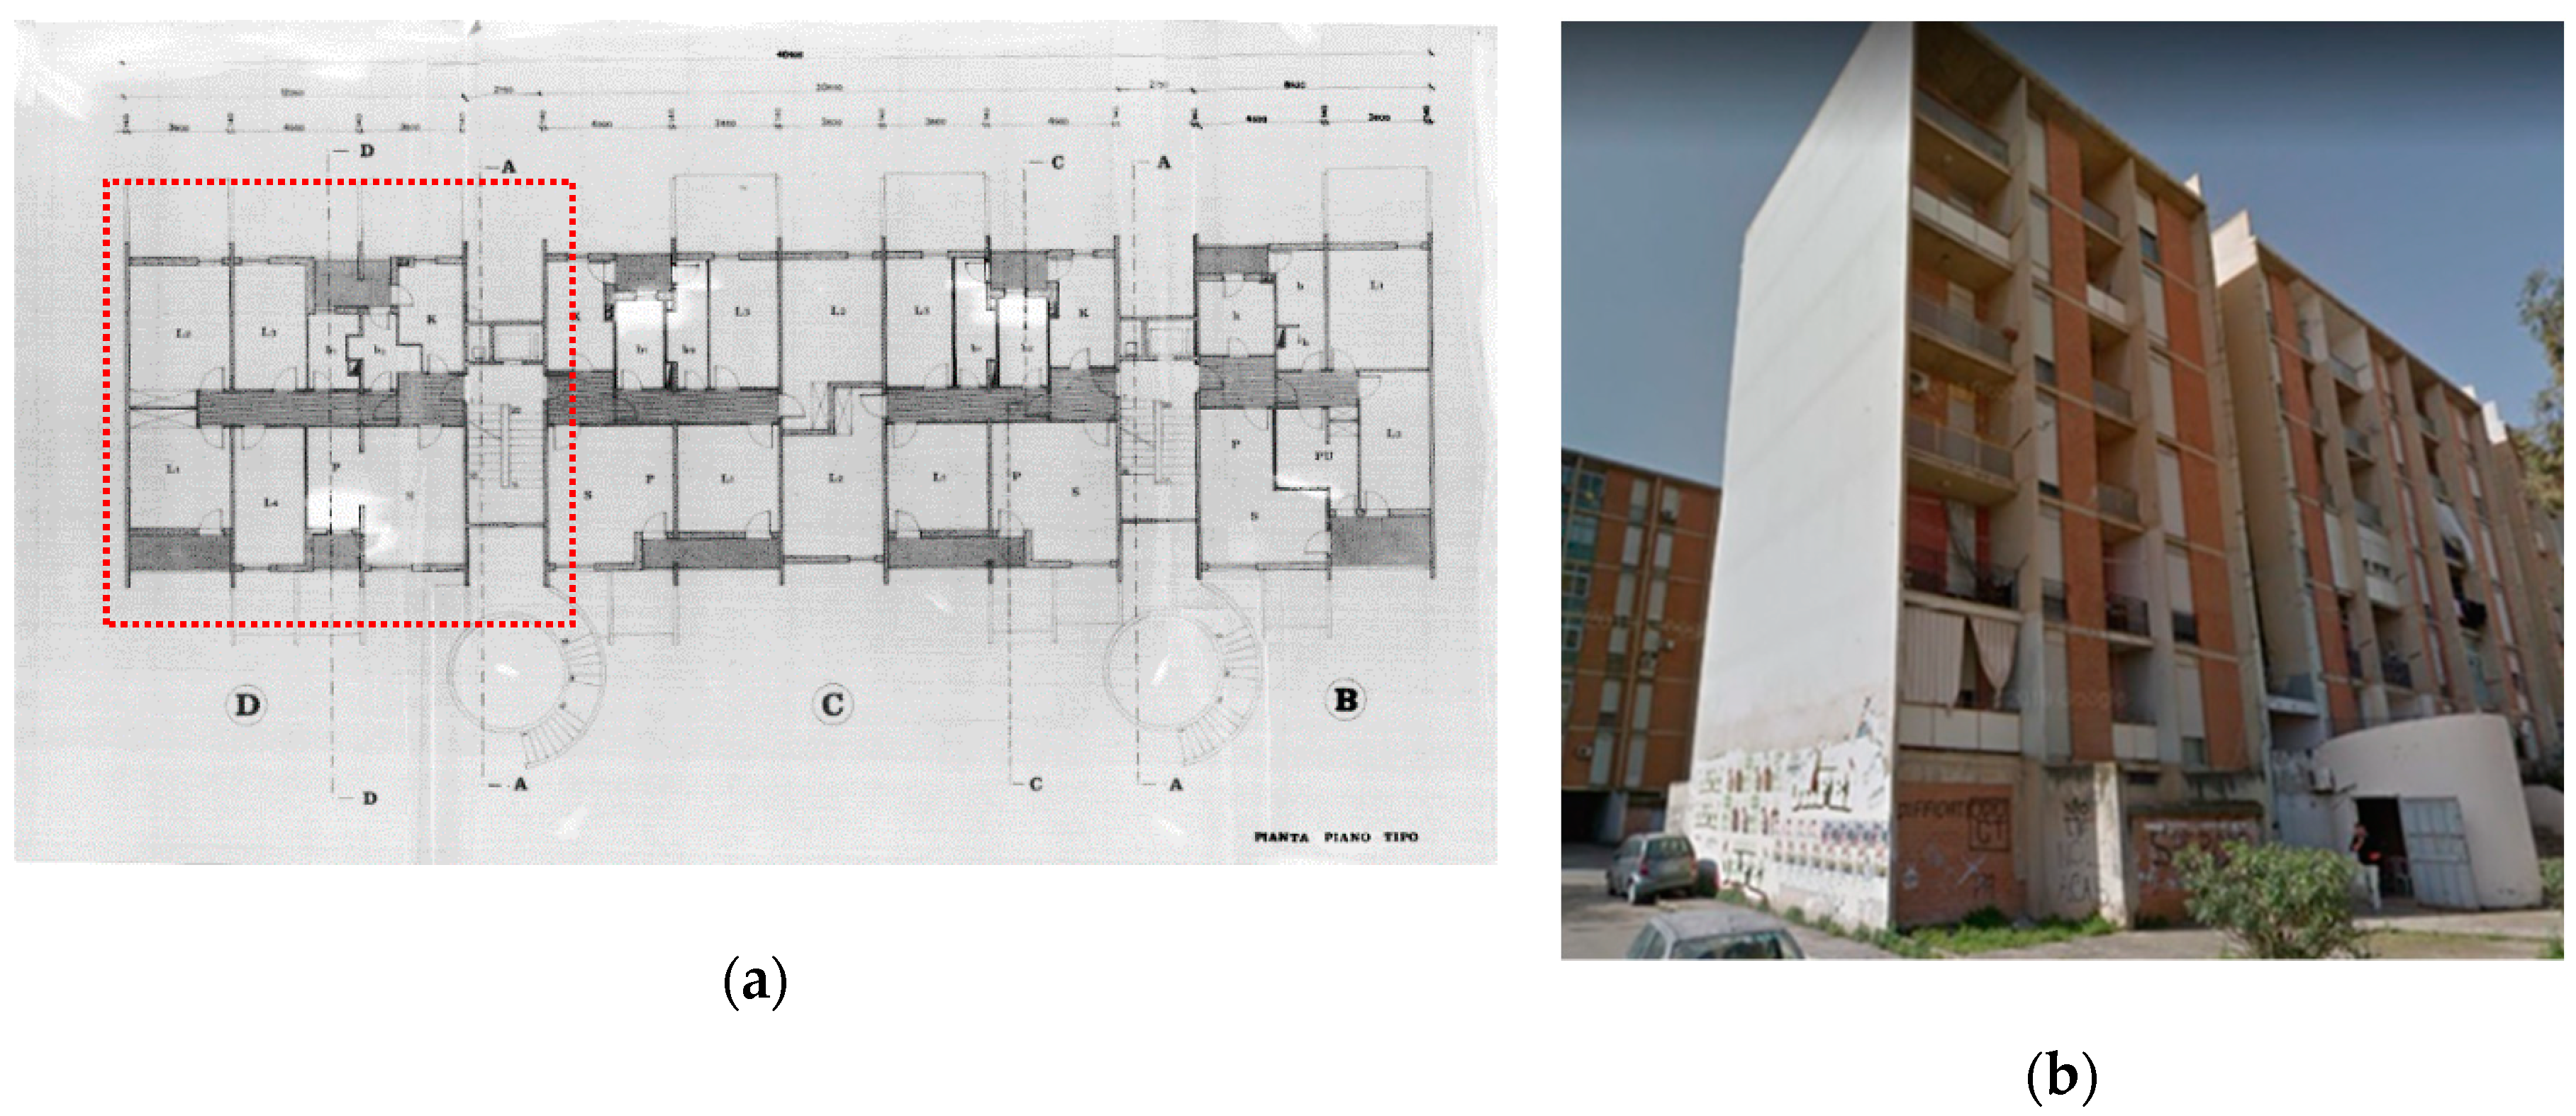
Figure 5.
Identification of thermal bridges in an axonometric projection of a Sperone district building, Palermo.
Figure 5.
Identification of thermal bridges in an axonometric projection of a Sperone district building, Palermo.

Figure 6.
Identification of thermal bridges in an apartment plan of the Sperone district, Palermo.
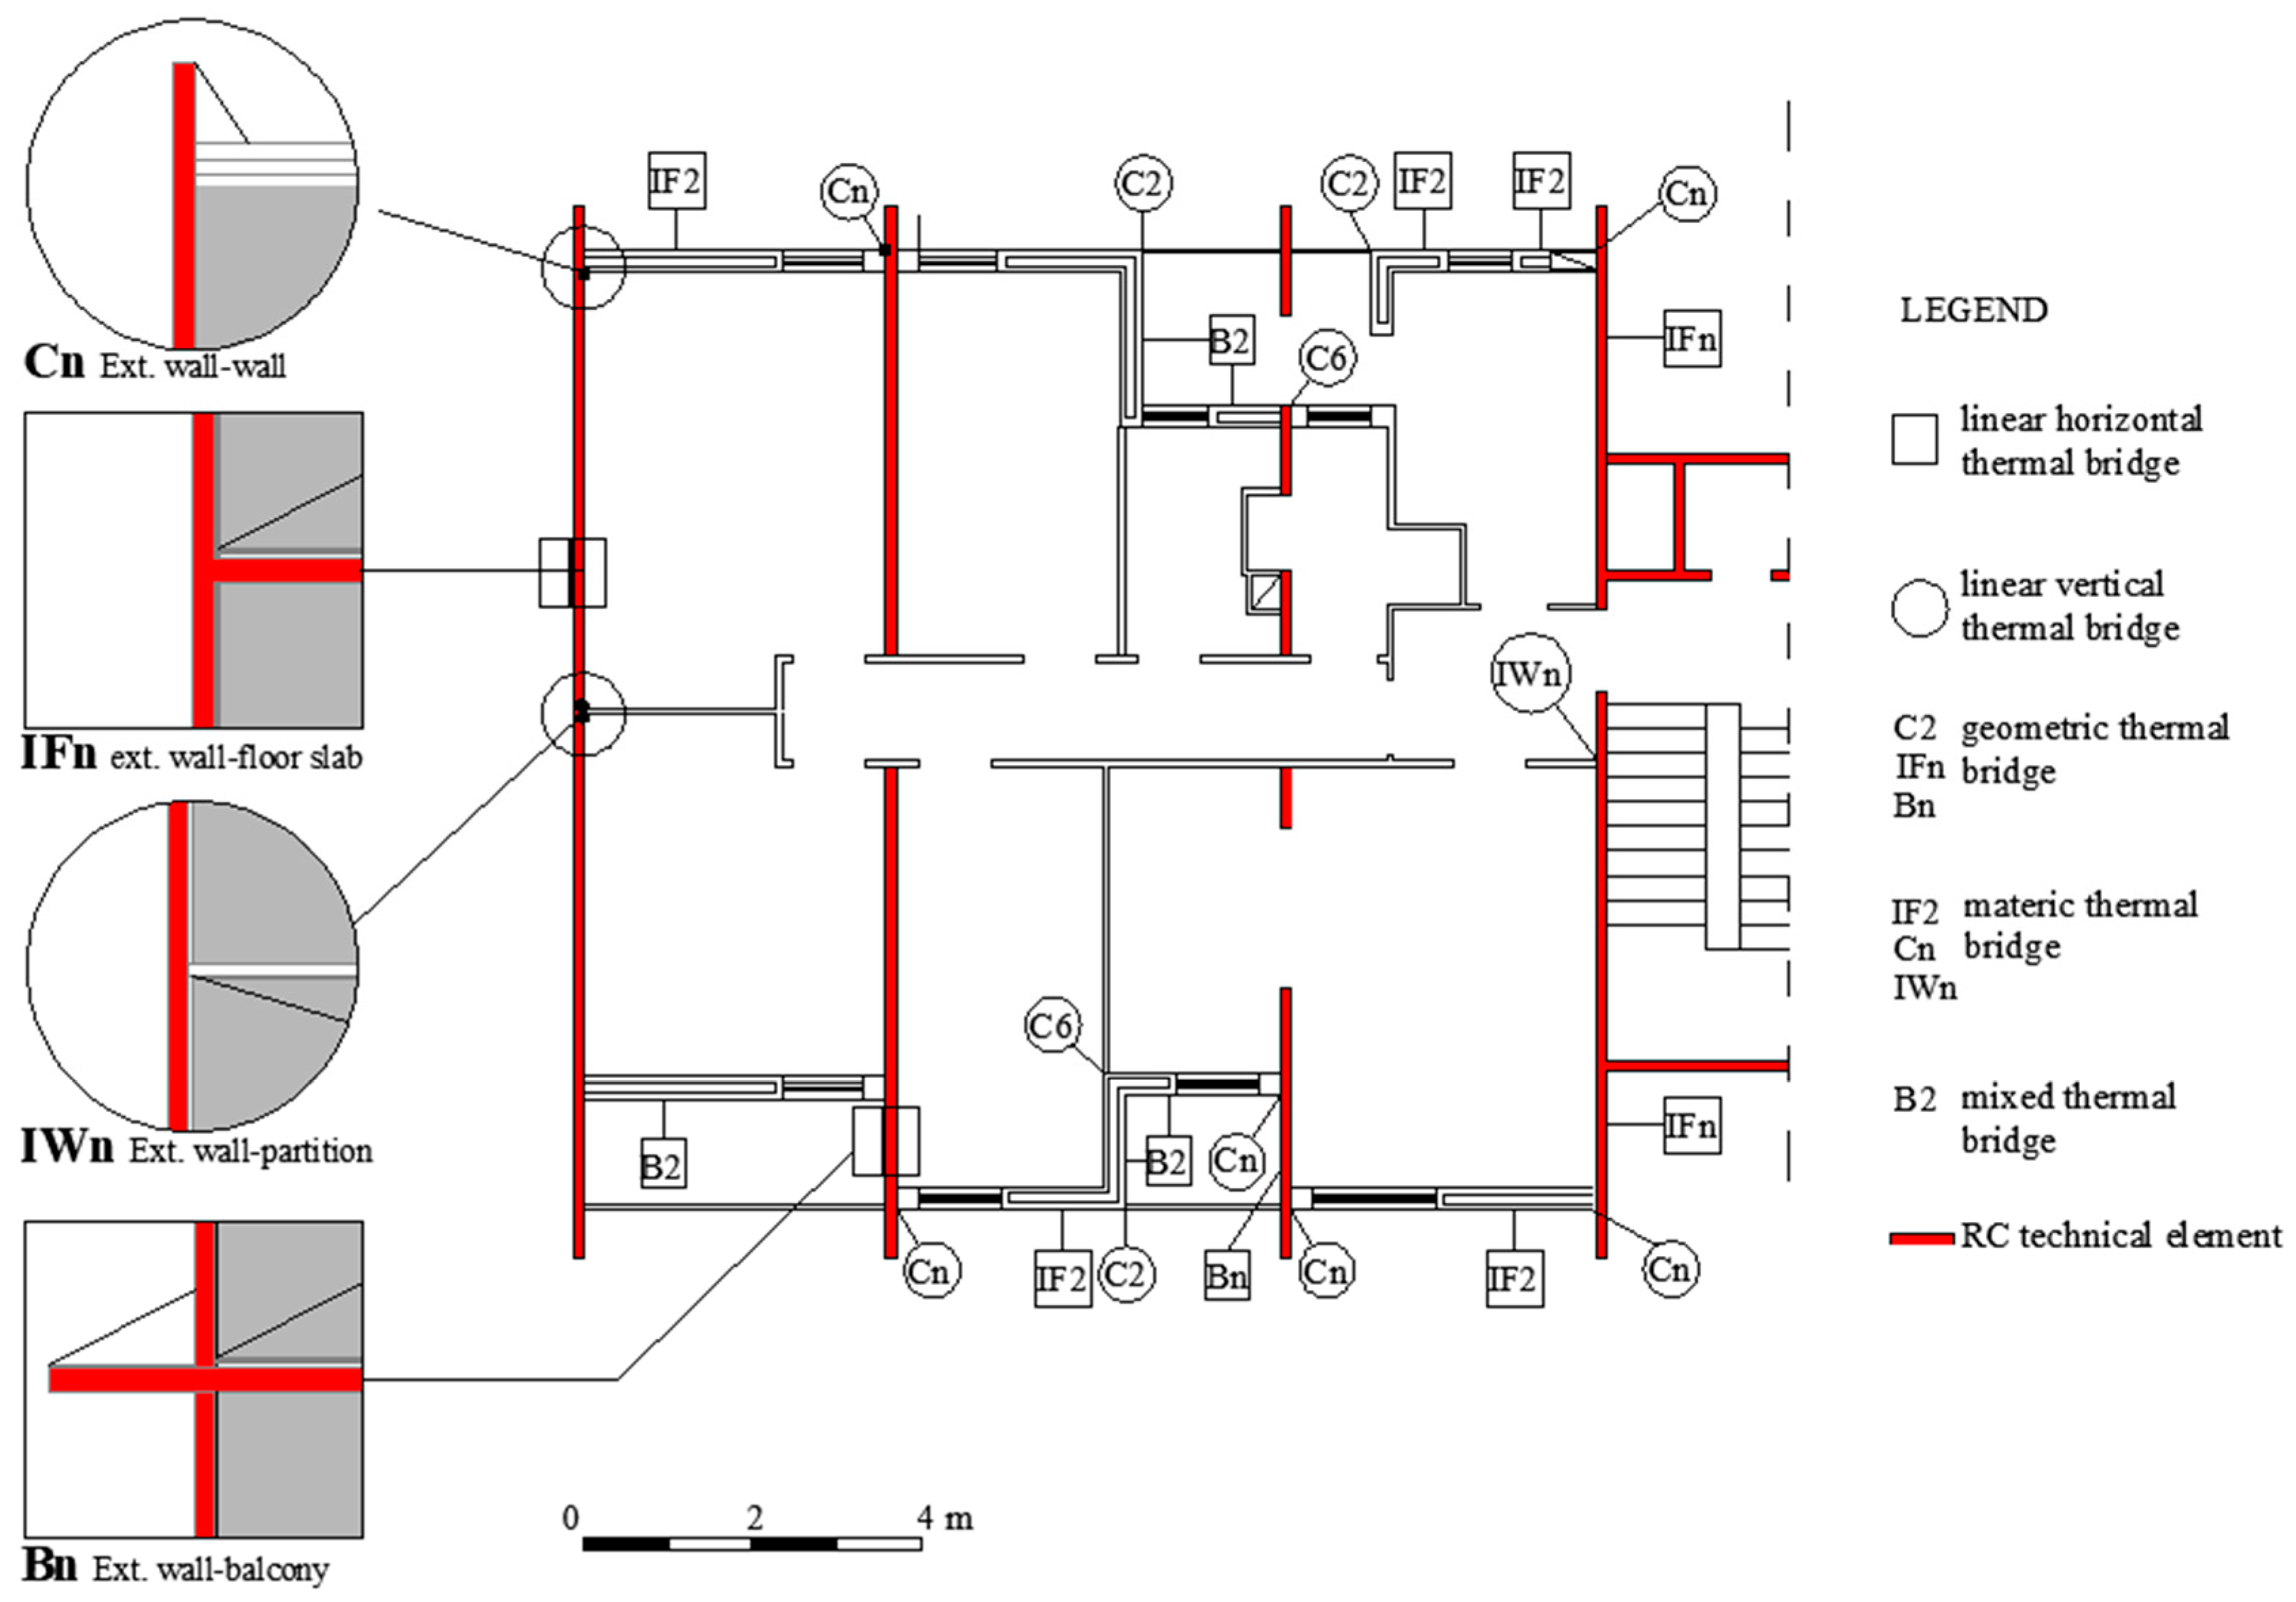
Figure 7.
Types of wall/inter-floor slab junction analyzed.
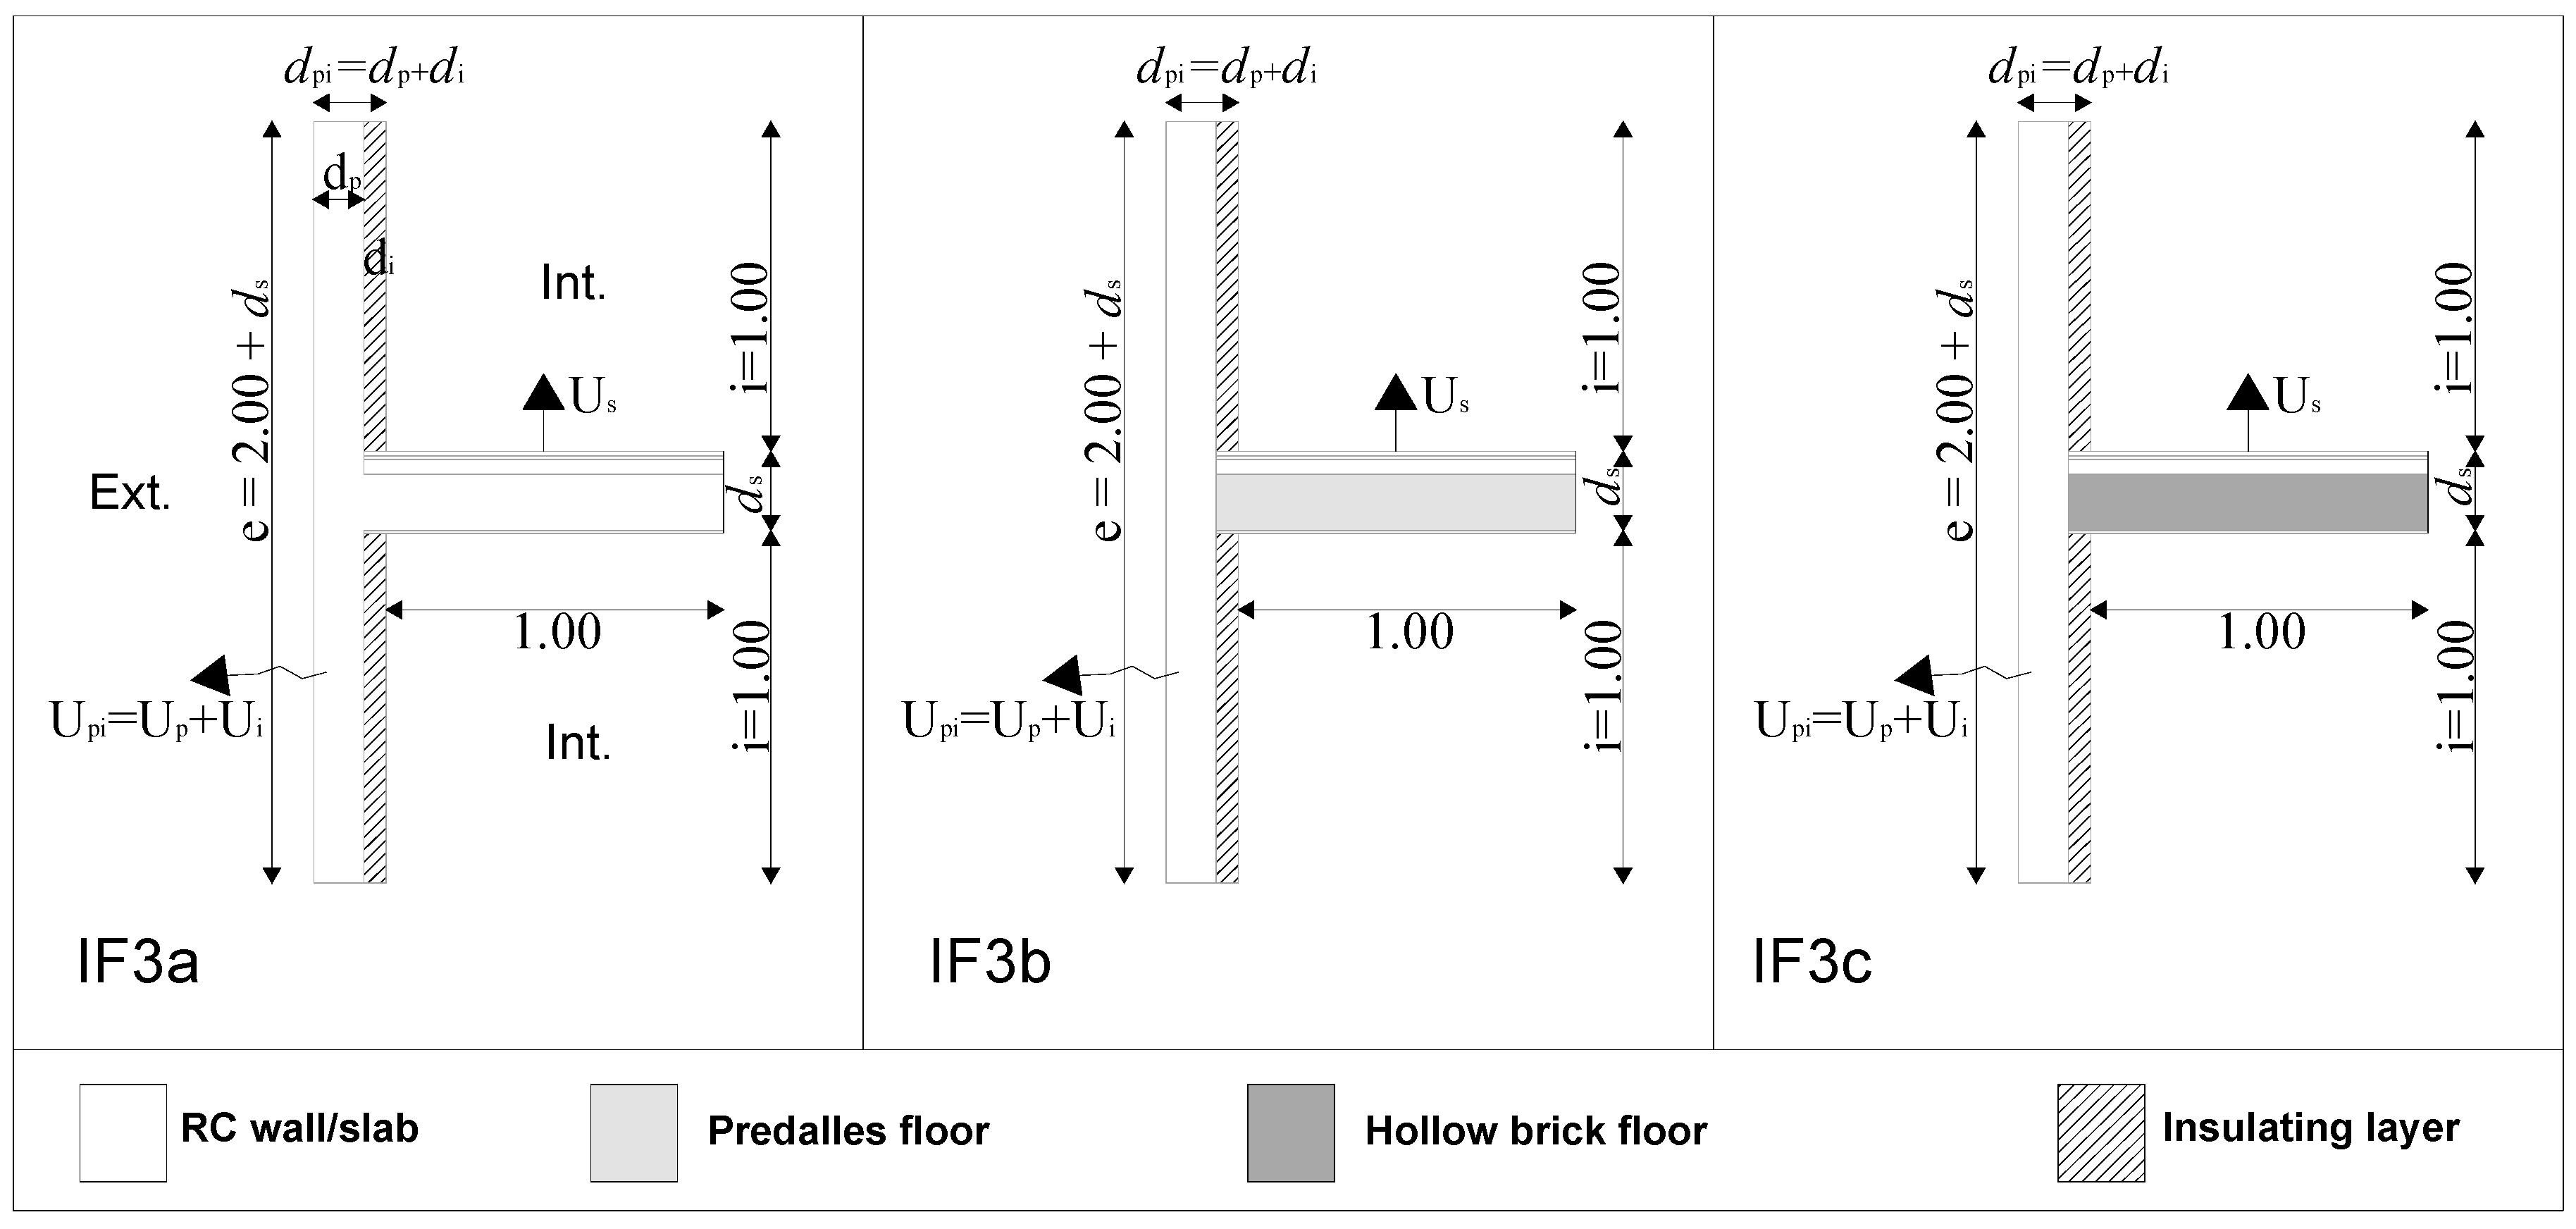
Figure 8.
(a) Isotherms and thermogram in a 0.2 m “Predalles” type floor and (b) in a 0.2 m hollow brick floor.
Figure 8.
(a) Isotherms and thermogram in a 0.2 m “Predalles” type floor and (b) in a 0.2 m hollow brick floor.
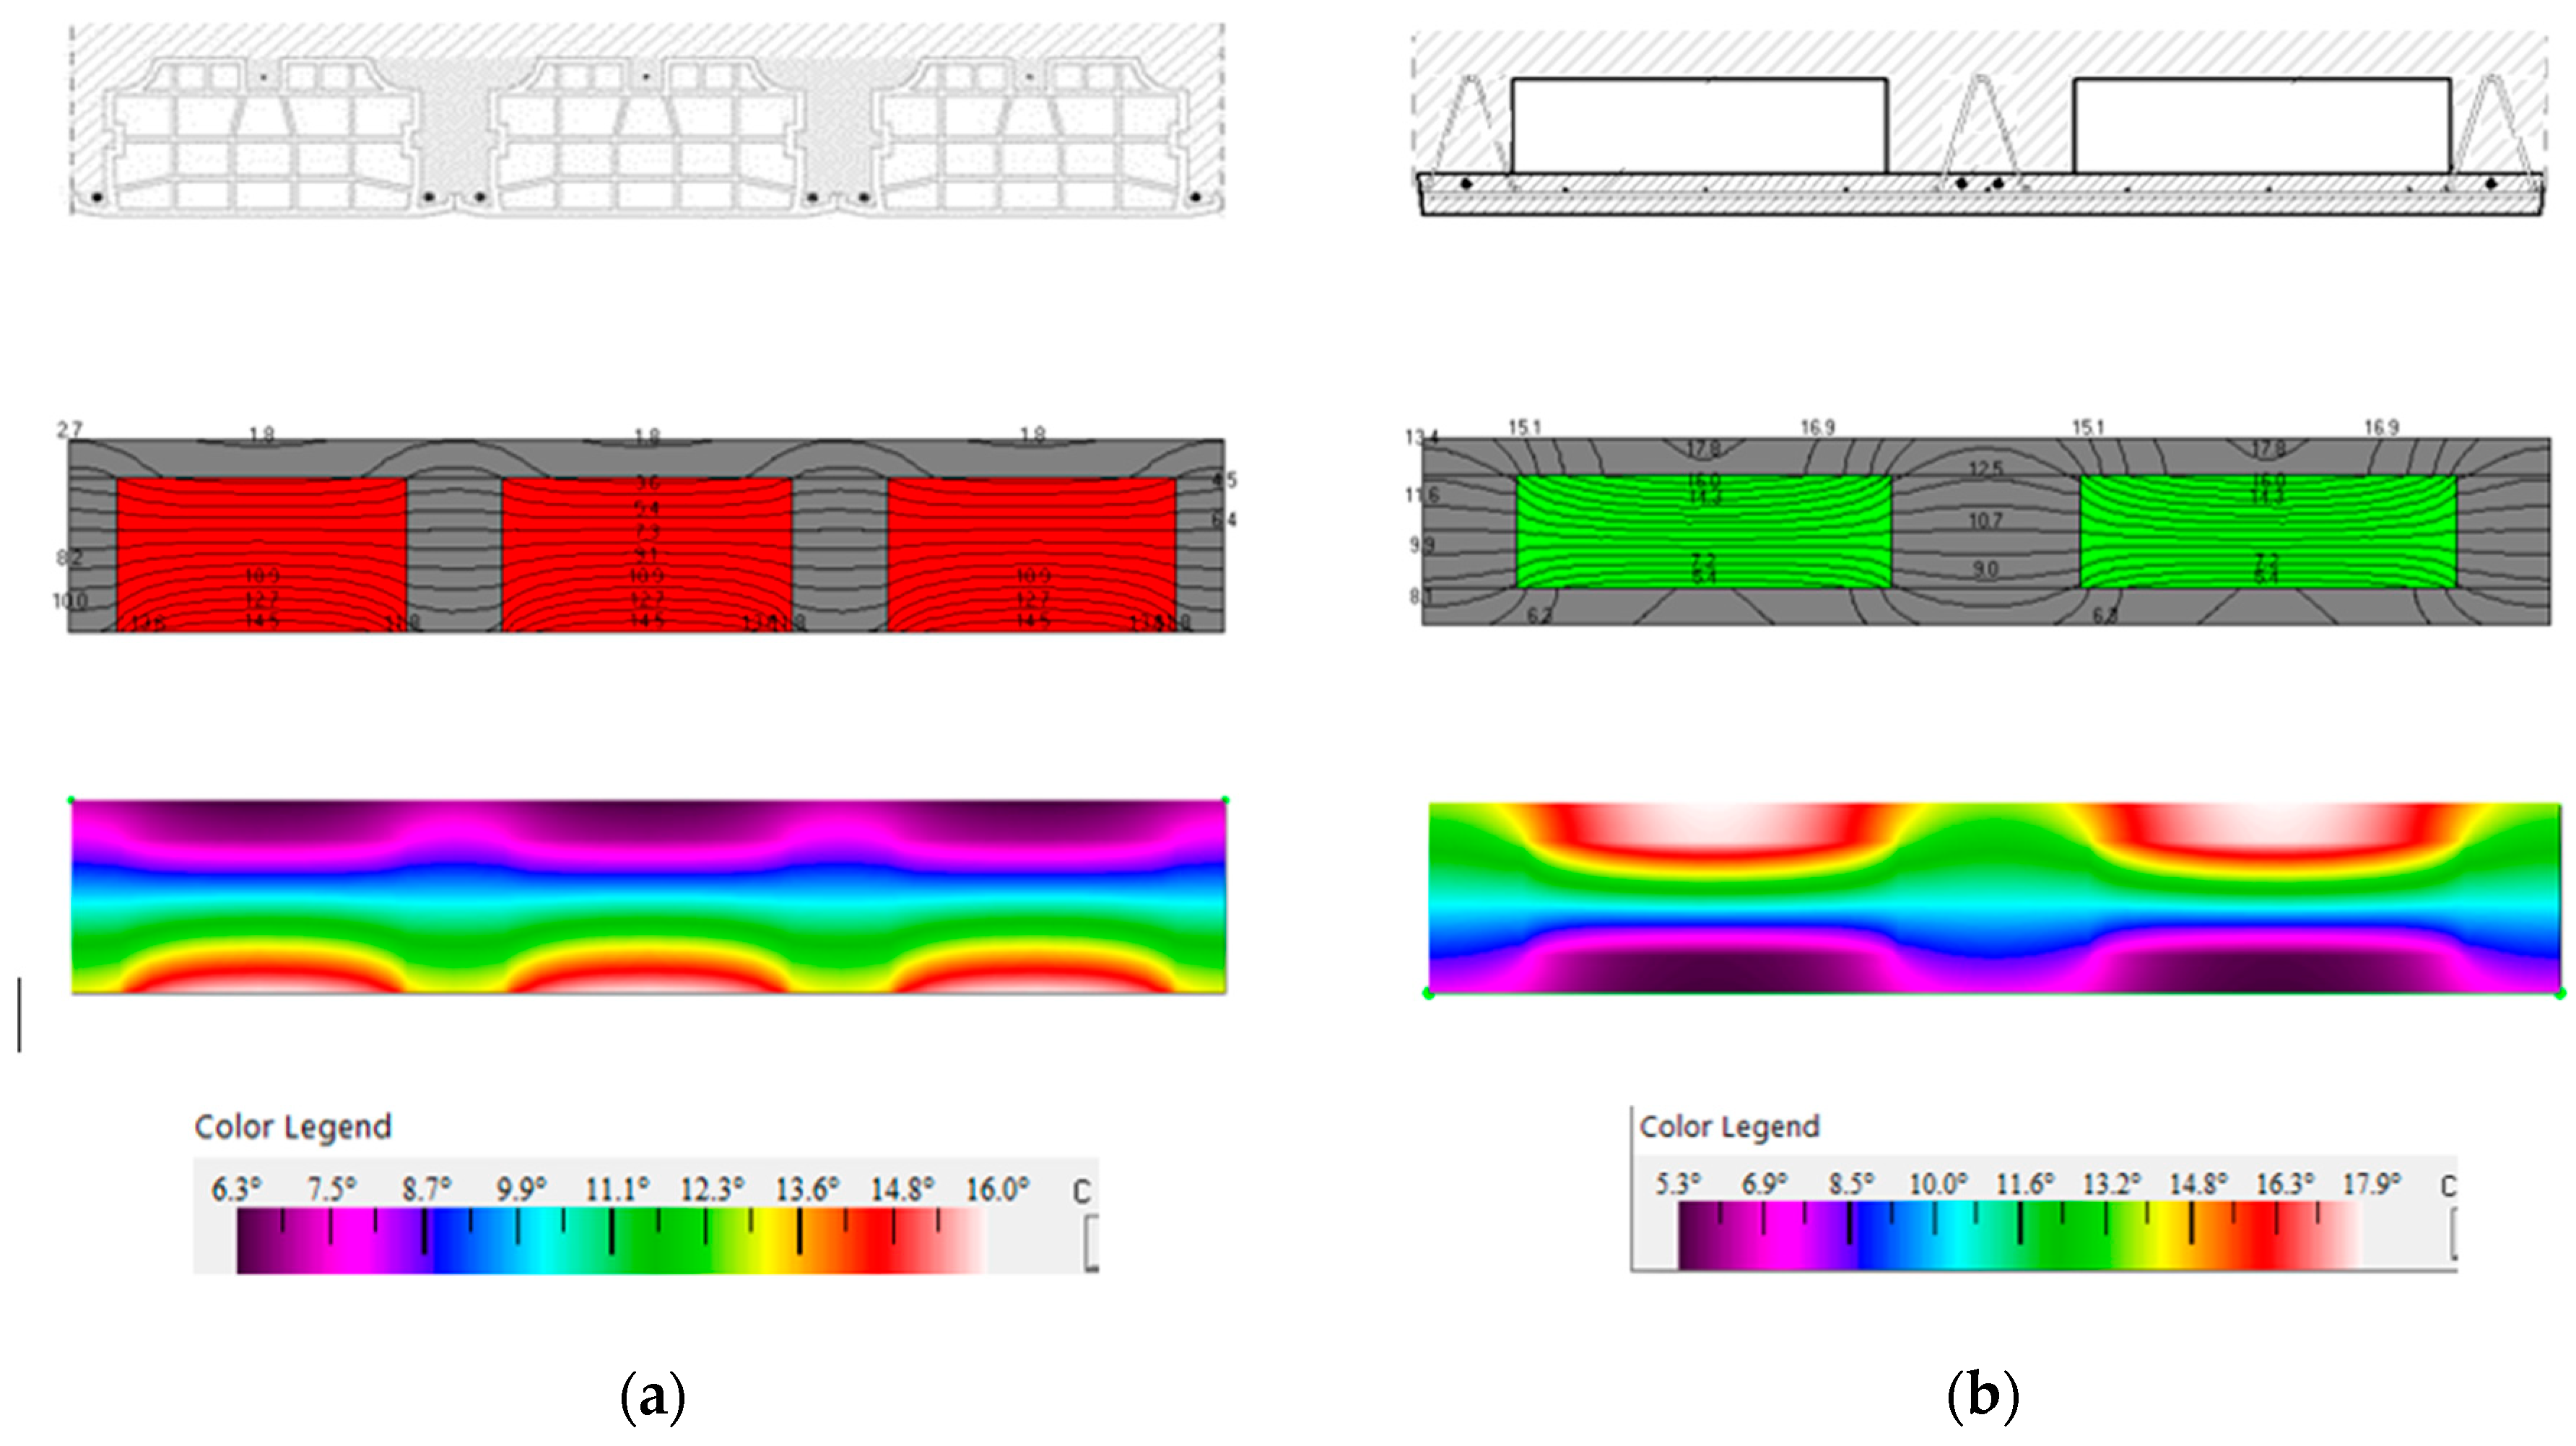
Figure 9.
Temperature distribution (°C) in the case of (a) RC wall/RC floor junction, labeled as IF3a, (b) RC wall/“Predalles” floor, labeled as IF3b and (c) RC wall/hollow brick floor, labeled as IF3c.
Figure 9.
Temperature distribution (°C) in the case of (a) RC wall/RC floor junction, labeled as IF3a, (b) RC wall/“Predalles” floor, labeled as IF3b and (c) RC wall/hollow brick floor, labeled as IF3c.
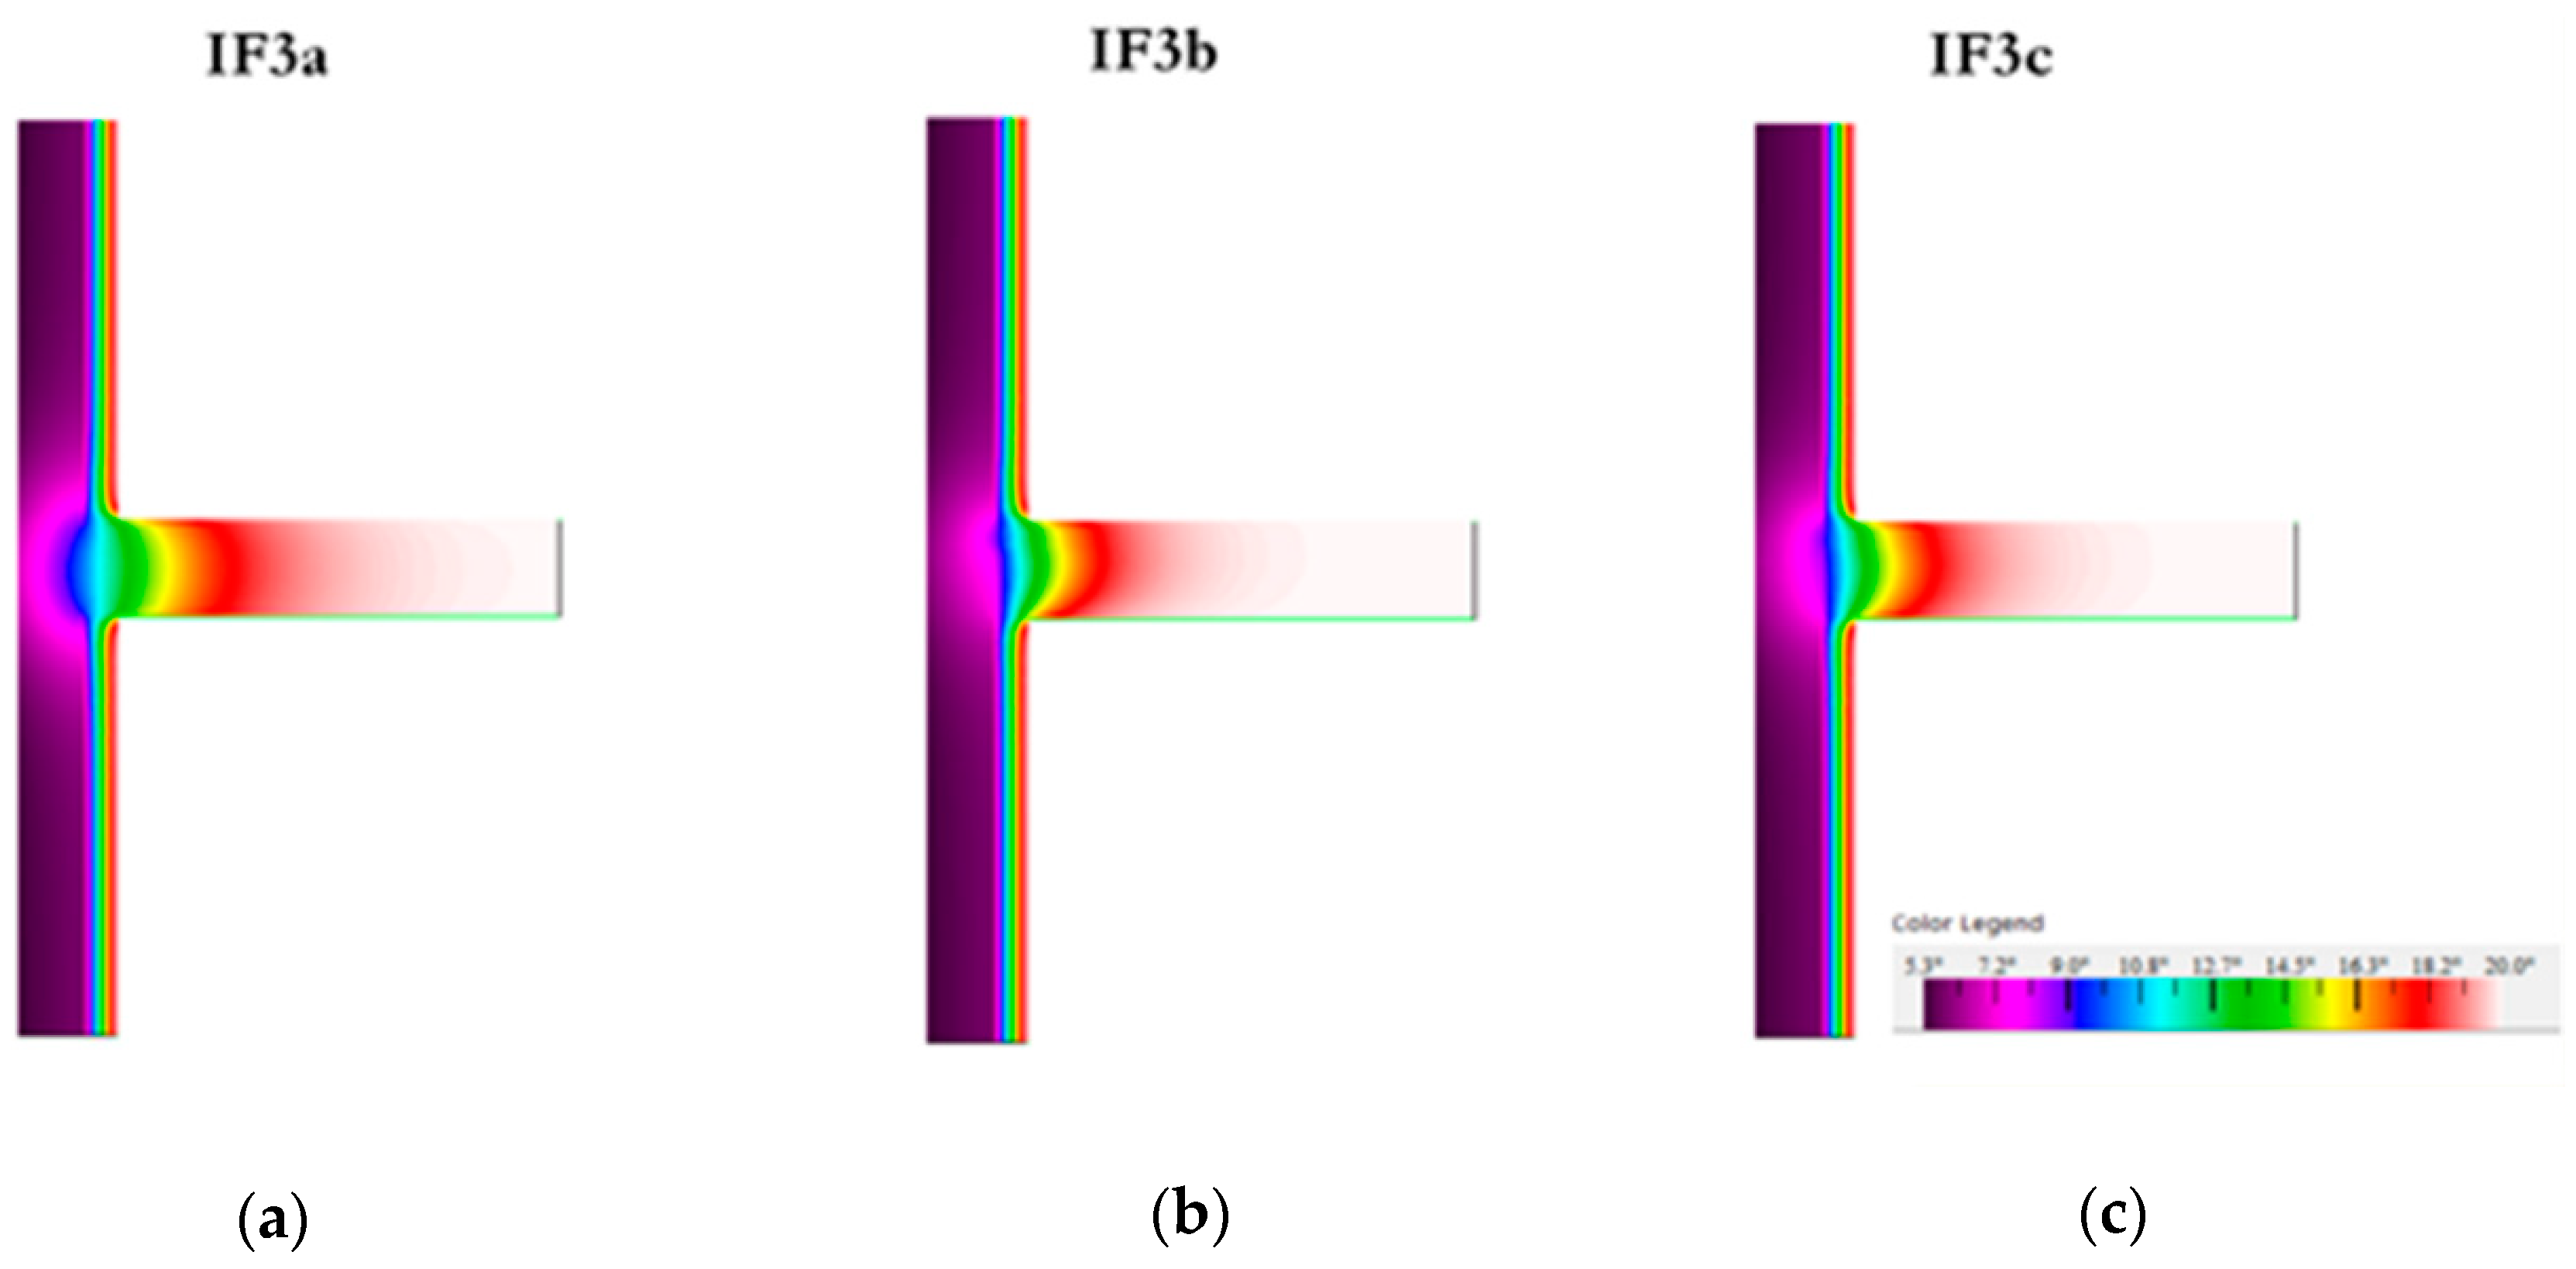
Figure 10.
Trend of the linear thermal transmittance of the RC wall/0.16 m inter-floor slab junction as a function of the thermal insulation’s thickness.
Figure 10.
Trend of the linear thermal transmittance of the RC wall/0.16 m inter-floor slab junction as a function of the thermal insulation’s thickness.
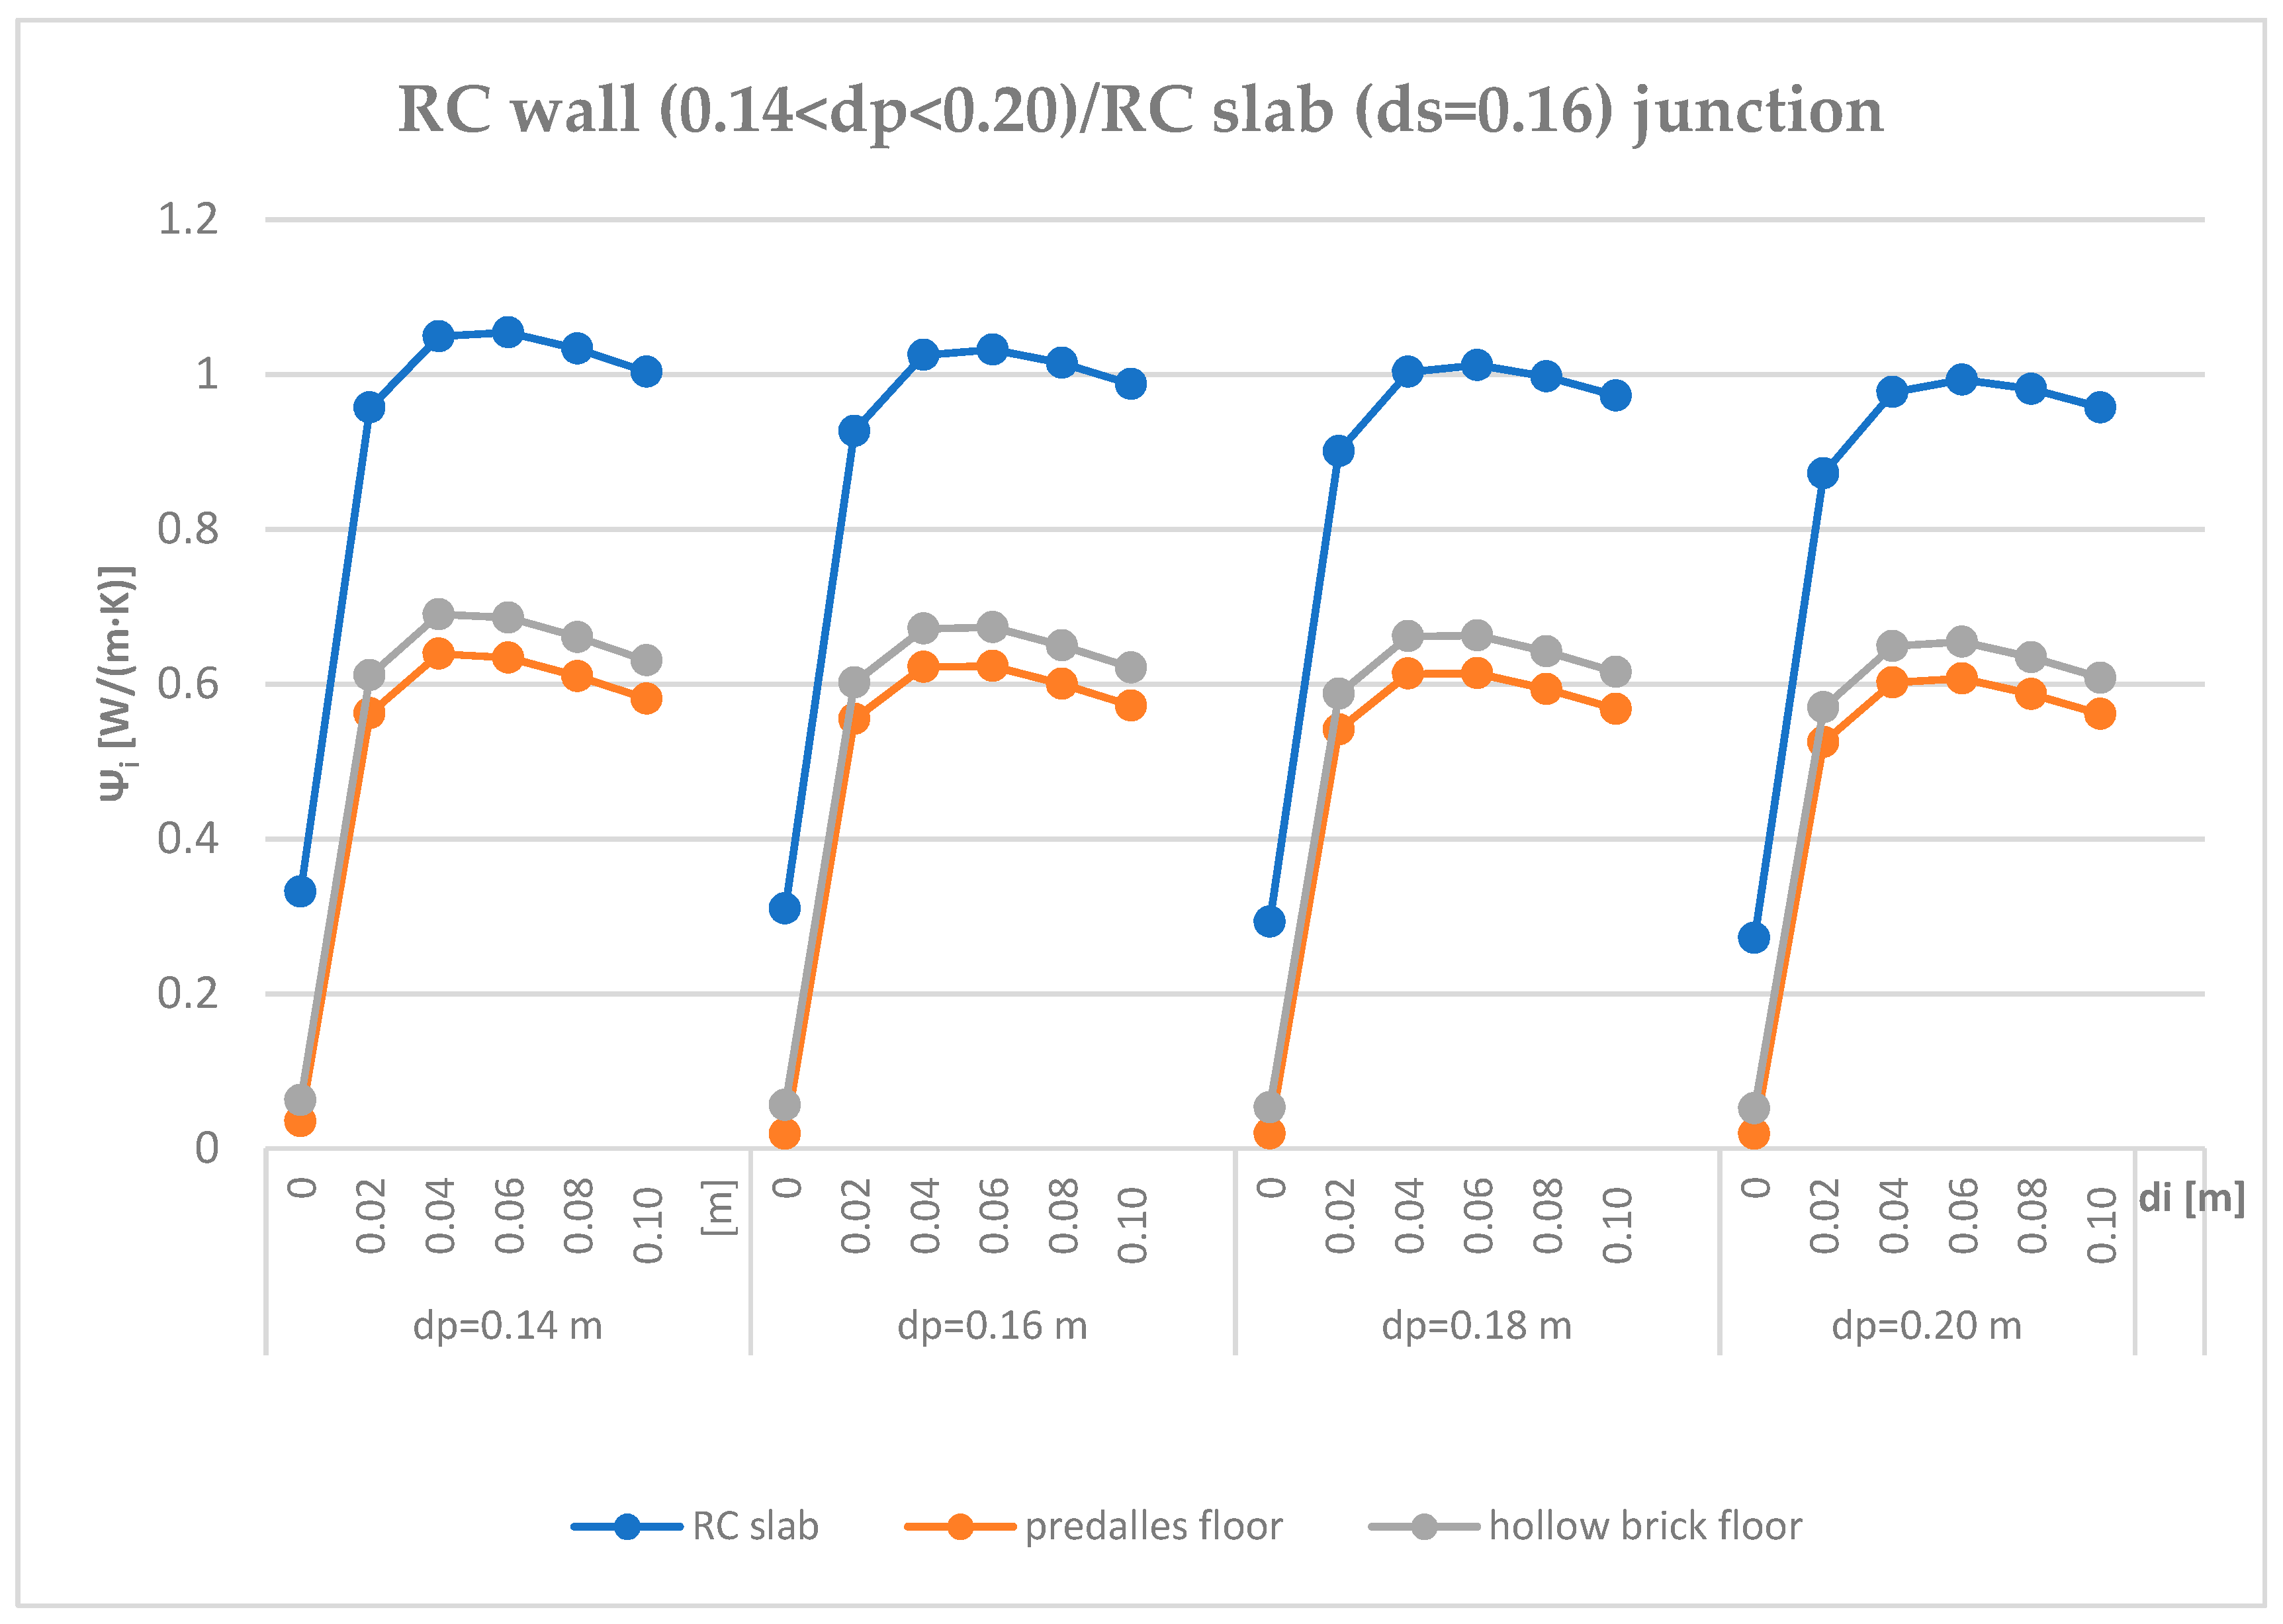
Figure 11.
Heat loss percentages for wall and thermal bridge.
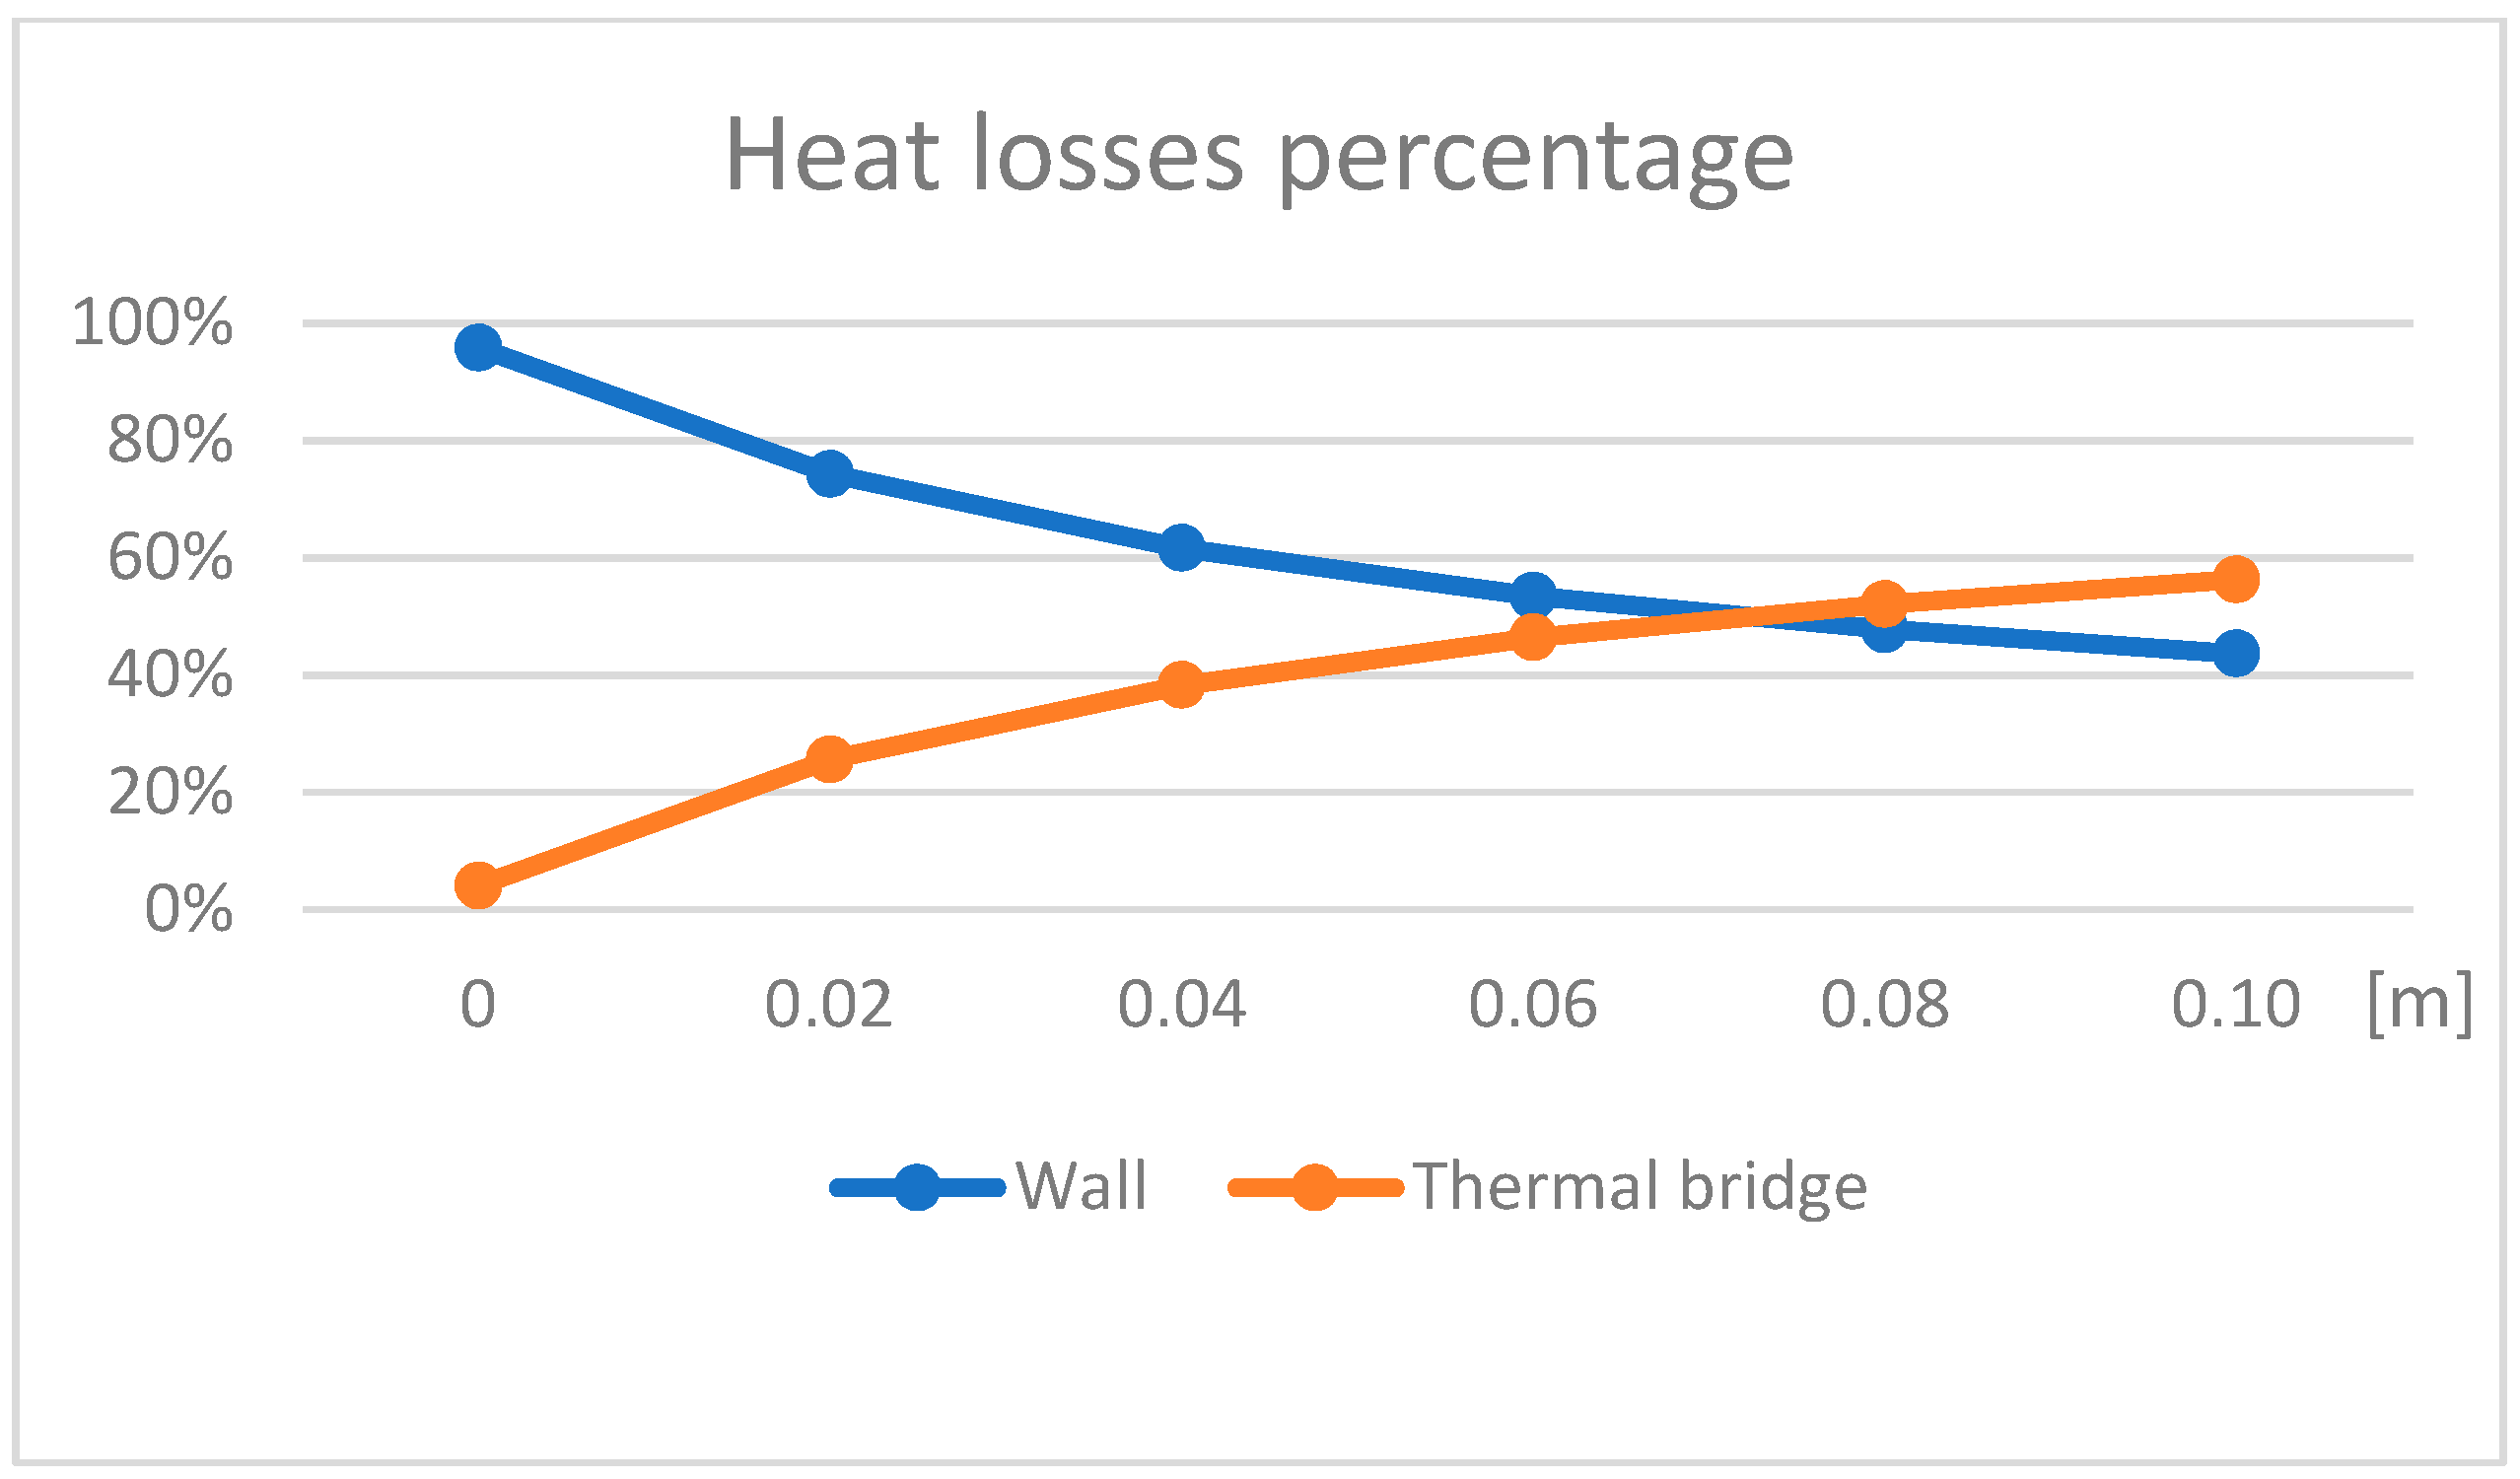
Figure 12.
The diagram of the 216 case studies by means of THERM 7.4 and the Equation (4).
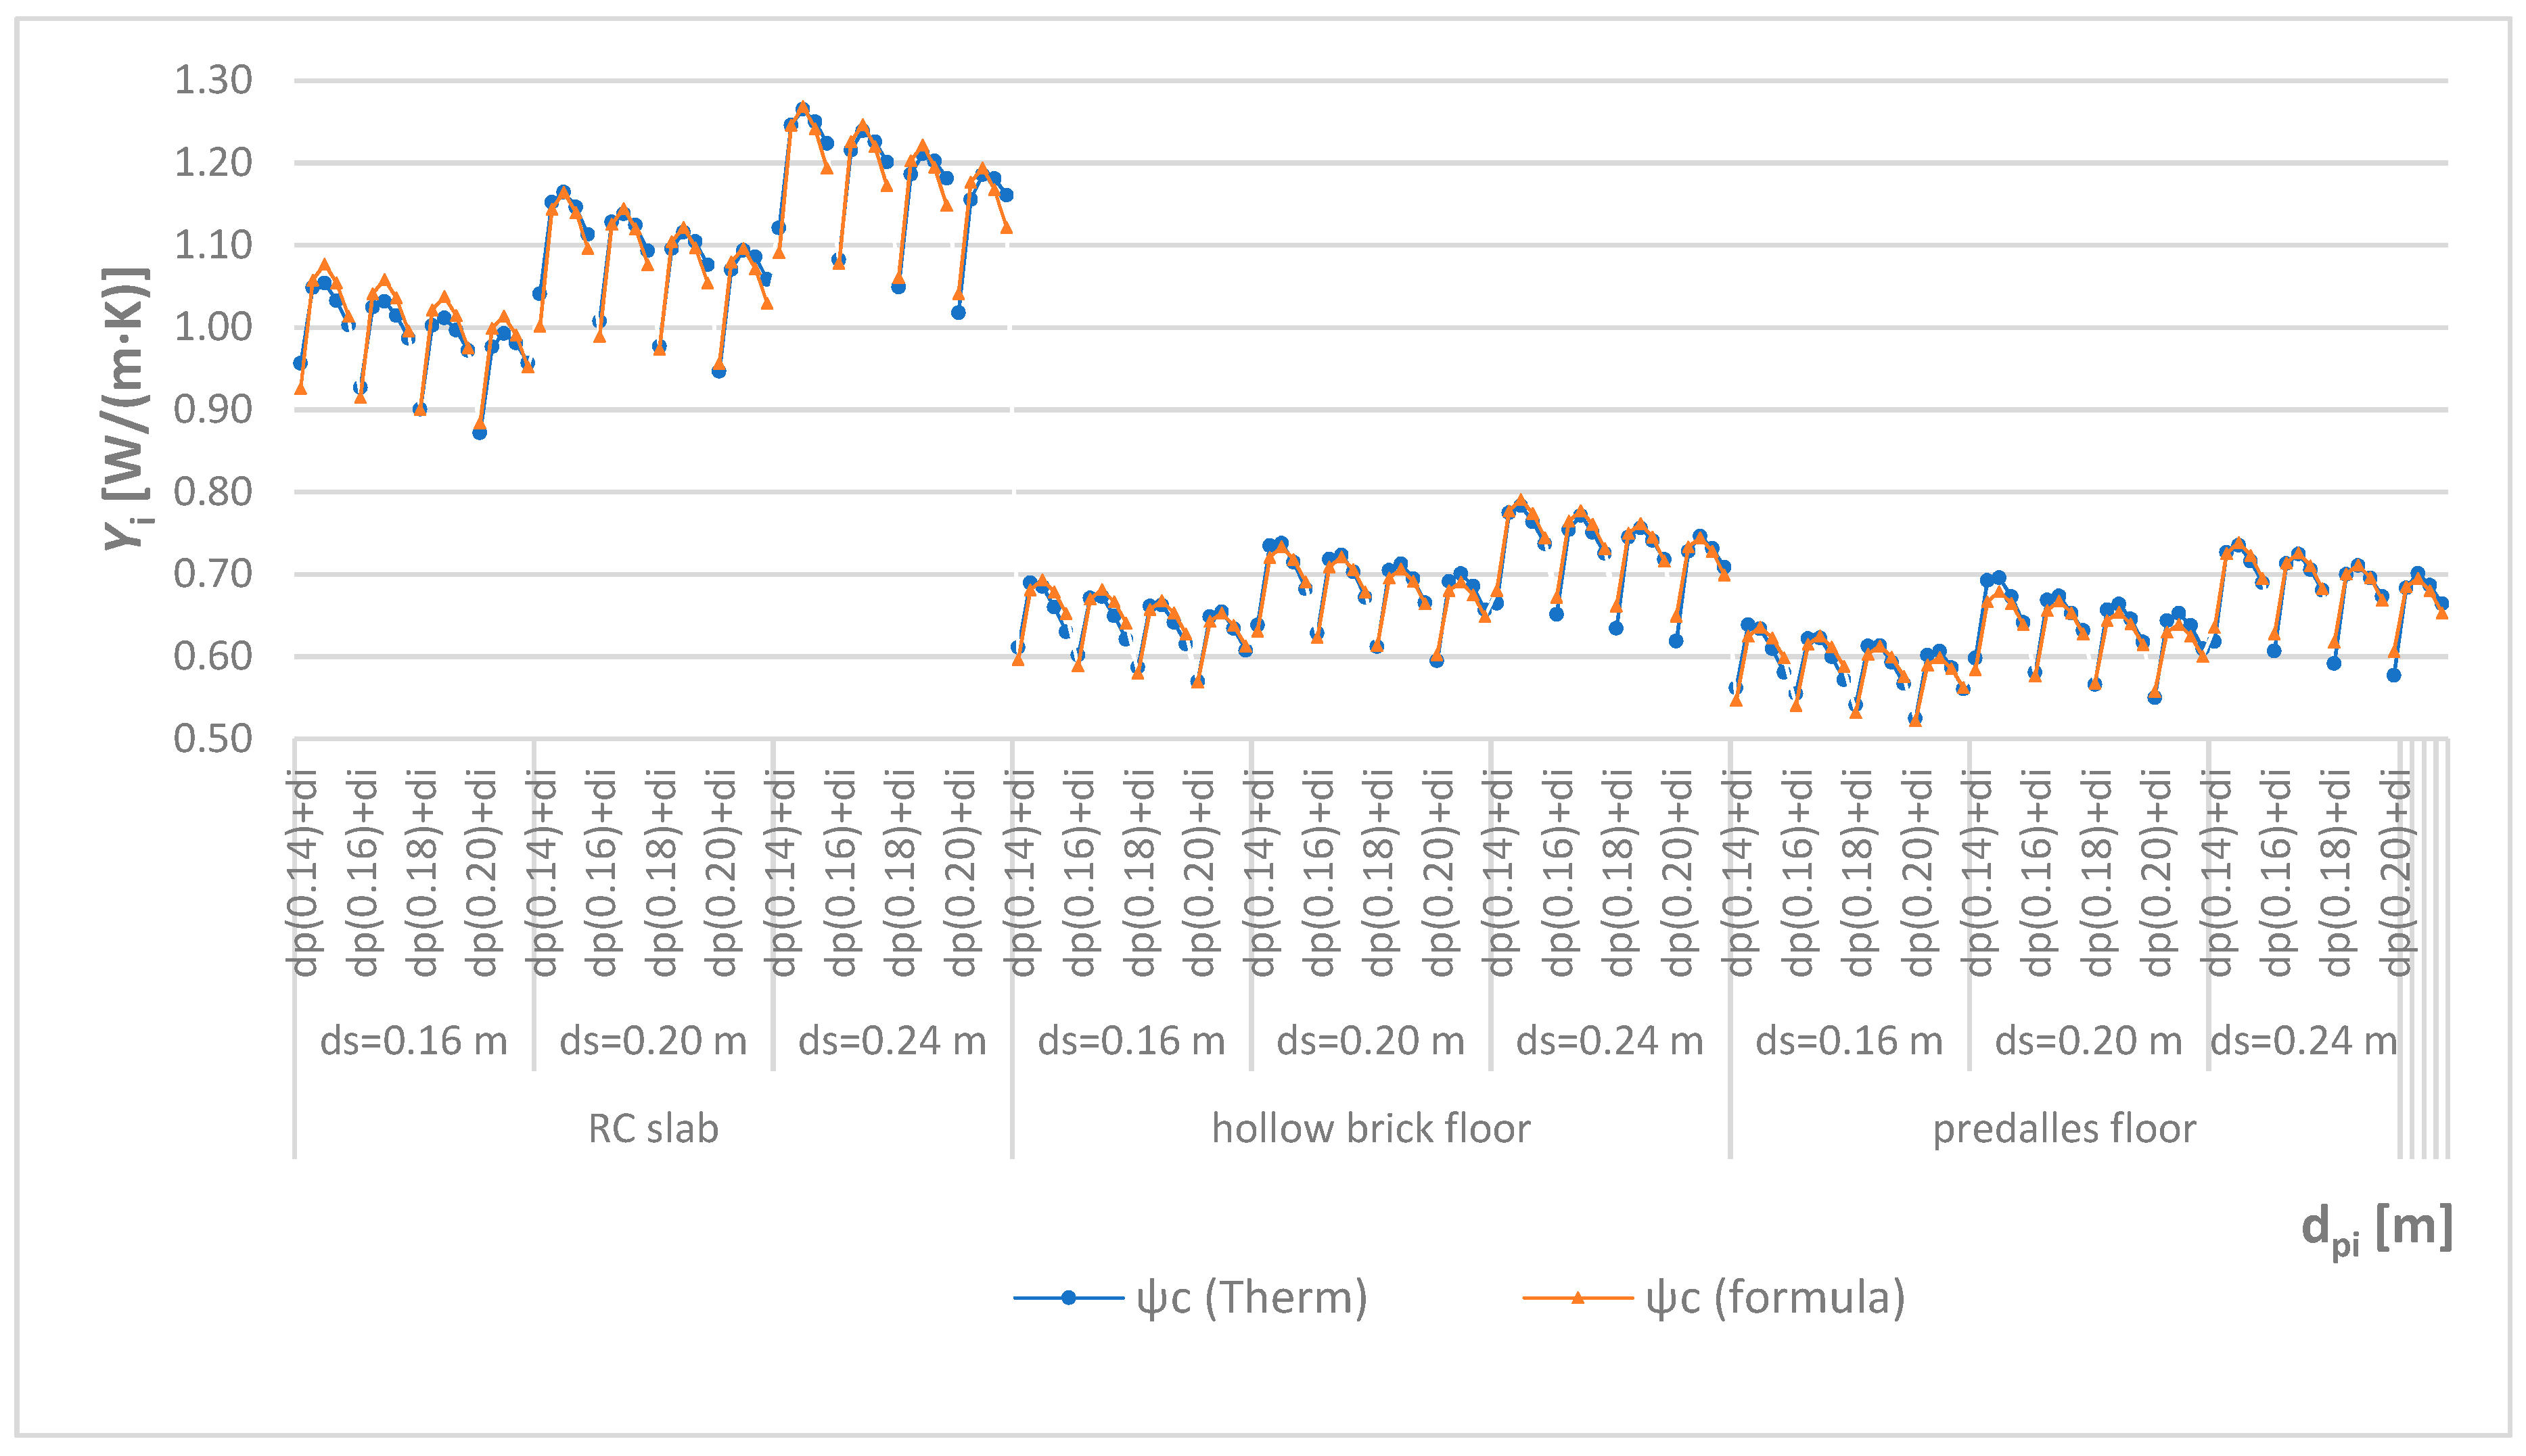
Table 1.
Linear thermal transmittance of the vertical wall/intermediate floor slab by analyzed sources.
Table 1.
Linear thermal transmittance of the vertical wall/intermediate floor slab by analyzed sources.
| THERM 7.4 Version | UNI EN ISO 14683:2001 | UNI EN ISO 14683:2018 | Edilclima | CESTEC | OFEN | |
|---|---|---|---|---|---|---|
| ψi (W/(m·K)) | 1.059 | 0.8 | 1.0 | 0.82 | 0.719 | 0.88 |
| Δ (%) | - | −24.4 | −5.6 | −22.6 | −32.1 | −16.9 |
Table 2.
Boundary conditions for thermal analysis calculation.
| External Temperature (°C) | Internal Temperature (°C) | External Surface Thermal Resistance (Rse) (m2·K/W) | Internal Surface Thermal Resistance (Rsi) (m2·K/W) |
|---|---|---|---|
| +5 | +20 | 0.04 | 0.13 |
Table 3.
Dimensional and thermal values used for calculation.
| Technical Element | Thickness (m) | Thermal Conductivity (W/(m·K)) |
|---|---|---|
| RC wall | 0.14–0.16–0.18–0.20 | 2.3 |
| Thermal insulation | 0–0.02–0.04–0.06–0.08–0.10 | 0.04 |
| RC floor | 0.16–0.20–0.24 | 2.3 |
| “Predalles” floor | 0.16–0.20–0.24 | 0.62–0.64–0.66 * |
| Hollow brick floor | 0.16–0.20–0.24 | 0.75–0.76–0.77 * |
| Mortar and plaster | 0.01 | 0.43 |
| Floor | 0.02 | 1.2 |
| Screed | 0.05 | 1.6 |
| Plasterboard | 0.01 | 0.21 |
* calculated by THERM 7.4.
Table 4.
ψi calculation for the 0.14 m RC wall/0.16 m RC slab junction.
| di(m) | UFiup (W/(m2·K)) | liup (m) | UFidown (W/(m2·K)) | lidown (m) | Up (W/(m2·K)) | le (m) | ψi (W/(m·K)) |
|---|---|---|---|---|---|---|---|
| 0.00 | 4.18730 | 0.99 | 4.19430 | 0.94 | 3.59081 | 2.16 | 0.332 |
| 0.02 | 1.93190 | 0.99 | 1.93490 | 0.94 | 1.28454 | 2.16 | 0.957 |
| 0.04 | 1.41870 | 0.99 | 1.41910 | 0.94 | 0.78217 | 2.16 | 1.049 |
| 0.06 | 1.17570 | 0.99 | 1.17530 | 0.94 | 0.56228 | 2.16 | 1.054 |
| 0.08 | 1.02780 | 0.99 | 1.02490 | 0.94 | 0.43889 | 2.16 | 1.033 |
| 0.10 | 0.92440 | 0.99 | 0.92060 | 0.94 | 0.35991 | 2.16 | 1.003 |
Table 5.
ψi values for the overall analyzed thermal bridges.
| Thickness [m] | IF3a | IF3b | IF3c | ||||||||
|---|---|---|---|---|---|---|---|---|---|---|---|
| Wall | Floor | 0.16 | 0.20 | 0.24 | 0.16 | 0.20 | 0.24 | 0.16 | 0.20 | 0.24 | |
| Insulation | |||||||||||
| 0.14 | 0.00 | 0.332 | 0.331 | 0.322 | 0.035 | 0.025 | 0.092 | 0.062 | 0.008 | −0.053 | |
| 0.02 | 0.957 | 1.041 | 1.121 | 0.562 | 0.598 | 0.618 | 0.611 | 0.638 | 0.665 | ||
| 0.04 | 1.049 | 1.152 | 1.246 | 0.639 | 0.693 | 0.727 | 0.690 | 0.735 | 0.775 | ||
| 0.06 | 1.054 | 1.165 | 1.265 | 0.634 | 0.696 | 0.735 | 0.686 | 0.738 | 0.784 | ||
| 0.08 | 1.033 | 1.146 | 1.250 | 0.610 | 0.673 | 0.716 | 0.660 | 0.715 | 0.764 | ||
| 0.10 | 1.003 | 1.113 | 1.224 | 0.581 | 0.642 | 0.690 | 0.630 | 0.683 | 0.737 | ||
| 0.16 | 0.00 | 0.310 | 0.309 | 0.303 | 0.019 | 0.033 | 0.081 | 0.056 | 0.005 | −0.050 | |
| 0.02 | 0.927 | 1.008 | 1.082 | 0.555 | 0.581 | 0.607 | 0.602 | 0.628 | 0.651 | ||
| 0.04 | 1.025 | 1.128 | 1.215 | 0.622 | 0.669 | 0.713 | 0.671 | 0.719 | 0.754 | ||
| 0.06 | 1.032 | 1.138 | 1.239 | 0.623 | 0.674 | 0.725 | 0.673 | 0.724 | 0.772 | ||
| 0.08 | 1.015 | 1.125 | 1.226 | 0.600 | 0.653 | 0.706 | 0.650 | 0.703 | 0.751 | ||
| 0.10 | 0.987 | 1.093 | 1.201 | 0.572 | 0.632 | 0.681 | 0.621 | 0.672 | 0.726 | ||
| 0.18 | 0.00 | 0.293 | 0.292 | 0.285 | 0.019 | 0.031 | 0.076 | 0.053 | 0.005 | −0.048 | |
| 0.02 | 0.901 | 0.977 | 1.049 | 0.541 | 0.566 | 0.592 | 0.587 | 0.612 | 0.634 | ||
| 0.04 | 1.003 | 1.096 | 1.186 | 0.613 | 0.657 | 0.700 | 0.662 | 0.705 | 0.745 | ||
| 0.06 | 1.012 | 1.116 | 1.211 | 0.614 | 0.664 | 0.711 | 0.663 | 0.713 | 0.757 | ||
| 0.08 | 0.997 | 1.105 | 1.202 | 0.593 | 0.646 | 0.696 | 0.642 | 0.695 | 0.742 | ||
| 0.10 | 0.972 | 1.076 | 1.182 | 0.568 | 0.618 | 0.673 | 0.615 | 0.666 | 0.718 | ||
| 0.20 | 0.00 | 0.275 | 0.274 | 0.268 | 0.019 | 0.028 | 0.073 | 0.052 | 0.006 | −0.043 | |
| 0.02 | 0.872 | 0.947 | 1.018 | 0.525 | 0.550 | 0.577 | 0.570 | 0.595 | 0.619 | ||
| 0.04 | 0.977 | 1.071 | 1.156 | 0.602 | 0.644 | 0.684 | 0.649 | 0.691 | 0.728 | ||
| 0.06 | 0.993 | 1.094 | 1.186 | 0.607 | 0.653 | 0.702 | 0.654 | 0.701 | 0.746 | ||
| 0.08 | 0.981 | 1.086 | 1.181 | 0.587 | 0.638 | 0.687 | 0.634 | 0.686 | 0.732 | ||
| 0.10 | 0.957 | 1.059 | 1.161 | 0.561 | 0.610 | 0.664 | 0.608 | 0.657 | 0.709 | ||
Table 6.
The matrix derived by the elaboration of data.
| A | B | C | D | E | F | |
|---|---|---|---|---|---|---|
| 1 | m5 = 1.573001 | m4 = 0.612972 | m3 = 0.66599 | m2 = 0.028051 | m1 = 44.0864 | b = 2.118112 |
| 2 | se5 = 0.002431 | se4 = 0.026652 | se3 = 0.011054 | se2 = 0.126889 | se1 = 0.0402 | seb = 0.125843 |
| 3 | r2 = 0.995554 | sey = 0.017018 | ||||
| 4 | F = 7791.857 | df = 174 | ||||
| 5 | ssreg = 11.2829 | ssresid = 0.050392 |
LEGEND: m1, …, m5, b = coefficients of the formula; se1, …, se5, seb = the standard error values for the coefficients of the formula; r2 = determination coefficient, comparing the estimated values with the measured ones, ranging between 0 and 1. 1 means perfect correlation, 0 means no correlation; sey = standard error for estimating ψi; F = stats value is a logical value specifying whether to return additional regression statistics; df = degree of freedom to find the critical values of F; ssreg = regression of the sum of the squares; ssresid = residual sum of the squares.
Publisher’s Note: MDPI stays neutral with regard to jurisdictional claims in published maps and institutional affiliations. |
© 2020 by the authors. Licensee MDPI, Basel, Switzerland. This article is an open access article distributed under the terms and conditions of the Creative Commons Attribution (CC BY) license (http://creativecommons.org/licenses/by/4.0/).
Share and Cite
MDPI and ACS Style
Basiricò, T.; Cottone, A.; Enea, D. Analytical Mathematical Modeling of the Thermal Bridge between Reinforced Concrete Wall and Inter-Floor Slab. Sustainability 2020, 12, 9964. https://doi.org/10.3390/su12239964
AMA Style
Basiricò T, Cottone A, Enea D. Analytical Mathematical Modeling of the Thermal Bridge between Reinforced Concrete Wall and Inter-Floor Slab. Sustainability. 2020; 12(23):9964. https://doi.org/10.3390/su12239964
Chicago/Turabian StyleBasiricò, Tiziana, Antonio Cottone, and Daniele Enea. 2020. "Analytical Mathematical Modeling of the Thermal Bridge between Reinforced Concrete Wall and Inter-Floor Slab" Sustainability 12, no. 23: 9964. https://doi.org/10.3390/su12239964
Note that from the first issue of 2016, this journal uses article numbers instead of page numbers. See further details here.