Land Use/Land Cover Assessment over Time Using a New Weighted Environmental Index (WEI) Based on an Object-Oriented Model and GIS Data


Abstract
:1. Introduction
2. Land Use Environmental Value Assessment Using Indexes and Indicators
2.1. Environmental Indicators
2.2. Environmental Indicators Based on Land Use
3. Materials and Methods
3.1. Available Data
3.1.1. Description of Mapping Techniques Using GIS
3.1.2. Corine Land Cover
3.1.3. SIOSE
3.2. The Weighted Environmental Index (WEI). Conceptual scheme.
- WEI must integrate all the characteristics of indices that vary continuously in space.
- WEI values should be justified in a simple way from pre-established classifications of land use.
- It must be able to be used to carry out land use assessments based on information integrated into geographic information systems (GIS).
- It must be able to be used both in general studies carried out on a large scale and in detailed studies that use cartography obtained by very high-resolution GIS techniques.
- Its application in the same geographical area at different times should allow for trend analysis to determine the impact of correction measures that are implemented through territorial, urban or environmental planning tools.
- F1: Anthropic or natural nature of activity developed in soil.
- F2: Water consumption associated with land use.
- F3: Soil degradation (use of chemicals).
- F4: Environmental sustainability of land use (stability of the ecosystem).
- F5: Landscape value of activity carried out in the analyzed area.
- : environmental index of land use j ()
- assigned weights to factor i
- : evaluation factor i
- : land use categories
- : total area of study
- : area of polygon k
- npol: total number of polygons in the discretization
- : weighted environmental index of polygon k.
- : environmental index of land use j.
- : area assigned to land use j inside the polygon k.
- : land use weighting factor j in polygon k.
- njk: number of land uses (j) inside polygon k.
4. Results and Discussion
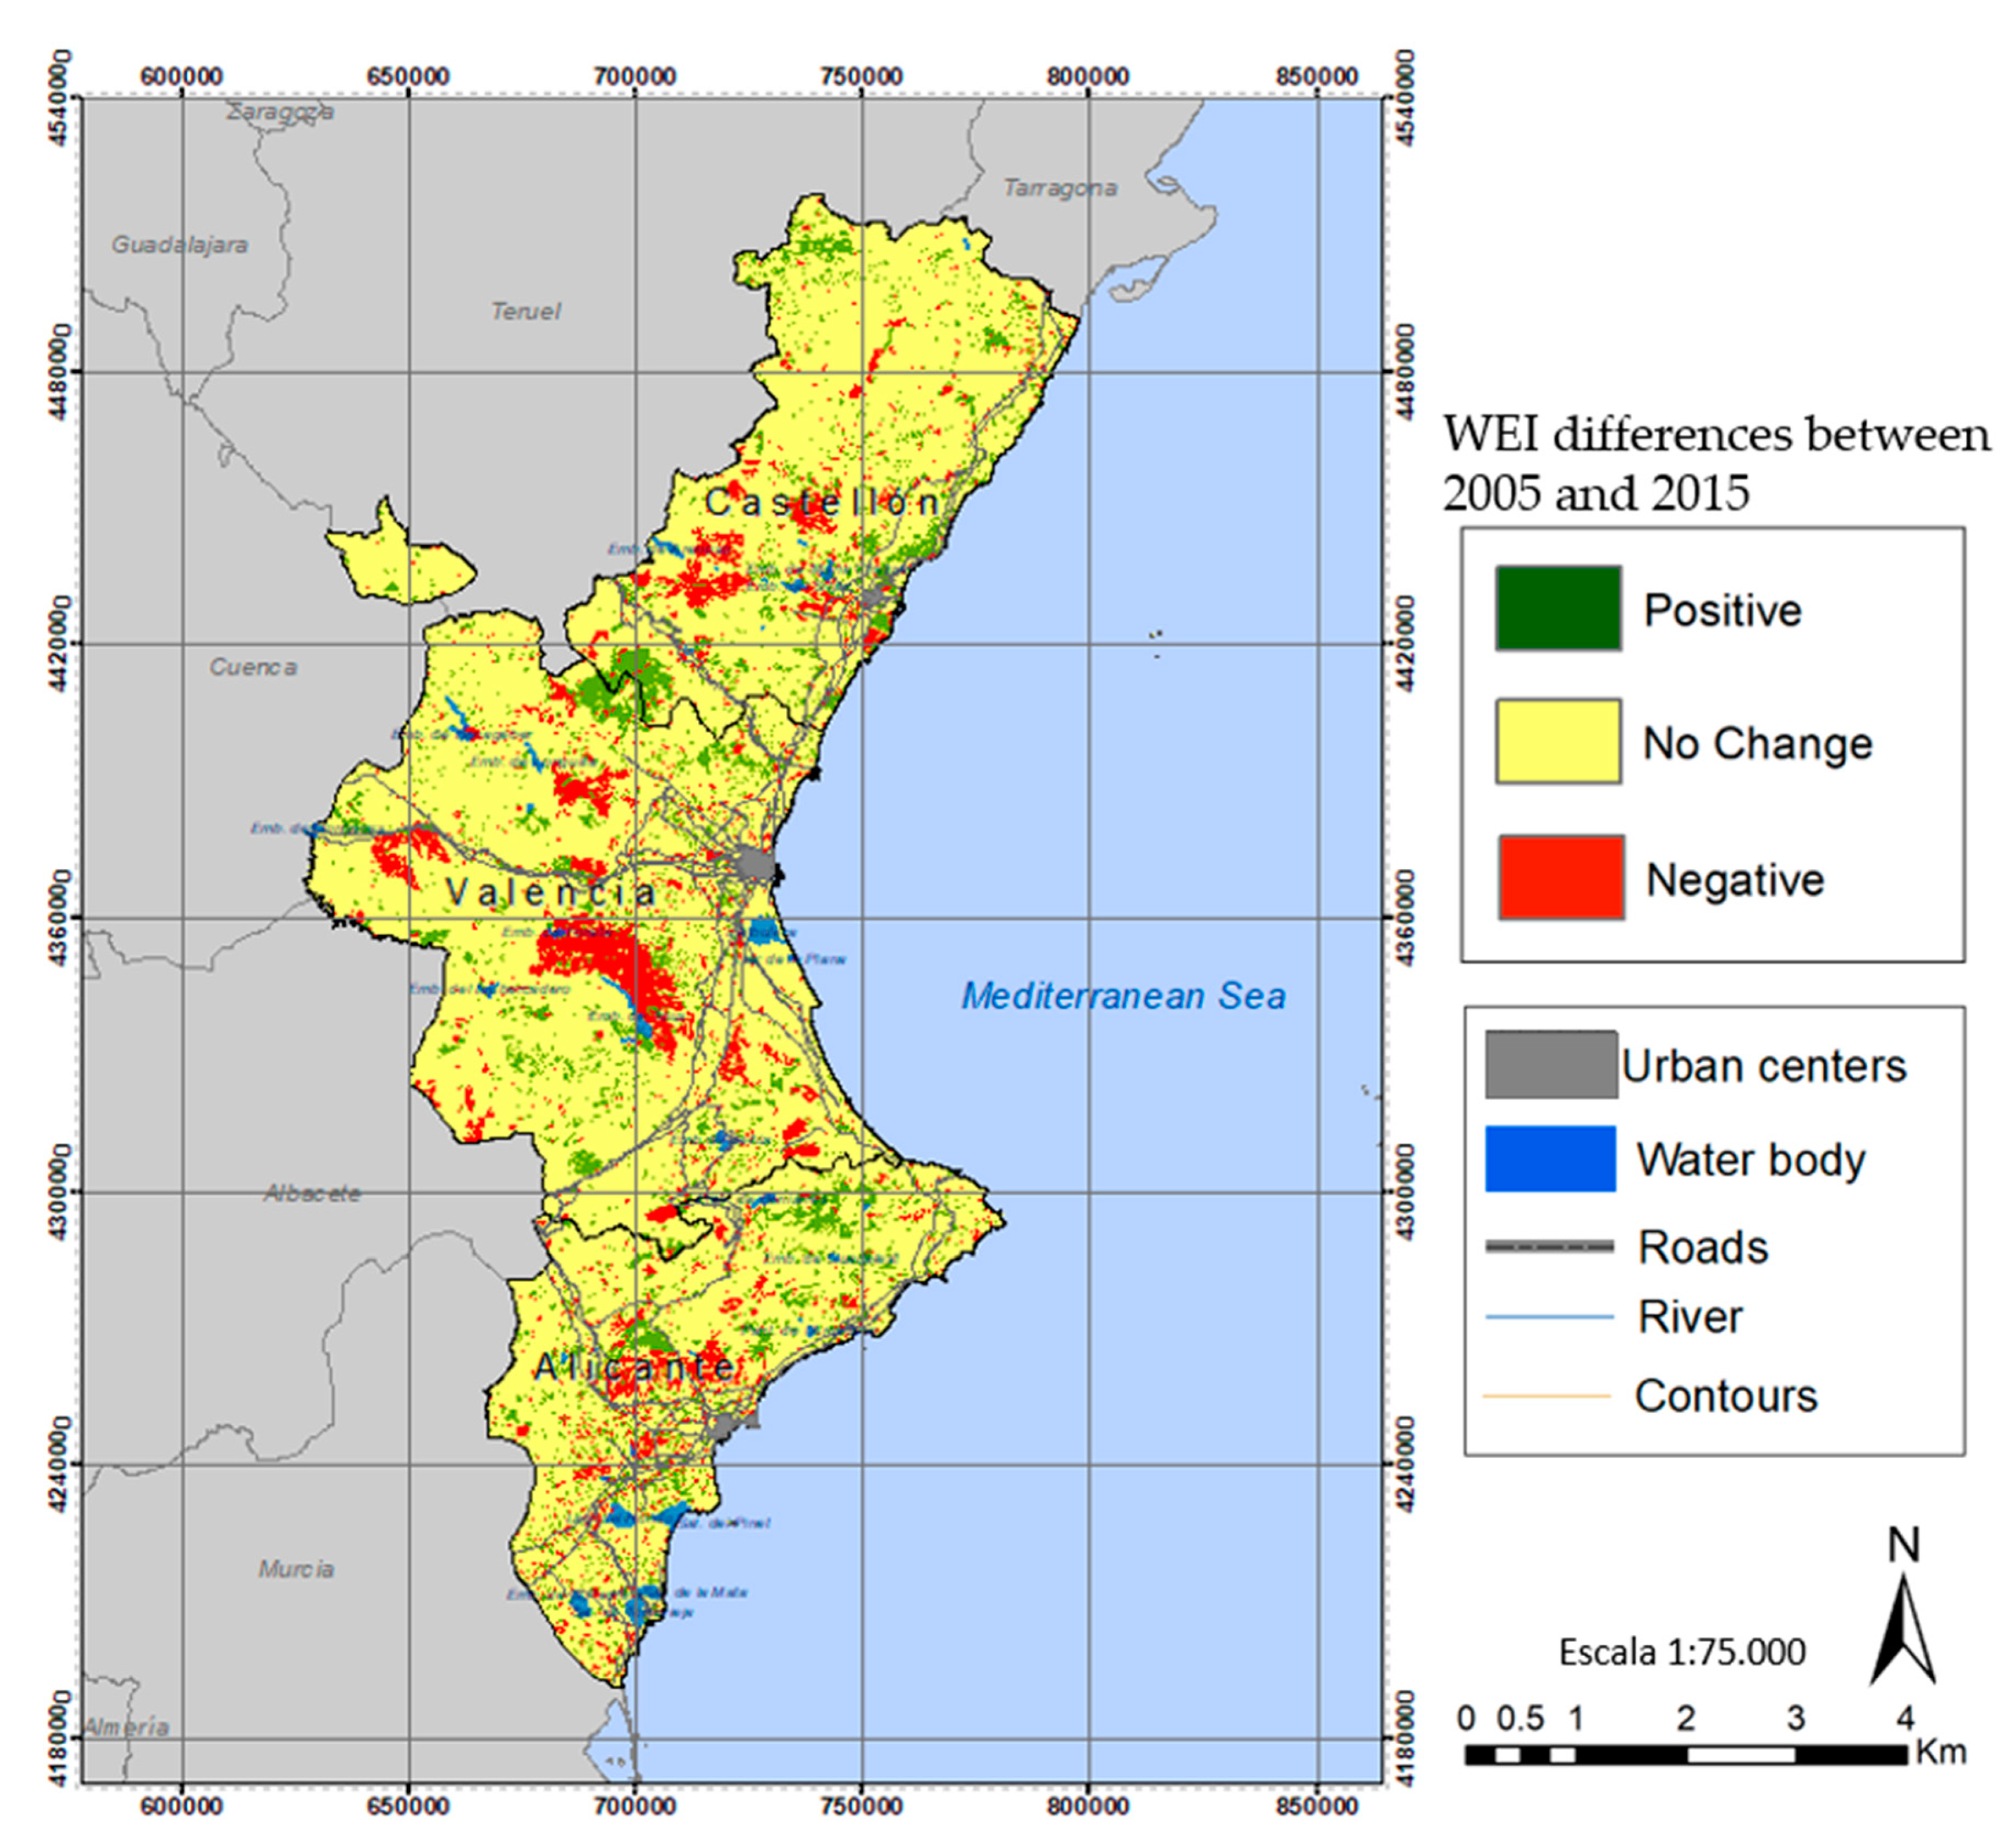
4.1. Large Scale Analysis: Valencian Region (2005–2015)
4.2. Municipal Scale Analysis: L’Alcora municipality (2005–2015)
5. Conclusions
Author Contributions
Funding
Acknowledgments
Conflicts of Interest
References
- WCED. Our Common Future; Oxford University Press: Oxford, UK; New York, NY, USA,, 1987. [Google Scholar]
- United Nations. Report of the United Nations Conference on Environment and Development, Rio de Janeiro. Volume I. In Resolutions Adopted by The Conference.; United Nations: New York, NY, USA, 1993. [Google Scholar]
- Bockstaller, C.; Girardin, P. How to validate environmental indicators. Agric. Syst. 2003, 76, 639–653. [Google Scholar] [CrossRef]
- Niemeijer, D.; de Groot, R.S. A conceptual framework for selecting environmental indicator sets. Ecol. Indic. 2008, 8, 14–25. [Google Scholar] [CrossRef]
- OECD. Environmental Indicators for Agriculture: Volume 1 Concepts and Frameworks; Organisation for Economic Cooperation and Development: Paris, France, 1999. [Google Scholar] [CrossRef]
- OECD. Environmental Indicators: Towards Sustainable Development; Organisation for Economic Cooperation and Development: Paris, France, 2001. [Google Scholar] [CrossRef]
- Jackson, L.E.; Kurtz, J.C.; Fisher, W.S. Evaluation Guidelines for Ecological Indicators; Report, No. EPA/620/ R-99/005; Environmental Protection Agency: Washington, DC, USA, 2000. [Google Scholar]
- Cloquell-Ballester, V.A.; Cloquell-Ballester, V.A.; Monterde-Díaz, R.; Santamarina-Siurana, M.C. Indicators validation for the improvement of environmental and social impact quantitative assessment. Environ. Impact Assess. Rev. 2006, 76, 79–105. [Google Scholar] [CrossRef]
- Esty, D.C.; Levy, M.A.; Kim, C.; de Sherbinin, A.; Srebotnjak, T.; Mara, V. Environmental Performance Index; Yale Center for Environmental Law and Policy: New Haven, CT, USA, 2008. [Google Scholar]
- Nicholson, M.; Fryer, R. Developing effective environmental indicators––Does a new dog need old tricks? Mar. Pollut. Bull. 2002, 45, 53–61. [Google Scholar] [CrossRef]
- Wieringa, K. Towards integrated environmental assessment supporting the community’s environmental action programme process. In Proceedings of the ESEE Inaugural International Conference, Ecology, Society, Economy; University of Versailles: Versailles, France, May 1996. [Google Scholar]
- Dale, V.H.; Beyeler, S.C. Challenges in the development and use of ecological indicators. Ecol. Indic. 2001, 1, 3–10. [Google Scholar] [CrossRef] [Green Version]
- Butt, B. Environmental indicators and governance. Curr. Opin. Environ. Sustain. 2018, 32, 84–89. [Google Scholar] [CrossRef]
- Girardin, P.; Bockstaller, C.; van der Werf, H.M.G. Indicators: Tools to evaluate the environmental impacts of farming systems. J. Sustain. Agric. 1999, 13, 5–21. [Google Scholar] [CrossRef]
- Chevalier, L.; Choiniere, R.; Bernier, L. User guide to 40 Community Health Indicators; Community Health Division, Health and Welfare Canada: Otawa, ON, Canada, 1992. [Google Scholar]
- Ott, W. Environmental Indices: Theory and Practise; Ann Arbor Science: Ann Arbor, MI, USA, 1978. [Google Scholar]
- Hammond, A.; Adriaanse, A.; Rodenburg, E.; Bryant, D.; Woodward, R. Environmental Indicators: A Systematic Approach to Measuring and Reporting on Environmental Policy Performance in the Context of Sustainable Development; World Resources Institute: Washington, DC, USA, 1995. [Google Scholar]
- Gallopín, G.C. Environmental and sustainability indicators and the concept of situational indicators. A system approach. Environ. Model. Assess. 1996, 1, 101–117. [Google Scholar] [CrossRef]
- Bauer, R. Social Indicators; MIT Press: Cambridge, MA, USA, 1996. [Google Scholar]
- Schuschny, A.R.; Soto, H. Guía Metodológica: Diseño De Indicadores Compuestos De Desarrollo Sostenible; United Nations: New York, NY, USA, 2009. [Google Scholar]
- Saltelli, A.; Tarantola, S. On the Relative Importance of Input Factors in Mathematical Models: Safety Assessment for Nuclear Waste Disposal. J. Am. Stat. Assoc. 2002, 97, 702–709. [Google Scholar] [CrossRef]
- EEA. Environmental Indicators: Typology and Overview; Technical Report No. 25; European Environmental Agency: Copenhagen, Demark, 1999. [Google Scholar]
- Roca, E.; Arca, J.C.; Calo, J.; Zumalave, J.A. Indicators and systems of environmental monitoring. In Environmental Information Systems; Netbiblo: La Coruña, Spain, 2005; pp. 95–116. (In Spanish) [Google Scholar]
- Herva, M.; Franco, A.; Fdez-Carrasco, E.; Roca, E. The ecological footprint of production processes as indicator of sustainability. Ing. Química 2008, 460, 180–186. (In Spanish) [Google Scholar]
- Heink, U.; Kowarik, I. What are indicators? on the definition of indicators in ecology and environmental planning. Ecol. Indic. 2010, 10, 584–593. [Google Scholar] [CrossRef]
- Schomaker, M. Development of environmental indicators in UNEP. In Land Quality Indicators and Their Use in Sustainable Agriculture and Rural Development; FAO: Rome, Italy, 1997; pp. 35–36. [Google Scholar]
- National Research Council. Ecological Indicators for the Nation; National Academy Press: Washington, DC, USA, 2000. [Google Scholar]
- Riley, J. Summary of the discussion session contributions to topic 1: What should a set of guidelines with regard to indicators contain? UNIQUAIMS Newsl. 2000, 10, 5–6. [Google Scholar]
- CBD. Development of Indicators of Biological Diversity. Report No. UNEP/CBD/SBSTTA/5/12; United Nations Environment Programme: Nairobi, Kenya, 1999. [Google Scholar]
- Pannell, D.J.; Glenn, N.A. A framework for the economic evaluation and selection of sustainability indicators in agriculture. Ecol. Econ. 2000, 33, 135–149. [Google Scholar] [CrossRef]
- Kurtz, J.C.; Jackson, L.E.; Fisher, W.S. Strategies for evaluating indicators based on guidelines from the Environmental Protection Agency’s Office of Research and Development. Ecol. Indic. 2001, 1, 49–60. [Google Scholar] [CrossRef]
- EEA. EEA Core Set of Indicators—Guide; Report No. 1/2005; European Environment Agency: Copenhagen, Denmark, 2005. [Google Scholar]
- Ziegler, C.R.; Webb, J.A.; Norton, S.B.; Pullin, A.S.; Melcher, A.H. Digital repository of associations between environmental variables: A new resource to facilitate knowledge synthesis. Ecol. Indic. 2015, 53, 61–69. [Google Scholar] [CrossRef] [Green Version]
- OECD. OECD Key Environmental Indicators; Organisation for Economic Development and Cooperation: Paris, France, 2008. [Google Scholar]
- UNEP/WCMC. The 2010 Biodiversity Indicators and the Post-2010 Indicators Framework; United Nations Environmental Programme: Nairobi, Kenya, 2009. [Google Scholar]
- EEA. Halting the Loss of Biodiversity by 2010: Proposal for a First Set of Indicators to Monitor Progress in Europe; European Union European Environment Agency: Copenhage, Denmark, 2007. [Google Scholar]
- Brambila, A.; Flombaum, P. Comparison of environmental indicator sets using a unified indicator classification framework. Ecol. Indic. 2017, 83, 96–102. [Google Scholar] [CrossRef]
- Nardo, M.; Saisana, M.; Saltelli, A.; Tarantola, S.; Hoffman, A.; Giovannini, E. Handbook on Constructing Composite Indicators: Methodology and User Guide; OECD Statistics Working Paper, STD/DOC (2005)3; OECD: Paris, France, 2008. [Google Scholar] [CrossRef]
- Saisana, M.; Tarantola, S. State-of-the-art Report on Current Methodologies and Practices for Composite Indicator Development; EUR Report 20408 EN; European Commission, JRC, Institute for the Protection and Secutity of the Citizen: Ispra, Italy, 2002. [Google Scholar]
- Nardo, M.; Tarantola, S.; Saltelli, A.; Andropoulos, C.; Buescher, R.; Karageorgos, G.; Latvala, A.; Noel, F. The E-Business Readiness Composite Indicator for 2003: A Pilot Study; European Commission DG Joint Research Centre: Luxembourg, 2004. [Google Scholar]
- Annoni, P.; Kozovska, K.; EU. Regional Competitiveness Index 2010; EUR 24346 EN, JRC Scientific and Technical Reports; European Commission: Brussels, Belgium, 2010. [Google Scholar]
- Roca Zamora, A. How is Internal Market Integration Performing? In Trade and Foreign Direct Investment Indicators for Monitoring the State of the Economic Integration; European Commission Internal Market and Services DG: Brussels, Belgium, 2009. [Google Scholar]
- UN. Human Development Report 2001-Making New Technologies Work for Human Development; United Nations Development Programme: New York, NY, USA, 2001. [Google Scholar]
- European Commission-DG ECFIN. Business Climate Indicator for the Euro Area; European Commission: Brussels, Belgium, 2000. [Google Scholar]
- European Commission-DG ECFIN. Economic Sentiment Indicator; European Commission: Brussels, Belgium, 2004. [Google Scholar]
- European Commission-DG ENTR. European Innovation Scoreboard 2001; European Commission: Luxembourg, 2001. [Google Scholar]
- Lovell, C.A.K.; Pastor, J.T.; Turner, J.A. Measuring Macroeconomic Performance in the OECD: A comparison of European and non-European countries. Eur. J. Oper. Res. 1995, 87, 507–518. [Google Scholar] [CrossRef]
- Cribari-Neto, F.; Jensen, M.J.; Novo, A.A. Research in Econometric Theory: Quantitative and Qualitative Productivity Rankings. Econom. Theory 1999, 15, 719–752. [Google Scholar] [CrossRef] [Green Version]
- Huggins, R. Creating a UK Competitiveness Index: Regional and Local Benchmarking. Reg. Stud. 2003, 37, 89–96. [Google Scholar] [CrossRef]
- Grupp, H.; Mogee, M.E. Indicators for national science and technology policy: How robust are composite indicators? Res. Policy 2004, 33, 1373–1384. [Google Scholar] [CrossRef]
- Munda, G. Multiple Criteria Decision Analysis and Sustainable Development. In Multiple Criteria Decision Analysis. State of the Art Surveys; Figueira, J., Greco, S., Ehrgott, Y.M., Eds.; Springer International Series in Operations Research and Management Science: New York, NY, USA, 2005; pp. 953–986. [Google Scholar]
- Emerson, J.; Esty, D.C.; Levy, M.A.; Kim, C.; Mara, V. Environmental Performance Index. Yale Center for Environmental Law and Policy: New Haven, CT, USA, 2010. [Google Scholar]
- Kang, S.M. A sensitivity analysis of the Korean composite environmental index. Ecol. Econ. 2002, 43, 159–174. [Google Scholar] [CrossRef]
- Vilcek, J.; Bujnovský, R. Soil Environmental Index for Slovak Agricultural Land. Pedosphere 2013, 24, 137–144. [Google Scholar] [CrossRef]
- Panzone, L.A.; Wossink, A.; Southerton, D. The design of an environmental index of sustainable food consumption: A pilot study using supermarket data. Ecol. Econ. 2013, 94, 44–55. [Google Scholar] [CrossRef]
- Coelho, H.M.G.; Lange, L.C.; Coelho, L.M.G. Proposal of an environmental performance index to assess solid waste treatment technologies. Waste Manag. 2012, 32, 1473–1481. [Google Scholar] [CrossRef]
- Griliches, Z. Patent Statistics as Economic Indicators: A survey. J. Econ. Lit. 1990, 28, 1661–1707. [Google Scholar]
- Cox, D.R.; Fitzpatrick, R.; Fletcher, A.E.; Gore, S.M.; Spiegelhalter, D.J.; Jones, D.R. Quality-of-life Assessment: Can We Keep It Simple? J. R. Stat. Soc. 1992, 155, 353–393. [Google Scholar] [CrossRef] [Green Version]
- Färe, R.; Grosskopf, S.; Norris, M.; Zhang, Z. Productivity Growth, Technical Progress and Efficiency Change in Industrialised Countries. Am. Econ. Rev. 1994, 84, 66–83. [Google Scholar]
- Granger, C.W.J. Macroeconometrics-Past and future. J. Econom. 2001, 100, 17–19. [Google Scholar] [CrossRef]
- Bandura, R.; Martin, C. A Survey of Composite Indices Measuring Country Performance: 2006 Update; UNDP/ODS Working Paper; Office of Development Studies: New York, NY, USA, 2006. [Google Scholar]
- Joint Research Centre. An Information Server on Composite Indicators and Ranking Systems. Available online: https://composite-indicators.jrc.ec.europa.eu/ (accessed on 20 September 2020).
- Hsu, A.; Zomer, A. Environmental Performance Index; Yale University: New Haven, CT, USA, 2016. [Google Scholar]
- SOPAC; UNEP. Environmental Vulnerability Index: Description of Indicators; United Nations: New York, NY, USA, 2004. [Google Scholar]
- World Wildlife Foundation. The Living Planet Report 2012 Biodiversity, Biocapacity and Better Choices; World Wildlife Foundation: Gland, Switzerland, 2012. [Google Scholar]
- Lazarus, E.; Zokai, G.; Borucke, M.; Panda, D.; Iha, K.; Morales, J.C.; Wackernagel, M.; Galli, A.; Gupta, N. Working Guidebook to the National Footprint Accounts; Global Footprint Network: Oakland, CA, USA, 2014. [Google Scholar]
- Petit, C.C.; Lambin, E.F. Impact of data integration technique on historical land-use/land-cover change: Comparing historical maps with remote sensing data in the Belgian Ardennes. Landsc. Ecol. 2002, 17, 117–132. [Google Scholar] [CrossRef]
- Benini, L.; Bandini, V.; Marazza, D.; Contin, A. Assessment of land use changes through an indicator-based approach: A case study from the Lamone river basin in Northern Italy. Ecol. Indic. 2010, 10, 4–14. [Google Scholar] [CrossRef]
- DeFries, R.S.; Townshend, J.R.; Los, S.O. Scaling land cover heterogeneity for global atmosphere-biosphere models. In Scale in Remote Sensing and GIS; Quattricchi, D.A., Goodchild, M.F., Eds.; CRC Press: New York, NY, USA, 1997; pp. 231–246. [Google Scholar]
- Sala, O.E.; Chapin, F.S.; Armesto, J.J.; Berlow, E.; Bloomfield, J.; Dirzo, R.; Sanwald, E.H.; Huenneke, L.F.; Jackson, R.B.; Leemans, R.; et al. Biodiversity: Global biodiversity scenarios for the year 2100. Science 2000, 287, 1770–1774. [Google Scholar] [CrossRef] [PubMed]
- Reid, R.S.; Kruska, R.L.; Muthui, N.; Taye, A.; Wotton, S.; Wilson, C.J.; Mulatu, W. Land-use and land-cover dynamics in response to changes in climatic, biological and socio-political forces: The case of southwestern Ethiopia. Landsc. Ecol. 2000, 15, 339–355. [Google Scholar] [CrossRef]
- Wickham, J.D.; O’Neill, R.V.; Jones, K.B. A geography of ecosystem vulnerability. Landsc. Ecol. 2000, 15, 496–504. [Google Scholar] [CrossRef]
- Mattila, T.; Helin, T.; Antikainen, R. Land use indicators in life cycle assessment. Int. J. Life Cycle Assess. 2012, 17, 277–286. [Google Scholar] [CrossRef]
- De Laurentiis, V.; Secchi, M.; Bos, U.; Horn, R.; Laurent, A.; Sala, S. Soil quality index: Exploring options for a comprehensive assessment of land use impacts in LCA. J. Clean. Prod. 2019, 215, 63–74. [Google Scholar] [CrossRef] [PubMed]
- Milà i Canals, L.; Romanyà, J.; Cowell, S.J. Method for assessing impacts on life support functions (LSF) related to the use of ‘fertile land’ in Life Cycle Assessment (LCA). J. Clean. Prod. 2007, 15, 1426–1440. [Google Scholar] [CrossRef]
- Brandão, M.; Milà i Canals, L. Global characterisation factors to assess land use impacts on biotic production. Int. J. Life Cycle Assess. 2013, 18, 1243–1252. [Google Scholar] [CrossRef]
- Núñez, M.; Antón, A.; Muñoz, P.; Rieradevall, J. Inclusion of soil erosion impacts in life cycle assessment on a global scale: Application to energy crops in Spain. Int. J. Life Cycle Assess. 2013, 18, 755–767. [Google Scholar] [CrossRef]
- Bos, U.; Horn, R.; Beck, T.; Lindner, J.P.; Fischer, M. LANCA®-Characterisation Factors for Life Cycle Impact Assessment, Version 2.0.; Fraunhofer Verlag: Stuttgart, Germany, 2016. [Google Scholar]
- Jackson, B.; Pagella, T.; Sinclair, F.; Orellana, B.; Henshaw, A.; Reynolds, B.; Mcintyre, N.; Wheater, H.; Eycott, A. Polyscape: A GIS mapping framework providing efficient and spatially explicit landscape-scale valuation of multiple ecosystem services. Landsc. Urban Plan. 2013, 112, 74–88. [Google Scholar] [CrossRef]
- Manderson, A. Scoping a National Land-Use Intensity Indicator; Ministry for the Environment of New Zeland: Wellington, New Zealand, 2020. [Google Scholar]
- Martínez-Dueñas, W.A. INRA-Índice integrado relativo de antropización: Propuesta técnica-conceptual y aplicación. Rev. Inst. Investig. Trop. 2010, 5, 45–54. [Google Scholar]
- Reenberg, A.; Pedroli, B.; Rouncewell, M. The GLP mindset in action: New EU-FP7 project VOLANTE develops visions for future land use transitions in Europe. Newsl. Glob. L. Proj. Int. Proj. Off. 2011, 7, 17–20. [Google Scholar]
- López, S.; López-Sandoval, M.F.; Gerique, A.; Salazar, J. Landscape change in Southern Ecuador: An indicator-based and multi-temporal evaluation of land use and land cover in a mixed-use protected area. Ecol. Indic. 2020, 115, 106357. [Google Scholar] [CrossRef]
- Bicudo da Silva, R.F.; Millington, J.D.A.; Moran, E.F.; Batistella, M.; Liu, J. Three decades of land-use and land-cover change in mountain regions of the Brazilian Atlantic Forest. Landsc. Urban Plan. 2020, 204, 103948. [Google Scholar] [CrossRef]
- Jin, X.; Jin, Y.; Mao, X. Ecological risk assessment of cities on the Tibetan Plateau based on land use/land cover changes–Case study of Delingha City. Ecol. Indic. 2019, 101, 185–191. [Google Scholar] [CrossRef]
- Teucher, M.; Schmitt, C.B.; Wiese, A.; Apfelbeck, B.; Maghenda, M.; Pellikka, P.; Lens, L.; Habel, J.C. Behind the fog: Forest degradation despite logging bans in an East African cloud forest. Glob. Ecol. Conserv. 2020, 22, e01024. [Google Scholar] [CrossRef]
- Mubareka, S.; Ehrlich, D. Identifying and modelling environmental indicators for assessing population vulnerability to conflict using ground and satellite data. Ecol. Indic. 2010, 10, 493–503. [Google Scholar] [CrossRef]
- Rawat, J.S.; Kumar, M. Monitoring land use/cover change using remote sensing and GIS techniques: A case study of Hawalbagh block, district Almora, Uttarakhand, India. Egypt. J. Remote Sens. Space Sci. 2015, 18, 77–84. [Google Scholar] [CrossRef] [Green Version]
- Samuel, V.S.; Humberto, V.L.L.; Teresa, R.Z.M.; Isabel, C.L.M. Anthropization in the coastal zone associated with Mexican mangroves (2005–2015). Environ. Monit. Assess. 2019, 191. [Google Scholar] [CrossRef]
- de la Rosa, D.; van Diepen, C.A. Qualitative and quantitative land evaluations. In Land Use and Land Cover, in Encyclopedia of Life Support System (EOLSS-UNESCO); Eolss Publishers: Oxford, UK, 2002. [Google Scholar]
- Treitz, P.M.; Howarth, P.J.; Gong, P. Application of Satellite and GIS Technologies for Land-Cover and Land-Use Mapping at the Rural-Urban Fringe: A Case Study. Photogramm. Eng. Remote Sens. 1992, 58, 439–448. [Google Scholar]
- Cantarino Martí, I. Elaboración y validación de un modelo jerárquico derivado de SIOSE. Rev. Teledetección 1998, 39, 5–21. [Google Scholar]
- Equipo Técnico Nacional SIOSE. Descripción Del Modelo De Datos SIOSE-Versión 2. D.G; Instituto Geográfico Nacional: Madrid, Spain, 2015. [Google Scholar]
- Levy, J.K.; Hipel, K.W.; Kilgour, D.M. Using environmental indicators to quantify the robustness of policy alternatives to uncertainty. Ecol. Model. 2000, 130, 79–86. [Google Scholar] [CrossRef]
- Khan, I.; Kabir, Z. Waste-to-energy generation technologies and the developing economies: A multi-criteria analysis for sustainability assessment. Renew. Energy 2020, 150, 320–333. [Google Scholar] [CrossRef]
- Król-Badziak, A.; Pishgar-Komleh, S.H.; Rozakis, S.; Księżak, J. Environmental and socio-economic performance of different tillage systems in maize grain production: Application of Life Cycle Assessment and Multi-Criteria Decision Making. J. Clean. Prod. 2021, 278. [Google Scholar] [CrossRef]
- Bartzas, G.; Komnitsas, K. An integrated multi-criteria analysis for assessing sustainability of agricultural production at regional level. Inf. Process. Agric. 2020, 7, 223–232. [Google Scholar] [CrossRef]
- Yadegaridehkordi, E.; Hourmand, M.; Nilashi, M.; Alsolami, E.; Samad, S.; Mahmoud, M.; Alarood, A.A.; Zainol, A.; Majeed, H.D.; Shuib, L. Assessment of sustainability indicators for green building manufacturing using fuzzy multi-criteria decision making approach. J. Clean. Prod. 2020, 277, 122905. [Google Scholar] [CrossRef]
- Van Schoubroeck, S.; Springael, J.; Van Dael, M.; Malina, R.; Van Passel, S. Sustainability indicators for biobased chemicals: A Delphi study using Multi-Criteria Decision Analysis. Resour. Conserv. Recycl. 2019, 144, 198–208. [Google Scholar] [CrossRef]
- Hermann, B.G.; Kroeze, C.; Jawjit, W. Assessing environmental performance by combining life cycle assessment, multi-criteria analysis and environmental performance indicators. J. Clean. Prod. 2007, 15, 1787–1796. [Google Scholar] [CrossRef] [Green Version]
- Cámara de Comercio. La economía de la Comunidad Valenciana; Cámara Oficial de Comercio, Industria y Navegación de Valencia: Valencia, Spain, 2011. [Google Scholar]
- Hervás-Oliver, J.L.; Boronat-Moll, C.; Sempere-Ripoll, F.; Estellés-Miguel, S. Plan Sectorial de la Química, Plan Estratégico de la Industria Valenciana; Conselleria de Economía Sostenible, Sectores Productivos, Comercio y Trabajo, Dirección General de Industria y Energía, Generalitat Valenciana: Valencia, Spain, 2018. [Google Scholar]
- Rodrigo-Ilarri, J.; Romero-Hernández, C.; Rodrigo-Clavero, M.E.; Sánchez-González, J.M. A new methodology for the evaluation of the land use evolution near solid waste landfills using environmental indicators and GIS technologies. In Proceedings of the ISWA 2019 Conference, Bilbao, Spain, 7–9 October 2019; pp. 272–273. [Google Scholar]


| Advantages | Disadvantages |
|---|---|
|
|
| Code | Land Use Description | F1 | F2 | F3 | F4 | F5 | WEIk |
|---|---|---|---|---|---|---|---|
| EDF | Buildings | 20 | 40 | 20 | 15 | 5 | 20 |
| ZAU | Artificial green zone and Urban trees | 60 | 65 | 70 | 80 | 75 | 70 |
| LAA | Artificial water body | 65 | 85 | 85 | 65 | 50 | 70 |
| VAP | Road, Parking or Pedestrian area | 20 | 40 | 20 | 15 | 5 | 20 |
| OCT | Other constructions | 20 | 40 | 20 | 15 | 5 | 20 |
| SNE | Soil without edifications | 35 | 50 | 50 | 50 | 15 | 40 |
| ZEV | Extraction zones | 0 | 50 | 0 | 0 | 0 | 10 |
| CHA | Rice crops | 60 | 10 | 80 | 45 | 55 | 50 |
| CHL | Other crops different from rice | 60 | 65 | 80 | 75 | 70 | 70 |
| LFC | Citrics | 60 | 65 | 80 | 75 | 70 | 70 |
| LFN | Non citrics | 60 | 65 | 80 | 75 | 70 | 70 |
| LVI | Grapes | 60 | 65 | 80 | 75 | 70 | 70 |
| LOL | Olives | 60 | 65 | 80 | 75 | 70 | 70 |
| LOC | Other woody crops | 60 | 65 | 80 | 75 | 70 | 70 |
| PRD | Meadows | 80 | 80 | 90 | 100 | 100 | 90 |
| PST | Pastureland | 80 | 80 | 80 | 80 | 80 | 80 |
| FDC | Hardwood deciduous | 100 | 100 | 100 | 100 | 100 | 100 |
| FDP | Evergreen hardwoods | 100 | 100 | 100 | 100 | 100 | 100 |
| CNF | Conifers | 100 | 100 | 100 | 100 | 100 | 100 |
| MTR | Scrub | 70 | 70 | 70 | 70 | 70 | 70 |
| PDA | Sandy beaches | 100 | 100 | 50 | 100 | 100 | 90 |
| SDN | Bare soil | 70 | 50 | 20 | 20 | 40 | 40 |
| ZQM | Burned areas | 0 | 50 | 0 | 0 | 0 | 10 |
| RMB | Ravines | 20 | 50 | 20 | 50 | 60 | 40 |
| ACM | Marine cliffs | 100 | 50 | 50 | 100 | 100 | 80 |
| ARR | Rocky soil | 80 | 50 | 30 | 30 | 60 | 50 |
| CCH | Stone quarry | 80 | 50 | 40 | 40 | 40 | 50 |
| CLC | Lava flow | 90 | 30 | 30 | 40 | 60 | 50 |
| HPA | Marshes | 80 | 50 | 30 | 80 | 60 | 60 |
| HSA | Continental salines | 90 | 30 | 40 | 80 | 60 | 60 |
| HMA | Marshes | 90 | 60 | 70 | 90 | 90 | 80 |
| HSM | Marine salines | 90 | 60 | 70 | 90 | 90 | 80 |
| ACU | Water flows | 100 | 100 | 100 | 100 | 100 | 100 |
| ALG | Lakes and lagoons | 100 | 100 | 100 | 100 | 100 | 100 |
| AEM | Dams and artificial lakes | 10 | 100 | 100 | 100 | 90 | 80 |
| ALC | Coastal lagoons | 100 | 100 | 100 | 100 | 100 | 100 |
| AMO | Seas and Oceans | 100 | 100 | 100 | 100 | 100 | 100 |
| Non predefined | 50 | 50 | 50 | 50 | 50 | 50 | |
| OVD | Olives and grapes | 60 | 65 | 80 | 75 | 70 | 70 |
| AAR | Residential agricultural settlement | 40 | 50 | 60 | 50 | 50 | 50 |
| UER | Family orchard | 60 | 65 | 75 | 70 | 80 | 70 |
| UCS | Urban center | 30 | 30 | 10 | 20 | 10 | 20 |
| UEN | Urban expansion area | 30 | 30 | 10 | 20 | 10 | 20 |
| UDS | Discontinous | 30 | 30 | 10 | 20 | 10 | 20 |
| IPO | Well sorted industrial area | 30 | 30 | 10 | 20 | 10 | 20 |
| IPS | Non sorted industrial area | 30 | 30 | 10 | 20 | 10 | 20 |
| IAS | Isolated industrial area | 30 | 30 | 10 | 20 | 10 | 20 |
| PAG | Agricultural, livestock | 60 | 60 | 70 | 50 | 60 | 60 |
| PFT | Primary forest | 100 | 100 | 100 | 100 | 100 | 100 |
| PMX | Extractive Mining | 10 | 10 | 10 | 10 | 10 | 10 |
| PPS | Fish farm | 30 | 60 | 60 | 50 | 50 | 50 |
| TCO | Commercial and offices | 20 | 20 | 20 | 20 | 20 | 20 |
| TCH | Hotels | 20 | 20 | 20 | 20 | 20 | 20 |
| TPR | Recreational park | 20 | 20 | 20 | 20 | 20 | 20 |
| TCG | Camping | 20 | 40 | 40 | 50 | 50 | 40 |
| EAI | Institutional administrative | 20 | 20 | 20 | 20 | 20 | 20 |
| ESN | Medical and sanitary | 20 | 20 | 20 | 20 | 20 | 20 |
| ECM | Cementery | 20 | 20 | 20 | 20 | 20 | 20 |
| EDU | Education | 20 | 20 | 20 | 20 | 20 | 20 |
| EPN | Penitentiary | 20 | 20 | 20 | 20 | 20 | 20 |
| ERG | Religious | 20 | 20 | 20 | 20 | 20 | 20 |
| ECL | Cultural | 20 | 20 | 20 | 20 | 20 | 20 |
| EDP | Sport | 25 | 15 | 20 | 20 | 20 | 20 |
| ECG | Golf course | 40 | 10 | 70 | 50 | 80 | 50 |
| EPU | Urban park | 60 | 65 | 70 | 80 | 75 | 70 |
| NRV | Streets and roads | 10 | 10 | 10 | 10 | 10 | 10 |
| NRF | Train | 10 | 10 | 10 | 10 | 10 | 10 |
| NPO | Port | 10 | 10 | 10 | 10 | 10 | 10 |
| NAP | Airport | 10 | 10 | 10 | 10 | 10 | 10 |
| NEO | Eolic plant | 10 | 10 | 10 | 100 | 20 | 30 |
| NSL | Solar plant | 10 | 10 | 10 | 100 | 20 | 30 |
| NCL | Nuclear plant | 0 | 0 | 0 | 0 | 0 | 0 |
| NEL | Electric plant | 0 | 0 | 0 | 0 | 0 | 0 |
| NTM | Thermal plant | 0 | 0 | 0 | 0 | 0 | 0 |
| NHD | Hydroelectric plant | 10 | 10 | 10 | 10 | 10 | 10 |
| NTC | Telecommunications plant | 0 | 0 | 0 | 0 | 0 | 0 |
| NDP | Waste and drinking water plant | 10 | 20 | 10 | 100 | 10 | 30 |
| NCC | Channels | 0 | 0 | 0 | 0 | 0 | 0 |
| NDS | Desalinization plant | 0 | 0 | 0 | 0 | 0 | 0 |
| NVE | Landfills | 0 | 0 | 0 | 0 | 0 | 0 |
| NPT | Treatment plant | 0 | 0 | 0 | 0 | 0 | 0 |
| UEN | Urban expansion area | 30 | 30 | 10 | 20 | 10 | 20 |
| UDS | Discontinous | 30 | 30 | 10 | 20 | 10 | 20 |
| IPO | Well sorted industrial area | 30 | 30 | 10 | 20 | 10 | 20 |
| IPS | Non sorted industrial area | 30 | 30 | 10 | 20 | 10 | 20 |
| IAS | Isolated industrial area | 30 | 30 | 10 | 20 | 10 | 20 |
| PAG | Agricultural, livestock | 60 | 60 | 70 | 50 | 60 | 60 |
| PFT | Primary forest | 100 | 100 | 100 | 100 | 100 | 100 |
| PMX | Extractive mining | 10 | 10 | 10 | 10 | 10 | 10 |
| WEI Range | Environmental Value |
|---|---|
| Low | |
| Medium | |
| High |
| WEI | Absolute Frequency (Number of Polygons) | Class Area (Has) | Class Area (%) | ||||||
|---|---|---|---|---|---|---|---|---|---|
| 2005 | 2009 | 2015 | 2005 | 2009 | 2015 | 2005 | 2009 | 2015 | |
| [0,10[ | 0 | 0 | 0 | 0.00 | 0.00 | 0.00 | 0.00% | 0.00% | 0.00% |
| [10,20[ | 6 | 11 | 7 | 29.86 | 202.28 | 159.77 | 0.31% | 2.12% | 1.68% |
| [20,30[ | 38 | 39 | 39 | 676.94 | 565.99 | 567.12 | 7.11% | 5.94% | 5.96% |
| [30,40[ | 20 | 23 | 25 | 129.38 | 136.45 | 160.58 | 1.36% | 1.43% | 1.69% |
| [40,50[ | 36 | 32 | 31 | 310.85 | 213.98 | 220.96 | 3.26% | 2.25% | 2.32% |
| [50,60[ | 20 | 20 | 16 | 53.15 | 114.38 | 85.15 | 0.56% | 1.20% | 0.89% |
| [60,70[ | 47 | 50 | 56 | 302.21 | 313.94 | 442.93 | 3.17% | 3.30% | 4.65% |
| [70,80[ | 417 | 417 | 421 | 3762.61 | 3732.63 | 3992.15 | 39.51% | 39.20% | 41.92% |
| [80,90[ | 202 | 200 | 201 | 2846.46 | 2822.30 | 2558.72 | 29.89% | 29.64% | 26.87% |
| [90,100] | 113 | 117 | 116 | 1411.71 | 1421.22 | 1335.81 | 14.82% | 14.92% | 14.03% |
| Total | 899 | 909 | 912 | 9523.18 | 9523.18 | 9523.18 | 100% | 100% | 100% |
| WEI | Class Area (%) | Differences (%) | ||||
|---|---|---|---|---|---|---|
| 2005 | 2009 | 2015 | 2009–2005 | 2015–2009 | 2015–2005 | |
| [0,10[ | 0.00% | 0.00% | 0.00% | 0.00% | 0.00% | 0.00% |
| [10,20[ | 0.31% | 2.12% | 1.68% | 1.81% | −0.45% | 1.36% |
| [20,30[ | 7.11% | 5.94% | 5.96% | −1.17% | 0.01% | −1.15% |
| [30,40[ | 1.36% | 1.43% | 1.69% | 0.07% | 0.25% | 0.33% |
| [40,50[ | 3.26% | 2.25% | 2.32% | −1.02% | 0.07% | −0.94% |
| [50,60[ | 0.56% | 1.20% | 0.89% | 0.64% | −0.31% | 0.34% |
| [60,70[ | 3.17% | 3.30% | 4.65% | 0.12% | 1.35% | 1.48% |
| [70,80[ | 39.51% | 39.20% | 41.92% | −0.31% | 2.73% | 2.41% |
| [80,90[ | 29.89% | 29.64% | 26.87% | −0.25% | −2.77% | −3.02% |
| [90,100] | 14.82% | 14.92% | 14.03% | 0.10% | −0.90% | −0.80% |
Publisher’s Note: MDPI stays neutral with regard to jurisdictional claims in published maps and institutional affiliations. |
© 2020 by the authors. Licensee MDPI, Basel, Switzerland. This article is an open access article distributed under the terms and conditions of the Creative Commons Attribution (CC BY) license (http://creativecommons.org/licenses/by/4.0/).
Share and Cite
Rodrigo-Ilarri, J.; Romero, C.P.; Rodrigo-Clavero, M.-E. Land Use/Land Cover Assessment over Time Using a New Weighted Environmental Index (WEI) Based on an Object-Oriented Model and GIS Data. Sustainability 2020, 12, 10234. https://doi.org/10.3390/su122410234
Rodrigo-Ilarri J, Romero CP, Rodrigo-Clavero M-E. Land Use/Land Cover Assessment over Time Using a New Weighted Environmental Index (WEI) Based on an Object-Oriented Model and GIS Data. Sustainability. 2020; 12(24):10234. https://doi.org/10.3390/su122410234
Chicago/Turabian StyleRodrigo-Ilarri, Javier, Claudia P. Romero, and María-Elena Rodrigo-Clavero. 2020. "Land Use/Land Cover Assessment over Time Using a New Weighted Environmental Index (WEI) Based on an Object-Oriented Model and GIS Data" Sustainability 12, no. 24: 10234. https://doi.org/10.3390/su122410234